Article

Network Alignment across Social Networks Using Multiple Embedding Techniques

1
Faculty of Information Technology, Ton Duc Thang University, Ho Chi Minh City 700000, Vietnam
2
Faculty of Electrical Engineering and Computer Science, VŠB-Technical University of Ostrava, 708 33 Ostrava, Czech Republic
3
Faculty of Economics, Ho Chi Minh City University of Technology and Education, Ho Chi Minh City 700000, Vietnam
4
Faculty of Information Technology, Ho Chi Minh City University of Food Industry, Ho Chi Minh City 700000, Vietnam
5
Faculty of Mechanical-Electrical and Computer Engineering, School of Engineering and Technology, Van Lang University, Ho Chi Minh City 700000, Vietnam
*
Author to whom correspondence should be addressed.
Mathematics 2022, 10(21), 3972; https://doi.org/10.3390/math10213972
Submission received: 21 September 2022 / Revised: 11 October 2022 / Accepted: 17 October 2022 / Published: 26 October 2022
(This article belongs to the Special Issue Complex Network Modeling: Theory and Applications)

Abstract

:
Network alignment, which is also known as user identity linkage, is a kind of network analysis task that predicts overlapping users between two different social networks. This research direction has attracted much attention from the research community, and it is considered to be one of the most important research directions in the field of social network analysis. There are many different models for finding users that overlap between two networks, but most of these models use separate and different techniques to solve prediction problems, with very little work that has combined them. In this paper, we propose a method that combines different embedding techniques to solve the network alignment problem. Each association network alignment technique has its advantages and disadvantages, so combining them together will take full advantage and can overcome those disadvantages. Our model combines three-level embedding techniques of text-based user attributes, a graph attention network, a graph-drawing embedding technique, and fuzzy c-mean clustering to embed each piece of network information into a low-dimensional representation. We then project them into a common space by using canonical correlation analysis and compute the similarity matrix between them to make predictions. We tested our network alignment model on two real-life datasets, and the experimental results showed that our method can considerably improve the accuracy by about 10–15% compared to the baseline models. In addition, when experimenting with different ratios of training data, our proposed model could also handle the over-fitting problem effectively.

1. Introduction

The first online social networking service appeared in 1995 with the introduction of the Classmate page, which had the purpose of connecting classmates, followed by the appearance of SixDegrees in 1997, which had the purpose of allowing people to make friends based on interests. Currently, technology is becoming more and more developed, so many social networking sites have also been born, such as Facebook, Instagram, Tiktok, etc. Social networks help people eliminate all geographical distance. Users can post and share statuses, update their profiles, and interact with others, and there are many other utilities for selling goods and making money effectively. Due to the explosion in the number of online social networks, as well as the enormous benefits that they bring, social networks have recently become ubiquitous in our daily social lives. There is much research that has explored hidden information in such complex social networks, such as network representation learning [1,2,3], community detection [4,5], node classification [6,7], recommendation systems [8,9], link prediction [1,10,11], etc., with the diversity and extensive popularity of various social networks, such as Facebook, Instagram, Twitter, etc. Currently, each user can simultaneously join multiple social networks for many different purposes. They can update their daily status on Facebook, share their moments on Instagram, share their job status on LinkedIn, share their opinions/feelings on Twitter, etc. Network alignment, which uniquely identifies overlapping users on several social networks, has recently received increasing attention due to its benefits in downstream tasks.
Link prediction [12]: This is one of the most important research topics in information network analysis, and it involves predicting hidden/missing links between objects in a social network. In some cases, not all relations in information networks are observable, as they can be hidden by users to protect their personal privacy, or they can be missing due to errors made in crawling, storage, or transmission of network data. Thus, overlapping users in a secondary social network can be used in order to efficiently predict the missing features/links in primary network.
Node classification [6]: Real-life information networks often have a very large number of nodes. Labeling these nodes may take much time and effort, but sometimes does not bring much efficiency because of privacy issues, so it is difficult or impossible for one to label all nodes in information networks. For example, on social networks, many users do not provide their demographic information, such as their gender, interests, beliefs, etc., due to privacy concerns. In movie networks, a small fraction of movie genres would be labeled and the rest should be labeled automatically. Therefore, the label and connection structures of users who overlap on a secondary network can be used to efficiently infer the labels in the primary network.
Enhancing friend recommendation [13]: Overlapping users between two networks can be used in a friend recommendation system. For a person who used to participate in a social network X, if that person continues to participate in social network Y, then we can use the person’s friend information on social network X to be able to recommend friends to that person on social network Y.
Information diffusion [14]: Distribution of information has generally been considered on a separate social network. Usually, we will find influential spreaders in social networks and spread information from these users so that the information can spread quickly and widely. Simultaneously, spreading information on more than one social network will double the spread rate, as well as the desired amount of information. Taking advantage of the overlap of users between two networks will help spread information faster and more effectively than just spreading information on one network.
In most cases, if a person joins many different social networks, their personal information on each network, such as their username, date of birth, gender, and interests, will be the same. We can use this information to make predictions with relatively high accuracy. However, for privacy reasons, this information is difficult to collect, or, in the case of collection, the noise is quite high because it depends on the truthfulness of the user’s declarations of information on the different networks. Thus, network alignment, which is a task of finding overlapping users between two social networks, is a major challenge and has attracted much attention from the scientific community because of its applications.
In early studies, a naive method for aligning user identity between two networks was that of exploiting the similarities of users on their social networks by using self-reported user profiles and user-generated content [15,16,17,18,19,20], such as username, gender, etc. However, different online social networking sites have different structures and schemes for presenting user profiles, and for privacy reasons, they may also provide users with a setting that allows them to choose which information should be public and which should be private. Even if there are no differences in the profile schemes, users may not provide their profiles consistently on different social networks. This problem can lead to uncertainty, inconsistency, and ambiguity in the exploration of user profiles. Therefore, more modern methods have been proposed to solve the limitations of methods based on user profiles and user-generated content. Some methods [21,22,23,24,25] use network embedding techniques to separately learn the low-dimensional embedding of each vertex in source and target information networks by using the network topology. The authors of [26] used the graph attention network, a state-of-the-art graph neural network, to embed information from the network. These embeddings were then trained by a machine learning model by using known overlapping users to perform the alignment. However, there are many studies on the prediction of overlapping users to achieve a certain result. Most of these works used a single technique to perform the alignment, and very few works have performed alignment based on a combination of multiple techniques. Each network alignment technique has its own advantages and disadvantages; combining them will enhance their advantages and overcome their disadvantages. The MAUIL model [27] used a combination of different levels of embedding techniques to increase the accuracy of the network alignment algorithm. They combined three-level embedding techniques to extract attribute information and a one-level network embedding technique to preserve the network structure. This method achieved great results, which was demonstrated by the fact that the experimental results were much better than those of other solutions. However, it also exposed some limitations in terms of performance.
Inspired by the MAUIL model [27], in addition to graph attention neural network embedding [28], fuzzy c-mean clustering [29], and graph-drawing embedding using high-dimensional drawing [30], we propose a network alignment solution that combines multiple embedding techniques to improve the performance of this model. Similarly to the MAUIL model, we use a three-level embedding technique to extract features from text-based attribute information of the vertices in the network and then apply a correlation analysis technique (RCCA) to project the extracted features onto the same representation space. However, unlike in the MAUIL model, we use some more advanced embedding techniques, such as the graph attention network, graph-drawing embedding technique, and fuzzy c-mean clustering embedding technique to preserve more information about the local perspective, high-order perspective, and global perspective of the network. The benefits of each component embedding technique that we use in this study will be analyzed in more detail in the experimental section. The following is a summary of our contributions.
  • We propose a network alignment method by using a combination of multiple embedding techniques to improve the accuracy of the MAUIL model. Our method substitutes the embedding of the network structure in MAUIL with a state-of-the-art graph attention network that assigns different attention coefficients for neighborhoods at the aggregation step. By using the GAT, the learned network representation quality can be extremely enhanced and converted into more predictive embedding spaces. Unlike the GAT-based model used in [26], in this study, we combine the GAT-based embedding technique with other embedding techniques to improve the predictive performance of the embeddings and increase the efficiency of the network alignment model.
  • We apply graph-drawing embedding techniques in order to embed each network in a representation space by using the known overlapping users between two networks as pivot vertices that represent the network in a common representation space without losing featured information on each network.
  • We also apply fuzzy c-mean clustering as an embedding method that preserves the information of the network community, and maximization preserves the original structure of the network.
The rest of this paper is arranged as follows. We review the related work in Section 2. We formulate the problem in Section 3. We propose our network alignment method in Section 4. We present the experimental results and the baselines in Section 5. Finally, we present the conclusions and future work in Section 6.

2. Related Work

Network alignment problems have many different methods that can be broken down into three different approaches.
Supervised approach: Almost all publications related to this approach solve the problem of network alignment by using pre-aligned data, as well as the attribute information and the structure of the network, to make predictions. A deep learning method called Learn2Link [16] was proposed, and it used a combination of text content, network structure, and profile names to address the problem of network alignment. The authors of [31] proposed an efficient two-stage algorithm called NR-GL, which was a unified framework for aggregating global and local features together in order to reconcile network alignment. The authors of [32] proposed a reinforcement learning model named RLINK to optimize the linkage strategy from a global perspective. This method transformed the network alignment problem into a sequence decision problem and made full use of both the social network structure and the pre-aligned identities to make predictions. The authors of [33] considered the network alignment problem as a classification problem using the ego networks of two users as input. This method used a graph neural network model (MEgo2Vec) to embed the network into a low-dimensional representation to align users across online social networks.
Unsupervised approach: This approach solves the problem of network alignment without using any pre-aligned data, and it only uses the attribute information and the structure of the network to make predictions, so it saves time and effort in collecting sufficient aligned users as the initial seed set. Following this strategy, the authors of [34] proposed an unsupervised program called “Friend Relationship-Based User Identification Algorithm without Prior Knowledge” (FRUI-P) using a Friend Feature Vector Model (FFVM), which utilizes the power of a random walk instead of the traditional Word2Vec method. The authors of [35] proposed a framework named REGAL that employed a low-rank matrix approximation of the alignment matrix using Cross-Network Matrix Factorization (xNetMF) to reduce the computational effort. The authors of [36] proposed a novel model for the UUIL problem, which minimized the Earth Mover’s Distance through two optimization methods: a generative adversarial network and an orthogonal matrix transformation model. The authors of [37] proposed a novel unsupervised network alignment named NWUIL that used a Gaussian distribution to embed each vertex in the network and to preserve both the network topological information and the uncertainties of vertex representation. The authors of [22] proposed a fully unsupervised network alignment framework named GAlign. This method used a graph convolutional neural network to learn how each vertex was embedded and to maintain a multi-order proximity in the network. It also used a data augmentation methodology and a refinement mechanism to make the model more adaptive in order to avoid noise.
Semi-supervised approach: This approach is a machine learning method that solves the disadvantages of supervised and unsupervised learning models by combining a small amount of labeled data with a large amount of unlabeled data during training. The authors of [38] proposed a semi-supervised learning framework named UMAH, which combinesd the network structure and user attributes to align overlapping users between social networks. The authors of [25] proposed a model named IONE, which used a unified optimization framework to solve the network embedding problem and the network alignment problem simultaneously. The authors of [39] proposed a framework named MFRep (Matrix-Factorization-Based Representation Learning) to align users and employers across heterogeneous networks using the network structure, user attributes, and employer property information.

3. Problem Formulation
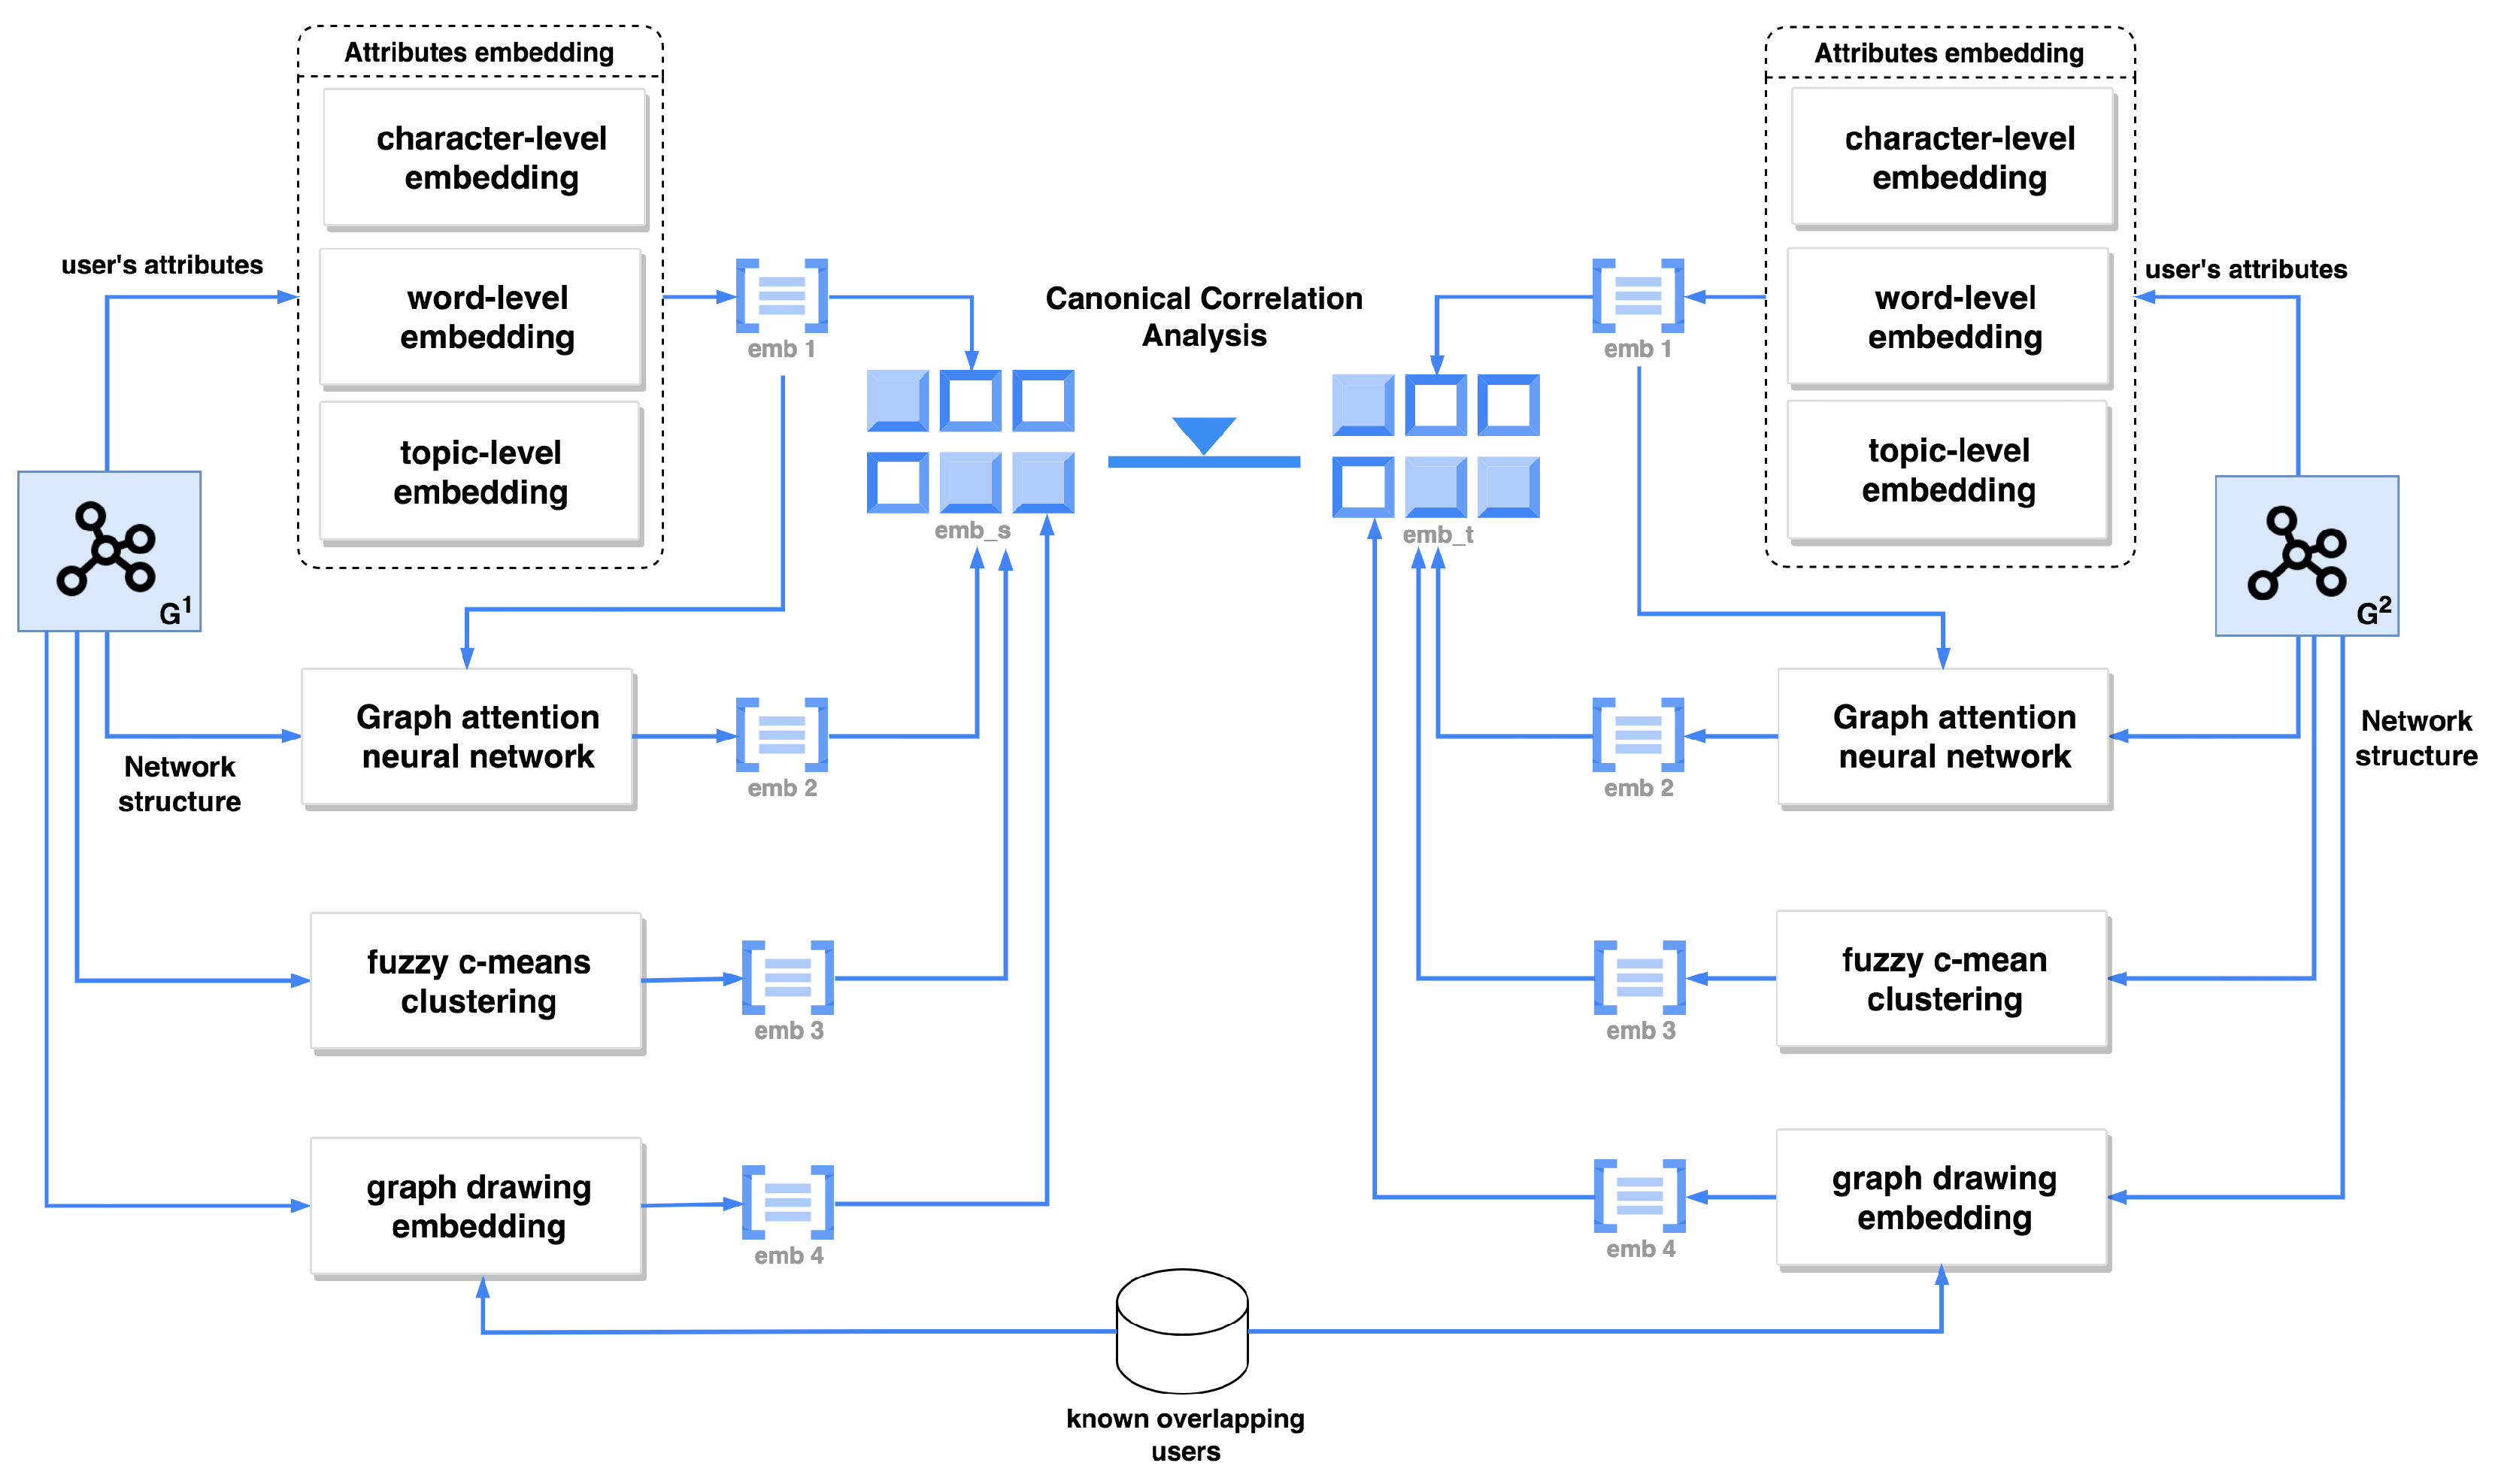
Assume that we have two distinct social networks denoted as G 1 ( V 1 , E 1 ) and G 2 ( V 2 , E 2 ) , in which V 1 = { v 1 1 , v 2 1 , , v m 1 } is a set of vertices of the network G 1 and E 1 = { u i j 1 } is the set of edges connecting the vertex i and the vertex j in the network G 1 . Similarly, V 2 = { v 1 2 , v 2 2 , , v n 2 } is the set of vertices of the network G 2 , and E 2 = { u i j 2 } is the set of edges that connect the i and j vertices in the network G 2 . A = { ( v i 1 , v j 2 ) } is a set of known overlapping vertices between two networks G 1 and G 2 in which v i 1 is a vertex belonging to G 1 and v j 2 is a vertex belonging to G 2 . The problem of network alignment between two social networks G 1 and G 2 is that of discovering a set of unknown overlapping vertices: A * = { x = ( v i 1 , v j 2 ) , x A } .
Figure 1 is a demonstration of network alignment between two networks G 1 and G 2 . The red lines connecting the vertex in G 1 to the vertex in G 2 are known overlapping vertices, and the red dashed lines connecting the vertex in G 1 to the vertex in G 2 are the unknown overlapping vertices that we need to align.

4. Proposed Method

Our proposed model contains four components (text-based attribute embedding, GAT-based embedding, graph-drawing embedding, fuzzy c-mean clustering embedding) to embed network information and one component (RCCA) for a correlation analysis that projects the embedding of each network into a common representation space. Figure 2 shows an overview of the framework of our model. In general, it can be divided into the following five steps:
  • First, we use a three-level text-based embedding component to embed user attributes, such as the author’s username, the author’s affiliation, and the author’s publications. This process will generate the features of the vertices that represent the user profiles and the user-generated content in each network.
  • Second, we feed the feature vector generated in the previous step and the network structure into the graph attention neural network to generate the second network embedding. This process takes advantage of the neighboring vertices in the aggregation step by assigning different attention coefficients to each neighbor.
  • Third, we use the network structure along with known overlapping users between two networks as the input for the graph-drawing embedding technique to generate the third network embedding. This process utilizes the known alignment to represent each vertex in the network by the anchor vertices. By representing every vertex in the network based on anchor vertices, two network representations can be aligned in a common space.
  • Fourth, we use fuzzy c-mean clustering to generate the fourth network embedding. This technique will enhance the embedding process by preserving the network community properties.
  • Finally, we project the embedding of two networks into a common embedding space using the canonical correlation analysis technique. Then, we calculate the similarity matrix between them using the distance between two vertices in the first and second networks.

4.1. Feature Extraction

In this study, we apply three different natural language processing techniques to embed information on user attributes. Each embedding technique will preserve the user attributes in different ways, so when they are combined, we will learn the final embedding of the user’s attributes that best represents the user’s features.

4.1.1. Character-Level Feature Extraction

This embedding approach is intended to extract the features of vertices at the character level by using similarities in usernames in the network. The character-level feature of user v i in a social network G with n users is denoted by a i c , and it may contain characters, spaces, and special symbols. We can represent the list of characters in the username using a series of m unique tokens t = t 1 , t 2 , t 3 , , t m . Then, we calculate the frequency of each unique token in the whole username: t = { t 1 : f r e q 1 , t 2 : f r e q 2 , t 3 : f r e q 3 , , t m : f r e q m } . This study constructs a count-weighted expression by performing a simple bag-of-words vectorization calculation. Finally, the corresponding count-weighted vector for user v i is x i c = [ f r e q t 1 , f r e q t 2 , , f r e q t p ] , where t i is the i t h character/token in the whole character dictionary, and f r e q t i is the frequency of the i t h character in the whole character dictionary that occurs in the username.
We apply the auto-encoder method to reduce the dimensions of the feature matrix for all vertices in each network X c = [ X 1 c , X 2 c , , X n c ] R n * d . This method employs a one-layer auto-encoder to embed the count-weighted vectors into distributed representations. After optimization, we obtain the feature matrix at the character level, P c = [ P 1 c , P 2 c , , P n c ] R n * d , where R n * d is the representation space of the original network and R n * d is the representation space of the extracted feature.

4.1.2. Word-Level Feature Extraction

The purpose of this embedding technique is to extract the features of the vertex at the word level by using similarities in phrases or short sentences, such as gender, locations, affiliations, and educational experiences. Many models have been developed to embed words into vectors; in this study, we use one of the most popular models, which is named word2vec [40], to convert text-format data into the vector format while preserving the initial features of the text. This is a two-layer neural network with only one hidden layer. It takes a large corpus as the input and generates a vector space, with each unique word in the corpus being associated with a corresponding vector in the embedding space. The basic idea of word2vec can be encapsulated in the following ideas: (i) Two words that appear in similar contexts are often close to each other; (ii) we can guess a word if we know the words surrounding it in a sentence.
P i w = ( 1 λ ) Z i + λ 1 | N i | j N i Z j
To enhance the context of words, as well as the correlations between words, we use Equation (1) to smooth the word2vec feature vector of each vertex with its neighbors. Here, λ [ 0 , 1 ] is a real number that balances the degree of importance between a vertex and its neighbors; Z i is the word2vec embedding vector of the i t h vertex, and N i are its neighbor vertices.

4.1.3. Topic-Level Feature Extraction

Topic modeling is a type of statistical modeling that helps to uncover hidden topics in datasets. There are two popular algorithms in topic modeling: Latent Dirichlet Allocation (LDA) [41] and Nonnegative Matrix Factorization (NMF) [42]. LDA is based on a probability distribution model, while NMF is based on a linear algebraic model. The mathematical foundations of the two algorithms (LDA and NMF) are different, but the end result is that both algorithms return documents belonging to a topic and words belonging to a topic in the corpus. In this research, we use Latent Dirichlet Allocation (LDA) [41], which is the most popular topic-modeling technique for discovering hidden topics in a given dataset. The input to the algorithm is a bag-of-words matrix (that is, each document is represented as a row, while each column is the number of words in the dictionary), which is generated by using long sentences or paragraphs, such as posts, blogs, and publications. The purpose of this method is to create two smaller matrices: one by document and one by topic. When we multiply the two matrices together, we get the bag-of-words matrix with the minimum error.
In this LDA process, we serve user-generated content as a document that may contain many words. Firstly, we clean, preprocess, and tokenize the user-generated content (data in the form of long sentences) into words. After preprocessing the documents, we get the following document–word matrix, as shown in Figure 3. Here, D i is the document-/topic-level attribute of the ith user, and W i is the ith word in a document. LDA decomposes this document–word matrix (bag-of-words matrix) into two other matrices: a document–topic matrix and topic–word matrix, as shown in Figure 3.

4.2. Graph Attention Network

We use the graph attention network [28], which is an improvement of the graph convolutional network (GCN) model, to extract hidden information from the structure and properties of the network. With the GCN, neighborhoods of a vertex have the same importance. Obviously, the importance should not be the same because some vertices are more important than others. Instead of treating the contributions of neighboring vertices as the same, the GAT assigns each neighbor a different attention coefficient. In the step of computing the hidden features in the next layer of a vertex, the features of its neighbors are aggregated according to the different attention coefficients assigned above. These attention coefficients will be learned and adjusted during the training process of the deep learning model. We also deploy a multi-head attention mechanism to improve the noise and stability of the prediction model.
e i , j = o T [ W x i | | W x j ]
First, we use the feature vector extracted from the previous step (as proposed in Section 4.1) as the input matrix for the first layer of the graph attention neural network. We feed the initial feature of vertex v i , which is denoted as x i , and the initial feature of its neighbors v j N i , which is denoted as x j , into the first layer of the attention network. We use Equation (2) to calculate the weight score e i , j between vertex v i and all of its neighbors v j , 1 j | N i | for the hidden layer. Here, W R D D is the projection matrix, o R 2 D are the model parameters that can be learned during the training process, D is the dimension of the vertex in the input layer, D is the dimension of the vertex in the hidden layer, and | | is a concatenate operation.
α i , j = e x p ( L e a k y R e L U ( e i , j ) ) t = 1 | N i | e x p ( L e a k y R e L U ( e i , t ) )
Then, we use a softmax function to normalize the weight scores between the vertex v i and its neighbor v j to calculate the normalized attention coefficient α i , j . In Equation (3), the numerator e x p ( L e a k y R e L U ( e i , j ) ) is the attention coefficient that vertex v j contributes to vertex v i ; then, it is normalized by a sum of the attention coefficient of all neighbor vertices v t , as in the denominator of Equation (3), to compute the normalized attention coefficient α i , j .
z i = σ ( 1 K k = 1 K j = 1 | N i | α i , j k W k x j )
Finally, we apply the multi-head attention mechanism to make the learning model more stable. We use Equation (4) to aggregate the feature vector for the next hidden layer of vertex v i . In this equation, K is the number of attention mechanisms and k [ 1 , K ] is the kth attention mechanism. Figure 4 is an illustration at the aggregation step of the graph attention neural network. The representation of vertex v 3 at the ( k + 1 ) th layer is computed based on the representation of itself and its neighbor vertices v 1 , v 2 , and v 4 at the kth layer with the different attention coefficient values of e 13 , e 23 , and e 43 . These attention coefficients could be learned during the training step of the graph neural network.

4.3. Fuzzy C-Mean Clustering Technique

The FCM method (fuzzy c-means) [29] is a fuzzy clustering algorithm based on the distance measure of the data objects in a cluster. This is a data-clustering technique in which a dataset is grouped into N clusters with all data points in the dataset belonging to every cluster to a certain degree. For example, a data point that lies close to the center of a cluster will have a high degree of membership in that cluster, and another data point that lies far away from the center of a cluster will have a low degree of membership to that cluster. The difference between c-means and k-means clustering is that in the case of k-means, each element is assigned to only a single cluster, while in the case ofcC-means, which is a fuzzy clustering technique, each element is assigned to all of the available clusters with a different degree of membership for each cluster.
The FCM method starts with a random initial guess for the cluster centers, that is, the mean location of each cluster. Next, it assigns a random membership score for each cluster to all data points. By iteratively updating the cluster centers and the membership grades for each data point, it moves the cluster centers to the correct location within a dataset, and, for each data point, it finds the degree of membership in each cluster. This iteration minimizes an objective function that represents the distance from any given data point to a cluster center weighted by the membership of that data point in the cluster.
After soft clustering of the vertices in the network into clusters with different degrees, we obtain a probability matrix with a number of columns corresponding to the number of clusters and a number of rows equivalent to the number of vertices in the network. The value in a cell in the matrix (intersection between rows and columns) represents the degree of dependency of a vertex on a cluster. We use this matrix as an embedding matrix for the vertices in the network; the number of dimensions of this matrix is equivalent to the number of clusters that we choose in the fuzzy c-mean clustering algorithm.

4.4. Graph-Drawing Embedding Technique

Taking the idea from graph drawing [30], a novel technique for drawing undirected graphs, we designed a method for embedding network information. This technique has two steps: First, it embeds the network with a very high dimension by using randomly pivoted vertices, and then it projects these embeddings into a low-dimensional space by using principal component analysis. Unlike the original graph-drawing technique, we use the known overlapping vertices between two networks in the training dataset as pivot vertices. The left vertices are embedded by using these pivot vertices.
Figure 5 shows an example of the graph-drawing technique used to find the low-dimensional representation of the two networks G 1 and G 2 . In this example, four pairs of vertices—( u 1 , v 2 ), ( u 4 , v 3 ), ( u 7 , v 7 ), and ( u 8 , v 6 )—are known overlapping vertices between two networks, and the dashed lines that connect them together are called anchor links. We use the anchor vertices u 1 , u 4 , u 7 , and u 7 as pivot vertices to embed all vertices in network G 1 by calculating the distance from a specific vertex to all pivots. Similarly, we use the anchor vertices v 2 , v 3 , v 6 , and v 7 as pivot vertices to embed all vertices in network G 2 by calculating the distance from a specific vertex to the pivots. Lastly, we obtain the representation matrix M 1 R m × | P | for G 1 and M 2 R n × | P | for G 2 . Here, m is the number of vertices in G 1 , n is the number of vertices in G 2 , and | P | is the number of known overlapping vertices between two networks in the training dataset.

4.5. Canonical Correlation Analysis

We concatenate four embeddings together— e m b 1 extracted from user attributes based on text, e m b 2 obtained from the GAT-based embedding technique, e m b 3 obtained from the fuzzy c-mean clustering embedding technique, and e m b 4 obtained from the graph-drawing embedding technique—to generate the final embeddings X R d × n for network G 1 and Y R d × m for network G 2 . Here, m is the number of vertices in G 1 , n is the number of vertices in G 2 , and d is the dimension of the output embedding after concatenation.
p = m a x c o r r ( h i T X , m j T Y ) = m a x h i T C X Y m j ( h i T C X X h i ) ( m j T C Y Y m j )
We project the concatenated embeddings X and Y into a common representation space by using a canonical correlation analysis technique. We apply Equation (5) to find two corresponding linear correlational projection matrices, H = [ h 1 ; h 2 ; ; h k ] R d × k and M = [ m 1 ; m 2 ; ; m k ] R d × k , which maximize the correlation between X and Y when projecting them into a common space. Here, H is the projection matrix for network G 1 , M is the projection matrix for network G 2 , and k is the dimension of the projected representation space. We calculate the canonical matrix of X by projecting it into the projection matrix H: Z X = H T X R k × n . Similarly, we calculate the canonical matrix of Y by projecting it into the projection matrix M: Z Y = M T Y R k × m . Finally, we calculate the similarity matrix between Z X and Z Y ; the pair of vertices between G 1 and G 2 that has a high similarity should form an anchor link.

5. Experiments

5.1. Datasets

We tested our network alignment model on two real-life datasets, which were the same as those used in [27]. Table 1 shows their statistics.
  • Weibo vs. Douban: This dataset was collected from two popular Chinese social networks, Weibo and Douban. First, the authors collected a list of seed users on the Douban network who had published their Weibo accounts on their profiles. These seed users on the Weibo platform and corresponding users on the Douban platform can be seen as known overlapping users between two networks in the alignment task. Second, the authors used these seed users to grow the network by crawling for user attributes, such as age, sex, address, friends, and posts.
  • DBLP17 vs. DBLP19. This dataset was collected from a computer science bibliography website. In this study, the authors collected two instances of the DBLP network in two different periods. The known overlapping users between two networks were determined from the authors who had the same identity in two different instances of a network.

5.2. Evaluation Metrics

In our experiments, we used Equation (7) to calculate the hit precision [15]. This measurement was used to evaluate the accuracy of the proposed model. It counted the number of correct alignments that appeared in the top k users.
h ( x ) = k ( h i t ( x ) 1 ) k ,
where h i t ( x ) , when calculated using Equation (6), is the correct position of a predicted user in the returned list of the top k candidates. Suppose that the ground truth of the network alignment is ( u 1 , v 5 ), where u 1 G 1 and v 5 G 2 , if the similarity scores of the vertex u 1 of G 1 compared to all vertices of G 2 are sorted from highest to lowest as v 3 , v 1 , v 6 , v 5 , v 2 , v 4 , v 7 . Then, h i t ( u 1 ) = 4 is the position of v 5 in the sorted list of similarity and h ( u 1 ) = k ( 4 1 ) k = k 3 k .
H i t - p r e c i s i o n = i = 1 n h ( x i )

5.3. Baselines

We compared the performance of our proposed model with the following recent network alignment models.
  • MAUIL [27] includes three components: multilevel attribute embedding (character-level, word-level, and topic-level), network embedding, and regularized canonical correlation analysis (RCCA)-based linear projection.
  • MAUIL+ [43] is an extension of the MAUIL model by substituting the LINE method [44] in MAUIL with the graph attention neural network. This method includes multilevel text-based embedding to extract user features, network structure embedding, graph attention neural network embedding, and regularized canonical correlation analysis to project the network embedding of each network into a common representation space.
  • Our model is an another extension of the MAUIL model that adds more embedding layers, including the graph attention neural network, graph-drawing embedding technique, and fuzzy c-mean clustering technique.

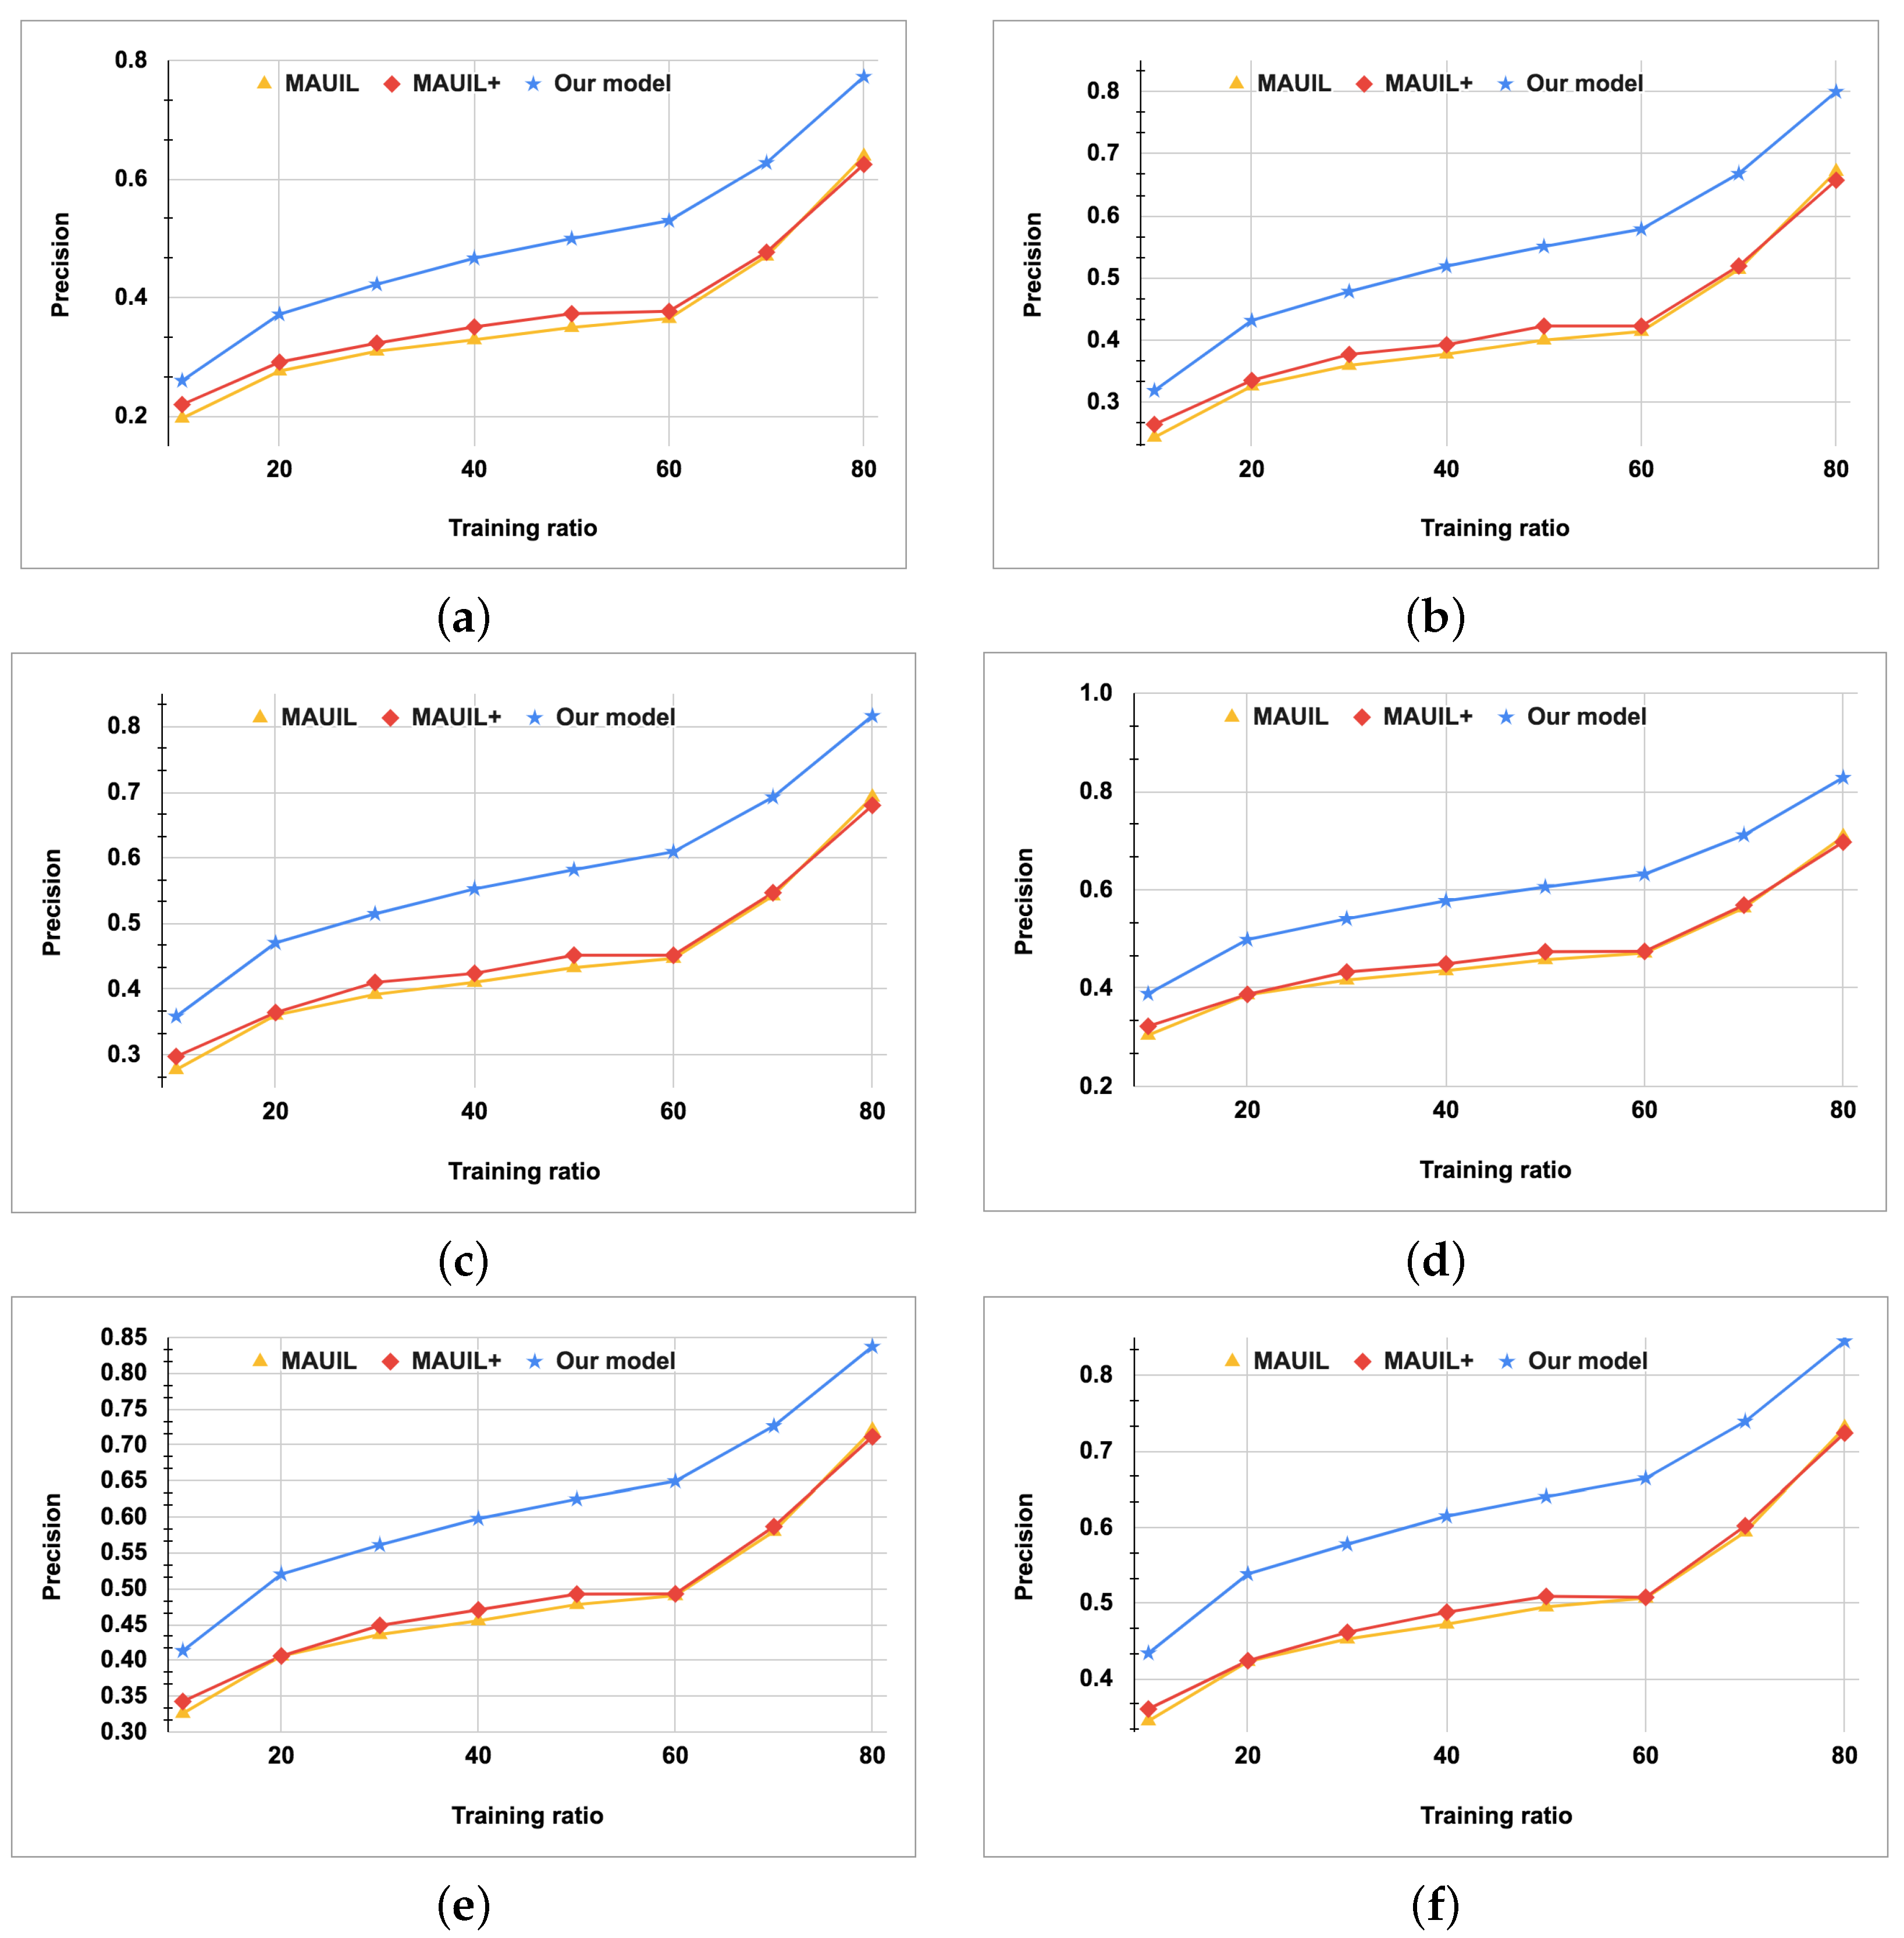
5.4. Performance Comparison

In our experiment, all parameter settings of the baseline models and our model were tuned to obtain the best performance of each model. In our model, we used the same D = 100 as the embedding dimension for each technique, and we used k = 80 as the number of canonical components and R = 1000 as the regulation for the RCCA module. For the GAT-based embedding technique, we built a two-hidden-layer graph neural network with D = 300 as the input layer dimension, D = 200 as the hidden layer dimension, and K = 8 as the number of heads in the multi-head attention mechanism.
Table 2 compares the results of the network alignment task between our model and the baseline models on two different datasets: DBLP17-DBLP19 and Weibo–Douban. We can observe that our model was persistently better by about 10–15% in comparison with all baseline methods with the two different datasets.
Performance at different training ratios: We also evaluated our method with different ratios of training and test data, which varied from 10% to 80%. Figure 6 and Figure 7 show that the Hit-precision@k measurement of our method was also better by about 10–15% in comparison with all baseline methods on both of the different datasets. In addition, our method was also better than the baseline methods in the case of handling the over-fitting problem. As we can see, the performance of the baseline models converged and was stable at the training ratio of 40%, which means that if we use more training data than this threshold to train these baseline models, then the results are not significantly improved or are even worse. However, our method had a better handling on this over-fitting problem; when using more training data, our method consistently gave better results that were proportional to the increase in training data.

5.5. Ablation Test

To clearly investigate the effect of each component of our model, we designed some variants of our model:
  • Our-1: We combined MAUIL with only GAT-based embedding.
  • Our-2: We combined MAUIL with only FCM embedding.
  • Our-3: We combined MAUIL with only graph-drawing embedding.
Table 3 presents the results of the ablation test on the hit-precision measurement. The ablation test shows that our original proposed model outperformed its variants, thus proving the power of our combination method in comparison with each single embedding technique in the network alignment task.
In more detail, our original proposed model performed considerably better than the individual embedding variants, Our-1, Our-2, and Our-3, which gave an explanation of the necessity of information fusion. The accuracy of the graph-drawing embedding technique in Our-3 gave the best results compared to all of the variants. This is easily explained because this embedding technique is based on anchor nodes, which causes the embedding space of the source and target networks to be naturally correlated and aligned. The accuracy of the fuzzy c-mean clustering embedding technique in Our-2 was poor, as it only captured the community membership of the vertices in this embedding; consequently, it was not easy to differentiate the vertices in the same cluster. However, when we combined MAUIL with fuzzy c-mean clustering embedding, we still obtained better results than those of the original MAUIL model that did not use fuzzy c-mean clustering. This shows that fuzzy c-mean clustering makes a contribution to the information enhancement of our model.

5.6. Discussion

As we saw in the comparison and evaluation of the experimental results in Section 5.4, our network alignment model gave 10–15% better results than those of the baseline models. In addition, when experimenting with different ratios of training data, our proposed model also handled the over-fitting problem effectively. In this section, we will analyze and evaluate the aspects that make our proposed model more effective than the baseline models.
  • Most network alignment models are based on representation learning. Generally speaking, it follows that a specific representation technique will be used to represent nodes in an information network. This technique must be optimized to preserve the maximum amount of information about the structure and properties of the network. The embeddings of these vertices are then trained by a machine learning model using known overlapping users as a training dataset to perform the alignment. Although there are many studies on the prediction of overlapping users and the achievement of a certain result, most of these works use a single representation learning technique to perform alignment, and there are very few works that have performed alignment based on a combination of multiple techniques. Each network embedding technique has its own advantages and disadvantages; our proposed method combines multiple embedding techniques to enhance their advantages and overcome their disadvantages. This combination makes our model achieve better results than those of the baseline models, as seen in the experimental section.
  • The role of the GAT-based embedding technique helps remarkably enhance the quality of the final network embedding and allows the refinement of more predictable embedding spaces for subsequent fine-tuning steps. The mechanism of multi-headed self-attention in the graph attention neural network causes the output embedding of our proposed model to be better at preserving both the local and high-order neighbor structure of the information network. Thus, it can achieve better prediction results in the network alignment task.
  • The role of graph drawing using a high-dimensional embedding technique helps the source and target to be represented in the same latent space by using anchor nodes/pivot nodes. By using graph-drawing embedding in our model, the quality of the generated embedding can emphasize the relationship between the source and target networks. Thus, it can achieve better prediction results in the network alignment task.
  • The fuzzy c-mean clustering embedding technique helps our model to be able to exploit the global community structure of each information network. If two corresponding vertices between two networks have a similar community structure, there is a higher probability that they will form an anchor link. Therefore, the global view of network vertices based on the community structure provides a valuable source of information for increasing the accuracy of the prediction results in the network alignment task.

6. Conclusions and Future Works

In this article, we researched and deployed multiple representation learning techniques to find and align the embedding of vertices on two different online social networks. We used a correlation analysis technique to project the learned representation into a common representation space. The purpose of this technique was to convert two individual embedding spaces into a common embedding space that we could compare with each other. We calculated the similarity scores between any two vertices in the source and target network in order to predict the missing overlapping users across two different social networks. Aside from the techniques used in the original MAUIL model, such as three-level text-based embedding, we used some other state-of-the-art techniques, such as the GAT-based embedding technique, the fuzzy c-mean clustering embedding technique, and the graph-drawing embedding technique. By using them in our model, the final embedding of the two networks had a strong correlation. We also tested our method on two real-life datasets, and the experimental results showed that our method was able to considerably improve the accuracy in comparison with the baseline models.
Future works: In spite of the fact that our network alignment had the best performance with the different datasets and different training/testing ratios, it still has some limitations that need to be addressed. First, most network alignment methods are applied on homogeneous social networks that contain only one type of vertex and one type of edge, but there is not much research on network alignment that is applied in heterogeneous social networks that contain multiple types of vertices and multiple types of edges. As such, we can extend this model to be more adaptive to heterogeneous social networks. Additionally, we could also enhance the scalability of the our method in order to evaluate it on large-scale datasets.

Author Contributions

Conceptualization, V.-V.L. and V.S.; Formal analysis, V.-V.L.; Investigation, V.-V.L. and T.K.T.; Methodology, V.-V.L., T.K.T., B.-N.T.N. and Q.-D.N.; Project administration, V.-V.L.; Resources, V.-V.L.; Software, V.-V.L.; Supervision, V.S.; Validation, V.S.; Writing—original draft, V.-V.L.; Writing—review and editing, V.-V.L., T.K.T., B.-N.T.N., Q.-D.N. and V.S. All authors have read and agreed to the published version of the manuscript.

Funding

This research was supported by Ton Duc Thang University (TDTU), Ho Chi Minh City University of Technology and Education (HCMUTE), Ho Chi Minh City University of Food Industry (HUFI), Van Lang University (VLU), and VŠB-Technical University of Ostrava (VŠB-TUO).

Institutional Review Board Statement

Not applicable.

Informed Consent Statement

Not applicable.

Data Availability Statement

The data presented in this study are available upon reasonable request from the corresponding author.

Acknowledgments

The authors would like to thank for the support from Ton Duc Thang University (TDTU), Ho Chi Minh University of Technology and Education, Ho Chi Minh City University of Food Industry (HUFI), Van Lang University (VLU), and VŠB-Technical University of Ostrava (VŠB-TUO).

Conflicts of Interest

The authors declare no conflict of interest. The funders had no role in the design of the study; in the collection, analyses, or interpretation of data; in the writing of the manuscript, or in the decision to publish the results.

Abbreviations

The following abbreviations are used in this manuscript:
LDALatent Dirichlet Allocation
GNNGraph Neural Network
GCNGraph Convolutional Network
GATGraph Attention Network
WDWeibo–Douban
CCACanonical Correlation Analysis
RCCARegularized Canonical Correlation Analysis
FCMFuzzy C-Mean Clustering

References

  1. Li, S.; Zhu, B.; Zhu, H.; Liu, F.; Zhang, Y.; Wang, R.; Lu, H. Heterogeneous Attention Concentration Link Prediction Algorithm for Attracting Customer Flow in Online Brand Community. IEEE Access 2022, 10, 20898–20912. [Google Scholar] [CrossRef]
  2. Zhang, C.; Song, D.; Huang, C.; Swami, A.; Chawla, N.V. Heterogeneous graph neural network. In Proceedings of the 25th ACM SIGKDD International Conference on Knowledge Discovery & Data Mining, Anchorage, AK, USA, 4–8 August 2019; pp. 793–803. [Google Scholar]
  3. Yang, C.; Zhang, J.; Han, J. Neural embedding propagation on heterogeneous networks. In Proceedings of the 2019 IEEE International Conference on Data Mining (ICDM), Beijing, China, 8–11 November 2019; pp. 698–707. [Google Scholar]
  4. Ohi, A.Q.; Mridha, M.F.; Safir, F.B.; Hamid, M.A.; Monowar, M.M. Autoembedder: A semi-supervised DNN embedding system for clustering. Knowl.-Based Syst. 2020, 204, 106190. [Google Scholar] [CrossRef]
  5. Le, V.; Snasel, V. Community detection in online social network using graph embedding and hierarchical clustering. In Proceedings of the International Conference on Intelligent Information Technologies for Industry; Springer: Cham, Switzerland, 2018; pp. 263–272. [Google Scholar]
  6. Sheikh, N.; Kefato, Z.T.; Montresor, A. Semi-supervised heterogeneous information network embedding for node classification using 1d-cnn. In Proceedings of the 2018 Fifth International Conference on Social Networks Analysis, Management and Security (SNAMS), Valencia, Spain, 15–18 October 2018; pp. 177–181. [Google Scholar]
  7. Li, B.; Pi, D.; Lin, Y. Learning ladder neural networks for semi-supervised node classification in social network. Expert Syst. Appl. 2021, 165, 113957. [Google Scholar] [CrossRef]
  8. Shi, C.; Hu, B.; Zhao, W.X.; Philip, S.Y. Heterogeneous information network embedding for recommendation. IEEE Trans. Knowl. Data Eng. 2018, 31, 357–370. [Google Scholar] [CrossRef] [Green Version]
  9. He, Y.; Zhang, Y.; Qi, L.; Yan, D.; He, Q. Outer product enhanced heterogeneous information network embedding for recommendation. Expert Syst. Appl. 2021, 169, 114359. [Google Scholar] [CrossRef]
  10. Carchiolo, V.; Cavallo, C.; Grassia, M.; Malgeri, M.; Mangioni, G. Link Prediction in Time Varying Social Networks. Information 2022, 13, 123. [Google Scholar] [CrossRef]
  11. Giubilei, R.; Brutti, P. Supervised Classification for Link Prediction in Facebook Ego Networks With Anonymized Profile Information. J. Classif. 2022, 39, 302–325. [Google Scholar] [CrossRef]
  12. Zhang, J.; Yu, P.S.; Zhou, Z.H. Meta-path based multi-network collective link prediction. In Proceedings of the 20th ACM SIGKDD International Conference on Knowledge Discovery and Data Mining, New York, NY, USA, 24–27 August 2014; pp. 1286–1295. [Google Scholar]
  13. Shu, K.; Wang, S.; Tang, J.; Zafarani, R.; Liu, H. User identity linkage across online social networks: A review. Acm Sigkdd Explor. Newsl. 2017, 18, 5–17. [Google Scholar] [CrossRef]
  14. Zafarani, R.; Liu, H. Users joining multiple sites: Distributions and patterns. In Proceedings of the International AAAI Conference on Web and Social Media, Ann Arbor, MI, USA, 1–4 June 2014; Volume 8, pp. 635–638. [Google Scholar]
  15. Mu, X.; Zhu, F.; Lim, E.P.; Xiao, J.; Wang, J.; Zhou, Z.H. User identity linkage by latent user space modelling. In Proceedings of the 22nd ACM SIGKDD International Conference on Knowledge Discovery and Data Mining, San Francisco, CA, USA, 13–17 August 2016; pp. 1775–1784. [Google Scholar]
  16. Hadgu, A.T.; Gundam, J.K.R. Learn2link: Linking the social and academic profiles of researchers. In Proceedings of the International AAAI Conference on Web and Social Media, Atlanta, GA, USA, 8–11 June 2020; Volume 14, pp. 240–249. [Google Scholar]
  17. Riederer, C.; Kim, Y.; Chaintreau, A.; Korula, N.; Lattanzi, S. Linking users across domains with location data: Theory and validation. In Proceedings of the 25th international Conference on World Wide Web, Montreal, QC, Canada, 11–15 April 2016; pp. 707–719. [Google Scholar]
  18. Vosecky, J.; Hong, D.; Shen, V.Y. User identification across multiple social networks. In Proceedings of the 2009 First International Conference on Networked Digital Technologies, Ostrava, Czech Republic, 28–31 July 2009; pp. 360–365. [Google Scholar]
  19. Liu, J.; Zhang, F.; Song, X.; Song, Y.I.; Lin, C.Y.; Hon, H.W. What’s in a name? An unsupervised approach to link users across communities. In Proceedings of the Sixth ACM international Conference on Web Search and Data Mining, Rome, Italy, 4–8 February 2013; pp. 495–504. [Google Scholar]
  20. Zafarani, R.; Liu, H. Connecting corresponding identities across communities. In Proceedings of the International AAAI Conference on Web and Social Media, San Jose, CA, USA, 17–20 May 2009; Volume 3, pp. 354–357. [Google Scholar]
  21. Li, X.; Shang, Y.; Cao, Y.; Li, Y.; Tan, J.; Liu, Y. Type-aware anchor link prediction across heterogeneous networks based on graph attention network. In Proceedings of the AAAI Conference on Artificial Intelligence, New York, NY, USA, 7–12 February 2020; Volume 34, pp. 147–155. [Google Scholar]
  22. Trung, H.T.; Van Vinh, T.; Tam, N.T.; Yin, H.; Weidlich, M.; Hung, N.Q.V. Adaptive network alignment with unsupervised and multi-order convolutional networks. In Proceedings of the 2020 IEEE 36th International Conference on Data Engineering (ICDE), Dallas, TX, USA, 20–24 April 2020; pp. 85–96. [Google Scholar]
  23. Man, T.; Shen, H.; Liu, S.; Jin, X.; Cheng, X. Predict anchor links across social networks via an embedding approach. Proc. IJCAI 2016, 16, 1823–1829. [Google Scholar]
  24. Lan, L.; Peng, H.; Tong, C.; Bai, X.; Dai, Q. Cross-Network Community Sensing for Anchor Link Prediction. In Proceedings of the 2021 International Joint Conference on Neural Networks (IJCNN), Shenzhen, China, 18–22 July 2021; pp. 1–8. [Google Scholar]
  25. Liu, L.; Cheung, W.K.; Li, X.; Liao, L. Aligning Users across Social Networks Using Network Embedding. Proc. IJCAI 2016, 16, 1774–1780. [Google Scholar]
  26. Chen, B.; Chen, X.; Lu, P.; Du, Y. CAREA: Cotraining Attribute and Relation Embeddings for Cross-Lingual Entity Alignment in Knowledge Graphs. Discret. Dyn. Nat. Soc. 2020, 2020, 6831603. [Google Scholar] [CrossRef]
  27. Chen, B.; Chen, X. MAUIL: Multilevel attribute embedding for semisupervised user identity linkage. Inf. Sci. 2022, 593, 527–545. [Google Scholar] [CrossRef]
  28. Velickovic, P.; Cucurull, G.; Casanova, A.; Romero, A.; Lio, P.; Bengio, Y. Graph attention networks. STAT 2017, 1050, 20. [Google Scholar]
  29. Bezdek, J.C.; Ehrlich, R.; Full, W. FCM: The fuzzy c-means clustering algorithm. Comput. Geosci. 1984, 10, 191–203. [Google Scholar] [CrossRef]
  30. Harel, D.; Koren, Y. Graph drawing by high-dimensional embedding. J. Graph Algorithms Appl. 2006, 8, 195–214. [Google Scholar] [CrossRef] [Green Version]
  31. Zhang, Z.; Gu, Q.; Yue, T.; Su, S. Identifying the same person across two similar social networks in a unified way: Globally and locally. Inf. Sci. 2017, 394, 53–67. [Google Scholar] [CrossRef]
  32. Li, X.; Cao, Y.; Li, Q.; Shang, Y.; Li, Y.; Liu, Y.; Xu, G. RLINK: Deep reinforcement learning for user identity linkage. World Wide Web 2021, 24, 85–103. [Google Scholar] [CrossRef]
  33. Zhang, J.; Chen, B.; Wang, X.; Chen, H.; Li, C.; Jin, F.; Song, G.; Zhang, Y. Mego2vec: Embedding matched ego networks for user alignment across social networks. In Proceedings of the 27th ACM International Conference on Information and Knowledge Management, Torino, Italy, 22–26 October 2018; pp. 327–336. [Google Scholar]
  34. Zhou, X.; Liang, X.; Du, X.; Zhao, J. Structure based user identification across social networks. IEEE Trans. Knowl. Data Eng. 2017, 30, 1178–1191. [Google Scholar] [CrossRef]
  35. Heimann, M.; Shen, H.; Safavi, T.; Koutra, D. Regal: Representation learning-based graph alignment. In Proceedings of the 27th ACM International Conference on Information and Knowledge Management, Torino, Italy, 22–26 October 2018; pp. 117–126. [Google Scholar]
  36. Li, C.; Wang, S.; Yu, P.S.; Zheng, L.; Zhang, X.; Li, Z.; Liang, Y. Distribution distance minimization for unsupervised user identity linkage. In Proceedings of the 27th ACM International Conference on Information and Knowledge Management, Torino, Italy, 22–26 October 2018; pp. 447–456. [Google Scholar]
  37. Zhou, F.; Wen, Z.; Zhong, T.; Trajcevski, G.; Xu, X.; Liu, L. Unsupervised user identity linkage via graph neural networks. In Proceedings of the GLOBECOM 2020—2020 IEEE Global Communications Conference, Taipei, Taiwan, 7–11 December 2020; pp. 1–6. [Google Scholar]
  38. Zhao, W.; Tan, S.; Guan, Z.; Zhang, B.; Gong, M.; Cao, Z.; Wang, Q. Learning to map social network users by unified manifold alignment on hypergraph. IEEE Trans. Neural Netw. Learn. Syst. 2018, 29, 5834–5846. [Google Scholar] [CrossRef]
  39. Liu, X.; Chen, Y.; Fu, J. MFRep: Joint user and employer alignment across heterogeneous social networks. Neurocomputing 2020, 414, 36–56. [Google Scholar] [CrossRef]
  40. Mikolov, T.; Chen, K.; Corrado, G.; Dean, J. Efficient estimation of word representations in vector space. arXiv 2013, arXiv:1301.3781. [Google Scholar]
  41. Kim, D.; Seo, D.; Cho, S.; Kang, P. Multi-co-training for document classification using various document representations: TF–IDF, LDA, and Doc2Vec. Inf. Sci. 2019, 477, 15–29. [Google Scholar] [CrossRef]
  42. Kuang, D.; Choo, J.; Park, H. Nonnegative matrix factorization for interactive topic modeling and document clustering. In Partitional Clustering Algorithms; Springer: Berlin/Heidelberg, Germany, 2015; pp. 215–243. [Google Scholar]
  43. Le, V.V.; Pham, P.N.H.; Toai, T.K.; Snasel, V. An approach of anchor link prediction using graph attention mechanism. Bull. Electr. Eng. Inf. 2022, 11, 2895–2902. [Google Scholar] [CrossRef]
  44. Tang, J.; Qu, M.; Wang, M.; Zhang, M.; Yan, J.; Mei, Q. Line: Large-scale information network embedding. In Proceedings of the 24th International Conference on World Wide Web, Florence Italy, 18–22 May 2015; pp. 1067–1077. [Google Scholar]
Figure 1. A demonstration of the network alignment problem.
Mathematics 10 03972 g001
Figure 2. Overview of the framework of our network alignment method.
Mathematics 10 03972 g002
Figure 3. An example of the LDA process.
Mathematics 10 03972 g003
Figure 4. An illustration at the aggregation step of the graph attention neural network.
Mathematics 10 03972 g004
Figure 5. An example of a graph-drawing technique.
Mathematics 10 03972 g005
Figure 6. Precision@K comparison on the DBLP dataset with different training ratios. (a) Precision@5, (b) Precision@10, (c) Precision@15, (d) Precision@20, (e) Precision@25, and (f) Precision@30.
Mathematics 10 03972 g006aMathematics 10 03972 g006b
Figure 7. Precision@K comparison on the Weibo–Douban dataset with different training ratios. (a) Precision@5, (b) Precision@10, (c) Precision@15, (d) Precision@20, (e) Precision@25, and (f) Precision@30.
Mathematics 10 03972 g007
Table 1. Statistics of the real-life datasets.
# of Vertices# of EdgesMin. DegreeMax. DegreeAvg. Degree# of Anchors
Weibo9714117,218260712.11397
Douban9526120,245260812.6
DBLP17908651,70021445.72832
DBLP19932547,77521385.1
Table 2. Comparison on hit precision with a training ratio of 30%.
MetricWeibo vs. DoubanDBLP-17 vs. DBLP-19
OurMAUIL+MAUILOurMAUIL+MAUIL
Hit-precision@10.32420.23800.23100.80000.77200.7510
Hit-precision@30.38610.29130.27970.84990.80600.7810
Hit-precision@50.42270.32360.30990.87350.82240.7970
Hit-precision@100.47840.37740.35970.90200.84120.8213
Hit-precision@150.51480.41040.39200.91720.85430.8324
Hit-precision@200.54110.43260.41630.92690.86360.8379
Hit-precision@250.56120.44880.43610.93420.86950.8413
Hit-precision@300.57790.46150.45270.93970.87470.8435
Table 3. Ablation test using a comparison of hit precision with a training ratio of 30%.
MetricWeibo vs. DoubanDBLP-17 vs. DBLP-19
OurOur-1Our-2Our-3OurOur 1Our 2Our 3
Hit-precision@10.32420.23800.23520.28350.80000.77200.76120.7861
Hit-precision@30.38610.29130.28670.34010.84990.80600.78910.8201
Hit-precision@50.42270.32360.31880.39230.87350.82240.80730.8470
Hit-precision@100.47840.37740.37050.43770.90200.84120.82750.8643
Hit-precision@150.51480.41040.40420.48040.91720.85430.83970.8739
Hit-precision@200.54110.43260.43010.50320.92690.86360.84900.8997
Hit-precision@250.56120.44880.44100.52360.93420.86950.85170.9131
Hit-precision@300.57790.46150.45870.53980.93970.87470.86030.9253
Publisher’s Note: MDPI stays neutral with regard to jurisdictional claims in published maps and institutional affiliations.

