
Improving the Efficiency of Electricity Consumption by Applying Real-Time Fuzzy and Fractional Control


Abstract
:1. Introduction
2. Materials and Methods
2.1. Electricity Consumption Monitoring Methods
2.2. Fractional Control
2.3. Fuzzy Control
Automatic Fuzzy Rule Definition
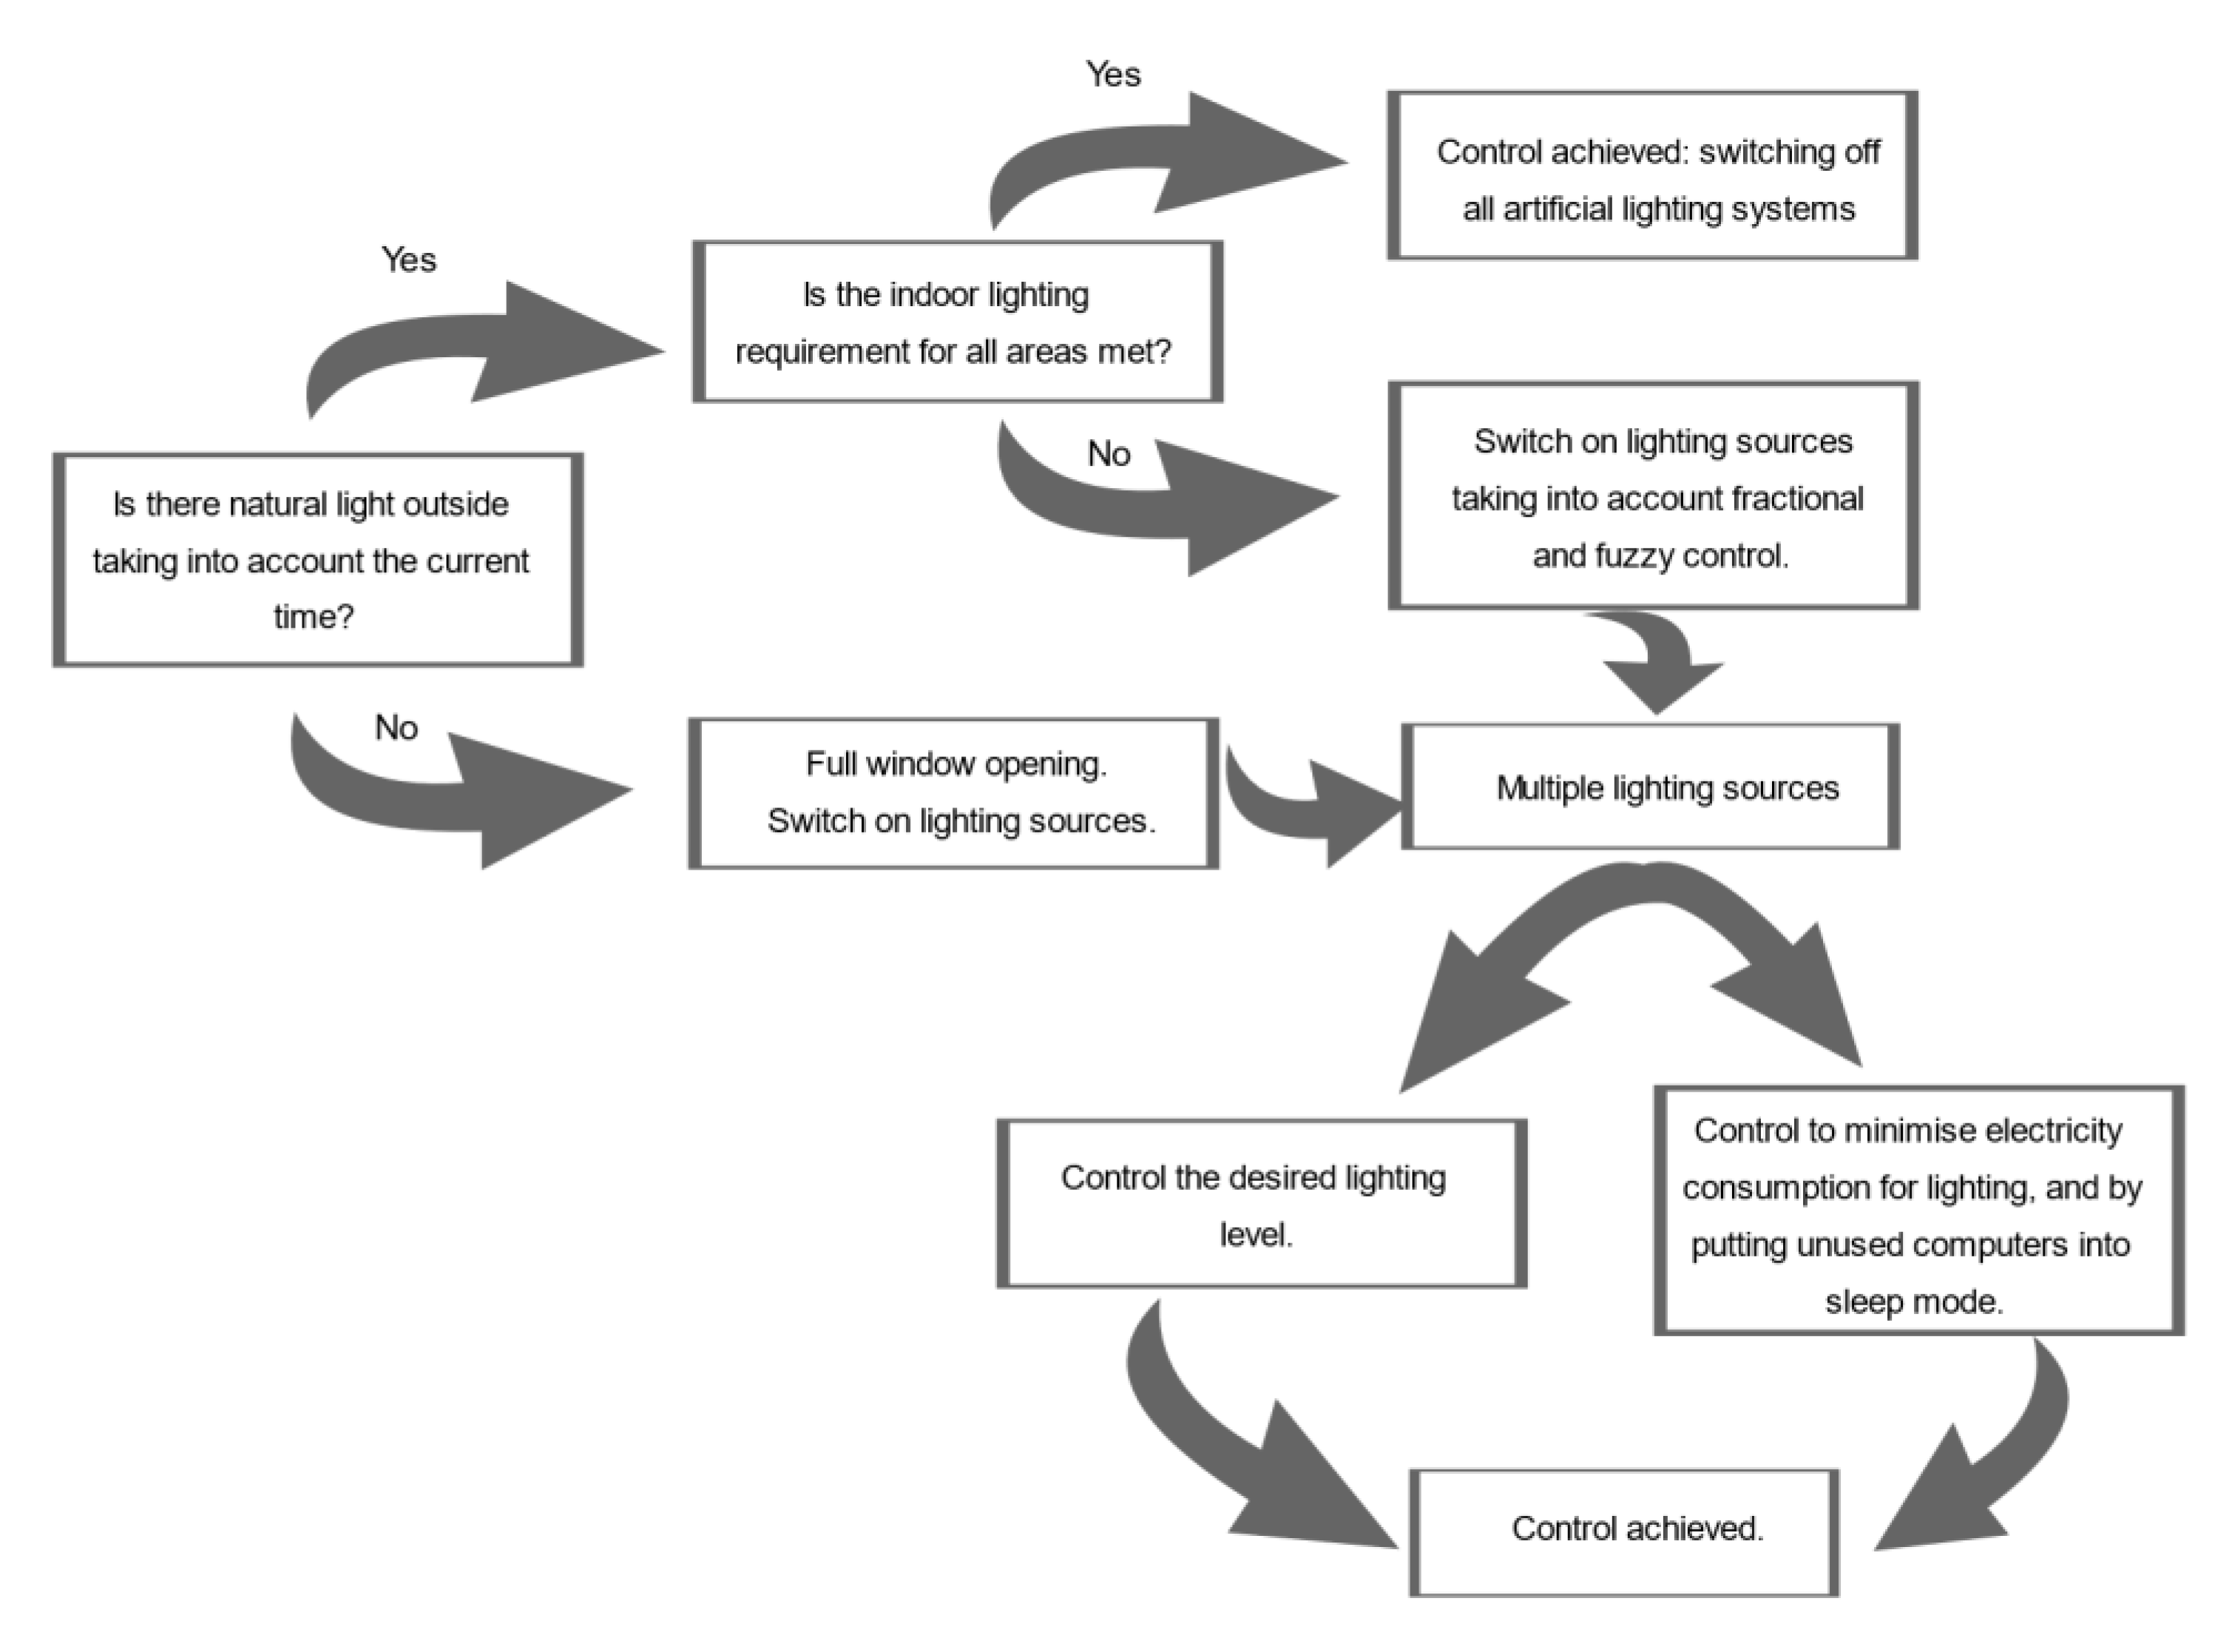
2.4. Combining Fuzzy and Fractional Control Methods
- C1—the standard fractional control: the partial switching off of the lighting sources;
- C2—the critical fractional control: a partial shutdown of the lighting sources and putting the unused computers to sleep;
- C3—the standard normal control: the complete shutdown of the lighting sources;
- C4—the critical normal control: the complete shutdown of the lighting sources and putting all of the computers in a sleep state.
3. Results
3.1. Performance of the Proposed Control
3.2. The Efficiency of the Clustering Method
4. Discussion
5. Conclusions
Author Contributions
Funding
Data Availability Statement
Conflicts of Interest
References
- European Commission. Quarterly Report on European Electricity Markets; European Commission: Brussels, Belgium, 2022; pp. 1–23. [Google Scholar]
- Breakdown of Renewable Energy Production. Available online: https://ourworldindata.org/energy-key-charts (accessed on 29 August 2022).
- Klingenberg, K. Passive House (Passivhaus); Springer: New York, NY, USA, 2013; pp. 426–436. [Google Scholar] [CrossRef]
- Energy Standards—Passive House Classic, Plus and Premium. Available online: https://passiv.de/en/03_certification/02_certification_buildings/08_energy_standards/08_energy_standards.html (accessed on 29 August 2022).
- Search Results for Articles on Passive House Control. Available online: https://scholar.google.com/scholar?hl=ro&as_sdt=0%2C5&as_ylo=2018&as_yhi=2022&q=passive+house+control (accessed on 30 August 2022).
- Benedetti, M.; Cesarotti, V.; Introna, V.; Serranti, J. Energy consumption control automation using Artificial Neural Networks and adaptive algorithms: Proposal of a new methodology and case study. Appl. Energy 2016, 165, 60–71. [Google Scholar] [CrossRef]
- Ma, K.; Hu, G.; Spanos, C.J. Distributed energy consumption control via real-time pricing feedback in smart grid. IEEE Trans. Control Syst. Technol. 2014, 22, 1907–1914. [Google Scholar] [CrossRef] [Green Version]
- Agarwal, R.P.; Baleanu, D.; Nieto, J.J.; Torres, D.F.M.; Zhou, Y. A survey on fuzzy fractional differential and optimal control nonlocal evolution equations. J. Comput. Appl. Math. 2018, 339, 3–29. [Google Scholar] [CrossRef] [Green Version]
- Patel, N.C.; Sahu, B.K.; Bagarty, D.P.; Das, P.; Debnath, M.K. A novel application of ALO-based fractional order fuzzy PID controller for AGC of power system with diverse sources of generation. Int. J. Electr. Eng. Educ. 2019, 58, 1–23. [Google Scholar] [CrossRef]
- Zafar, R.; Mahmood, A.; Razzaq, S.; Ali, W.; Naeem, U.; Shehzad, K. Prosumer based energy management and sharing in smart grid. Renew. Sustain. Energy Rev. 2018, 82, 1675–1684. [Google Scholar] [CrossRef]
- Matanov, N.; Zahov, A. Remote electricity metering systems. In Proceedings of the 11th Electrical Engineering Faculty Conference (BulEF), Varna, Bulgaria, 11–14 September 2019. [Google Scholar] [CrossRef]
- Khanji, S.; Iqbal, F.; Hung, P. ZigBee security vulnerabilities: Exploration and evaluating. In Proceedings of the 2019 10th International Conference on Information and Communication Systems (ICICS), Irbid, Jordan, 11–13 June 2019. [Google Scholar] [CrossRef]
- Pan, G.; He, J.; Wu, Q.; Fang, R.; Cao, J.; Liao, D. Automatic stabilization of Zigbee network. In Proceedings of the 2018 International Conference on Artificial Intelligence and Big Data (ICAIBD), Chengdu, China, 26–28 May 2018. [Google Scholar] [CrossRef]
- Li, Y.; Chi, Z.; Liu, X.; Zhu, T. Passive-ZigBee: Enabling ZigBee communication in IoT networks with 1000X+ less power consumption. In Proceedings of the 16th ACM Conference on Embedded Networked Sensor Systems, Shenzhen, China, 4–7 November 2018. [Google Scholar] [CrossRef]
- Srivatchan, N.S.; Rangarajan, P. A novel low-cost smart energy meter based on IoT for developing countries’ micro grids. Concurr. Comput. Pract. Exp. 2018, 32, e5042. [Google Scholar] [CrossRef]
- Pasricha, S.; Ayoub, R.; Kishinevsky, M.; Mandal, S.; Ogras, U. A survey on energy management for mobile and IoT devices. IEEE Des. Test 2020, 37, 7–24. [Google Scholar] [CrossRef]
- Ageed, Z.S.; Zeebaree, S.R.M.; Sadeeq, M.A.M.; Abdulrazzaq, M.B.; Salim, B.W.; Salih, A.A.; Yasin, H.M.; Ahmed, A.M. A state of art survey for intelligent energy monitoring systems. Asian J. Res. Comput. Sci. 2021, 8, 46–61. [Google Scholar] [CrossRef]
- Pan, Y.; Zhang, L. Data-driven estimation of building energy consumption with multi-source heterogeneous data. Appl. Energy 2020, 268, 114965. [Google Scholar] [CrossRef]
- Liu, T.; Tan, Z.; Xu, C.; Chen, H.; Li, Z. Study on deep reinforcement learning techniques for building energy consumption forecasting. Energy Build. 2020, 208, 109675. [Google Scholar] [CrossRef]
- Berciu, A.G.; Jurj, D.; Czumbil, L.; Micu, D.D.; Dulf, E.H. Energy Pulse—The efficient solution for monitoring electricity consumption from decentralized data sets. In Proceedings of the 9th International Conference on Modern Power Systems (MPS), Cluj-Napoca, Romania, 16–17 June 2021. [Google Scholar] [CrossRef]
- Dulf, E.H. Simplified fractional order controller design algorithm. Mathematics 2019, 7, 1166. [Google Scholar] [CrossRef] [Green Version]
- Yin, C.; Huang, X.; Dadras, S.; Cheng, Y.; Cao, J.; Malek, H.; Mei, J. Design of optimal lighting control strategy based on multi-variable fractional-order extremum seeking method. Inf. Sci. 2018, 465, 38–60. [Google Scholar] [CrossRef]
- Nguyen, A.T.; Taniguchi, T.; Eciolaza, L.; Campos, V.; Palhares, R.; Sugeno, M. Fuzzy control systems: Past, present and future. IEEE Comput. Intell. Mag. 2019, 14, 56–68. [Google Scholar] [CrossRef]
- Khalid, R.; Javaid, N.; Rahim, M.H.; Aslam, S.; Sher, A. Fuzzy energy management controller and scheduler for smart homes. Sustain. Comput. Inform. Syst. 2019, 21, 103–118. [Google Scholar] [CrossRef]
- Rodríguez, G.G.; Gonzalez-Cava, J.M.; Pérez, J.A.M. An intelligent decision support system for production planning based on machine learning. J. Intell. Manuf. 2020, 31, 1257–1273. [Google Scholar] [CrossRef]
- Neural Net Clustering. Available online: https://www.mathworks.com/help/deeplearning/ref/neuralnetclustering-app.html (accessed on 30 August 2022).
- Sikdar, P.L.; Thakurta, P.K.G. An energy efficient street lighting framework: ANN-based approach. Innov. Syst. Softw. Eng. 2021, 17, 131–139. [Google Scholar] [CrossRef]
- Ushakov, A.V.; Vasilyev, I. Near-optimal large-scale k-medoids clustering. Inf. Sci. 2021, 545, 344–362. [Google Scholar] [CrossRef]
- K-Medoids Clustering. Available online: https://www.mathworks.com/help/stats/kmedoids.html (accessed on 29 August 2022).
- Agostini, P.; Utkovski, Z.; Stańczak, S. Channel charting: An Euclidean distance matrix completion perspective. In Proceedings of the 2020 IEEE International Conference on Acoustics, Speech and Signal Processing (ICASSP), Barcelona, Spain, 4–8 May 2020. [Google Scholar] [CrossRef]
- Mitra, D.; Sarkar, P.; Roy, P. Face recognition by city-block distance classifier in supervised machine learning. Int. J. Res. Anal. Rev. 2019, 6, 185–190. [Google Scholar]
- Luo, C.; Zhan, J.; Xue, X.; Wang, L.; Ren, R.; Yang, Q. Cosine normalization: Using cosine similarity instead of dot product in neural networks. In Proceedings of the 27th International Conference on Artificial Neural Networks, Rhodes, Greece, 4–7 October 2018. [Google Scholar] [CrossRef] [Green Version]
- Ailon, N.; Charikar, M.; Newman, A. Aggregating inconsistent information: Ranking and clustering. In Proceedings of the 37th annual ACM symposium on Theory of Computing, Baltimore, MA, USA, 22–24 May 2004. [Google Scholar] [CrossRef]
- Hamming, R.W. Error detecting and error correcting codes. Bell Syst. Tech. J. 1950, 29, 147–160. [Google Scholar] [CrossRef]
- Litardo, J.; Palme, M.; Hidalgo-León, R.; Amoroso, F.; Soriano, G. Energy saving strategies and on-site power generation in a university building from a tropical climate. Appl. Sci. 2021, 11, 542. [Google Scholar] [CrossRef]
- Cretu, M.; Czumbil, L.; Bargauan, B.; Ceclan, A.; Berciu, A.G.; Polycarpou, A.; Rizzo, R.; Micu, D.D. Modelling and evaluation of the Baseline Energy Consumption and the Key Performance Indicators in Technical University of Cluj-Napoca buildings within a Demand Response programme: A case study. IET Renew. Power Gener. 2020, 14, 2864–2875. [Google Scholar] [CrossRef]
- Shakeri, M.; Shayestegan, M.; Reza, S.M.S.; Yahya, I.; Bais, B.; Akhtaruzzaman, M.; Sopian, K.; Amin, N. Implementation of a novel home energy management system (HEMS) architecture with solar photovoltaic system as supplementary source. Renew. Energy 2018, 125, 108–120. [Google Scholar] [CrossRef]


| Electricity Consumption | Electricity Price | Time of Day | Control Signal |
|---|---|---|---|
| Low | Low | Night | C1 |
| Low | Afternoon | C1 | |
| Low | Noon | C1 | |
| Standard | Night | C2 | |
| Standard | Afternoon | C1 | |
| Standard | Noon | C1 | |
| High | Night | C2 | |
| High | Afternoon | C2 | |
| High | Noon | C1 | |
| Average | Low | Night | C2 |
| Low | Afternoon | C2 | |
| Low | Noon | C2 | |
| Standard | Night | C3 | |
| Standard | Afternoon | C2 | |
| Standard | Noon | C2 | |
| High | Night | C3 | |
| High | Afternoon | C3 | |
| High | Noon | C2 | |
| High | Low | Night | C3 |
| Low | Afternoon | C3 | |
| Low | Noon | C3 | |
| Standard | Night | C4 | |
| Standard | Afternoon | C3 | |
| Standard | Noon | C3 | |
| High | Night | C4 | |
| High | Afternoon | C4 | |
| High | Noon | C3 |
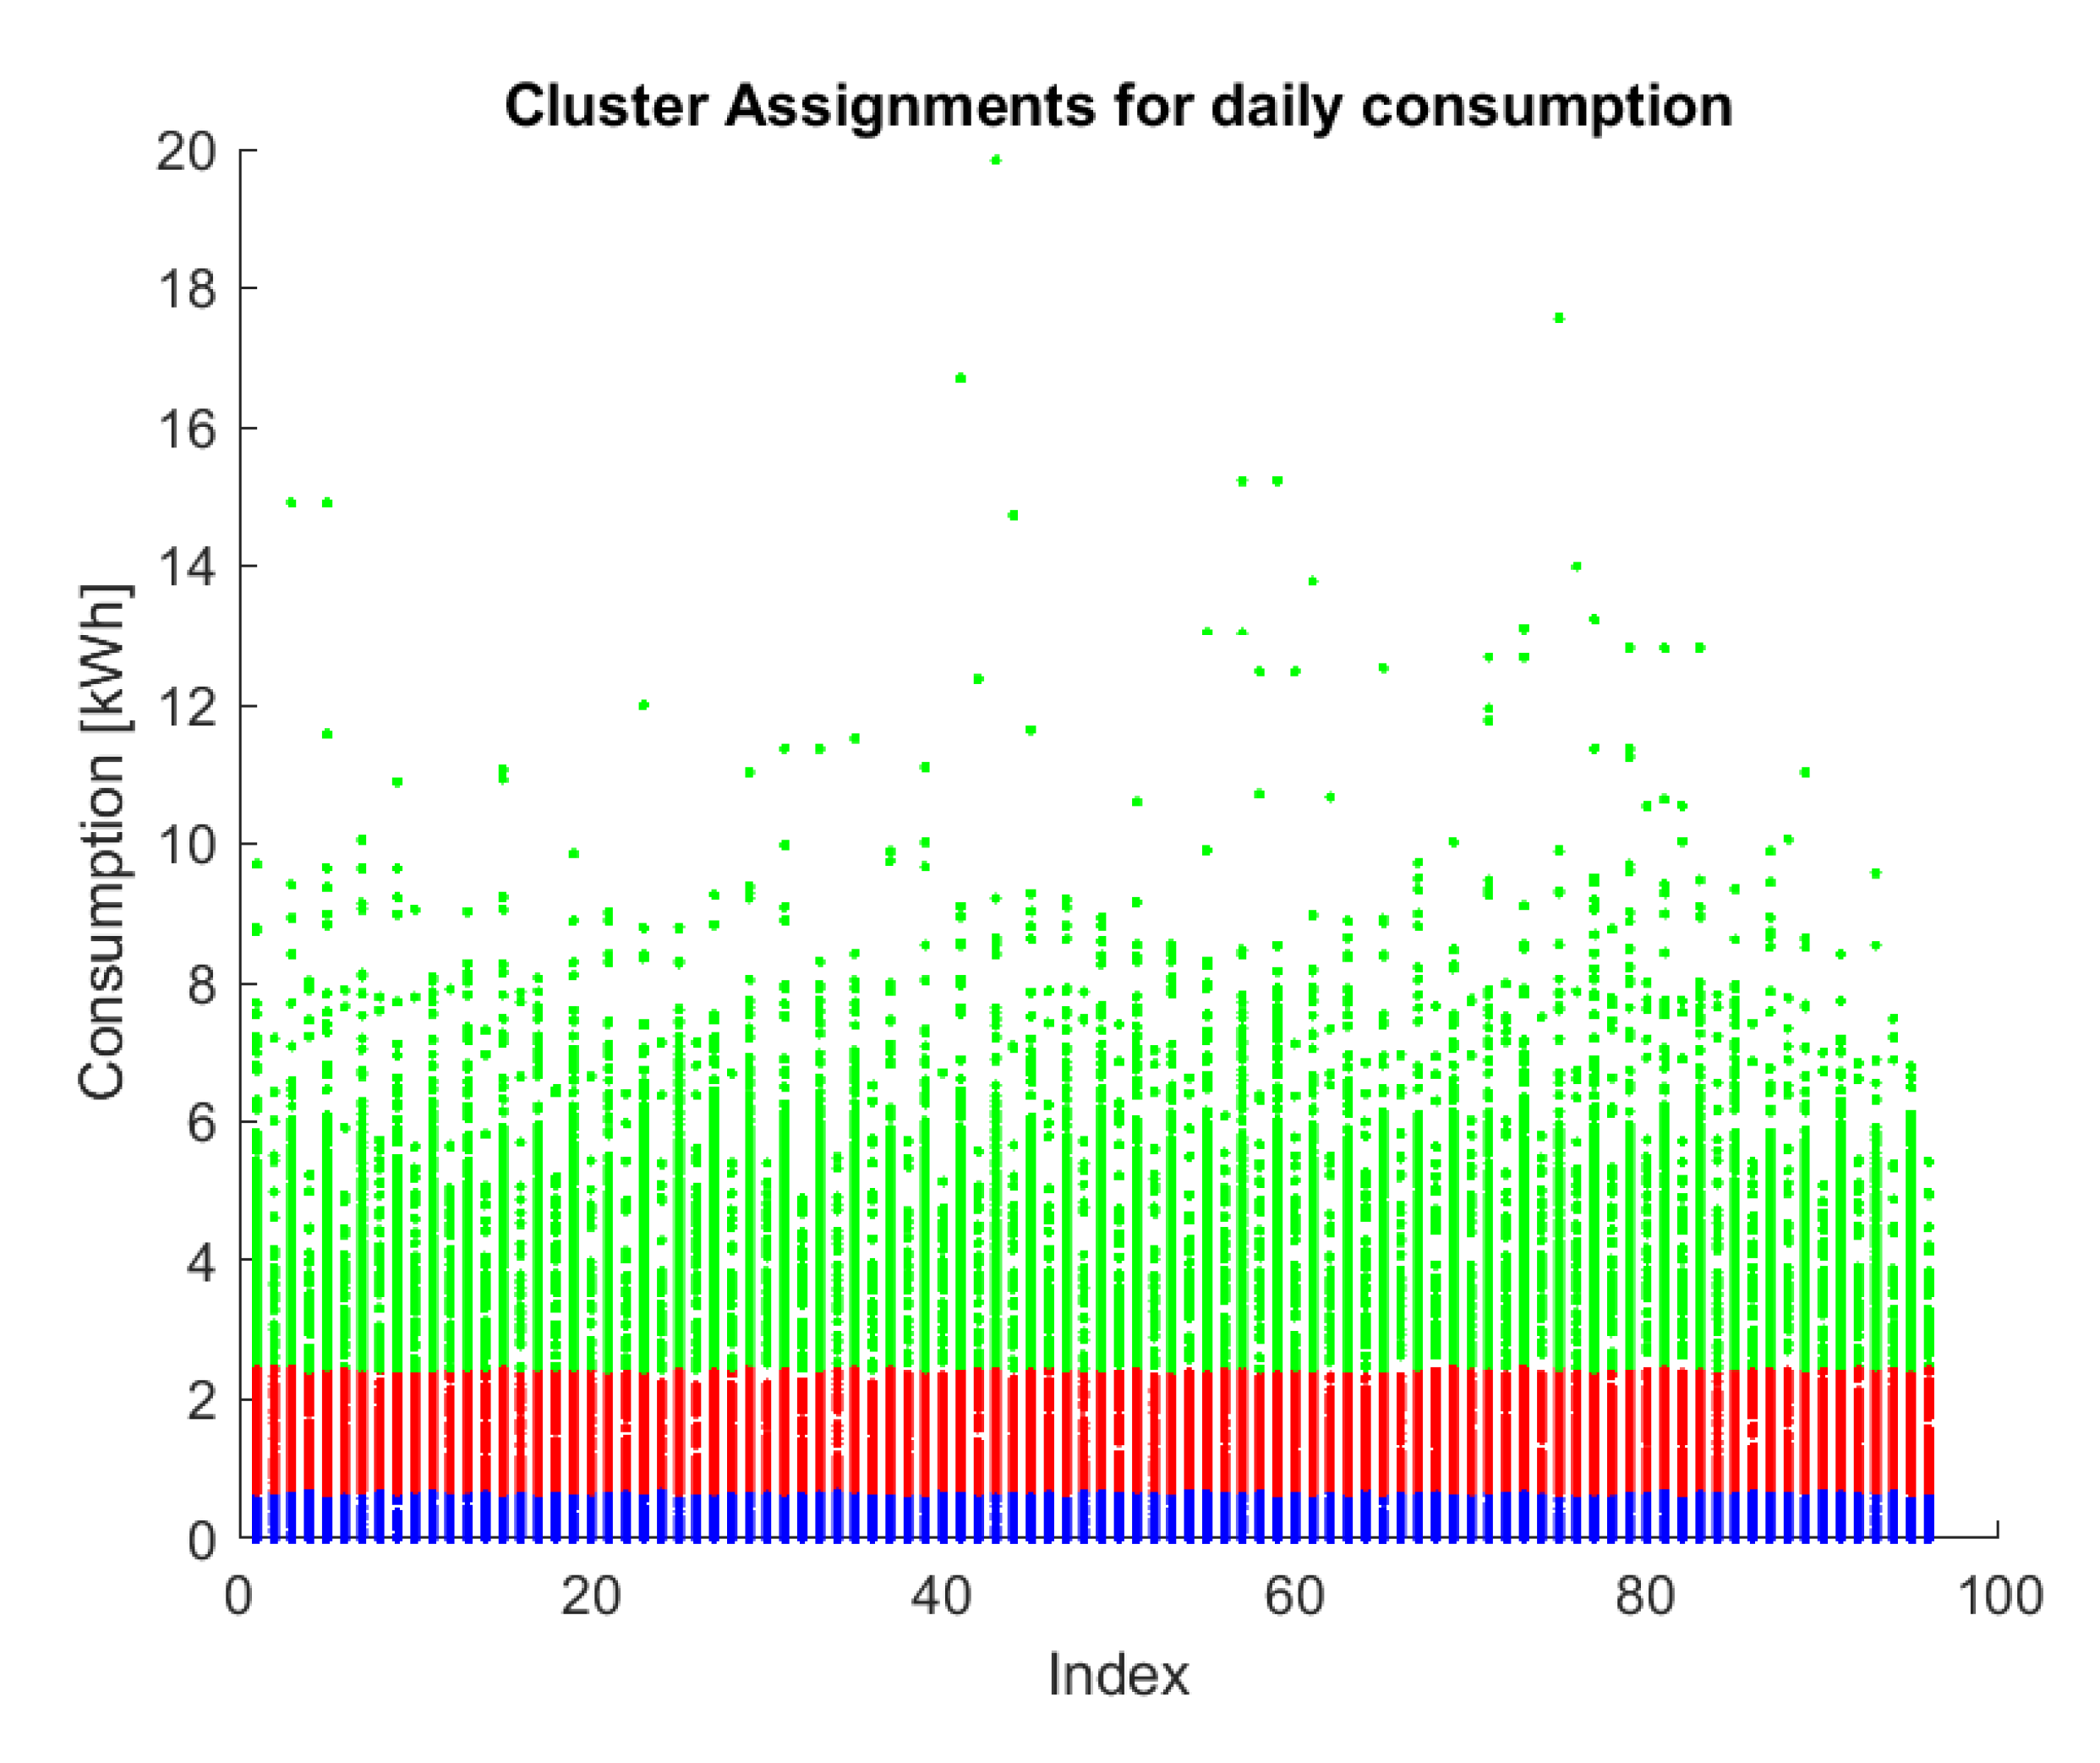
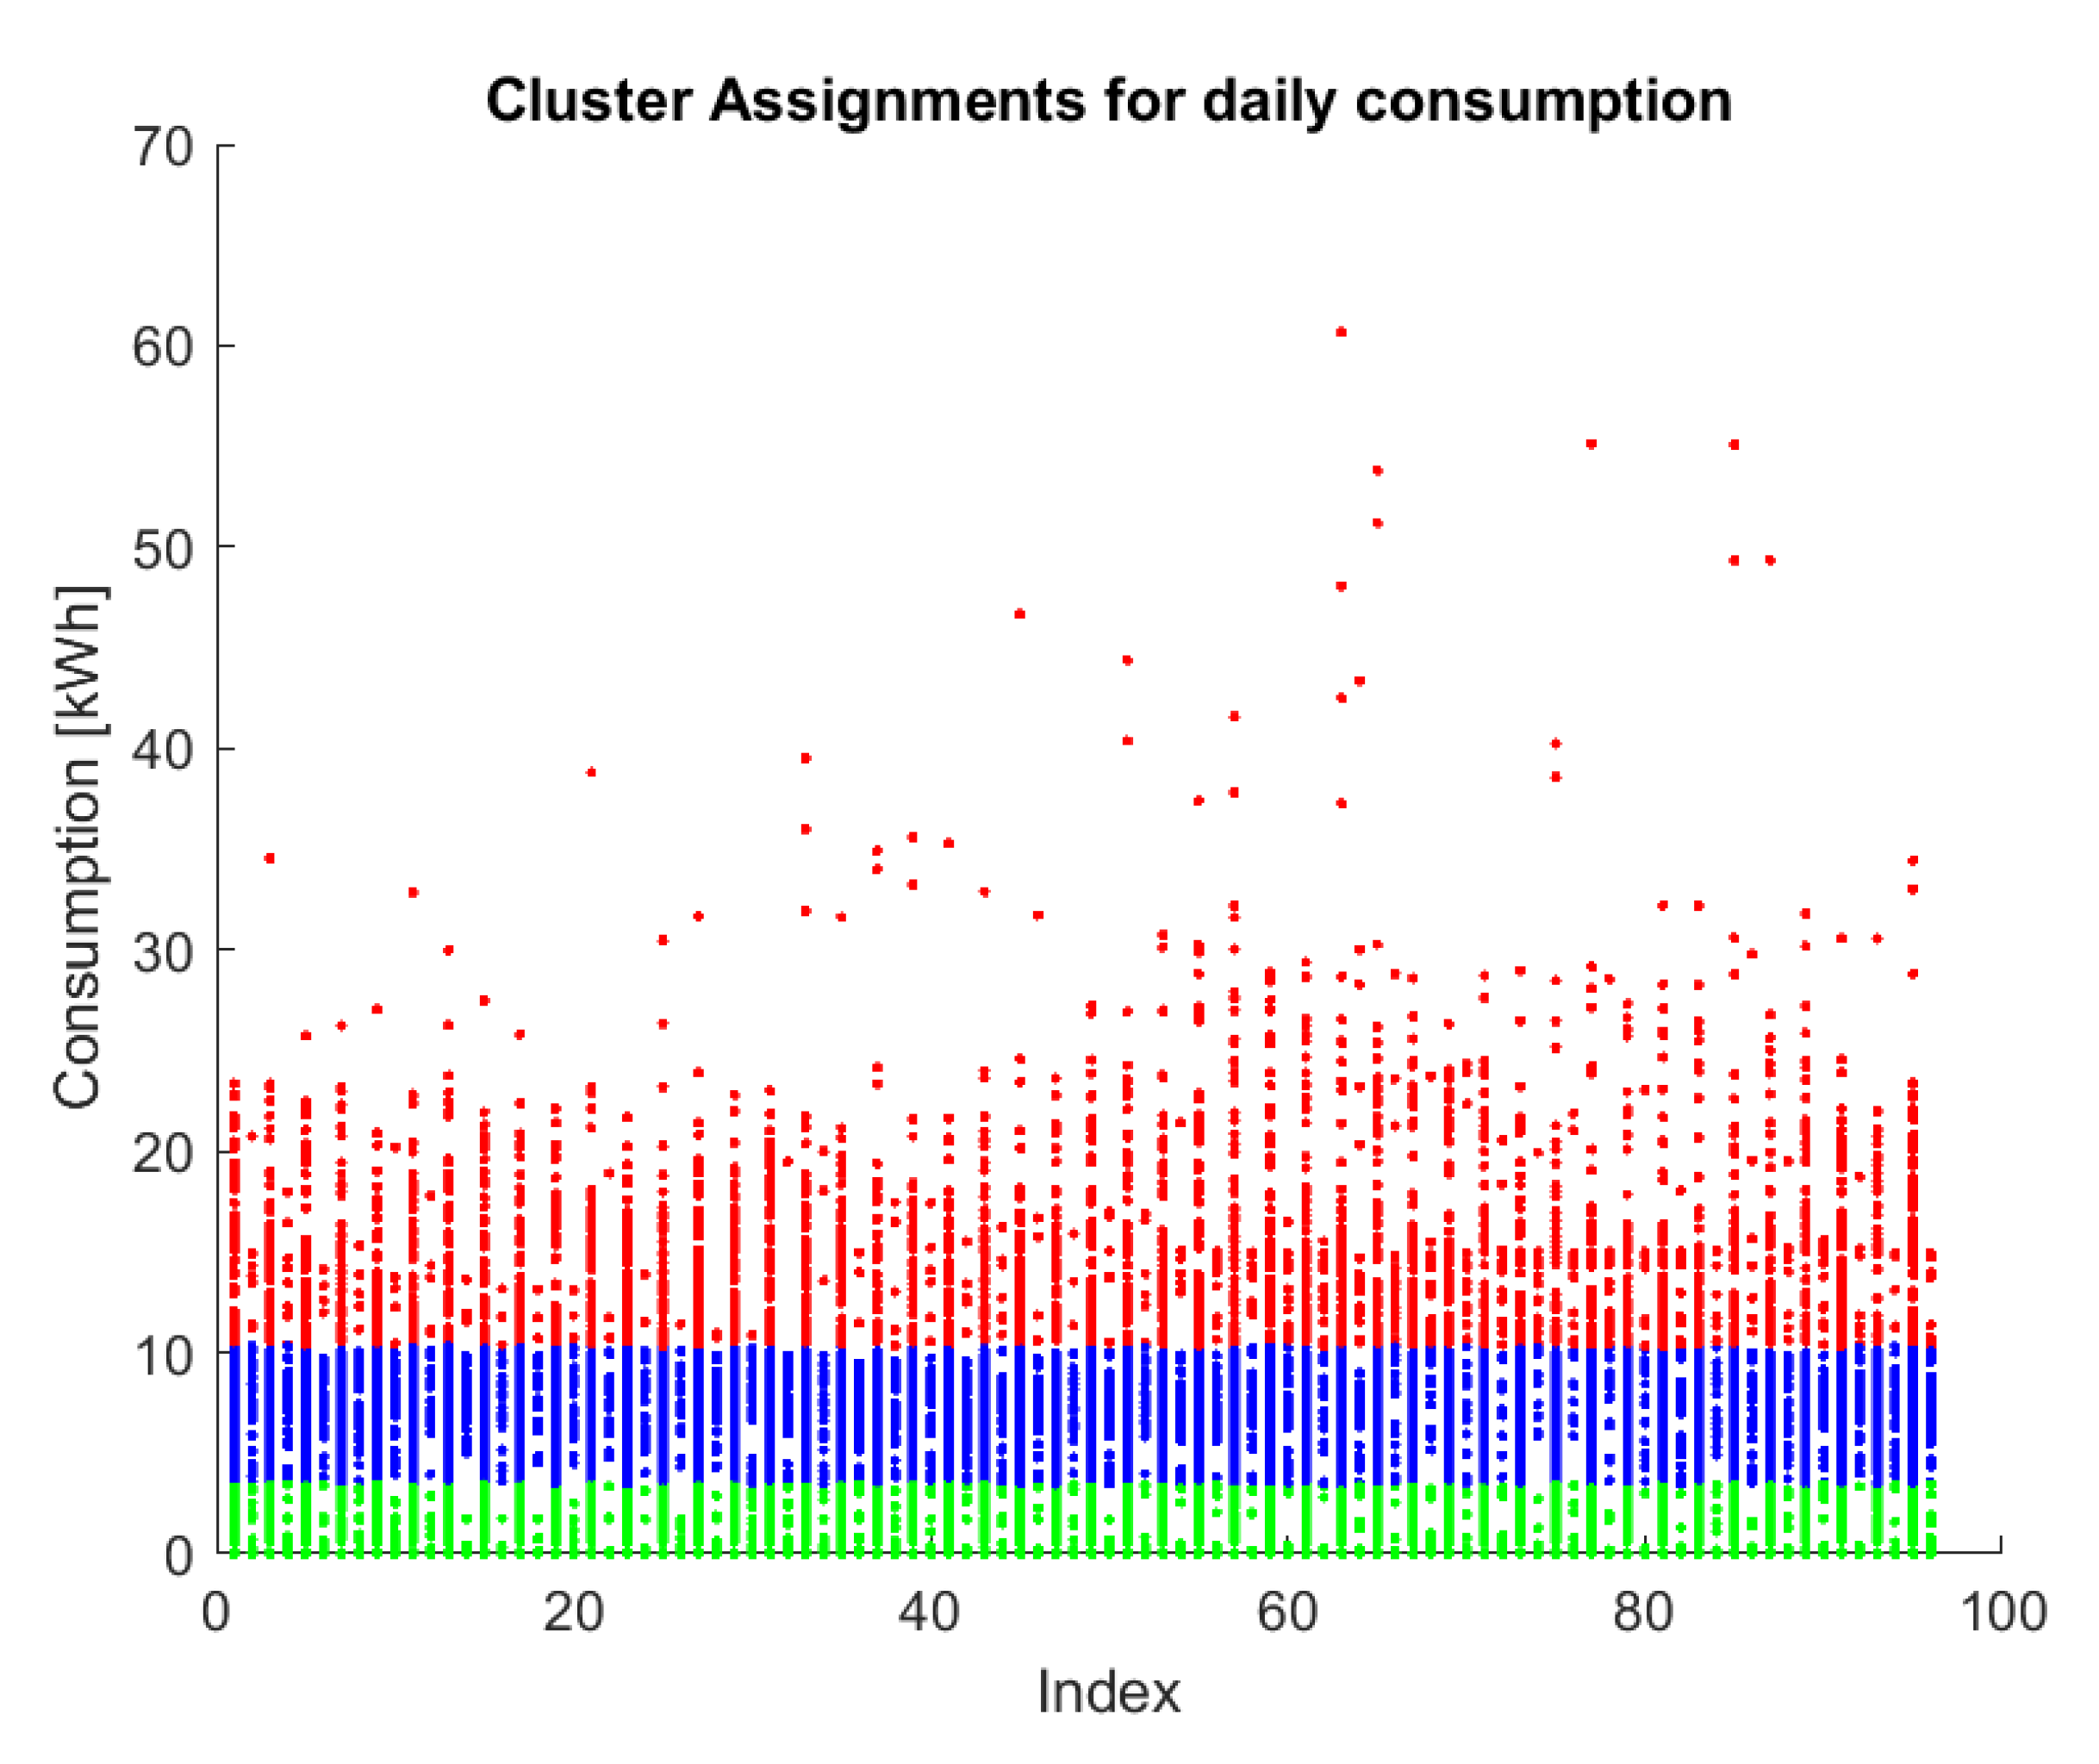
| Consumption Location | Type of Activity | Consumption Cluster Ranges | Distance Calculation Method |
|---|---|---|---|
| Faculty of Building Services | Learning | [0; 0.6545] | Squared Euclidean |
| [0.6548; 2.4330] | |||
| [2.4335; 19.8390] | |||
| Swimming Complex | Swimming/physical education | [0; 2.3850] | City-Block |
| [2.3860; 6.4889] | |||
| [6.4900; 60.6640] |
Publisher’s Note: MDPI stays neutral with regard to jurisdictional claims in published maps and institutional affiliations. |
© 2022 by the authors. Licensee MDPI, Basel, Switzerland. This article is an open access article distributed under the terms and conditions of the Creative Commons Attribution (CC BY) license (https://creativecommons.org/licenses/by/4.0/).
Share and Cite
Berciu, A.G.; Dulf, E.H.; Micu, D.D. Improving the Efficiency of Electricity Consumption by Applying Real-Time Fuzzy and Fractional Control. Mathematics 2022, 10, 3807. https://doi.org/10.3390/math10203807
Berciu AG, Dulf EH, Micu DD. Improving the Efficiency of Electricity Consumption by Applying Real-Time Fuzzy and Fractional Control. Mathematics. 2022; 10(20):3807. https://doi.org/10.3390/math10203807
Chicago/Turabian StyleBerciu, Alexandru G., Eva H. Dulf, and Dan D. Micu. 2022. "Improving the Efficiency of Electricity Consumption by Applying Real-Time Fuzzy and Fractional Control" Mathematics 10, no. 20: 3807. https://doi.org/10.3390/math10203807