Article

Analysis of Measured Parameters in Relation to the Amount of Fibre in Lightweight Red Ceramic Waste Aggregate Concrete

Department of Structural Mechanics, Faculty of Civil Engineering, VSB—Technical University of Ostrava, L. Podéště 1875, Poruba, 70800 Ostrava, Czech Republic
*
Author to whom correspondence should be addressed.
Mathematics 2022, 10(2), 229; https://doi.org/10.3390/math10020229
Submission received: 28 December 2021 / Revised: 9 January 2022 / Accepted: 10 January 2022 / Published: 12 January 2022

Abstract

:
The present study provides a correlation and regression analysis of lightweight waste aggregate concretes with varying degrees of fibre reinforcement. The concrete mix contains pre-soaked red ceramic waste aggregate, expanded clay coarse aggregate and Portland cement. Copper-coated crimped steel fibre was used as the reinforcement. The experimental results included properties measured by destructive test methods—compressive strength, splitting tensile strength, static modulus of elasticity, the limit of proportionality, shear strength; and by non-destructive test methods—dynamic modulus of elasticity and surface electrical resistivity. These properties were analysed to study the relevancy and significance between non-destructive and destructive methods of measurement in the case of different amounts of fibre. The results show differences in the degree of fit to the linear and quadratic regression curves for pairs of destructive and non-destructive test results. As expected, the linear relationship can be applied in a few cases, but the quadratic curve must be used for a few pairs. Another observation is that it is not possible to neglect the amount of fibre in the correlation analyses of the measured properties.

1. Introduction

Concrete is one of the most common building materials in the construction industry. Ordinary concrete is a mixture of natural aggregates and derivatives of the hydration process of cementitious material. However, its typical composition and massive consumption cause rapid depletion of natural aggregate resources, and, in addition, cement production has a negative impact on global man-made CO2 emissions [1,2]. Therefore, research focused on the use of alternative aggregates, the use of less cement, the advanced modelling and design of the structures, and the correct evaluation of the results obtained from experimental testing, and the study of the dependencies between the measured data is of great interest for many research groups around the world [3,4]. As aggregate plays a key role in concrete production due to its high proportion in the concrete mix, it is responsible for the unsustainable consumption of local natural resources [5]. Many studies have shown that natural aggregates (fine or coarse) can be replaced by crushed demolition concrete [6], waste bricks [7,8,9], waste sanitary appliances [10], recycled plastic aggregate [1,5,11], or artificial geopolymer fine and coarse aggregates [12]. Cement production can also be reduced by partial replacement of Portland cement with different cementitious and pozzolanic materials [13,14,15].
Although concrete exhibits high compressive strength, it is a very brittle material prone to tensile stress. Concrete tensile strength can be effectively improved by incorporating fibre into the mixture to create fibre-reinforced concrete (FRC). The addition of the fibre can also influence fracture toughness, impact strength, durability, etc. [16,17,18]; and it has also been known that added fibre has a negligible effect on concrete compressive strength and modulus of elasticity [19]. Steel fibre is one of the most popular and widely used for FRC. Countless publications have already been published on FRC dealing with experimental and analytical methods to evaluate the strength characteristics of FRC, taking into account concrete grades, concrete types, cure time, steel fibre geometry, aspect ratio and volume fraction, e.g., [16,17,18]. As part of creating more sustainable structures, it is also possible to replace ordinary steel fibre with natural [20,21] or plastic fibres [22].
Research into determining the relationship between the mechanical properties of concrete or fibre concrete is still relevant. In the paper [23], two power relations for the experimental results of compressive and splitting tensile strength for reinforced concrete with polypropylene fibre and reinforced glass fibre are presented, while another study [24] presents, the linear correlation between splitting tensile strength and flexural strength. Strong correlations were found between compressive strength and splitting tensile strength, and between splitting tensile strength and flexural strength in the case of steel fibre reinforced concrete in [25]. In the study [26], the results of splitting tensile strength, direct tensile strength, strain capacity, and crack arrest ability were evaluated to increase with increasing amount of steel FRC and increasing addition of silica fume. A positive correlation was observed in the case of concrete with different amounts of ferronickel slag and blast furnace slag powder between the axial compressive strength, elastic modulus, tensile strength of splitting, and cubic compressive strength [27].
A separate chapter is devoted to the evaluation of suitable non-destructive methods for the assessment of new and existing structures in the contribution [28]. The advantages of economy and speed are balanced by the disadvantages of greater inaccuracy and the need for more measurements [29]. It is also generally recognised that various concrete admixtures and other compositional parameters can have a large influence on the calibration relationships of non-destructive methods [30].
This study focuses on the evaluation of the volume fraction of copper-coated crimped steel fibre on the engineering properties of concrete from the waste red ceramic fine aggregate (WRCFA). The experimental results were collected and analysed to describe the relevance and relationship between destructive and non-destructive tests using correlation and regression analysis. This analysis allows us to present and evaluate how the composition of unconventional concrete will affect the commonly known calibration relationships.

2. Materials and Methods

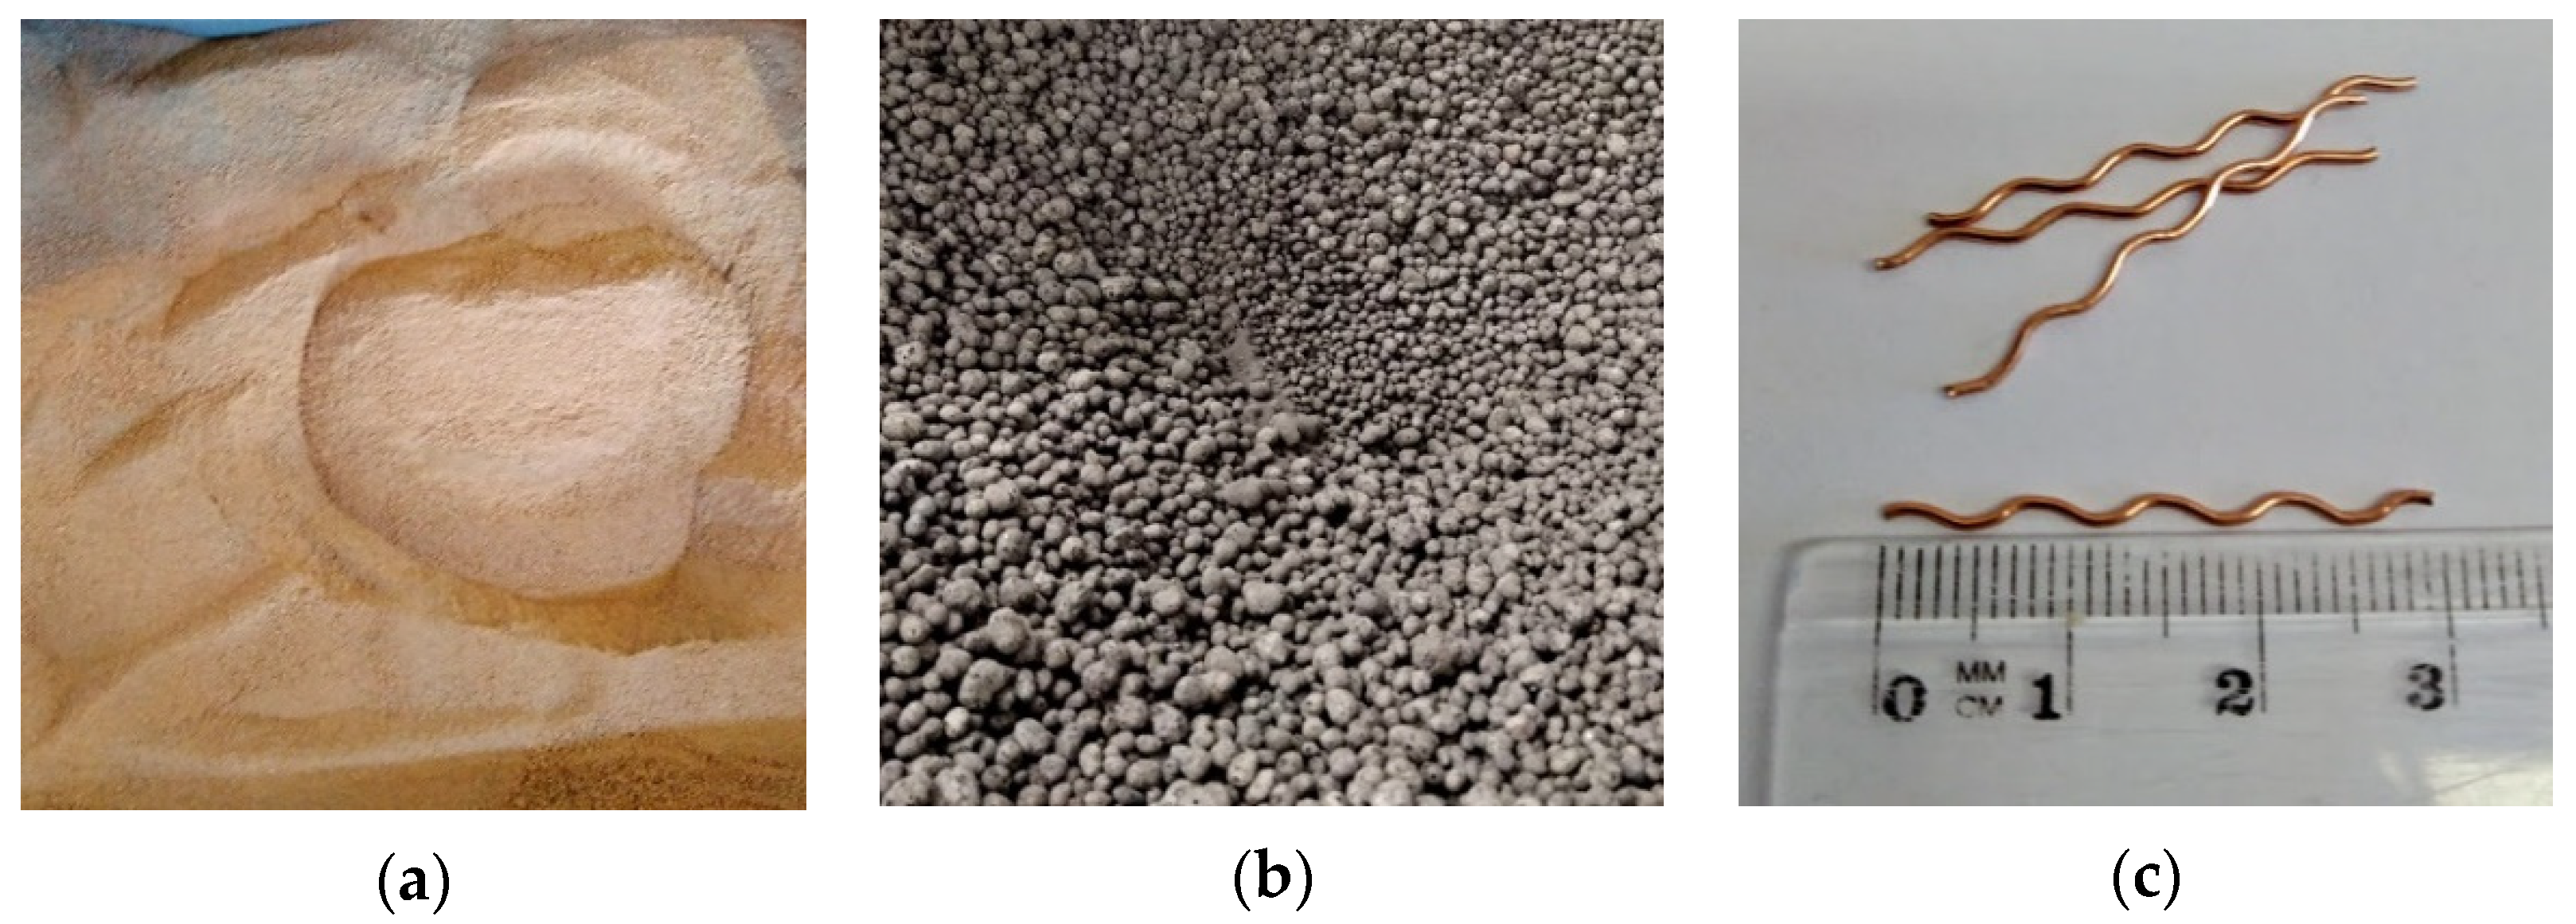
2.1. Concrete Properties

The concrete mixture was designed to study the possibility of the use of recycled aggregates; in this case, the recycled aggregates are fine particles from red ceramic airbricks (see Figure 1a) without any remaining mortar. The loose density of WRCFA was measured as 1183.8 kg/m3, compacted density was 1489.2 kg/m3, and the water absorptivity was 46%. The coarse particles of the concrete mixture are represented by expanded clay aggregates (ECCA, see Figure 1b). The loose density of ECCA was measured as 318.8 kg/m3, the compacted density was 345.8 kg/m3, and the water absorptivity was 36%.
The aggregates were water pre-soaked to study the phenomenon of internal curing of cement, and no other mixing water was used. Portland Cement I 42.5 N-NA was utilized. The last used component of the concrete mixture is copper-coated crimped (CCC) steel fibre (length = 30.8 mm, diameter = 0.73 mm, density = 7800 kg/m3, ultimate tensile strength = 1.7 GPa) in the various percentages of concrete volume (see Figure 1c).
The process of design and testing of mechanical characteristics is described in detail in [31]. The composition of the concrete is given in Table 1. Density of concrete is approximately 1450 kg/m3. The concrete is marked according to the percentage of reinforcement, from 0% to 1.5% of the volume of concrete, which is the only parameter of the concrete mixture that was changing.
The consistency of the fresh mixture according to EN 12350-2:2009 [32,33] was measured immediately after the mixing. After 24 h, the specimens were measured and weighed, and the density of every mixture was determined [33]. The concrete was classified as lightweight (density was less than 1800 kg∙m−3) according to standard [34]. Most of the mechanical properties—namely, compressive strength, splitting tensile strength, static modulus of elasticity, the limit of proportionality and residual flexural strength, shear strength—were measured after 28 days of curing in a water tank by destructive testing methods (DT).
Dynamic modulus of elasticity was measured by the non-destructive testing method (NDT) also 28 days after casting. The surface resistivity of concrete was measured in the specific points of time after casting—7, 14, 28, 56, 91 days—to calculate the diffusion and ageing coefficient, and almost a year after casting for the research purposes of the relationship between surface and bulk resistivity [35,36]. The methods are also briefly introduced in this contribution.

2.2. The Methodology of Destructive Tests

The compressive strength was tested on three cube specimens of each concrete mixture with an edge length of 0.100 m, which were placed in the testing machine and continuously loaded at a constant speed according to the EN 12390-3 standard [37]. The resulting maximum failure force F [N] and the cross-sectional area of the test specimen Ac [m2] were used to calculate the compressive strength fc [Pa]:
f c = F A c .
The splitting tensile strength was tested on three cube specimens of every concrete mixture with an edge length of 0.100 m, which were placed into the testing machine and continuously loaded at a constant speed based on the standard EN 12390-6 [38]. The resulting maximum failure force F [N], the contact length L [m] and the transverse dimension of the test specimen d [m] were used to calculate the splitting tensile strength ft,spl [Pa]:
f t , spl = 2 · F π · L · d .
The secant (static) modulus of elasticity was tested on three cylindrical specimens of every concrete mixture with a diameter of 0.150 m and height of 0.300 m, according to EN 12390-13 [39]. The stabilized secant modulus of elasticity Ec,s [Pa] is defined by the difference between measured nominal upper and lower stress Δ𝜎 [Pa] and strain difference during the third loading cycle Δ𝜀s [–]:
E c , s = Δ σ Δ ε s .
The ultimate flexural tensile strength of concrete without reinforcement, limit of proportionality and residual flexural tensile strength were determined based on load-crack mouth opening displacement curves from three-point bending tests of three notched beams of every concrete mixture with the length of 0.600 m, and height and width of 0.150 m, according to EN 12390-5 [40] and EN 14651 [41]. The ultimate flexural tensile strength and the limit of proportionality fLOP [Pa] are defined by the maximum load or, respectively, the load corresponding to the limit of proportionality, F [N], the span of the supports l [m], the width of the specimen b [m] and the distance between the tip of the notch and top of the specimen hsp [m]:
f L O P = 3 · F · l 2 · b · h sp 2
The shear strength was tested on six beam specimens of every concrete mixture with a height and width of 0.150 m, which were loaded continuously and without impact. The shear strength fshear [Pa] is defined by the maximum force F [N] and area of the cross-section of the specimen A [m2]:
f s h e a r = F 2 · A .

2.3. The Methodology of Non-Destructive Tests

The dynamic modulus of elasticity was tested on three beams of every mixture on their shorter length of 0.150 m using an ultrasonic pulse testing instrument. The test method is described in the standard EN 12504-4 [42]. The dynamic modulus of elasticity Ecu [Pa] is defined by the density of the material ρ [kg·m−3], the length of measuring base L [mm] and time of the single pulse pass T [μs]:
E cu = ρ · ( L T ) 2 .
Surface resistivity was measured on three cylindrical specimens with a diameter of 0.150 m and length of 0.300 m by the Wenner probe according to the AASHTO T358 standard [43]. The volume electrical resistivity ρ vol [kΩcm] is then defined by the measured surface electrical resistivity ρ sur [kΩcm] and correction constant K [–], which depends on the shape and size of the sample [44]:
ρ vol = ρ sur · K
The measured electrical resistivity values can be subsequently used to derive the diffusion coefficient of concrete related to numerical calculations of the durability of structures exposed to aggressive substances.
The main advantage of these methods is the rapid handling of instruments and samples. The methods are non-destructive; therefore, repeated measurements are also possible in order to obtain the development of the specific properties in time.

2.4. Correlation and Regression Methodology

After the experimental data from testing were collected, statistical analysis and pairwise regression correlation were performed. The Pearson correlation coefficient (PCC) [–] was used for quantification of the linear relationship between two experimental parameters [45]. This coefficient can range from −1 (perfect negative correlation) to +1 (perfect positive correlation). Its value can be then sorted into three categories—strong (0.7 ≤ |r| < 1), moderate (0.3 ≤ |r| < 0.7) and weak (0.0 ≤ |r| < 0.3) [45,46,47].
However, the result is inaccurate if the relationship between two parameters is not linear. This relationship is thus suitable for the first search for connections and needs to be supplemented by further mathematical analyses. In the application of regression analysis, it is possible to search for a curve appropriately describing the relationship between two parameters, thus mathematically determining their dependence. Among others, linear and quadratic regressions can occur [47].
Whether a curve is appropriate and accurate for a given data set can be described, for example, by the coefficient of determination, which uses the least-squares method to determine the result [48]. The closer the coefficient of determination is to 1, the more the curve is the best fit for the measured data. With respect to further use of the obtained regression equations, it is ideal to find a linear curve. However, if the best-fit value is low, the application of quadratic regression or other higher polynomials may be ideal. In the present study, linear and quadratic regression is always analysed, and if the value of the coefficient of determination is greater than 0.8 [49], it is considered a high correlation.

3. Results

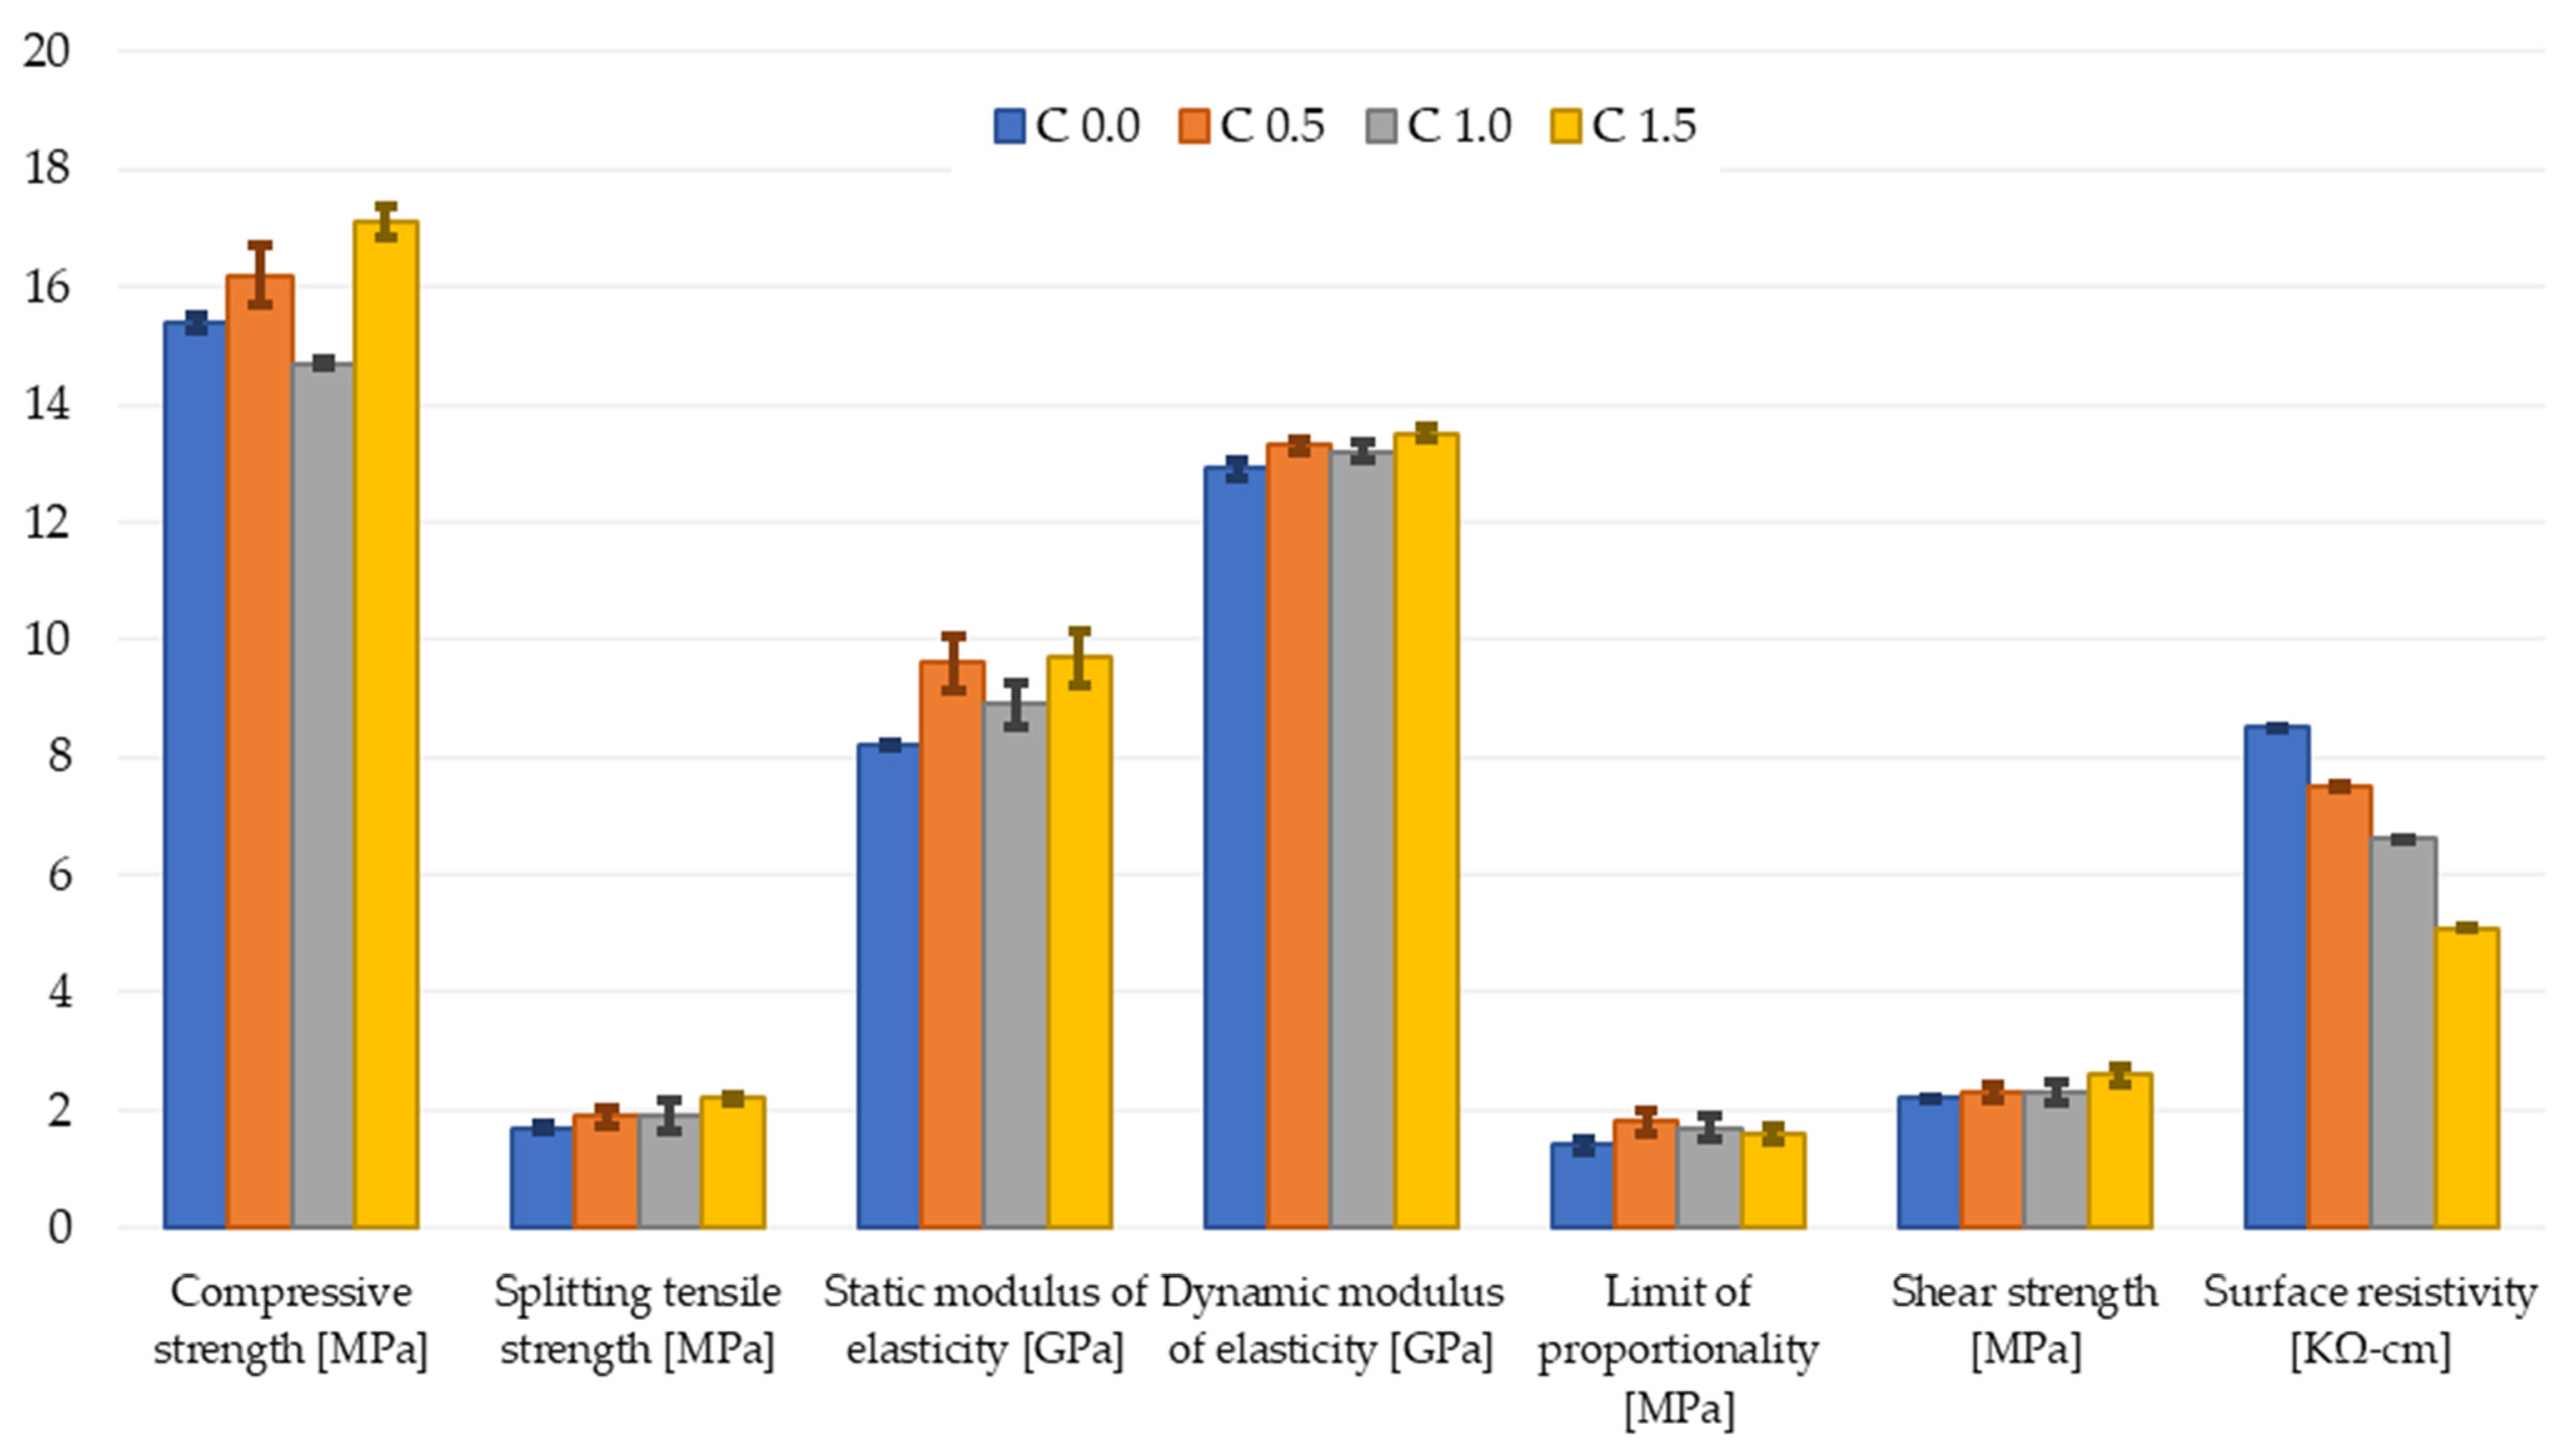
3.1. Results Related to the Amount of Fibre

The basic observation on the set of all measured data is related to the evaluation of the effect of the amount of fibre on the resulting parameters. Figure 2 shows the values for all the parameters obtained sorted by concrete type, i.e., with 0%, 0.5%, 1.0% and 1.5% fiber in the mixture.
In general, it seems that the parameters increase with the amount of fibre and the concrete gets better. However, the opposite trend can be seen for electrical resistance, as the highest values are for C0.0 concrete (without reinforcement) and the electrical resistance decreases with the amount of reinforcement. In the case of compressive strength, an increase in value is observed with more fibre, except for C1.0 concrete, which is the weakest of the whole data set. The addition of fibre can create a space between the fibres and concrete matrix, which is filled with air already while mixing. The air voids are linked to the small interaction between the fibre and cement paste. Therefore, the concrete loses its strength. However, this phenomenon has been shown to be very common [50] and small losses of compressive strength were also observed compared to fibre-free concrete, e.g., in the case of high-performance fibre-reinforced concrete [51] and in the case of high-, medium- and low-strength concrete reinforced with polypropylene fiber [52]. The measurements of static modulus of elasticity are similar, but in this case, the C0.0 concrete exhibits the lowest values. Splitting tensile strength, dynamic modulus of elasticity, and shear strength show always better values with the higher amount of fibre. The result of limit of proportionality is the highest for C0.5 concrete and then decreases slightly.
The main objective of the evaluation was to analyse the relationships between the results of the two NDTs—dynamic modulus of elasticity and surface resistivity, and the parameters obtained by the other DTs. The first step was to determine the Pearson correlation coefficient (PCC), which is shown in Table 2.
The Pearson correlation coefficients show that the dynamic modulus has, in most cases, a positive linear relationship with the other values. The only exception is the surface electrical resistivity, which has a strong negative correlation. The following parameters fall into the category of a strong positive correlation with the PCC above 0.7 for dynamic modulus of elasticity and compressive strength, splitting tensile strength, static modulus of elasticity, and shear strength. The limit of proportionality correlates with the dynamic modulus of elasticity moderately. In the case of the surface resistivity group, a strong negative correlation can be seen for splitting tensile strength, static modulus of elasticity, shear strength and dynamic modulus of elasticity. A moderate negative correlation can be seen for the surface resistivity and compressive strength and limit of proportionality.

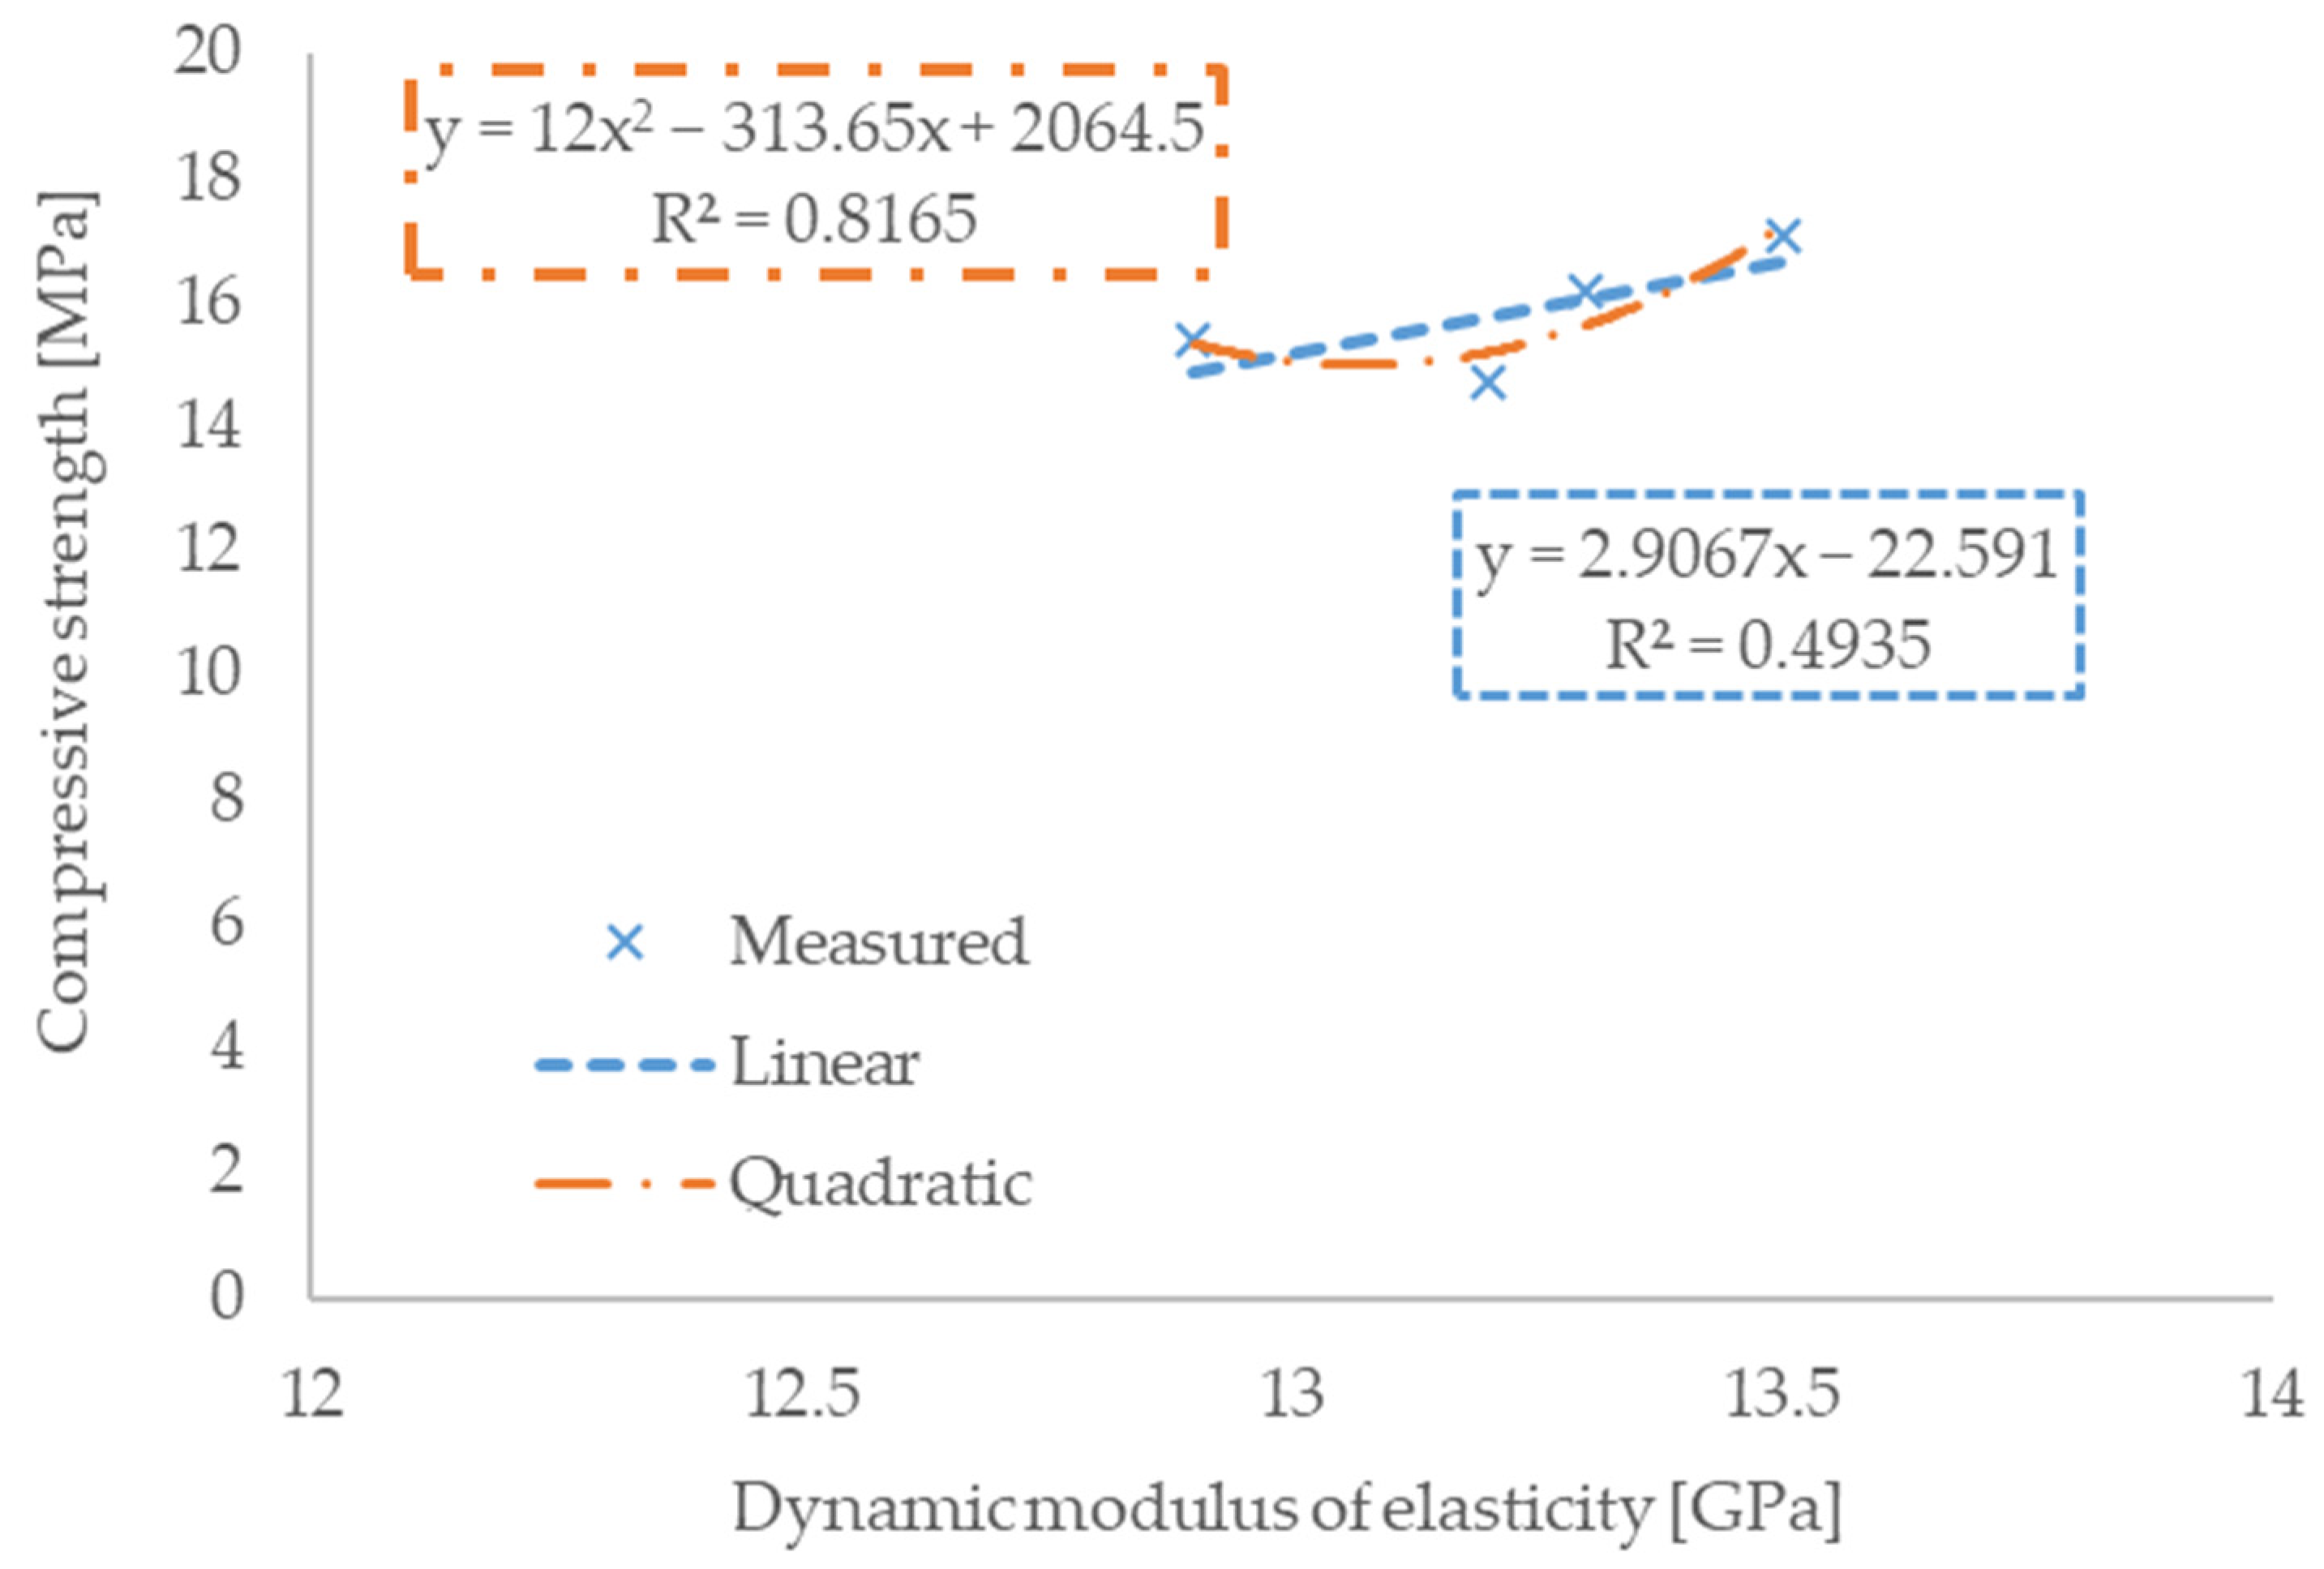
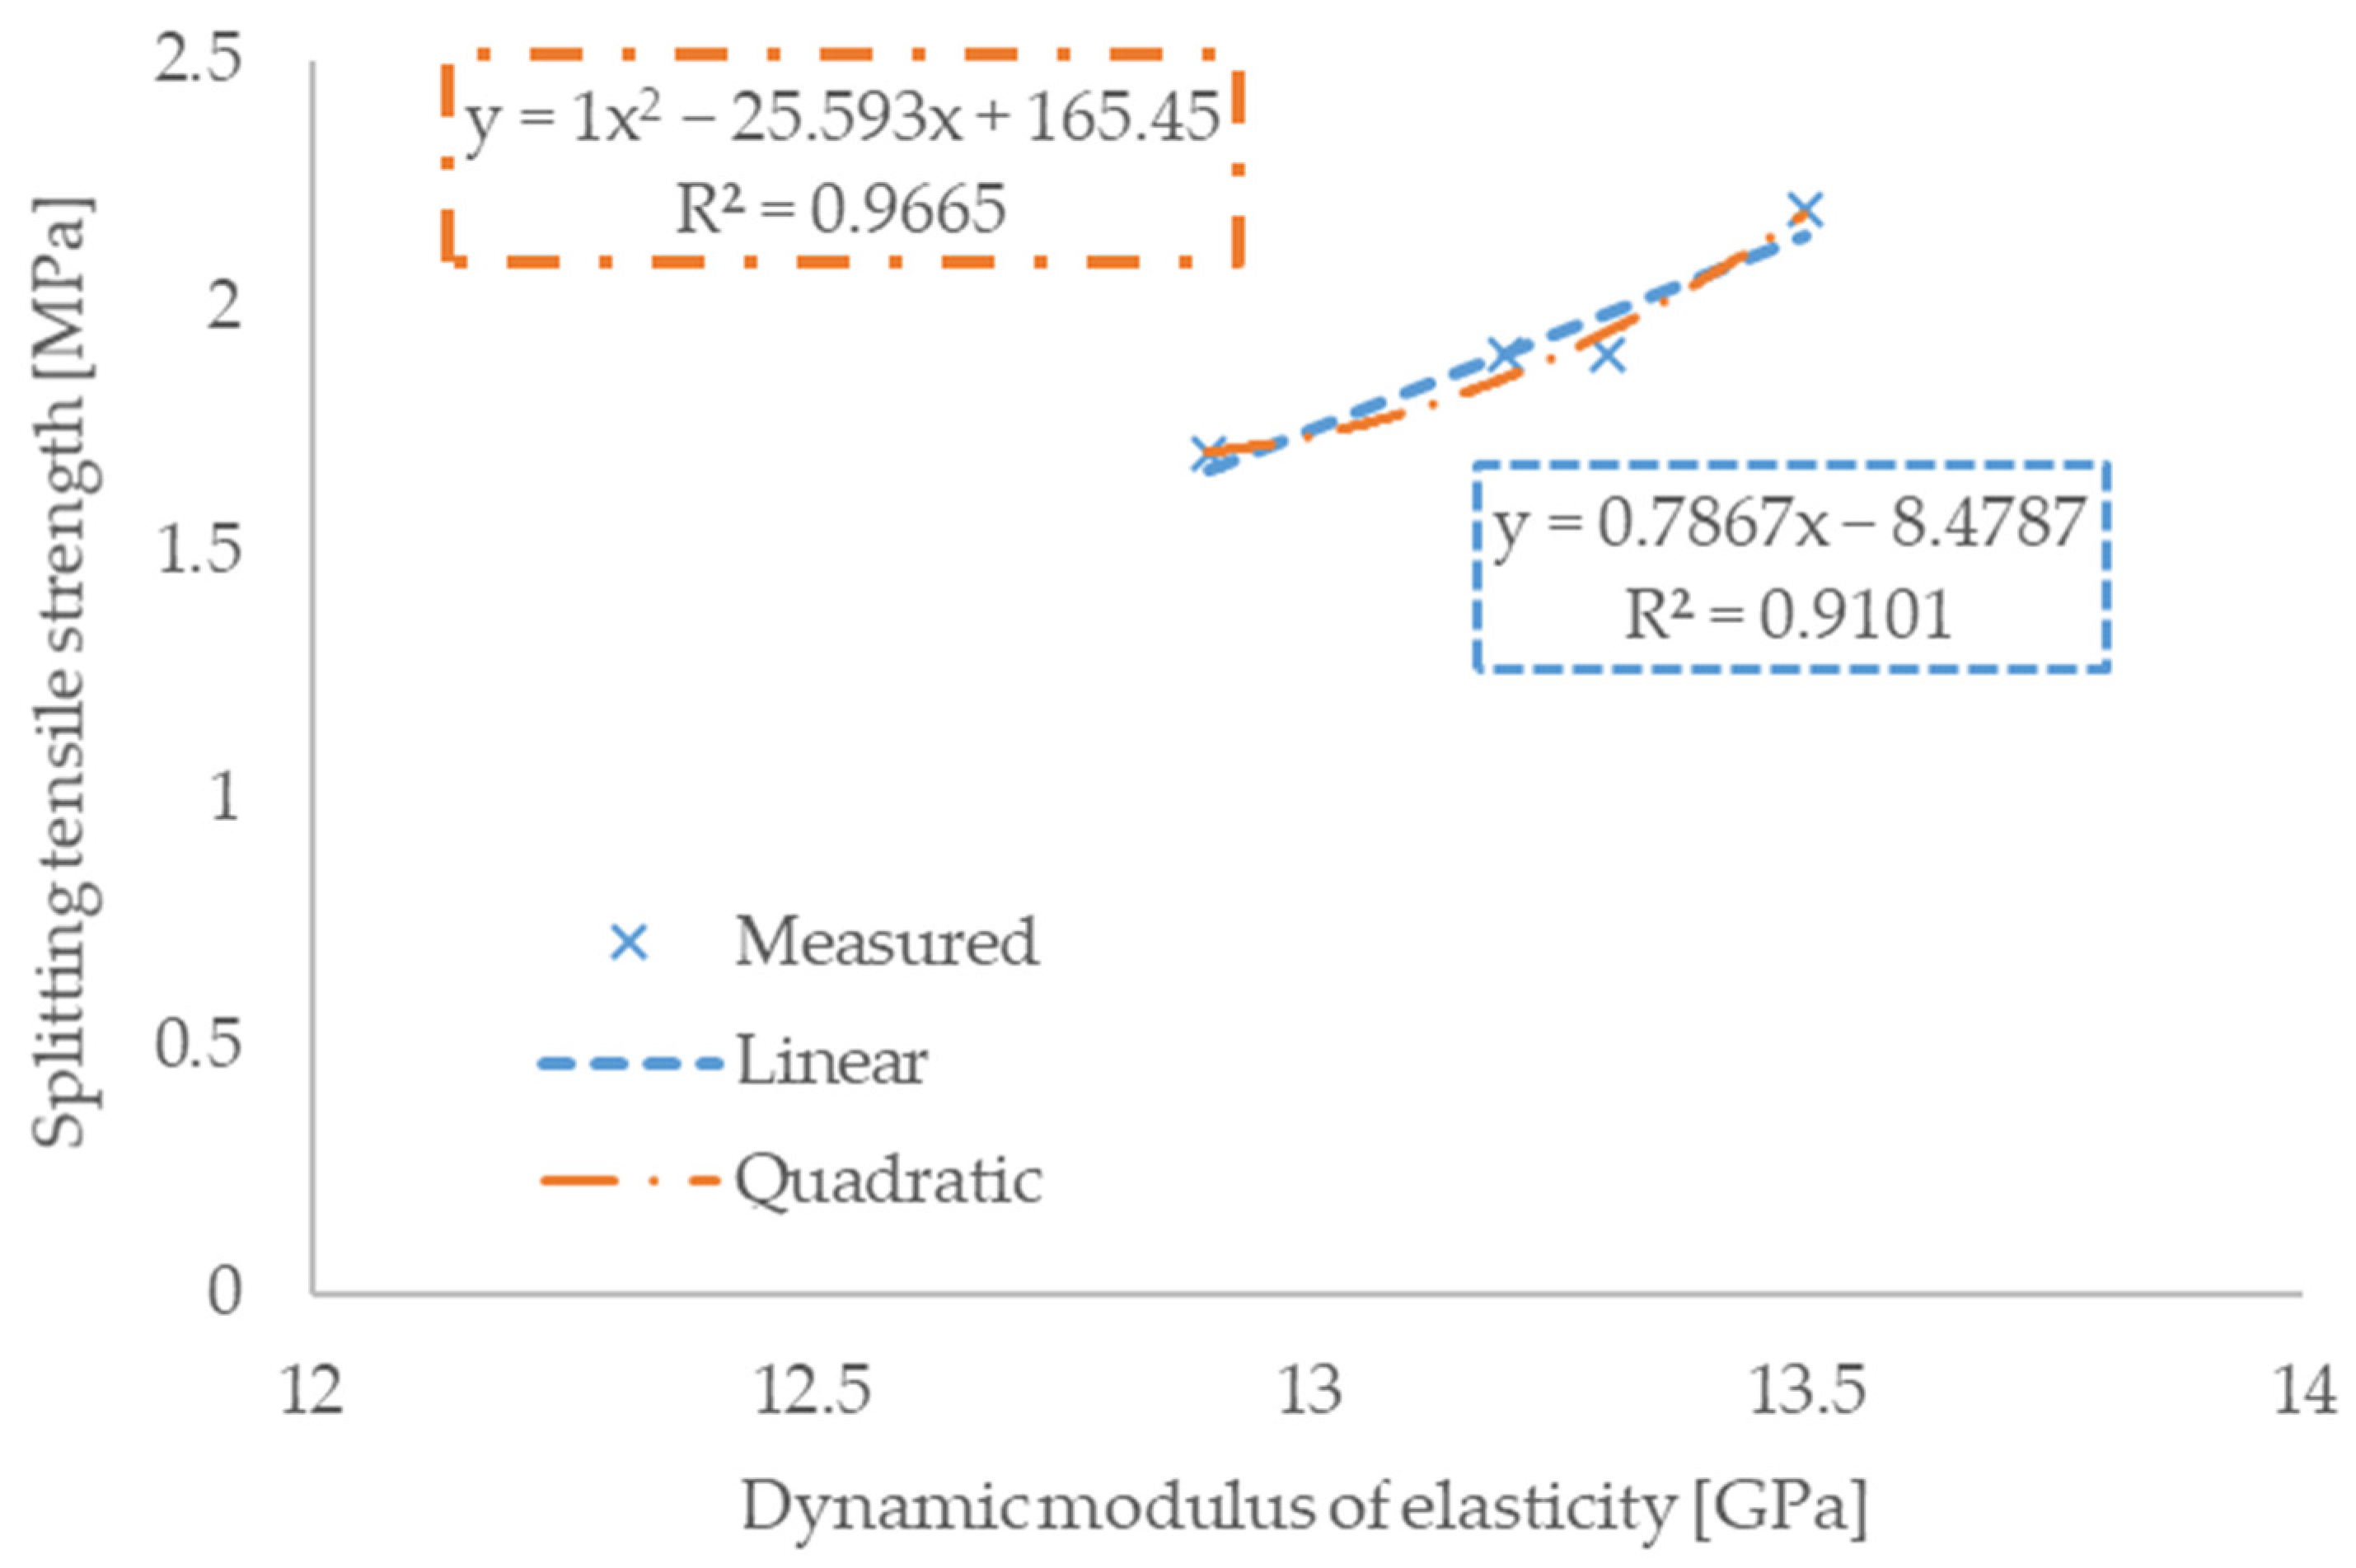
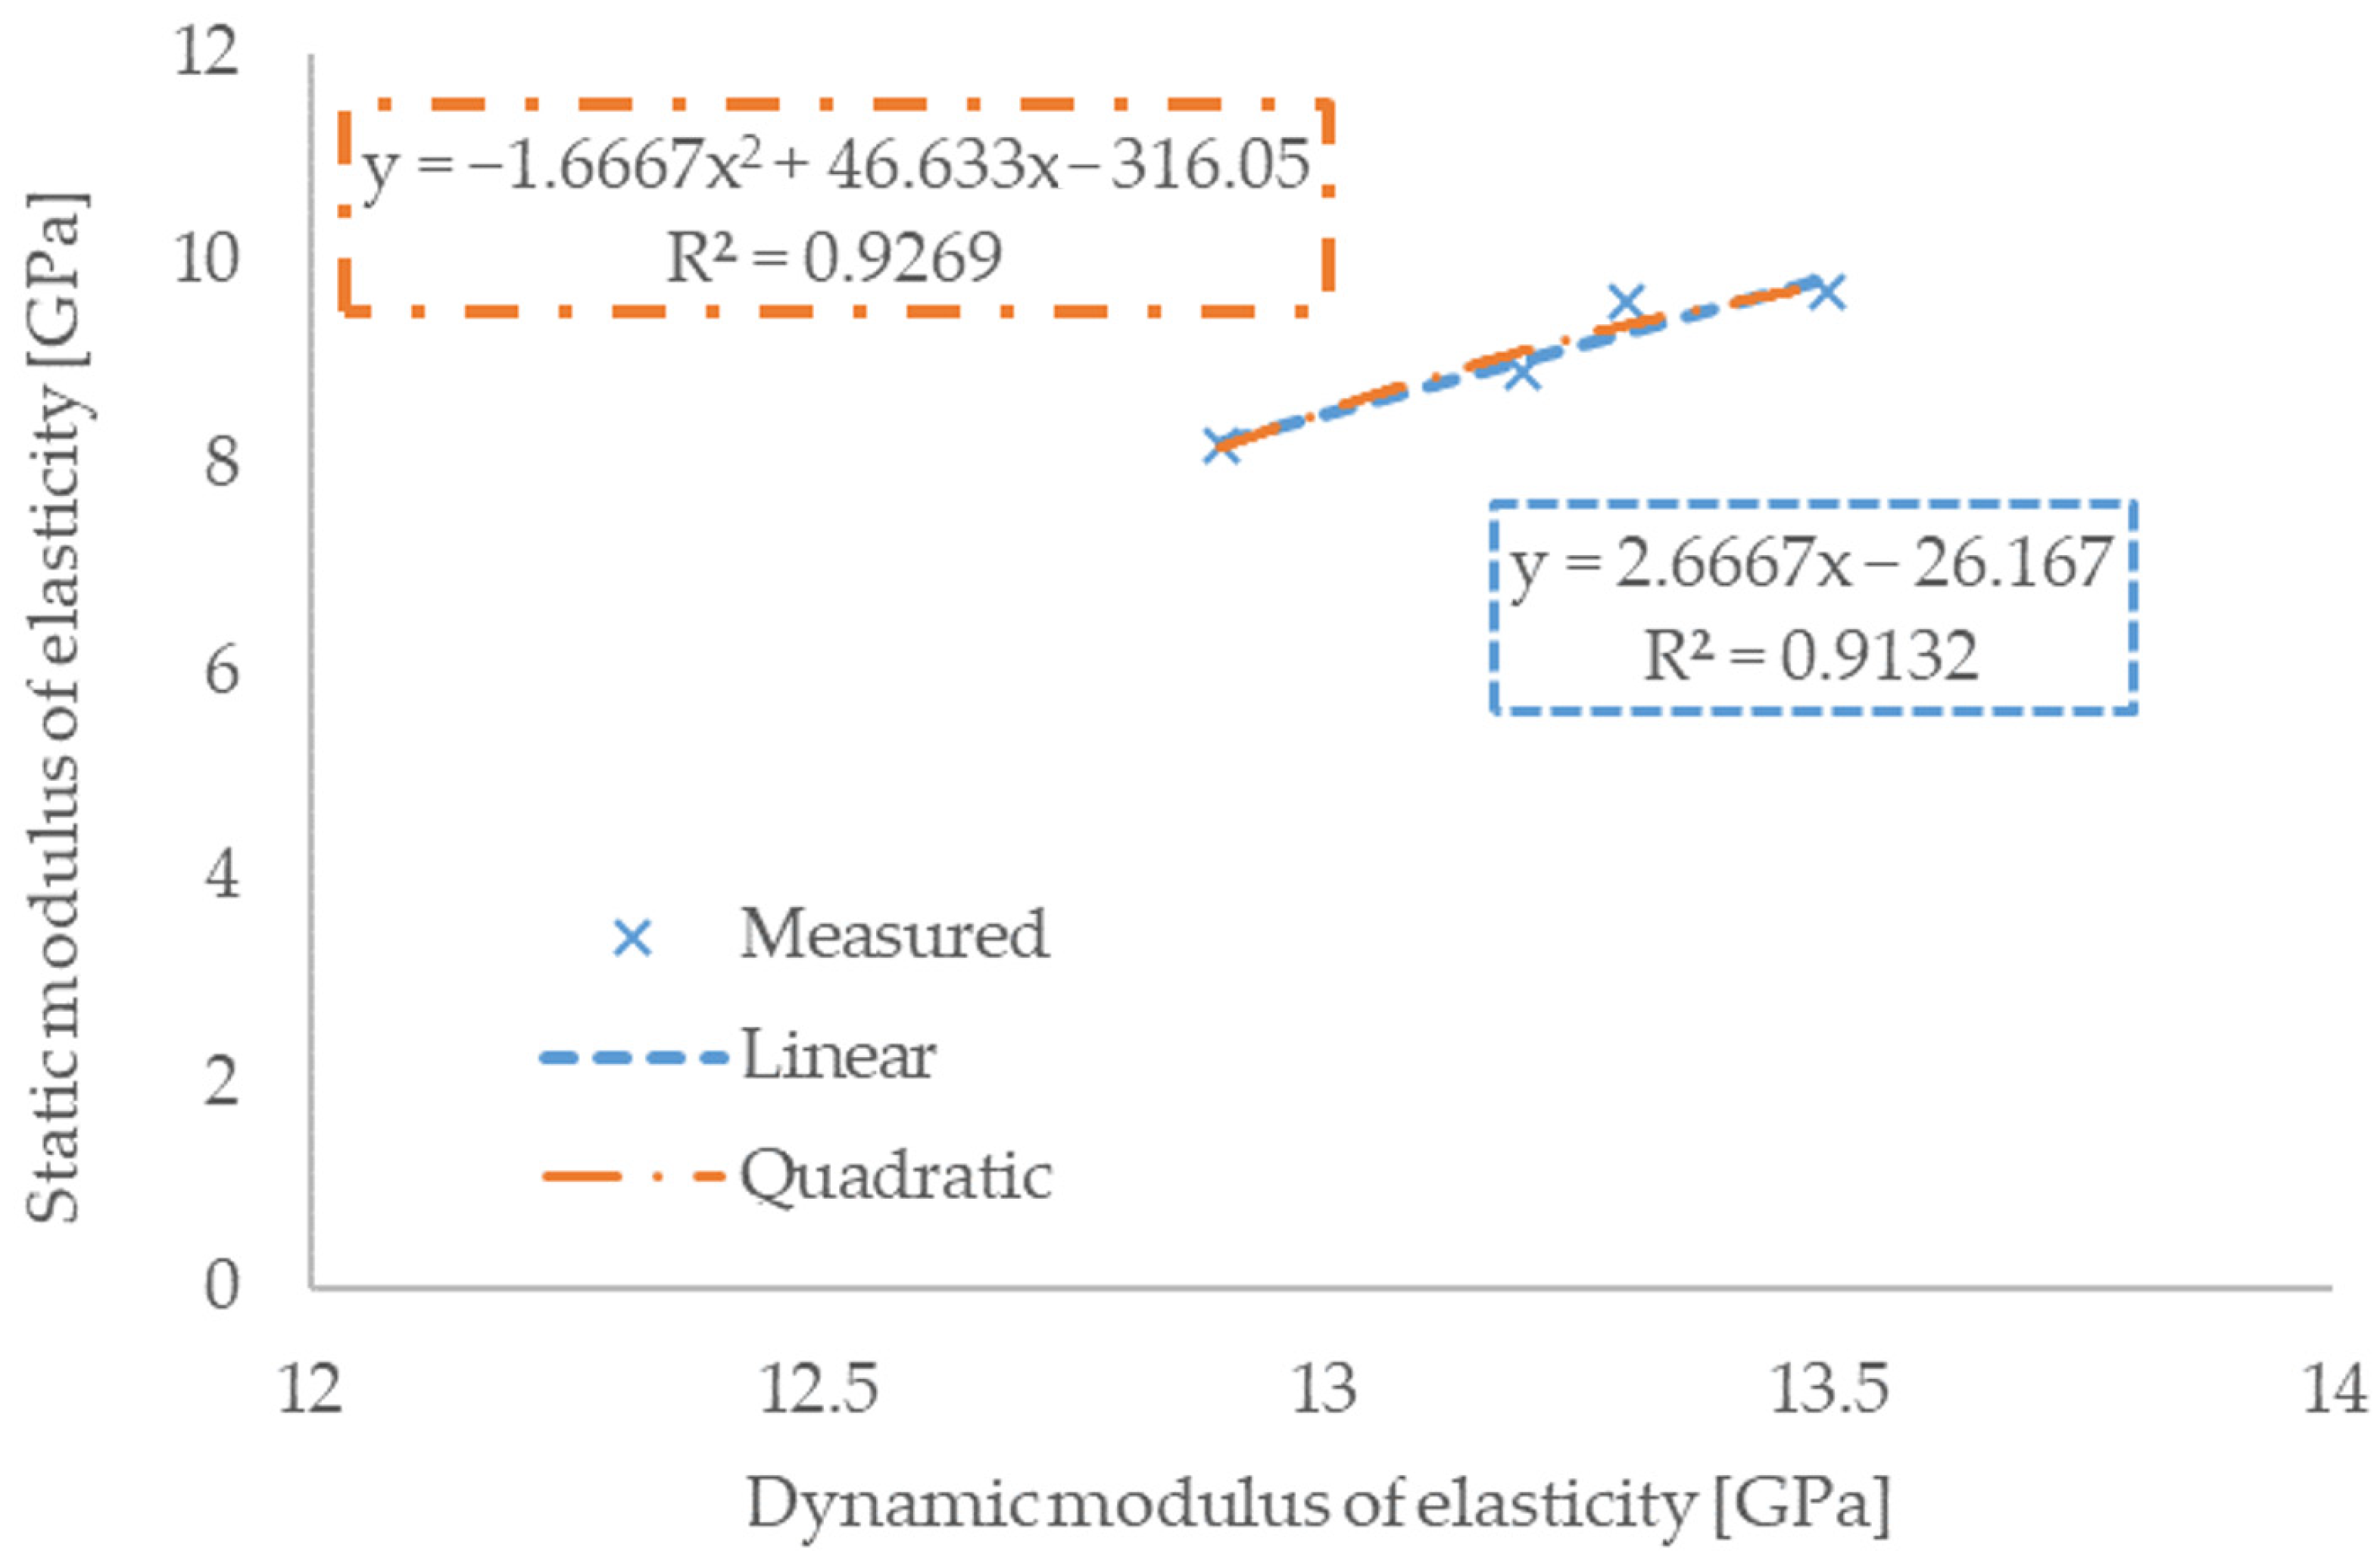
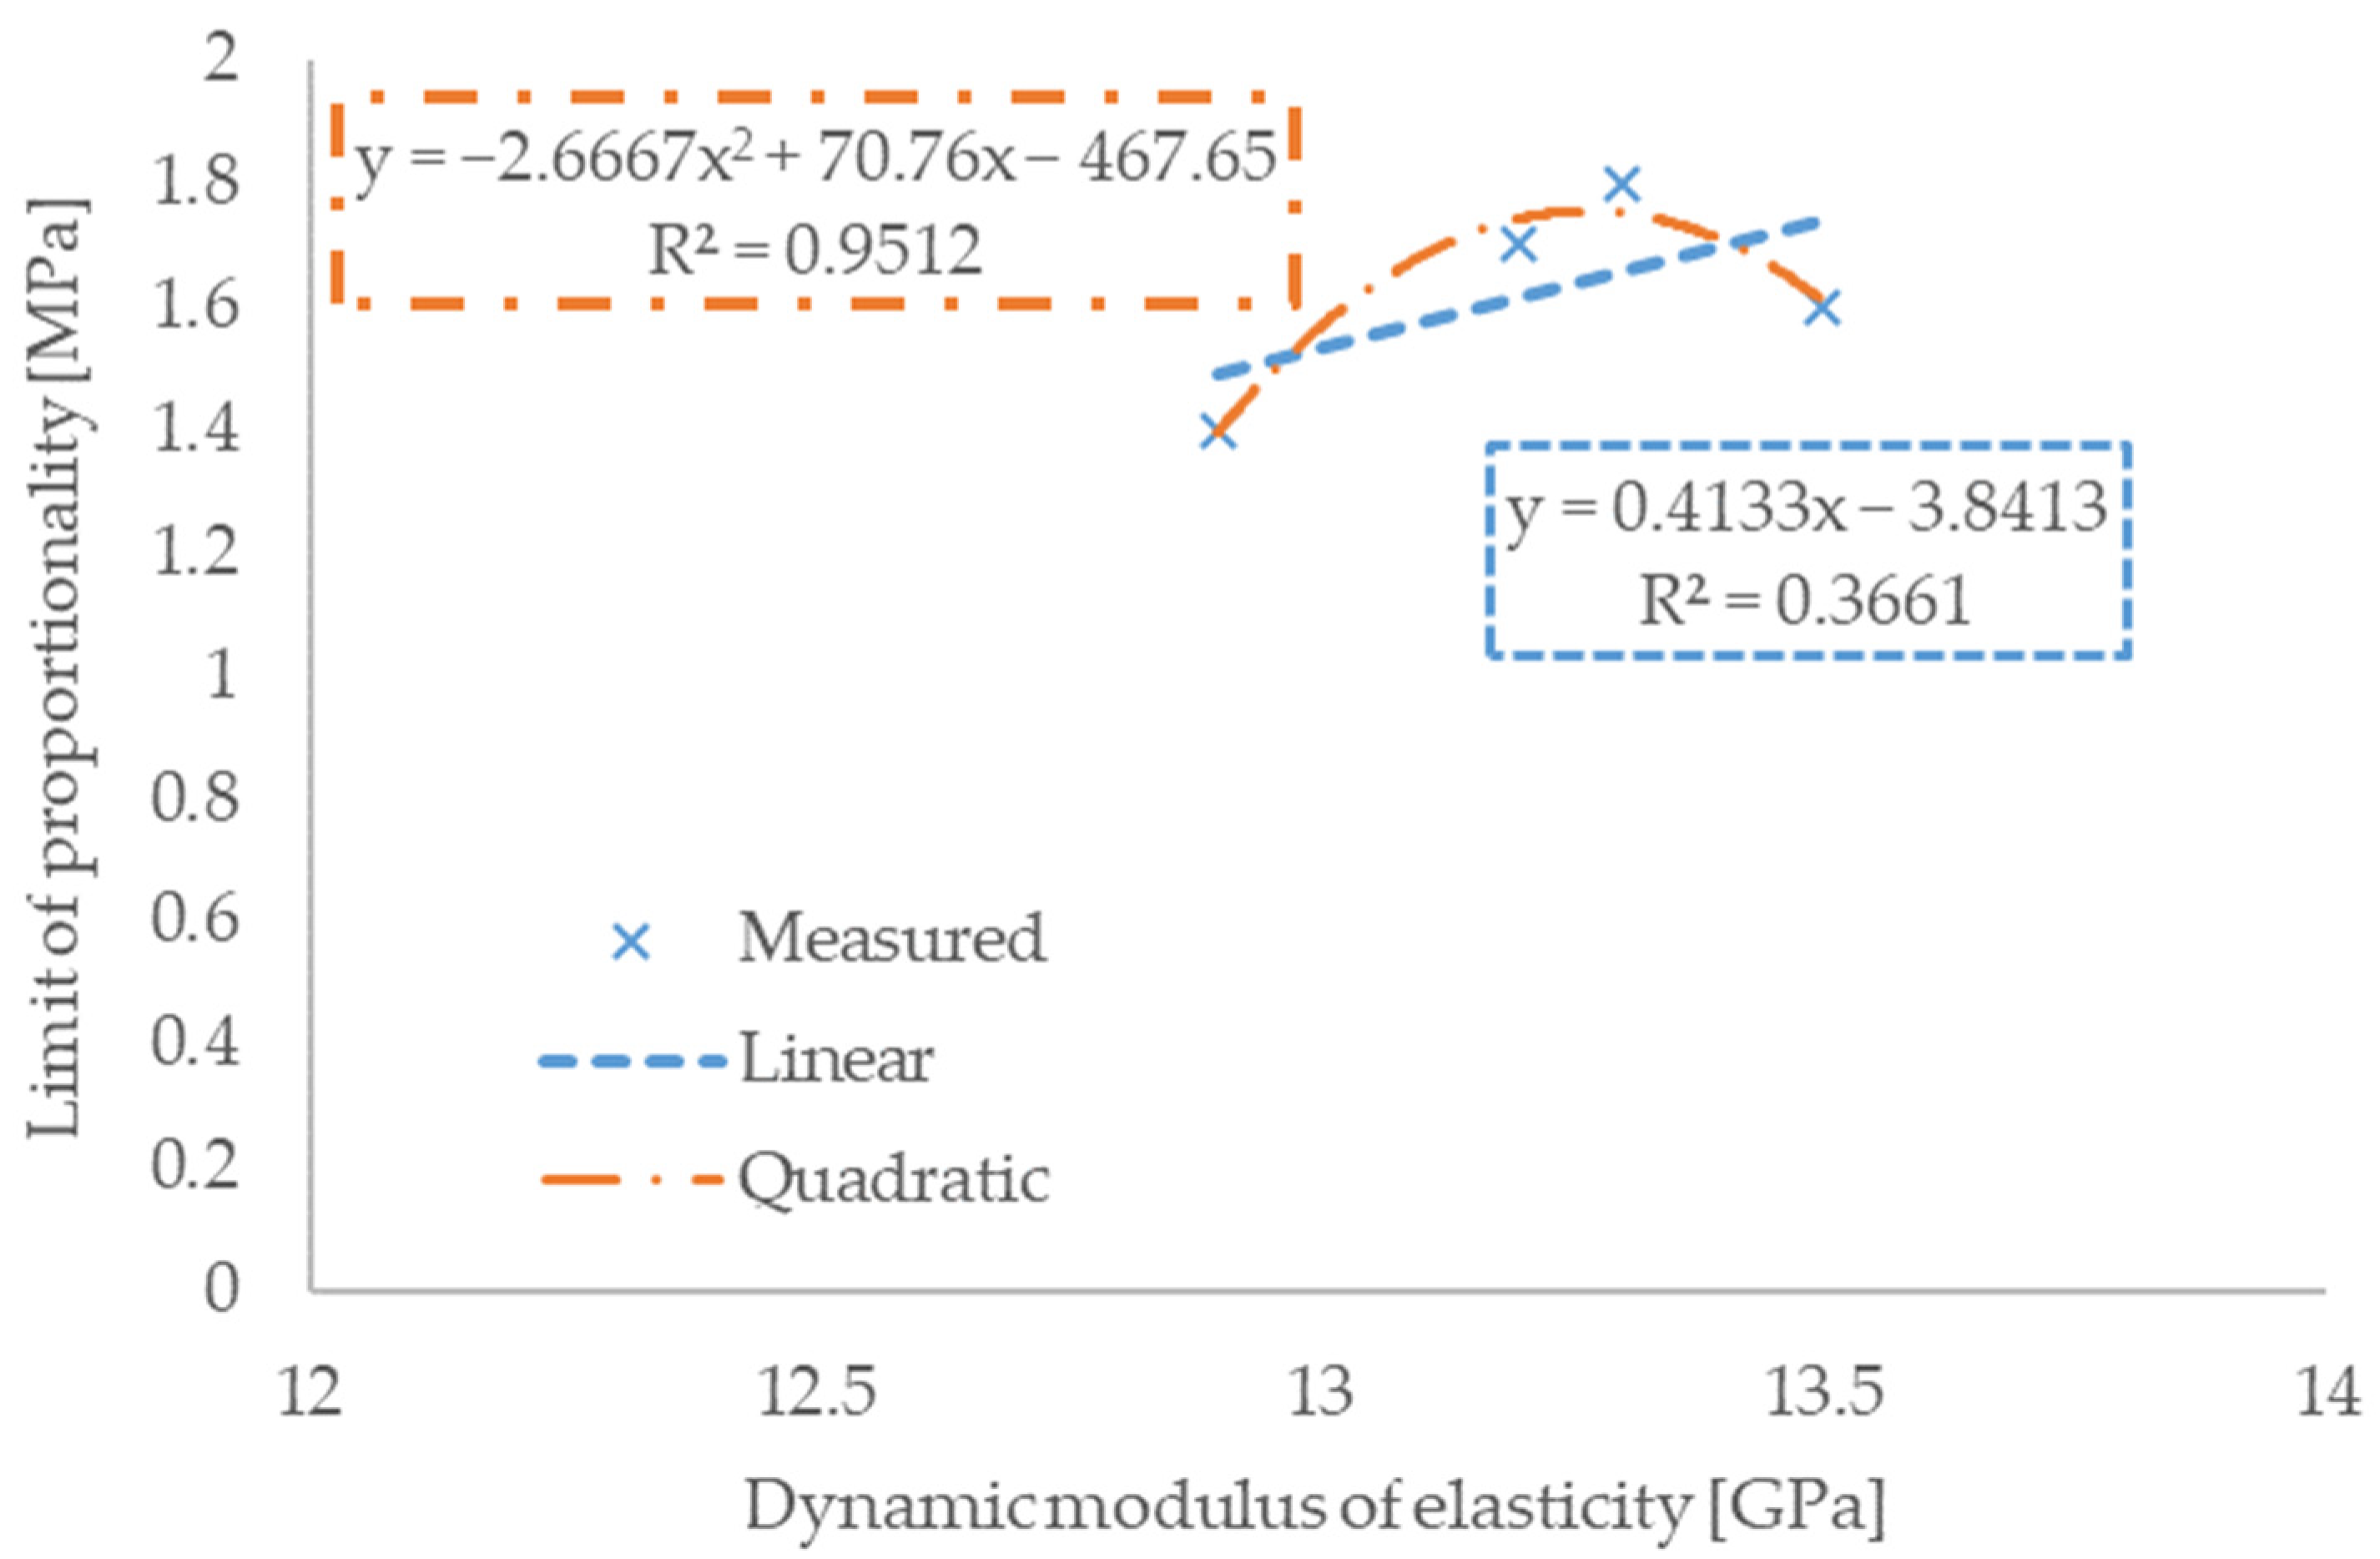
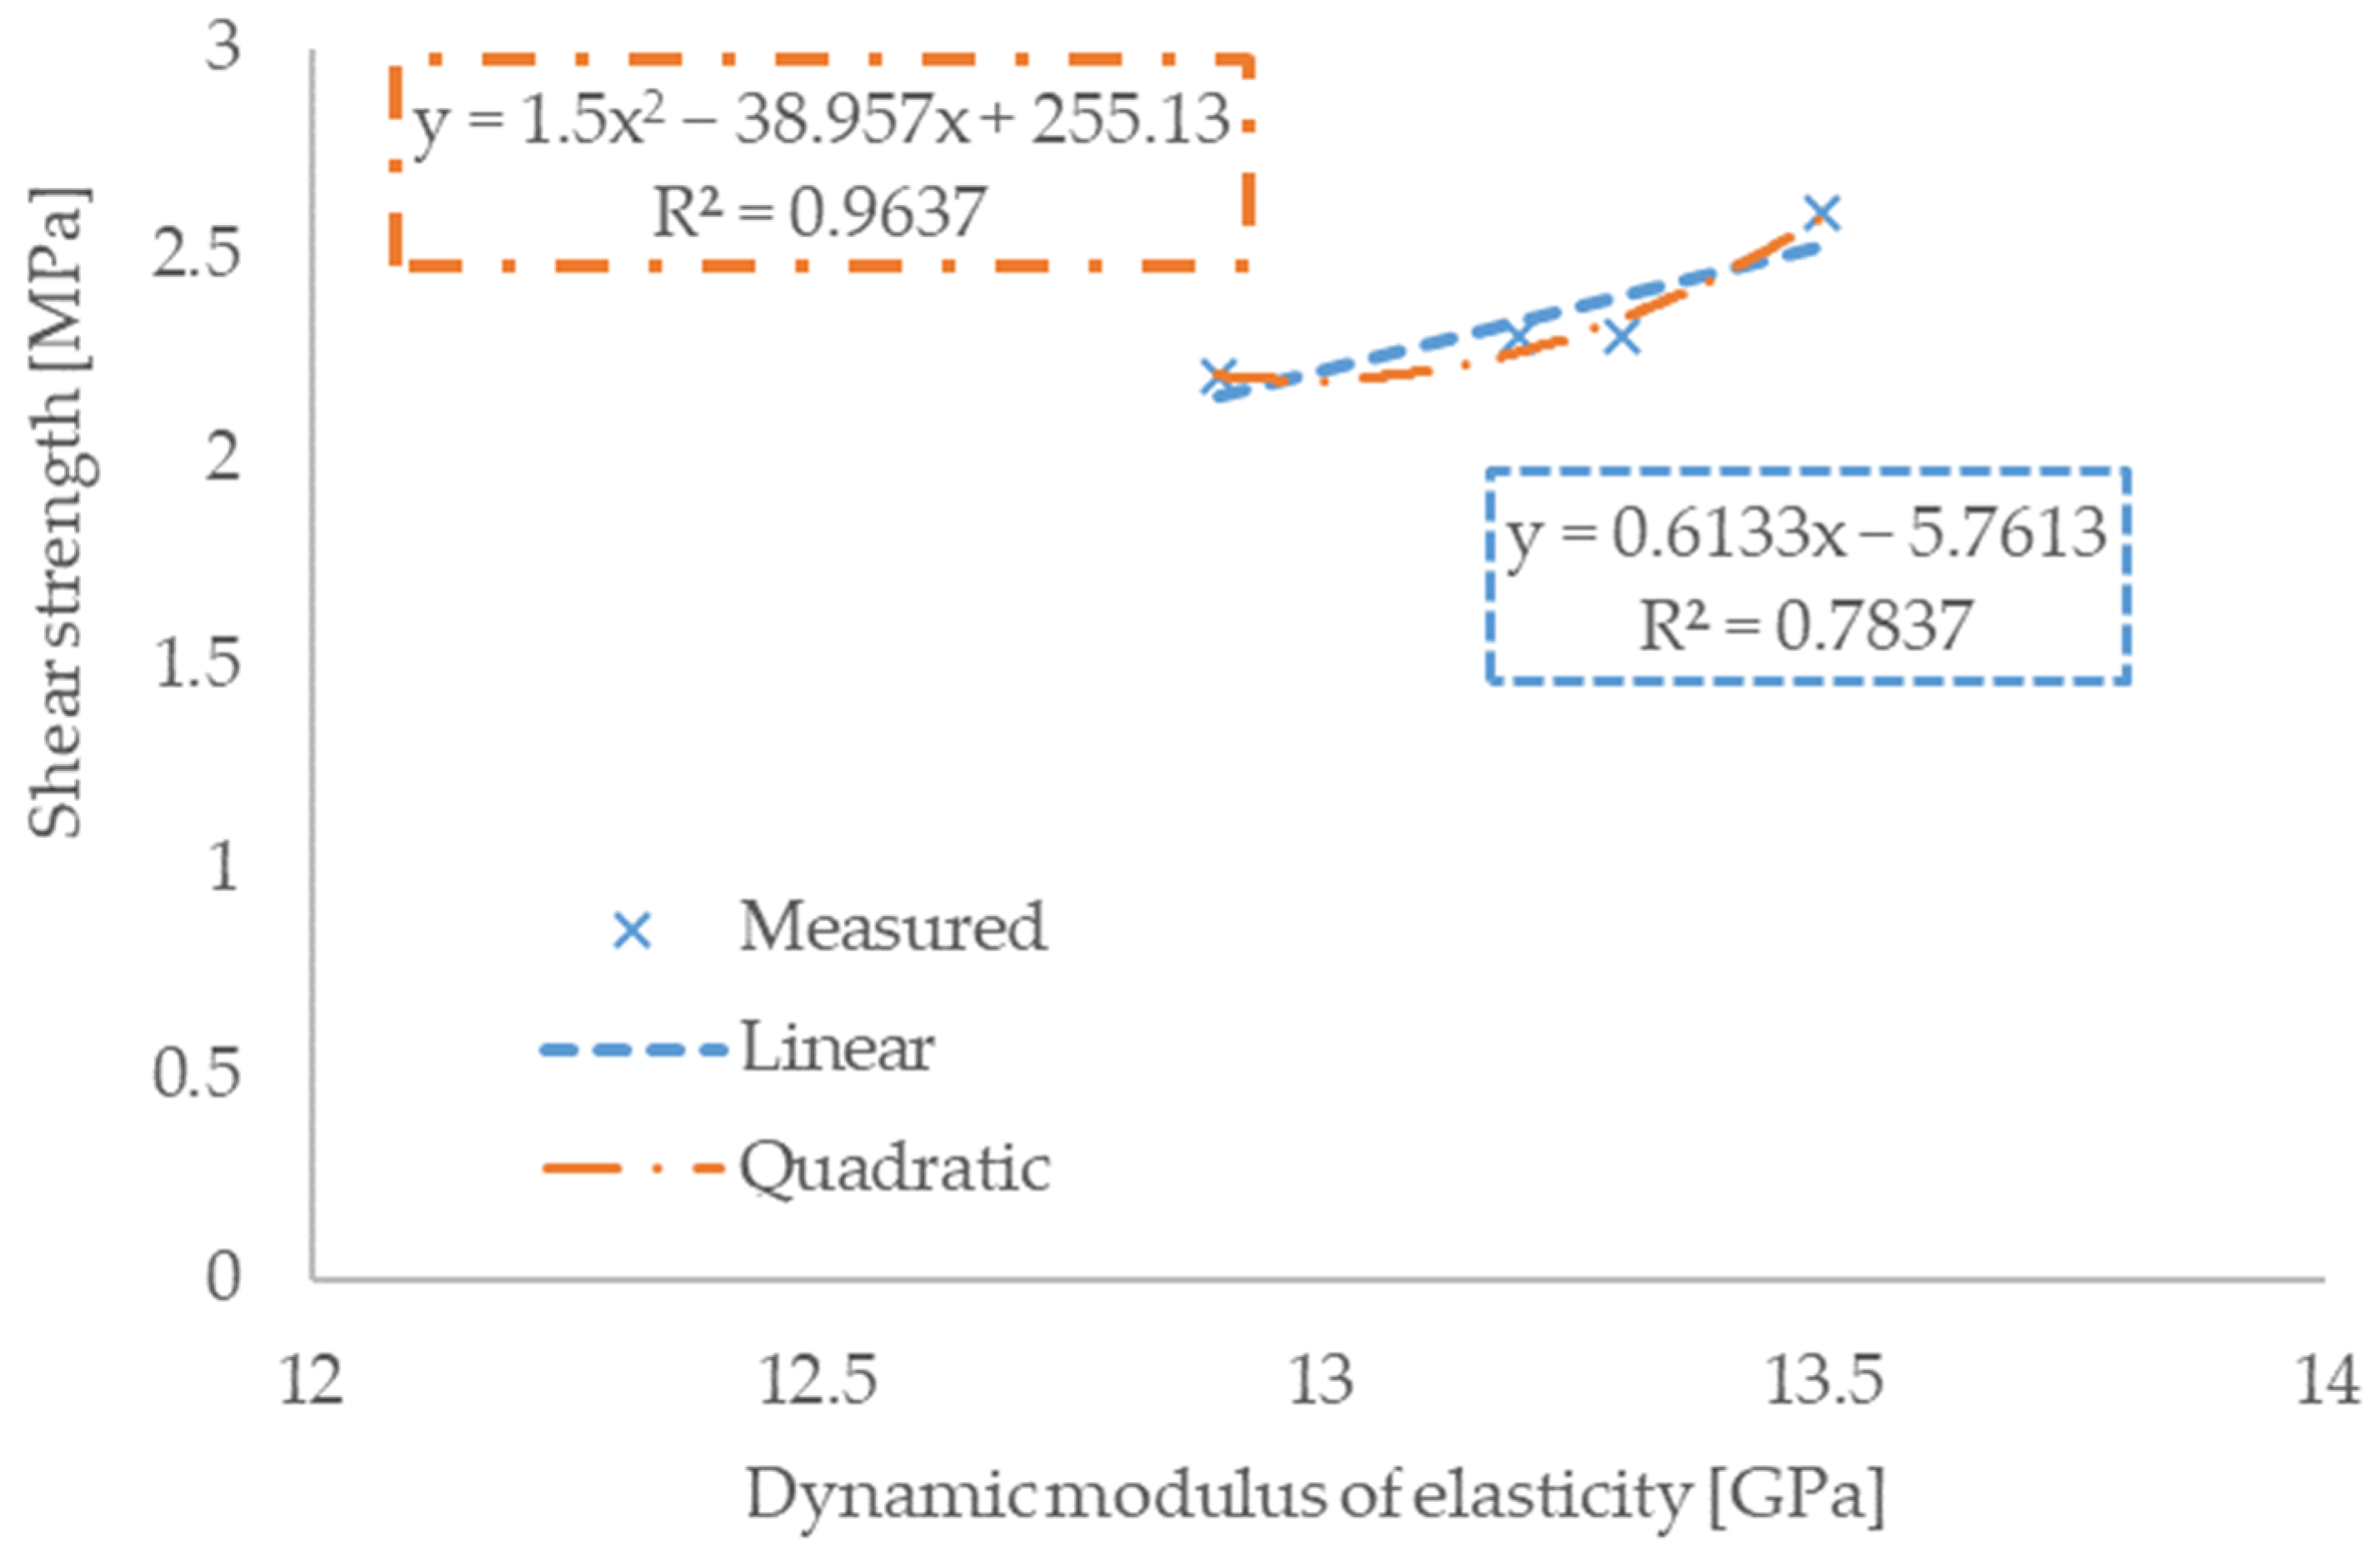
3.2. DT Results vs. Dynamic Modulus of Elasticity

Linear and quadratic equations were prepared to obtain appropriate regression curves. The coefficients of determination were calculated for all pairs. In Figure 3, Figure 4, Figure 5, Figure 6 and Figure 7, the results for the dynamic modulus and all the parameters from destructive methods are depicted.
Figure 3 shows that the relationship between the dynamic modulus and the cubic compressive strength has low goodness of fit in linear regression. However, when the quadratic relationship was applied, the result of the fit of the coefficient of determination is 0.82. This value shows significant goodness of fit in the quadratic equation.
On the contrary, the results in Figure 4 clearly show that the linear regression between dynamic modulus and splitting tensile strength shows a high agreement on the level of 0.91. Even though the quadratic equation is 5% better for this pair of parameters, it is not necessary to use it in numerical modelling.
The expected and appropriate results can be observed in Figure 5, which shows the relationship between the dynamic and static modulus of elasticity. The linear regression by itself shows the goodness of fit value on the level of 0.91. Based on these results, it can be confirmed that the non-destructive method using the ultrasonic velocity measurement is suitable for obtaining the values of static elastic modulus for this type of waste aggregate concrete, which has been already a well-established fact for ordinary concrete mixtures.
Interesting results are shown in Figure 6, where a very low goodness of fit for the linear regression between the dynamic modulus and the limit of proportionality can be observed. After applying the quadratic regression, the agreement is at the level of 0.95. This is an interesting result mainly because the dynamic modulus shows the plastic properties and the limit of proportionality; on the other hand, it determines the largest stress, which is directly proportional to the strain. Thus, these two parameters behave differently at higher values of the amount of fibre.
Shear strength was chosen as the last parameter for the analysis of correlation with the dynamic module. In Figure 7, a relatively high agreement can be seen even in the linear regression, but at the level of quadratic regression, the agreement value is more than 0.96.

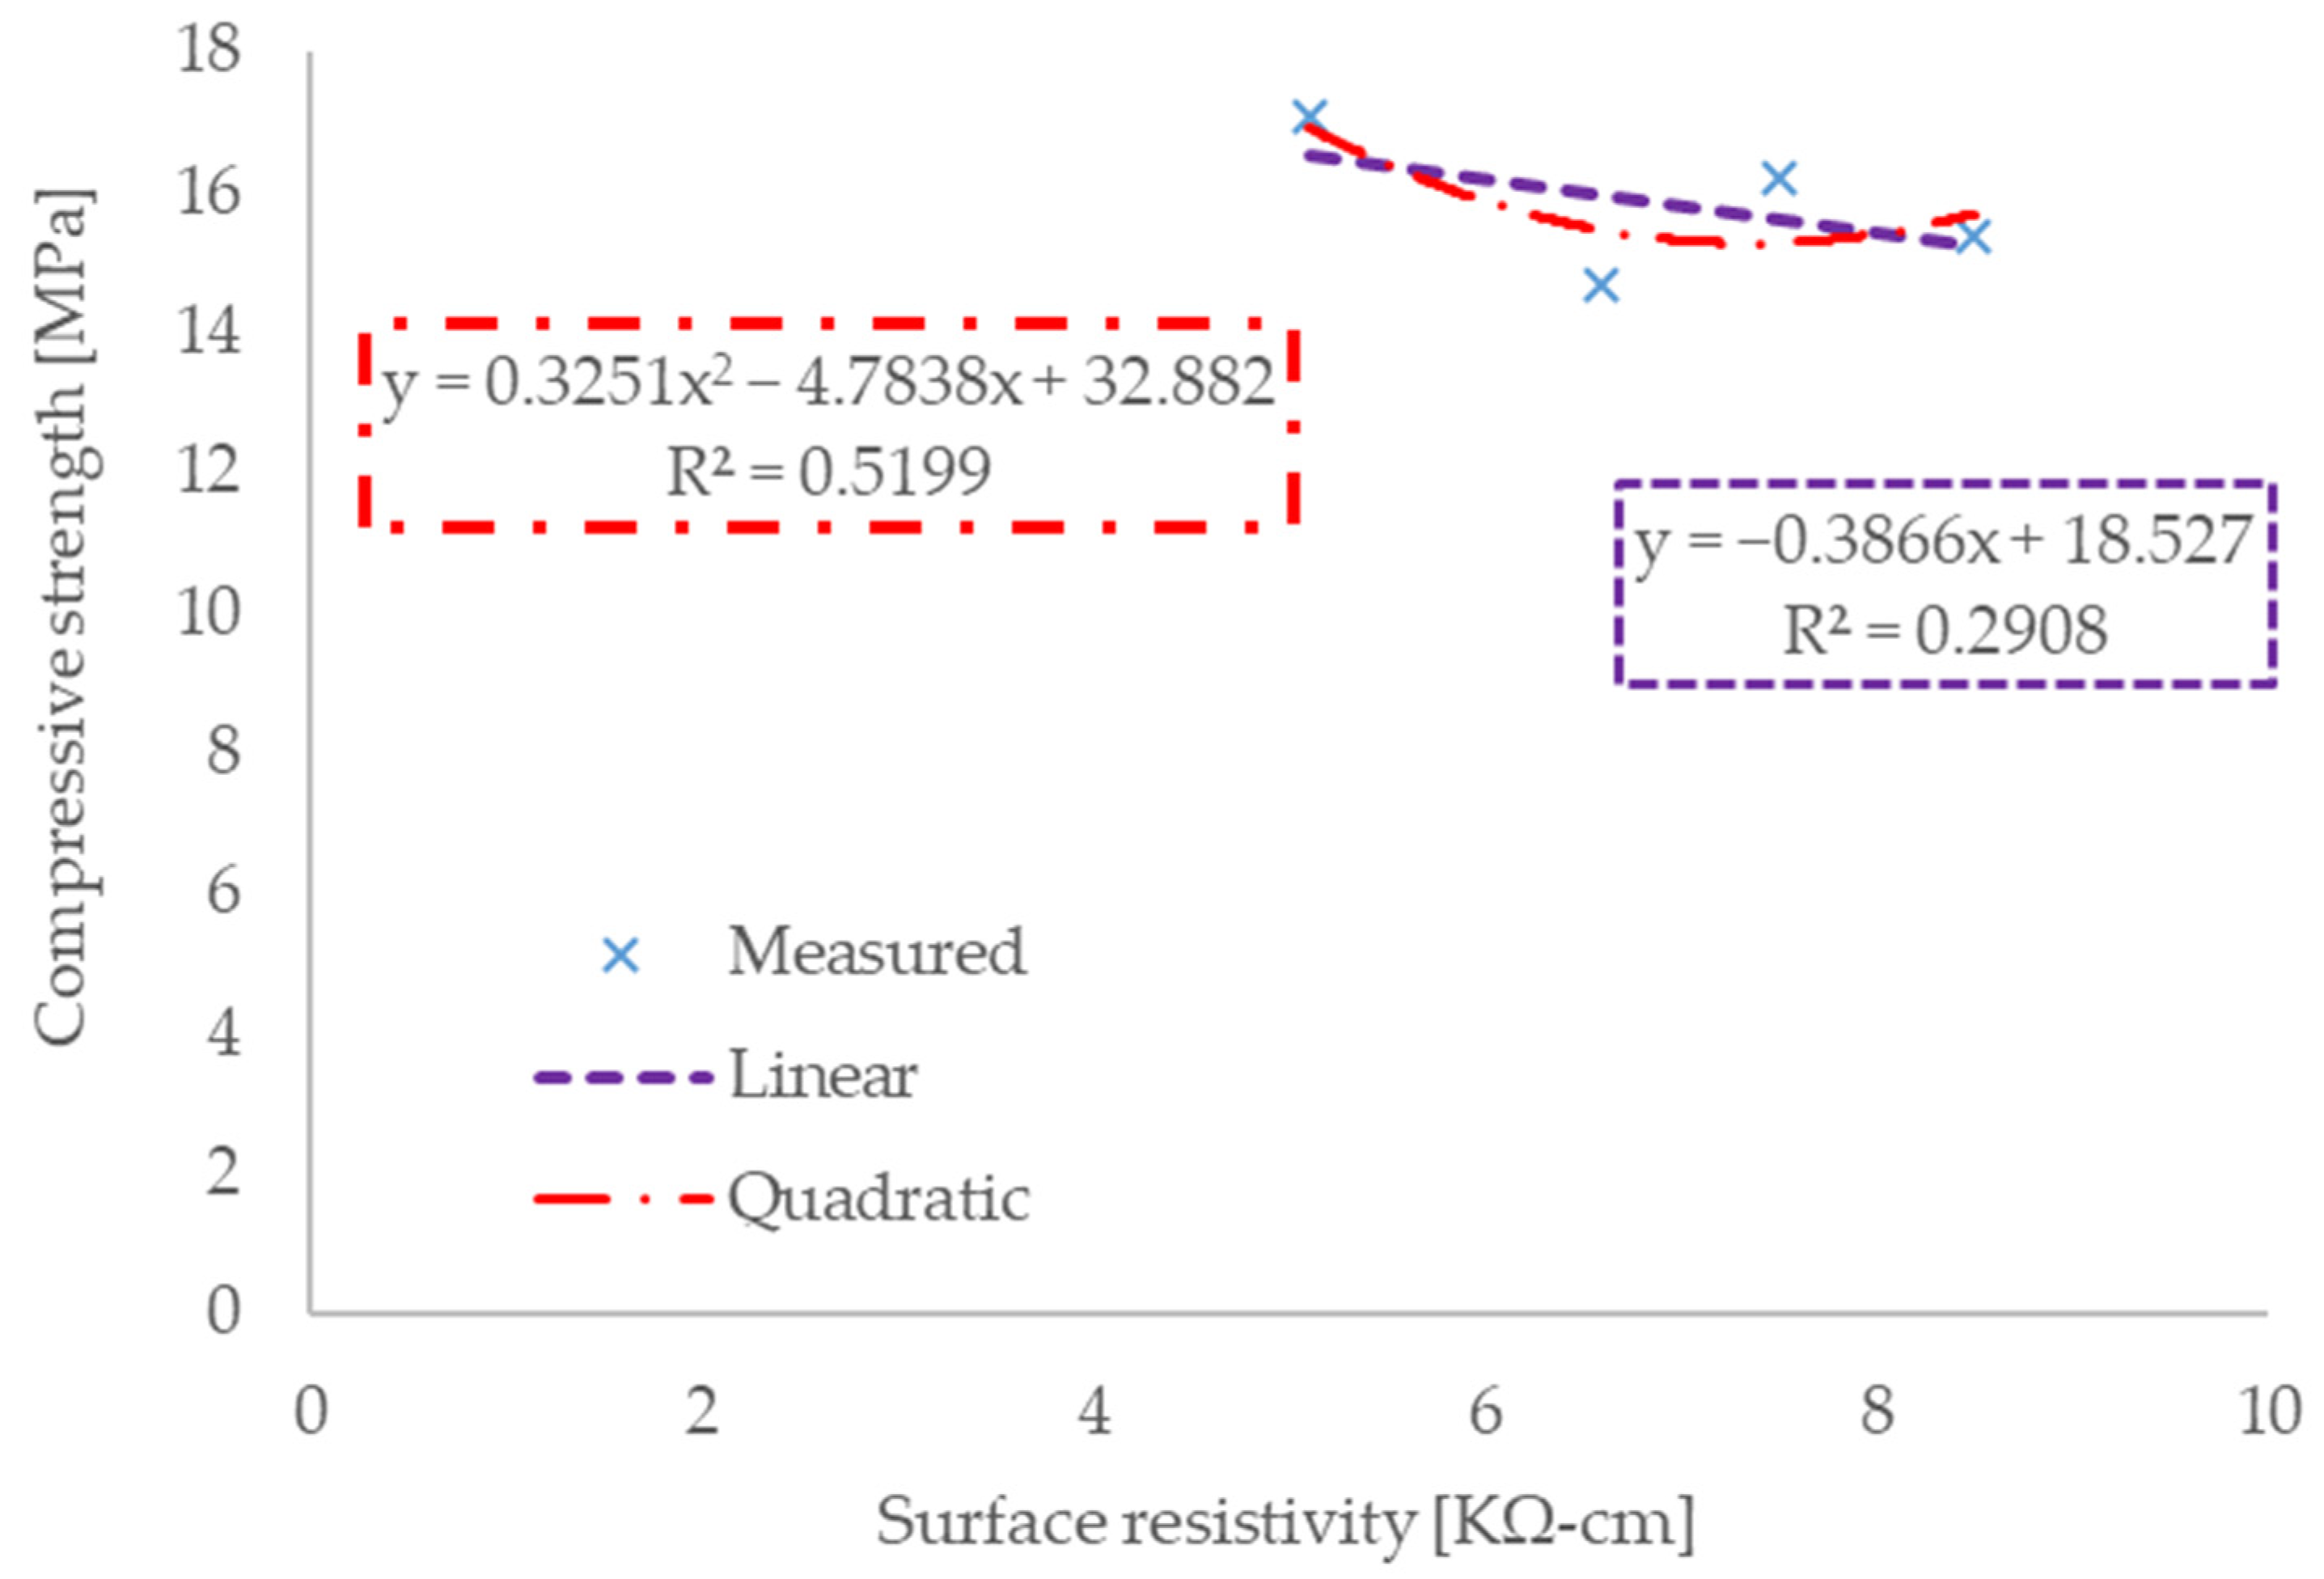
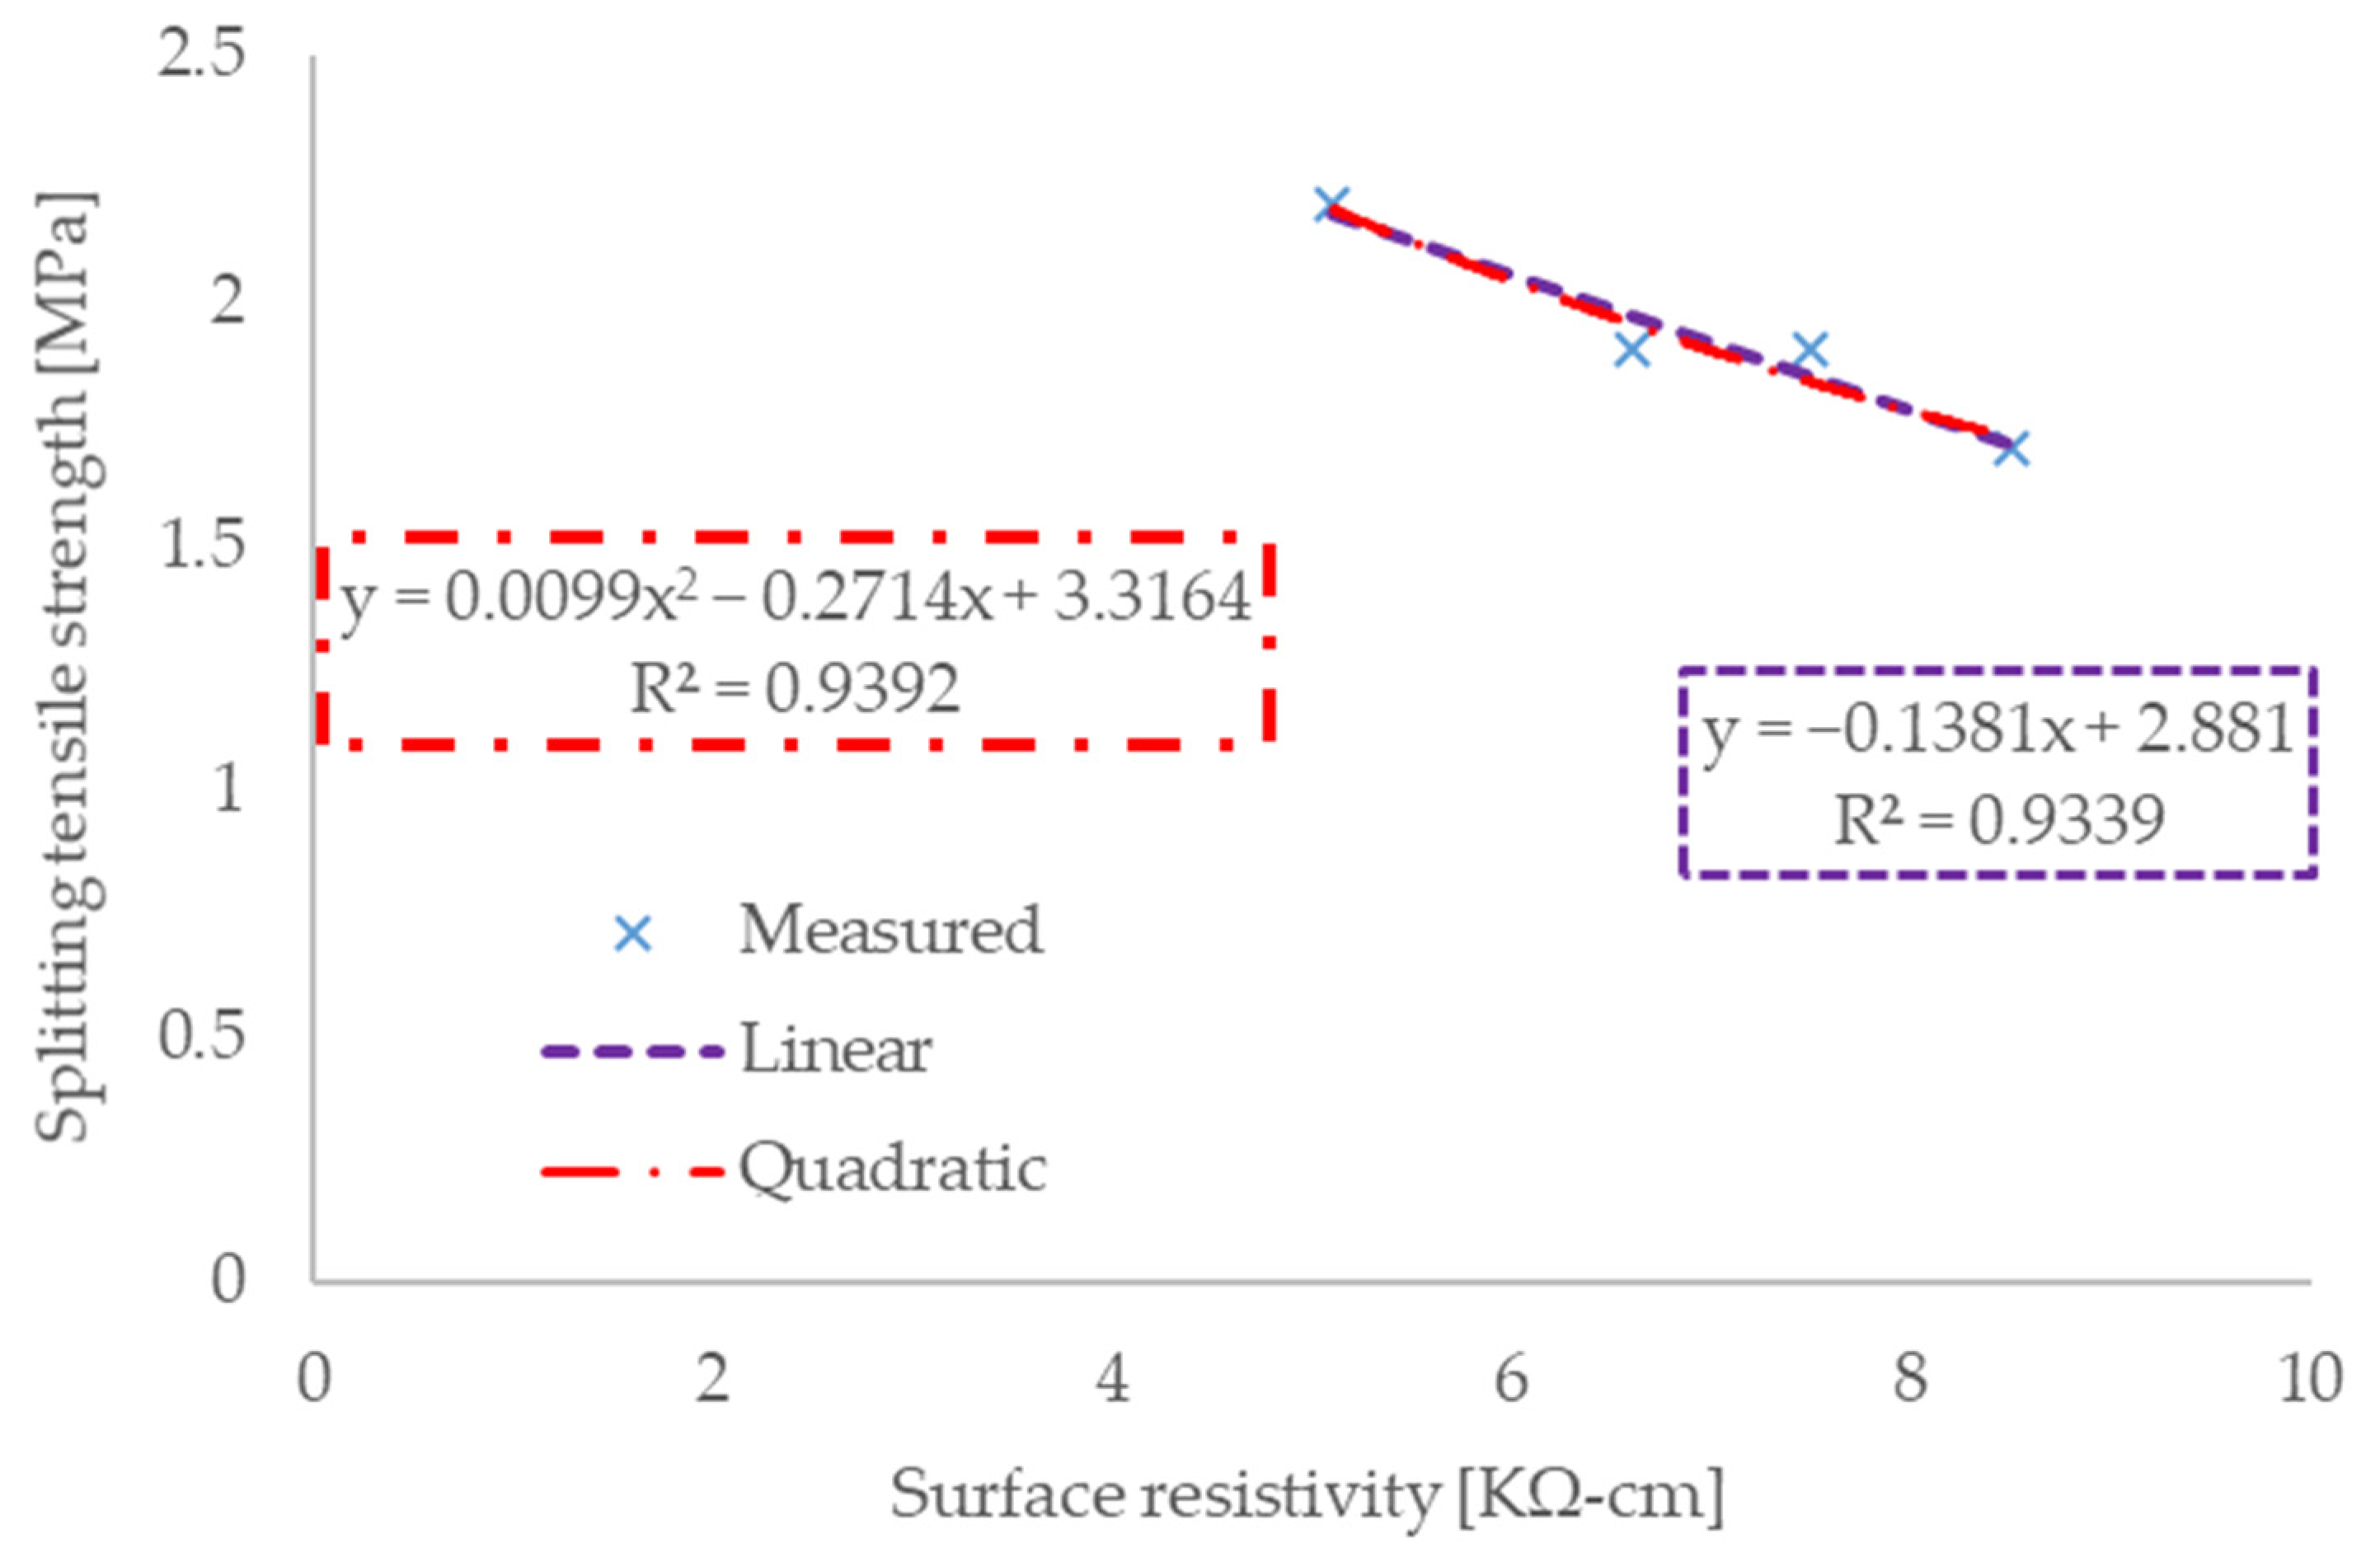
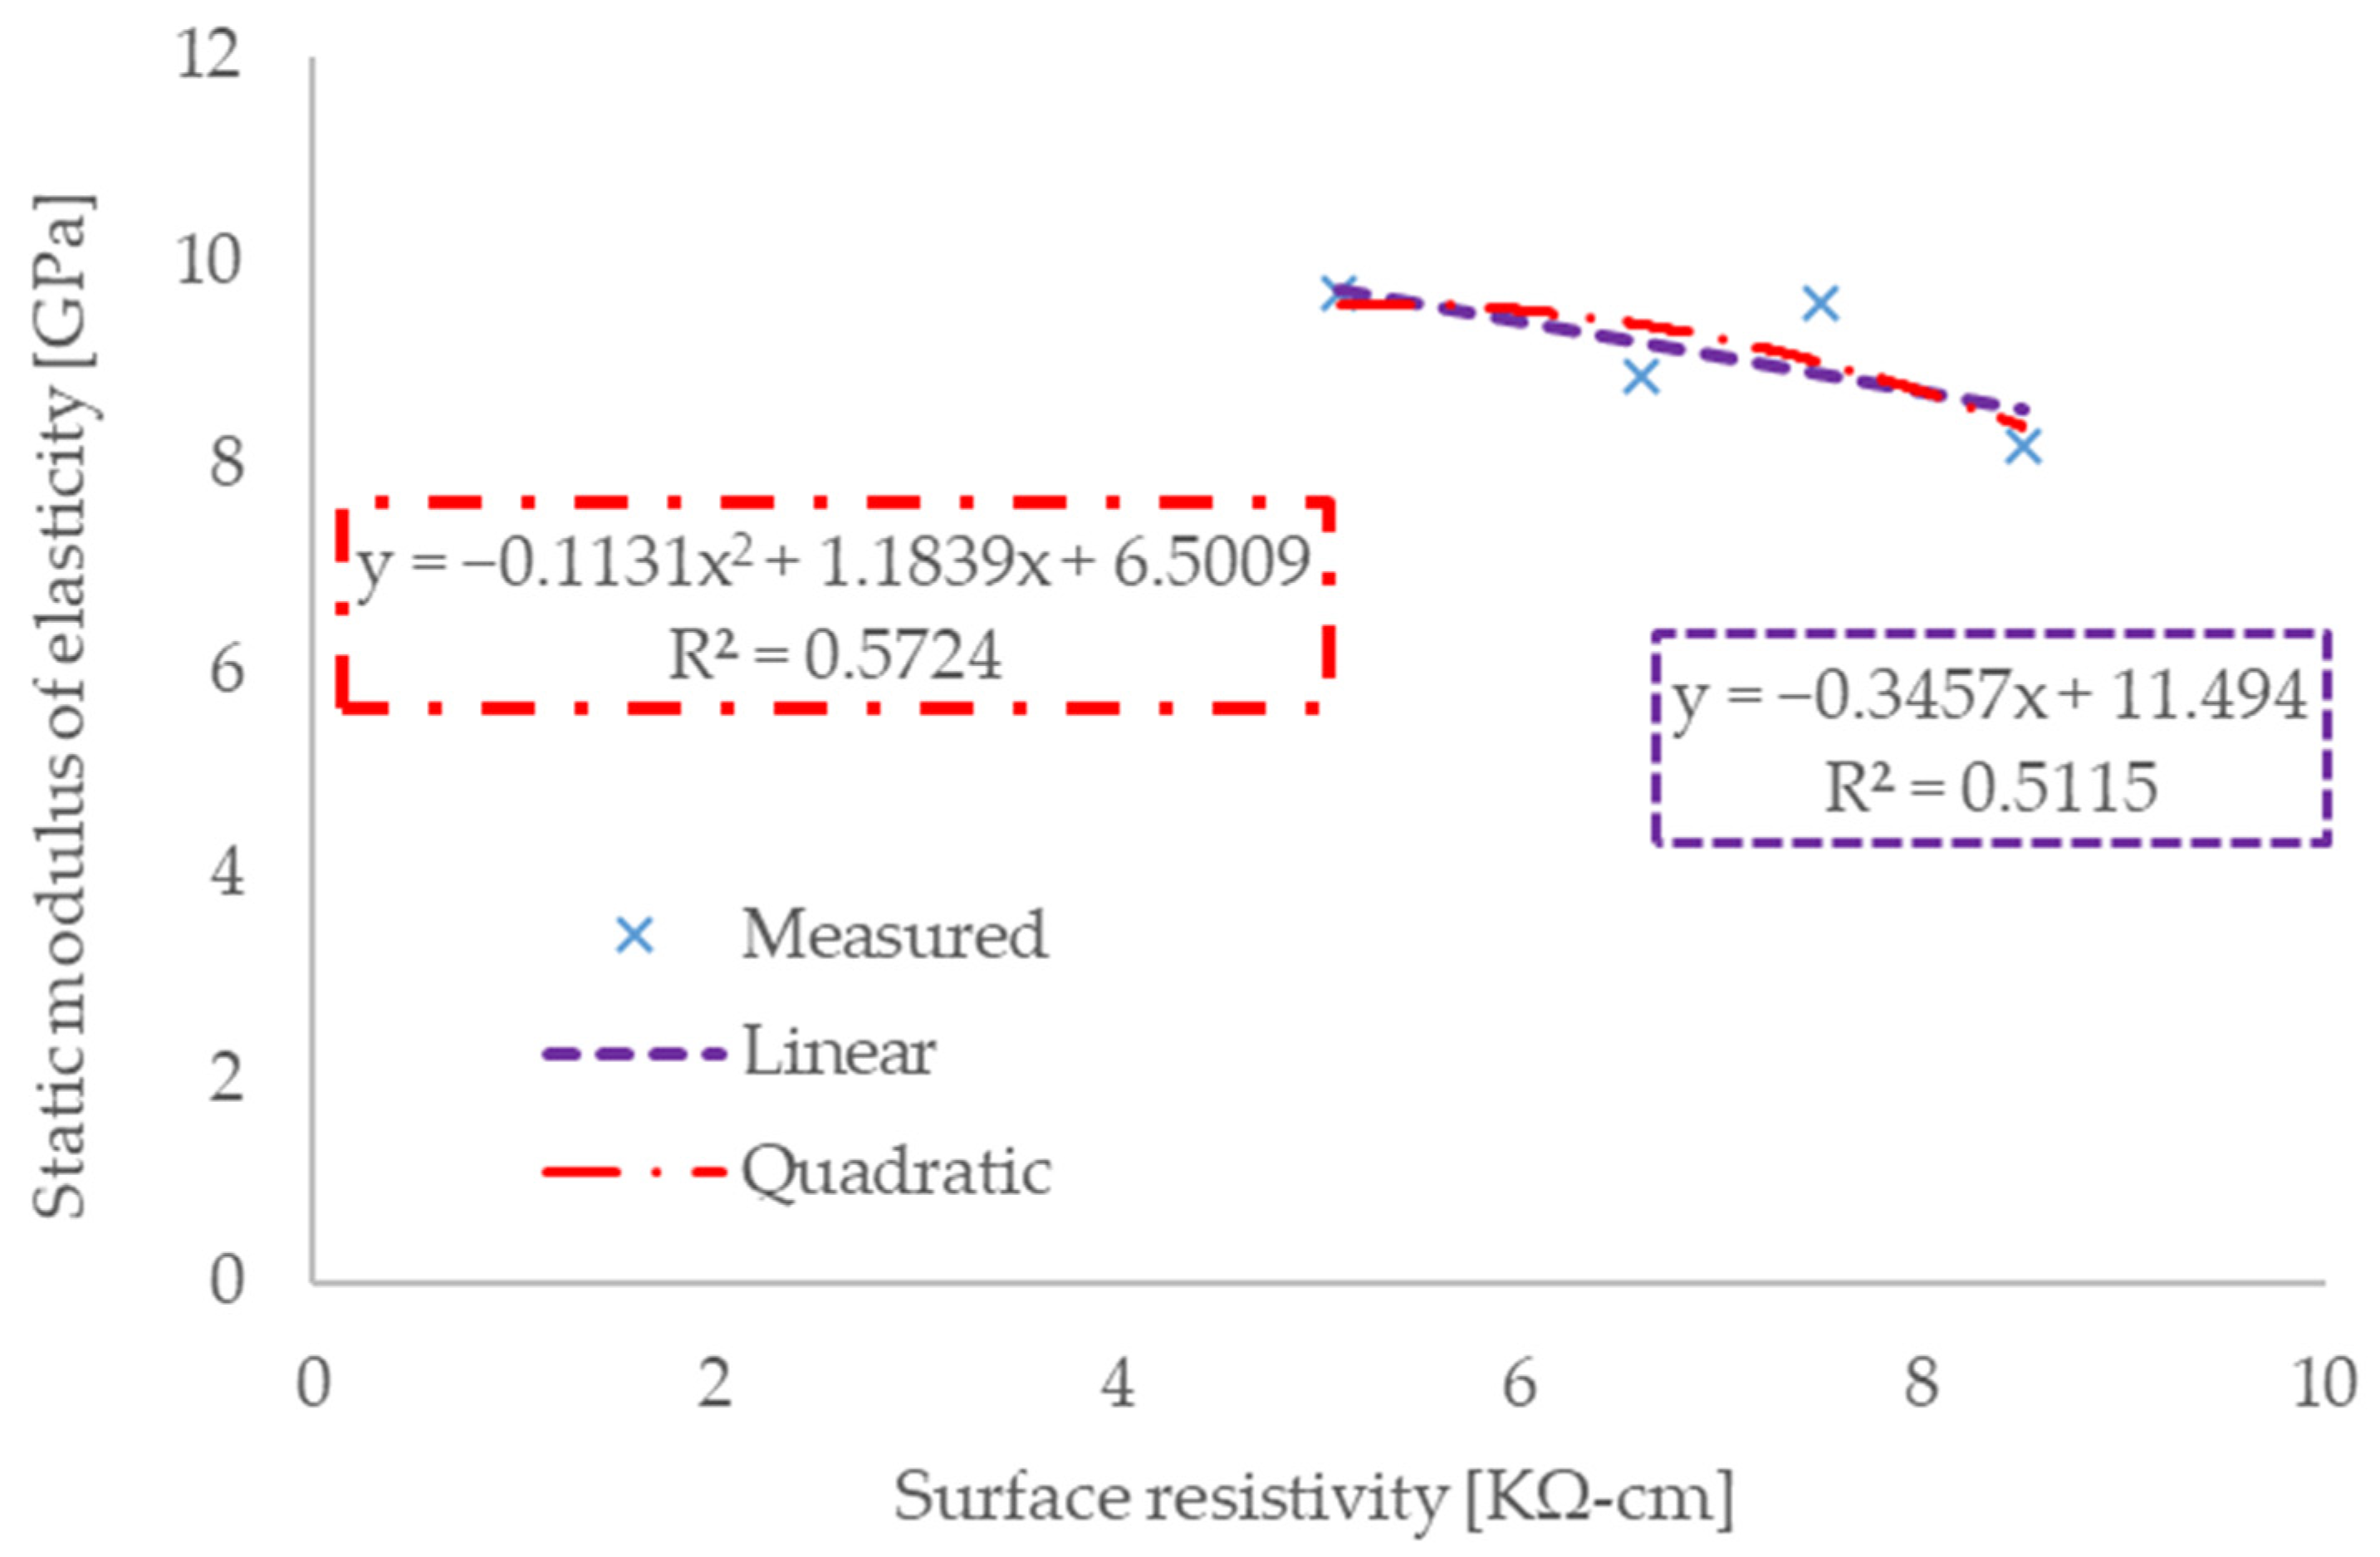
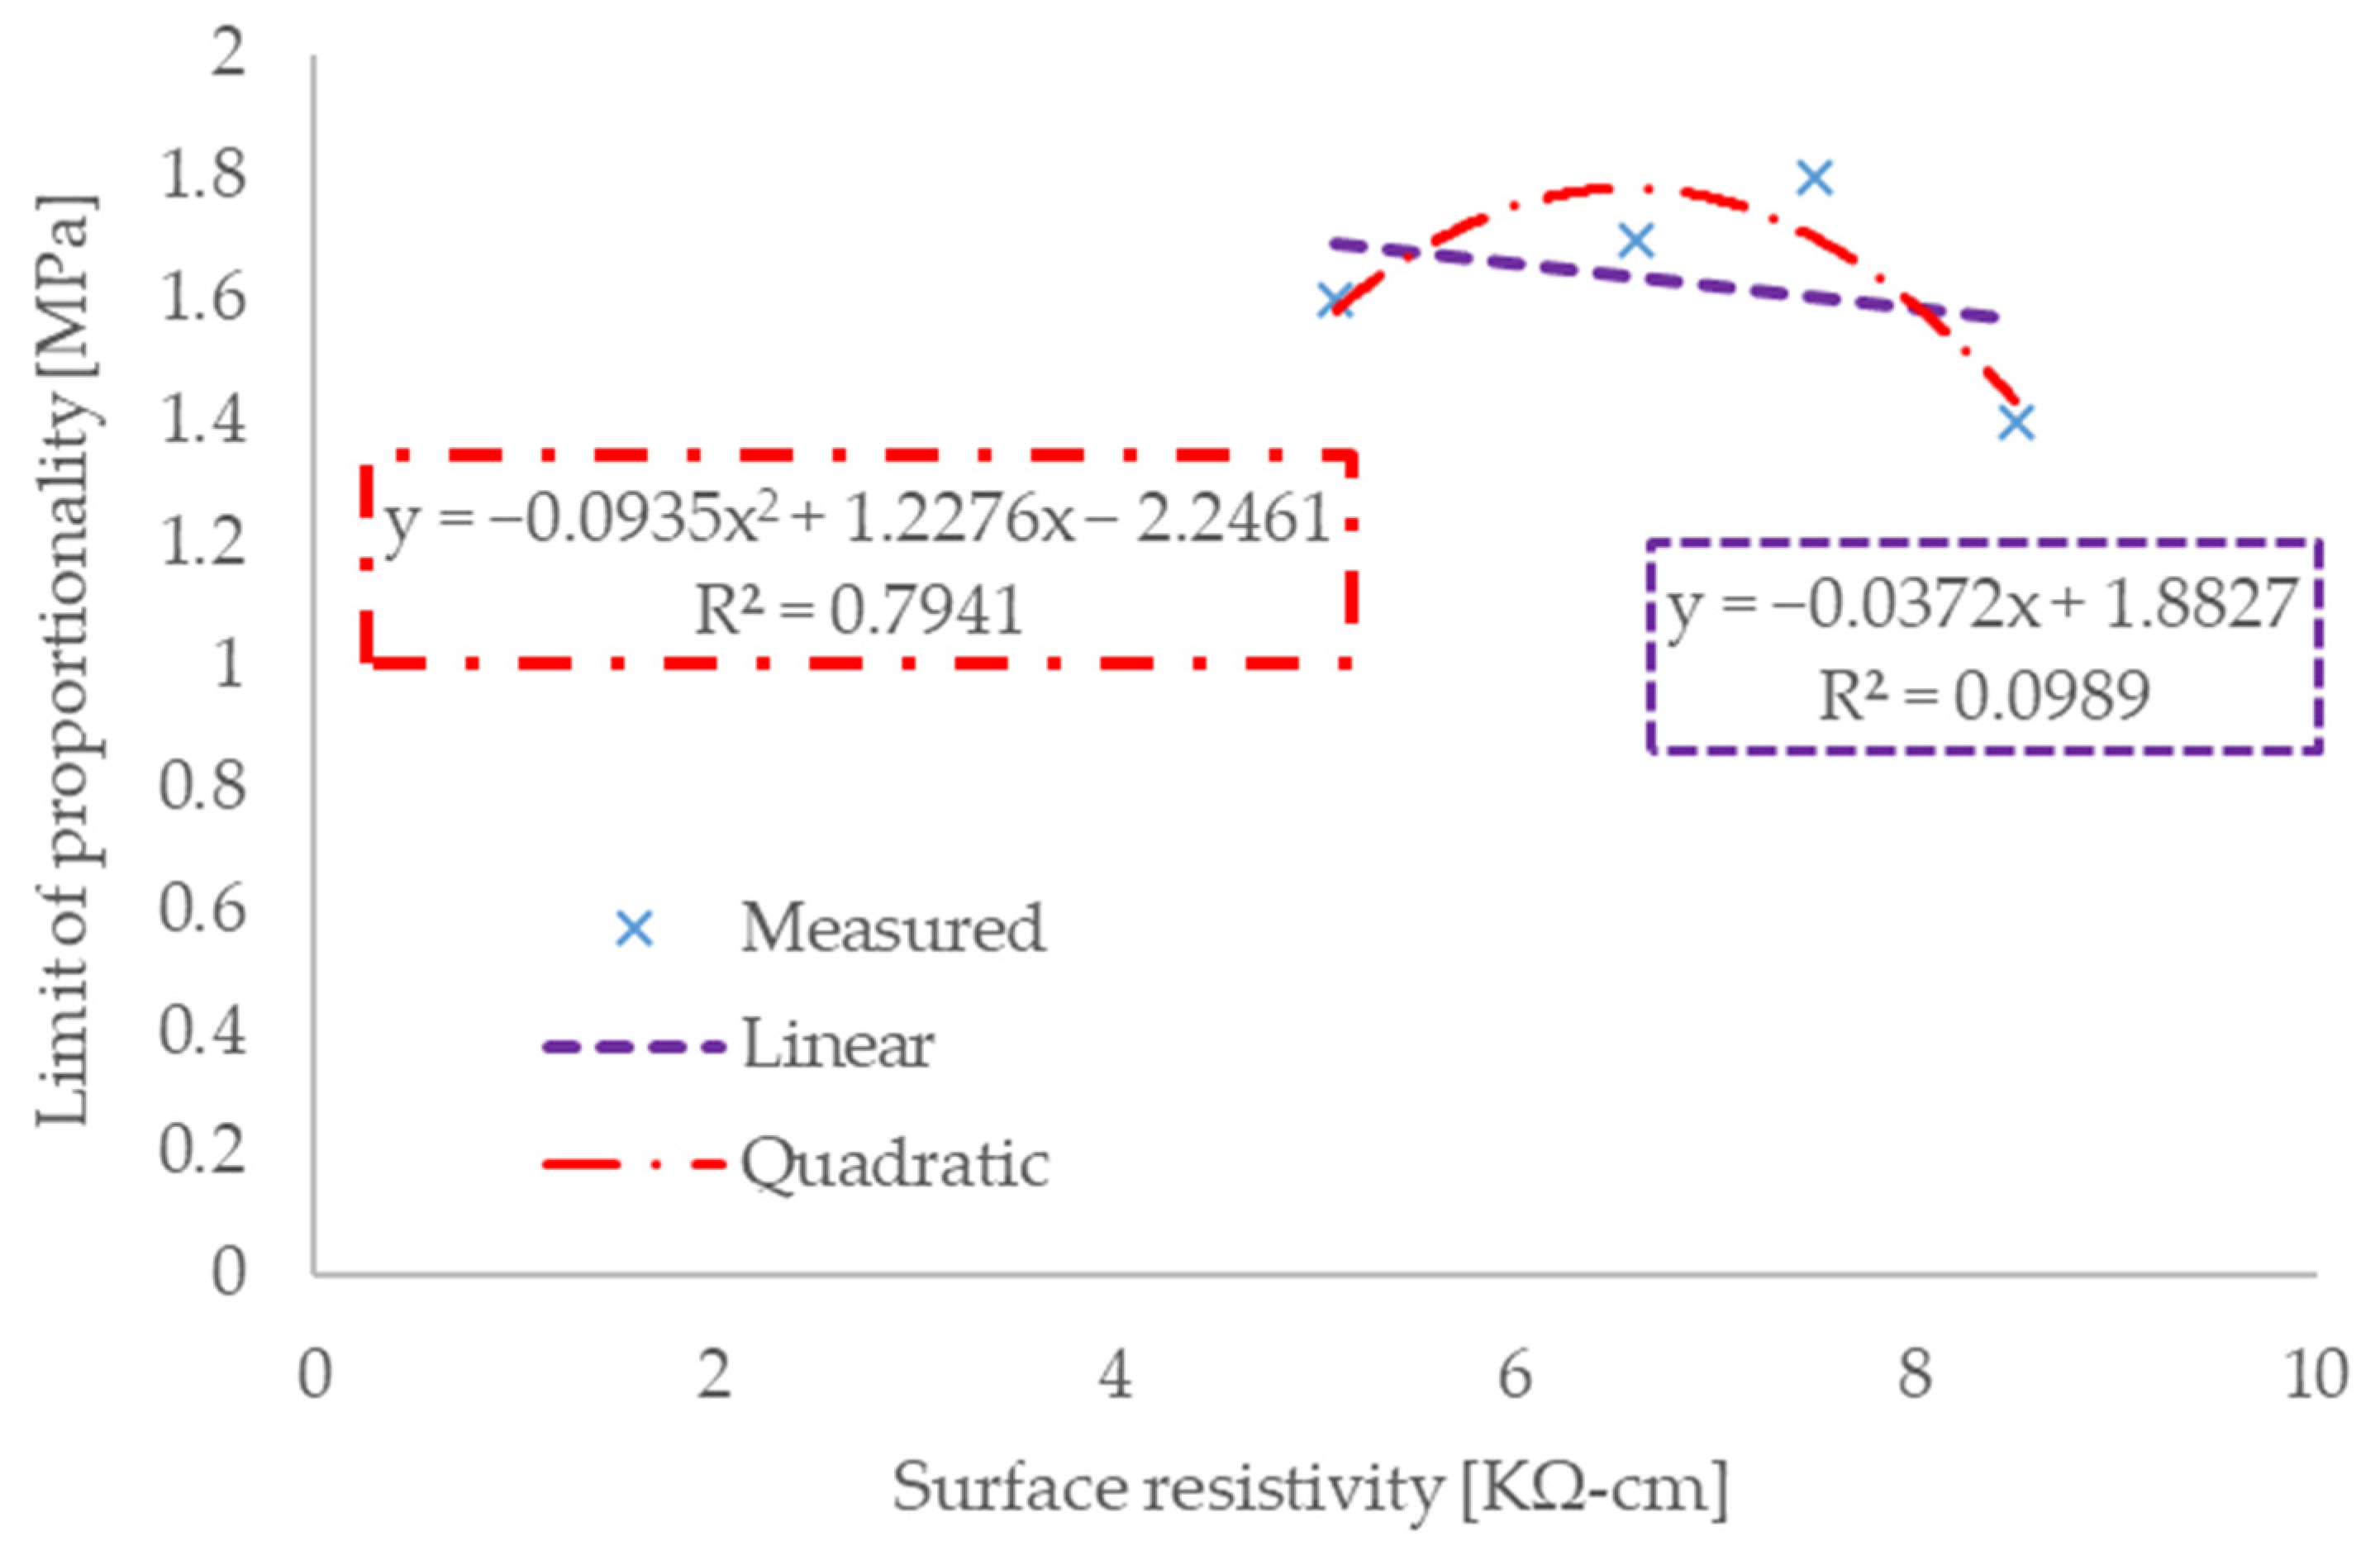
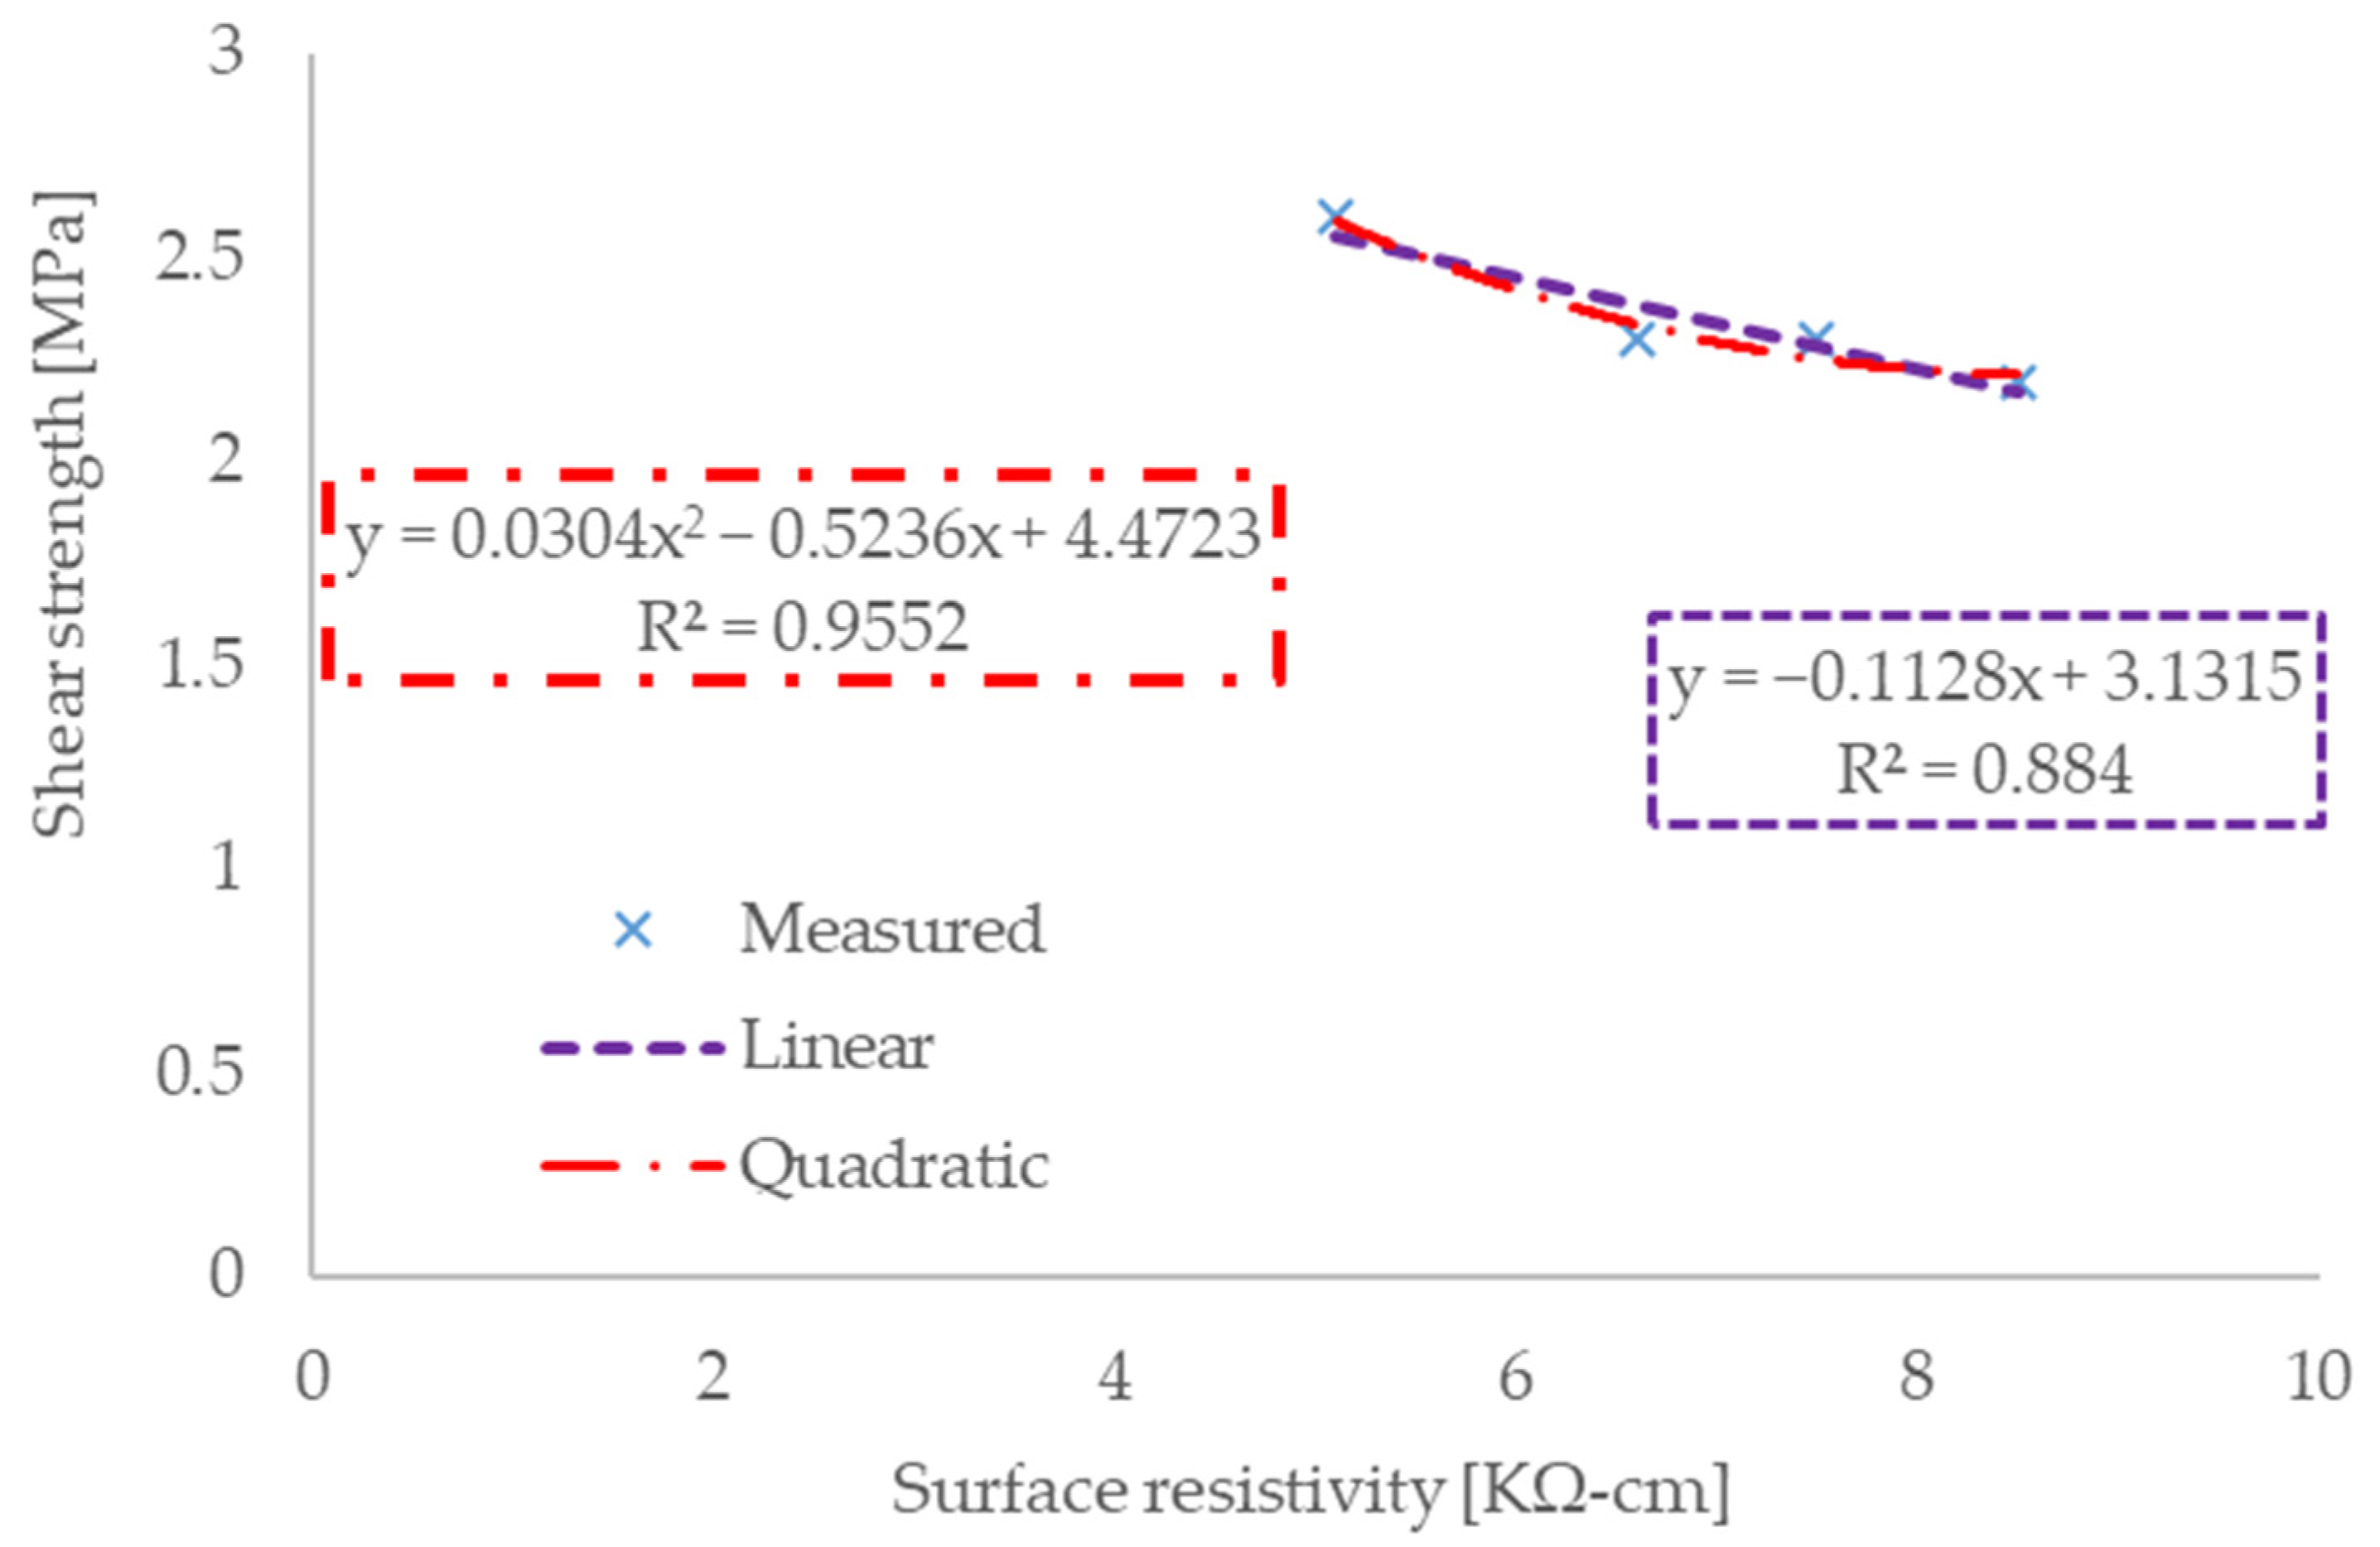
3.3. DT Results vs. Electrical Resistivity

The second part of the presented correlation analysis was related to the surface electrical resistivity and other DTs. The results in Figure 8 show a low correlation between electrical resistivity and cubic compressive strength. The amount of fiber was expected to have a different effect on the electrical conductivity and strength of the concrete.
Figure 9 shows the relationship between electrical resistance and splitting tensile strength. Both of these parameters are highly dependent on the amount of fibre and therefore a high linear regression can be observed. The quadratic regression equation is then not appropriate as it shows almost the same fit. Conversely, for the resistivity and static modulus relationships shown in Figure 10, a low agreement can be seen for both linear and quadratic regression.
In the case of the relationship of electrical resistivity and limit of proportionality, interesting results were observed, as well as in the case of a relationship with the dynamic modulus of elasticity, which is shown in Figure 11. Due to the progression of the limit of proportionality values, linear regression is not appropriate since the value of the coefficient of determination is almost zero. However, when the quadratic curve is applied, the coefficient of determination is 0.79, which is a high value, and some correlation can be inferred.
The last result of the analysis presented is the relationship between the electrical resistivity of the surface and the shear strength (see Figure 12). Both of those parameters should be affected by the amount of fibre similarly. This is also shown by the results of the linear regression, which has a goodness of fit at a level of 0.88, and the quadratic regression, which has a goodness of fit of 0.95.

4. Discussion

In assessing the appropriate description of the relationship between parameters obtained by destructive and non-destructive methods, it is necessary to clearly identify the advantages and disadvantages of such procedures. Non-destructive methods are suitable for long-term and time-dependent measurements of existing structures and have the advantage of being cost-effective, economical, and relatively easy to implement. On the other hand, for numerical models that are used to assess the durability of reinforced concrete structures, it is necessary to obtain accurate and unencumbered results.
The values of the coefficient of determination for all analysed pairs are presented in Table 3. It was found that in the case of evaluating concrete made of WRCFA with different amounts of steel fibre, some non-destructive methods can be used advantageously to derive other parameters.
The dynamic modulus of elasticity defined by the ultrasonic velocity can be well correlated by linear regression with splitting tensile strength and static modulus of elasticity. For other parameters, such as compressive strength, the limit of proportionality and shear strength, quadratic regression is suitable and shows a high degree of agreement.
Surface resistivity shows higher variability and hence lower agreement for some parameters. With compressive strength or static modulus of elasticity, there is no appropriate correlation at any level, but the relationship of splitting tensile and shear strength and the electrical resistance has a high value of the coefficient of determination already in the case of linear regression. With the limit of proportionality, the quadratic equation might be used.
In the research [53] studying the correlation between the volumetric and surface resistivity of concrete and other parameters [48], evidence was presented that alternative concrete constituents influence the results of surface electrical resistivity. The results presented in this contribution have also demonstrated these findings. In another study where the authors evaluated the relationship between compressive strength and electrical resistivity [54], it was found that it is difficult to describe the regression curves mathematically. Other interesting results were presented by the authors of the study on surface resistance and ultrasonic velocity of concretes with geopolymer [55]. The results showed a correspondence that is also possible for other parameters of reinforced concrete. This finding agrees with the results presented in this paper.

5. Conclusions

The article showed the results of different methods of experimental testing of non-traditional concrete from recycled aggregate and mainly statistically analysed them. The research aimed to present the use of simple correlation and regression analysis methods in terms of the influence of the composition of the fibre reinforced concrete on the mathematical description. Not all mechanical properties are directly proportional to the amount of fibre. It cannot be clearly stated that the amount of fibre has no effect on the resulting correlations, and therefore this effect must be always taken into account. The relationships between DTS and NDT in the period after 28 days of concrete cure proved the following conclusions:
  • The dynamic modulus of elasticity defined by the ultrasonic velocity has correlated by linear regression with splitting tensile strength and static modulus of elasticity.
  • Compressive strength, the limit of proportionality and shear strength report a high quadratic regression with a dynamic modulus of elasticity.
  • Surface resistivity shows higher variability and hence lower agreement for some parameters.
  • In the case of compressive strength or static modulus of elasticity, there is no appropriate correlation at any level; however, with splitting tensile strength and shear strength, the electrical resistance has high values of linear regression.
  • In the case of the limit of proportionality, the quadratic equation in relation to electrical resistance can be used.
  • Some NDT methods can be used as an alternative to destructive methods, but more in-depth analysis is needed, especially when using new types of material as a replacement for conventional ingredients of concrete.
It should be noted that four points obtained from the averages of the measurements were used for each evaluation, which reduces the accuracy of the best fit analysis. Further research development should also focus on the use of non-destructive testing of the surface electrical resistance and ultrasonic velocity of non-traditional concretes used for the real structures in the practice.

Author Contributions

Conceptualization, P.L. and M.H.; methodology, M.H.; software, P.L.; validation, P.L.; formal analysis, M.H.; investigation, P.L.; resources, M.H.; data curation, P.L.; writing—original draft preparation, P.L.; writing—review and editing, M.H.; visualization, P.L.; supervision, M.H.; project administration, M.H.; funding acquisition, M.H. All authors have read and agreed to the published version of the manuscript.

Funding

The research was funded by the Ministry of Education, Youth and Sports of the Czech Republic through VSB—TU Ostrava (SGS SP2022/45).

Institutional Review Board Statement

Not applicable.

Informed Consent Statement

Not applicable.

Conflicts of Interest

The authors declare no conflict of interest.

References

  1. Puertas, F.; García-Díaz, I.; Barba, A.; Gazulla, M.F.; Palacios, M.; Gómez, M.P.; Martínez-Ramírez, S. Ceramic Wastes as Alternative Raw Materials for Portland Cement Clinker Production. Cem. Concr. Compos. 2008, 30, 798–805. [Google Scholar] [CrossRef]
  2. Hammond, G.P.; Jones, C.I. Inventory of Carbon and Energy Version 1.6a; University of Bath: Bath, UK, 2008. [Google Scholar]
  3. Joint Committee for Guides in Metrology. Evaluation of Measurement Data—Guide to the Expression of Uncertainty in Measurement; International Organization for Standardization: Geneva, Switzerland, 2008. [Google Scholar]
  4. Konečný, P.; Ghosh, P.; Hrabová, K.; Lehner, P.; Teplý, B. Effective Methodology of Sustainability Assessment of Concrete Mixtures. Mater. Struct. Mater. Constr. 2020, 53, 98. [Google Scholar] [CrossRef]
  5. Collivignarelli, M.C.; Cillari, G.; Ricciardi, P.; Miino, M.C.; Torretta, V.; Rada, E.C.; Abbà, A. The Production of Sustainable Concrete with the Use of Alternative Aggregates: A Review. Sustainability 2020, 12, 7903. [Google Scholar] [CrossRef]
  6. Silva, R.V.; de Brito, J.; Dhir, R.K. Properties and Composition of Recycled Aggregates from Construction and Demolition Waste Suitable for Concrete Production. Constr. Build. Mater. 2014, 65, 201–217. [Google Scholar] [CrossRef]
  7. Rahhal, V.F.; Trezza, M.A.; Tironi, A.; Castellano, C.C.; Pavlíková, M.; Pokorný, J.; Irassar, E.F.; Jankovský, O.; Pavlík, Z. Complex Characterization and Behavior of Waste Fired Brick Powder-Portland Cement System. Materials 2019, 12, 1650. [Google Scholar] [CrossRef] [Green Version]
  8. Cichocki, K.; Domski, J.; Katzer, J.; Ruchwa, M. Mechanical Properties and Numerical Approach to Fibre Reinforced Wca Concrete Slabs. In Proceedings of the Brittle Matrix Composites 11—Proceedings of the 11th International Symposium on Brittle Matrix Composites BMC, Warsaw, Poland, 28–30 September 2015. [Google Scholar]
  9. Suzuki, M.; Seddik Meddah, M.; Sato, R. Use of Porous Ceramic Waste Aggregates for Internal Curing of High-Performance Concrete. Cem. Concr. Res. 2009, 39, 373–381. [Google Scholar] [CrossRef]
  10. Ogrodnik, P.; Szulej, J.; Franus, W. The Wastes of Sanitary Ceramics as Recycling Aggregate to Special Concretes. Materials 2018, 11, 1275. [Google Scholar] [CrossRef] [Green Version]
  11. Kocot, A.; Ponikiewski, T. Influence of Artificial Waste Modification on Strength of Cementitious Composite. Trans. VSB—Tech. Univ. Ostrav. Civ. Eng. Ser. 2021, 21, 7. [Google Scholar] [CrossRef]
  12. Xu, L.-Y.; Huang, B.-T.; Li, V.C.; Dai, J.-G. High-Strength High-Ductility Engineered/Strain-Hardening Cementitious Composites (ECC/SHCC) Incorporating Geopolymer Fine Aggregates. Cem. Concr. Compos. 2022, 125, 104296. [Google Scholar] [CrossRef]
  13. Yadollahi, M.M.; Benli, A.; Demirboğa, R. The Effects of Silica Modulus and Aging on Compressive Strength of Pumice-Based Geopolymer Composites. Constr. Build. Mater. 2015, 94, 767–774. [Google Scholar] [CrossRef]
  14. Tran, Q. Durability Investigation of Ultrafine Volcanic Pumice Based HPC Mixtures; California State University: Fullerton, CA, USA, 2014. [Google Scholar]
  15. Hrabová, K.; Lehner, P.; Ghosh, P.; Konečný, P.; Teplý, B. Sustainability Levels in Comparison with Mechanical Properties and Durability of Pumice High-Performance Concrete. Appl. Sci. 2021, 13, 4964. [Google Scholar] [CrossRef]
  16. Balendran, R.V.; Zhou, F.P.; Nadeem, A.; Leung, A.Y.T. Influence of Steel Fibres on Strength and Ductility of Normal and Lightweight High Strength Concrete. Build. Environ. 2002, 37, 1361–1367. [Google Scholar] [CrossRef]
  17. Banthia, N.; Sheng, J. Fracture Toughness of Micro-Fiber Reinforced Cement Composites. Cem. Concr. Compos. 1996, 18, 251–269. [Google Scholar] [CrossRef]
  18. Bayramov, F.; Taşdemir, C.; Taşdemir, M.A. Optimisation of Steel Fibre Reinforced Concretes by Means of Statistical Response Surface Method. Cem. Concr. Compos. 2004, 26, 665–675. [Google Scholar] [CrossRef]
  19. Shah, S.P.; Daniel, J.I.; Ahmad, S.H.; Arockiasamy, M.; Balaguru, P.N.; Ball, C.G.; Ball, H.P.; Batson, G.B.; Bentur, A.; Craig, R.J.; et al. Measurement of Properties of Fiber Reinforced Concrete. ACI Mater. J. 1988, 85, 583–593. [Google Scholar] [CrossRef]
  20. Allam, M.E.; Garas, G.L.; El Kady, H.G. Recycled Chopped Rice Straw-Cement Bricks: Mechanical, Fire Resistance & Economical Assessment. Aust. J. Basic Appl. Sci. 2017, 5, 27–33. [Google Scholar]
  21. Chen, J.; Mohamed Adam Elbashiry, E.; Yu, T.; Ren, Y.; Guo, Z.; Liu, S. Research Progress of Wheat Straw and Rice Straw Cement-Based Building Materials in China. Mag. Concr. Res. 2018, 70, 84–95. [Google Scholar] [CrossRef]
  22. Alberti, M.G.; Enfedaque, A.; Gálvez, J.C. Fibre Reinforced Concrete with a Combination of Polyolefin and Steel-Hooked Fibres. Compos. Struct. 2017, 171, 317–325. [Google Scholar] [CrossRef]
  23. Choi, Y.; Yuan, R.L. Experimental Relationship between Splitting Tensile Strength and Compressive Strength of GFRC and PFRC. Cem. Concr. Res. 2005, 35, 1587–1591. [Google Scholar] [CrossRef]
  24. Nataraja, M.C.; Dhang, N.; Gupta, A.P. Splitting Tensile Strength of SFRC. Indian Concr. J. 2001, 75, 287–290. [Google Scholar]
  25. Xu, B.W.; Shi, H.S. Correlations among Mechanical Properties of Steel Fiber Reinforced Concrete. Constr. Build. Mater. 2009, 23, 3468–3474. [Google Scholar] [CrossRef]
  26. Lin, W.-T.; Wu, Y.-C.; Cheng, A.; Chao, S.-J.; Hsu, H.-M. Engineering Properties and Correlation Analysis of Fiber Cementitious Materials. Materials 2014, 7, 7423–7435. [Google Scholar] [CrossRef] [Green Version]
  27. Qi, A.; Liu, X.; Wang, Z.; Chen, Z. Mechanical Properties of the Concrete Containing Ferronickel Slag and Blast Furnace Slag Powder. Constr. Build. Mater. 2020, 231, 117120. [Google Scholar] [CrossRef]
  28. Schabowicz, K. Non-Destructive Testing of Materials in Civil Engineering. Materials 2019, 12, 3237. [Google Scholar] [CrossRef] [Green Version]
  29. Qurashi, M.A.; Shah, S.A.R.; Farhan, M.; Taufiq, M.; Khalid, W.; Arshad, H.; Tayyab, M.; Shahzadi, G.; Waseem, M. Sustainable Design and Engineering: A Relationship Analysis between Digital Destructive and Non-Destructive Testing Process for Lightweight Concrete. Processes 2019, 7, 791. [Google Scholar] [CrossRef] [Green Version]
  30. Katzer, J.; Kobaka, J. Combined Non-Destructive Testing Approach to Waste Fine Aggregate Cement Composites. Sci. Eng. Compos. Mater. 2009, 16, 277–284. [Google Scholar] [CrossRef]
  31. Hornakova, M.; Katzer, J.; Kobaka, J.; Konecny, P. Lightweight SFRC Benefitting from a Pre-Soaking and Internal Curing Process. Materials 2019, 12, 4152. [Google Scholar] [CrossRef] [Green Version]
  32. EN 12350-6; Testing Fresh Concrete. Density. European Standard: Brussels, Belgium, 2019; p. 14.
  33. EN 12350-7; Testing Fresh Concrete. Air Content. Pressure Methods. European Standard: Brussels, Belgium, 2019; p. 28.
  34. EN 206-1; Concrete—Part 1: Specification, Performance, Production and Conformity. European Committee for Standarization: Brussels, Belgium, 2000.
  35. Horňáková, M.; Lehner, P. Relationship of Surface and Bulk Resistivity in the Case of Mechanically Damaged Fibre Reinforced Red Ceramic Waste Aggregate Concrete. Materials 2020, 13, 5501. [Google Scholar] [CrossRef]
  36. Lehner, P.; Horňáková, M. Effect of Amount of Fibre and Damage Level on Service Life of SFR Recycled Concrete in Aggressive Environment. Buildings 2021, 11, 489. [Google Scholar] [CrossRef]
  37. EN 12390-3; Testing Hardened Concrete Part 3: Compressive Strength of Test Specimens. European Standard: Brussels, Belgium, 2002.
  38. EN 12390-6; Testing Hardened Concrete—Part 6: Tensile Splitting Strength of Test Specimens. European Standard: Brussels, Belgium, 2009; pp. 1–14.
  39. En 12390-13; Testing Hardened Concrete. Determination of Secant Modulus of Elasticity in Compression. European Standard: Brussels, Belgium, 2013; pp. 18–455.
  40. EN 12390-5; Testing Hardened Concrete—Part 5: Flexural Strength of Test Specimens. BSI: London, UK, 2009; pp. 1–22.
  41. EN 14651; Test Method for Metallic Fibred Concrete—Measuring the Flexural Tensile Strength (Limit of Proportionality (LOP), Residual). British Standards Institute: London, UK, 2005; ISBN 9780580610523.
  42. EN 12504-4; Determination of Ultrasonic Pulse Velocity. European Standard: Brussels, Belgium, 2004; Volume 3, p. 18.
  43. AASHTO T358; AASHTO AASHTO T358—Standard Method of Test for Surface Resistivity Indication of Concrete’s Ability to Resist Chloride Ion Penetration. AASHTO: Washington, DC, USA, 2013.
  44. Morris, W.; Moreno, E.I.; Sagüés, A.A. Practical Evaluation of Resistivity of Concrete in Test Cylinders Using a Wenner Array Probe. Cem. Concr. Res. 1996, 26, 1779–1787. [Google Scholar] [CrossRef]
  45. Schober, P.; Boer, C.; Schwarte, L.A. Correlation Coefficients. Anesth. Analg. 2018, 126, 1763–1768. [Google Scholar] [CrossRef]
  46. Schmidt, J.-S.; Osebold, R. Environmental Management Systems as a Driver for Sustainability: State of Implementation, Benefits and Barriers in German Construction Companies. J. Civ. Eng. Manag. 2017, 23, 150–162. [Google Scholar] [CrossRef] [Green Version]
  47. Zou, K.H.; Tuncali, K.; Silverman, S.G. Correlation and Simple Linear Regression. Radiology 2003, 227, 617–628. [Google Scholar] [CrossRef]
  48. Nagelkerke, N.J.D. A Note on a General Definition of the Coefficient of Determination. Biometrika 1991, 78, 691–692. [Google Scholar] [CrossRef]
  49. Chicco, D.; Warrens, M.J.; Jurman, G. The Coefficient of Determination R-Squared Is More Informative than SMAPE, MAE, MAPE, MSE and RMSE in Regression Analysis Evaluation. PeerJ Comput. Sci. 2021, 7, e623. [Google Scholar] [CrossRef]
  50. Naaman, A.E. Engineered Steel Fibers with Optimal Properties for Reinforcement of Cement Composites. J. Adv. Concr. Technol. 2003, 1, 241–252. [Google Scholar] [CrossRef] [Green Version]
  51. Grzesiak, S.; Pahn, M.; Schultz-Cornelius, M.; Harenberg, S.; Hahn, C. Influence of Fiber Addition on the Properties of High-Performance Concrete. Materials 2021, 14, 3736. [Google Scholar] [CrossRef]
  52. Richardson, A.E. Compressive Strength of Concrete with Polypropylene Fibre Additions. Struct. Surv. 2006, 24, 138–153. [Google Scholar] [CrossRef]
  53. Ghosh, P.; Tran, Q. Correlation Between Bulk and Surface Resistivity of Concrete. Int. J. Concr. Struct. Mater. 2015, 9, 119–132. [Google Scholar] [CrossRef]
  54. Ghosh, P.; Tran, Q. Compressive Strength and Surface Resistivity of HPC Mixtures. Int. J. Eng. Sci. Manag. 2014, 4. [Google Scholar]
  55. Ab Manaf, M.B.H.; Yahya, Z.; Abd Razak, R.; Mustafa Al Bakri, A.M.; Ariffin, N.F.; Ahmad, M.M.; Chong, Y.C. Surface Resistivity and Ultrasonic Pulse Velocity Evaluation of Reinforced OPC Concrete and Reinforced Geopolymer Concrete in Marine Environment. In Advances in Mechatronics, Manufacturing, and Mechanical Engineering; Springer: Singapore, 2021; pp. 292–298. [Google Scholar]
Figure 1. Waste red ceramic fine aggregate (WRCFA) (a), expanded clay coarse aggregate (ECCA) (b), copper-coated crimped (CCC) steel fibre (c).
Mathematics 10 00229 g001
Figure 2. The overview of the experimentally measured data.
Mathematics 10 00229 g002
Figure 3. The relationship between dynamic modulus of elasticity and compressive strength.
Mathematics 10 00229 g003
Figure 4. The relationship between dynamic modulus of elasticity and splitting tensile strength.
Mathematics 10 00229 g004
Figure 5. The relationship between dynamic modulus of elasticity and static modulus of elasticity.
Mathematics 10 00229 g005
Figure 6. The relationship between dynamic modulus of elasticity and limit of proportionality.
Mathematics 10 00229 g006
Figure 7. The relationship between dynamic modulus of elasticity and shear strength.
Mathematics 10 00229 g007
Figure 8. The relationship between surface resistivity and compressive strength.
Mathematics 10 00229 g008
Figure 9. The relationship between surface resistivity and splitting tensile strength.
Mathematics 10 00229 g009
Figure 10. The relationship between surface resistivity and static modulus of elasticity.
Mathematics 10 00229 g010
Figure 11. The relationship between surface resistivity and limit of proportionality.
Mathematics 10 00229 g011
Figure 12. The relationship between surface resistivity and shear strength.
Mathematics 10 00229 g012
Table 1. Concrete composition.
ComponentWRCFA—DryECCA—DryCement I 42.5Tap WaterCCC Steel Fibre
C 0.0379 kg/m3247 kg/m3321 kg/m3461 kg/m30 kg/m3
C 0.5379 kg/m3247 kg/m3321 kg/m3461 kg/m339 kg/m3
C 1.0379 kg/m3247 kg/m3321 kg/m3461 kg/m378 kg/m3
C 1.5379 kg/m3247 kg/m3321 kg/m3461 kg/m3117 kg/m3
Table 2. Pearson correlation coefficients between the two parameters of non-destructive testing methods (NDTs) and other destructive testing methods (DTs).
Dynamic Modulus of Elasticity [GPa]Surface Resistivity [KΩ-cm]
Compressive strength [MPa]0.702−0.539
Splitting tensile strength [MPa]0.954−0.966
Static modulus of elasticity [GPa]0.956−0.715
Dynamic modulus of elasticity [GPa]1.000−0.889
Limit of proportionality [MPa]0.605−0.314
Shear strength [MPa]0.885−0.940
Surface resistivity [KΩ-cm]−0.8891.000
Table 3. Resulted values of coefficient of determination R2 for all analysed pairs of parameters.
Dynamic Modulus of Elasticity [GPa]Surface Resistivity [KΩ-cm]
LinearQuadraticLinearQuadratic
Compressive strength [MPa]0.4940.8170.2910.520
Splitting tensile strength [MPa]0.9100.9660.9340.939
Static modulus of elasticity [GPa]0.9130.9260.5120.573
Limit of proportionality [MPa]0.3660.9510.0990.794
Shear strength [MPa]0.7840.9640.8840.955
Publisher’s Note: MDPI stays neutral with regard to jurisdictional claims in published maps and institutional affiliations.

