Article

Effect of Different Tunnel Distribution on Dynamic Behavior and Damage Characteristics of Non-Adjacent Tunnel Triggered by Blasting Disturbance

1
School of Resources Environment and Safety Engineering, University of South China, Hengyang 421001, China
2
School of Resources and Safety Engineering, Central South University, Changsha 410083, China
3
Guangdong Provincial Key Laboratory of Deep Earth Sciences and Geothermal Energy Exploitation and Utilization, Institute of Deep Earth Sciences and Green Energy, College of Civil and Transportation Engineering, Shenzhen University, Shenzhen 518060, China
4
College of Energy and Mining Engineering, Shandong University of Science and Technology, Qingdao 266590, China
*
Author to whom correspondence should be addressed.
Mathematics 2022, 10(19), 3705; https://doi.org/10.3390/math10193705
Submission received: 28 July 2022 / Revised: 4 October 2022 / Accepted: 6 October 2022 / Published: 10 October 2022
(This article belongs to the Special Issue Mathematical Problems in Rock Mechanics and Rock Engineering)

Abstract

:
When a blasting is executed near two tunnels, the blasting wave will trigger a dynamic response and damage to the tunnels. Depending on the tunnel distribution, the path of the blasting wave to the remote non-adjacent tunnels will change. The aim of this study is to analyze the effect of the tunnel distribution on the dynamic response characteristics of a remote non-adjacent tunnel. Numerical models of two tunnels were established by PFC2D and three different tunnel distributions were considered. The two tunnels were divided into the adjacent tunnel and the non-adjacent tunnel according to their relative distance to the blasting source. The dynamic stress evolution, damage characteristics and the evolution of strain energy of the non-adjacent tunnel were initially analyzed. The results show that the stress wave amplitude of the non-adjacent tunnel is closely related to the tunnel distribution, but only near the sidewalls of the non-adjacent tunnel is the stress wave waveform sensitive to the tunnel distribution. The larger the tunnel dip, the more severe the damage to the non-adjacent tunnel. In addition, as the tunnel dip increases, the maximum strain energy densities (SEDs) in the roof, floor and sidewalls of the non-adjacent tunnel exhibit different trends. The influence of the wavelength of the blasting wave is further discussed. It is shown that the dynamic stress amplification factor and damage degree around the non-adjacent tunnel is usually positively correlated with the wavelength of the blasting wave. Moreover, the release of strain energy around the non-adjacent tunnel has a positive correlation with the wavelength. The SED variations in different areas around the non-adjacent tunnel also exhibit different trends with the increase of tunnel dip.

1. Introduction

In underground engineering excavation, a large number of tunnels are excavated in a limited area to reduce the workload and cost [1,2,3]. These tunnels are important structures to ensure the safety of underground engineering. However, with the increase of excavation depth and the number of engineering structures, the stress concentration around the engineering structures becomes more obvious and a large amount of strain energy is stored around them. These initial strain energies can induce a high risk of rock burst, collapse and fracture [4,5,6]. In addition, the dynamic disturbance in underground engineering is another major cause of engineering disasters [7,8,9,10]. In underground tunnels which suffer different distribution, the propagation of stress waves is also complex and diverse, which makes it very difficult to predict and prevent disasters. Therefore, it is necessary to understand the dynamic behavior and damage characteristics of underground tunnels with different distributions.
In recent decades, the static mechanical behavior of underground tunnels has attracted extensive attention. Some scholars have calculated the stress distribution around the tunnel by the elastic mechanics and complex function methods [11,12]. They generally believe that the lateral pressure coefficient and the tunnel cross-section shapes are important factors affecting stress distribution. For example, Kirsch first obtained the stress distribution function (Kirsch’s solution) around the circular tunnel under different lateral pressure conditions based on elastic mechanic theory [12]. Subsequently, the stress distribution formula of the elliptical tunnel was obtained by using the conformal mapping method of complex function and the classical Kirsch’s solution [12]. Recently, some scholars have also solved the stress distribution of specific shape tunnels (such as a rectangular and semi-circular tunnel) using numerical regression analysis, complex function theory and numerical simulation [13,14]. For example, Exadaktylos and Stavropoulou [13] adopted the complex function method to calculate the stress distribution of multiple shapes of underground tunnels with rounded corners and further verified the theoretical solution by the FLAC3D numerical simulation. Zhao et al. [14] also obtained the initial function for solving the stress distribution around the rectangular tunnel by defining a coefficient related to the height-width ratio. On the other hand, many scholars have studied the failure mechanism of underground tunnels [15,16,17,18]. For example, Zhu et al. [15] analyzed the influence of lateral pressure coefficient on the failure of a U-shaped tunnel based on RFPA numerical simulation. The results showed that, when the lateral pressure coefficient is 1, the roof and floor would suffer shear failure, while when the lateral pressure coefficient is 4, the sidewalls would suffer tensile failure. Gong et al. [16] also studied the rock burst mechanism of hard rock tunnels with a circular cross-section. They found that the rock burst process of deep hard rock tunnels has a typical time effect which can be divided into four stages and the spalling can further be developed into the rock burst. Si et al. [17] conducted a series of triaxial compression tests and investigated the spalling mechanism of sidewalls of D-shaped tunnels. The results show that the spalling will be inhibited and the depth of the V-notch will be reduced under higher lateral pressure.
Recently, some scholars have paid attention to the dynamic mechanical behavior and failure characteristics of underground tunnels [19,20,21,22,23]. In general, the dynamic disturbance or unloading disturbance can prompt the rapid deformation and energy conversion of surrounding rock in the form of stress waves. Li et al. [19] have indicated that the release of strain energy is closely related to the failure modes of underground tunnels. The result shows that, when roof spalling is induced, the release of strain energy will last for a long time, but when a violent strain rock burst occurs, massive strain energy will be released instantaneously. Si et al. [20] conducted the triaxial unloading compression test and investigated the strength-weakening effect of unloading and unloading rate on fine-grained granite. They found a lower unloading rate more conducive to the improvement of the bearing strength and the storage of elastic energy. In addition, some scholars have also analyzed the influence of disturbance location, in-situ stress, disturbance amplitude and disturbance duration on the dynamic stability of the underground tunnel [24,25,26,27]. For example, Qiu et al. [25] carried out a series of physical model tests on deep tunnels and they found that, even when the disturbance distance is the same but the disturbance dip is different, the dynamic stability of deep tunnels varies greatly. Li et al. [26] studied the effect of stress wave wavelength on the failure model of the deep tunnel and found that the short stress wave tends to cause spalling and the length stress wave tends to cause rock burst. Zhu et al. [27] analyzed the failure mechanism of the deep tunnel under different disturbance amplitudes. The results show that, the larger the disturbance amplitude, the more serious the dynamic failure. In addition, Kulynych et al. [28] studied the action process of gaseous products of explosive on rock fracturing behavior and found that the effect of rock mass disturbance would gradually decrease with increased relaxation of defect formation. Slashchov et al. [29] analyzed the relationship between the emanation activity of radon decay products in mining tunnels and the geological dislocations and believed that the hidden tectonic disturbances and high-stress concentrations can be determined by monitoring the gas-dynamic processes in mining tunnels. Arnau et al. [30] compared the dynamic behavior of a double-decker circular tunnel under train-induced loads with that of a simple tunnel and the results showed that the soil response would be significantly different across the frequency range studied. Behshad et al. [31] analyzed the influence of Dynamic Vibration Absorbers (DVA) on the vibration reduction of a double-deck circular railway tunnel and found that DVA can effectively reduce the total energy flow acting on the tunnel when trains pass by.
In underground engineering, numerous tunnels are usually excavated in a limited area, as shown in Figure 1. These tunnels are locally distributed horizontally, vertically and obliquely. During the excavation or internal blasting of these tunnels, existing tunnels will inevitably be affected by the adjacent working area, including the redistribution of static stress and the dynamic response. Usually, the impact of blasting disturbance in the adjacent working area is particularly significant. Numerous previous studies have confirmed the impact of blasting disturbance or dynamic disturbance on adjacent tunnels, which usually causes local stress surges, triggering rock bursts or surrounding rock spalling [19,24,25,26]. The object of these studies is usually a single tunnel or the tunnel near the disturbance source, but little attention has been paid to multiple tunnels, especially the remote non-adjacent tunnels. Limited studies have analyzed the dynamic behavior of multiple tunnels under dynamic or unloading disturbances [32,33]. For example, Feldgun et al. [33] analyzed the dynamic behavior of a rectangular existing tunnel induced by the internal blasting inside another horizontal parallel tunnel. The results show that the left sidewall of the existing tunnel will bend under the blasting disturbance. Li et al. [32] also analyzed the effect of unloading waves caused by neighboring tunnel excavation on the existing tunnel. The results show that the unloading wave can cause a strong dynamic response of the existing tunnel and the increase of the unloading rate can amplify the dynamic effect. However, due to the multiple transmission and reflection of stress waves among multiple tunnels, the dynamic stability and stress concentration of the non-adjacent tunnel will not only depend on the amplitude and wavelength of the initial incident wave, but also depend on the interaction with the adjacent tunnel. Therefore, the tunnel distribution is also an important factor, which can affect the dynamic response and fracturing behavior around the tunnels triggered by blasting disturbance [34,35]. For this reason, the main object of this study is to analyze the influence of tunnel distribution on the dynamic response and stability of the non-adjacent tunnel under blasting disturbance. Therefore, the numerical models with the two tunnels were established by the particle flow code (PFC2D) method and different tunnel distributions were also considered. In addition, the stress evolution, energy evolution and failure characteristics around the two tunnels caused by blasting disturbance were analyzed. The effect of stress wave wavelength on the dynamic behavior of a non-adjacent tunnel is further discussed.

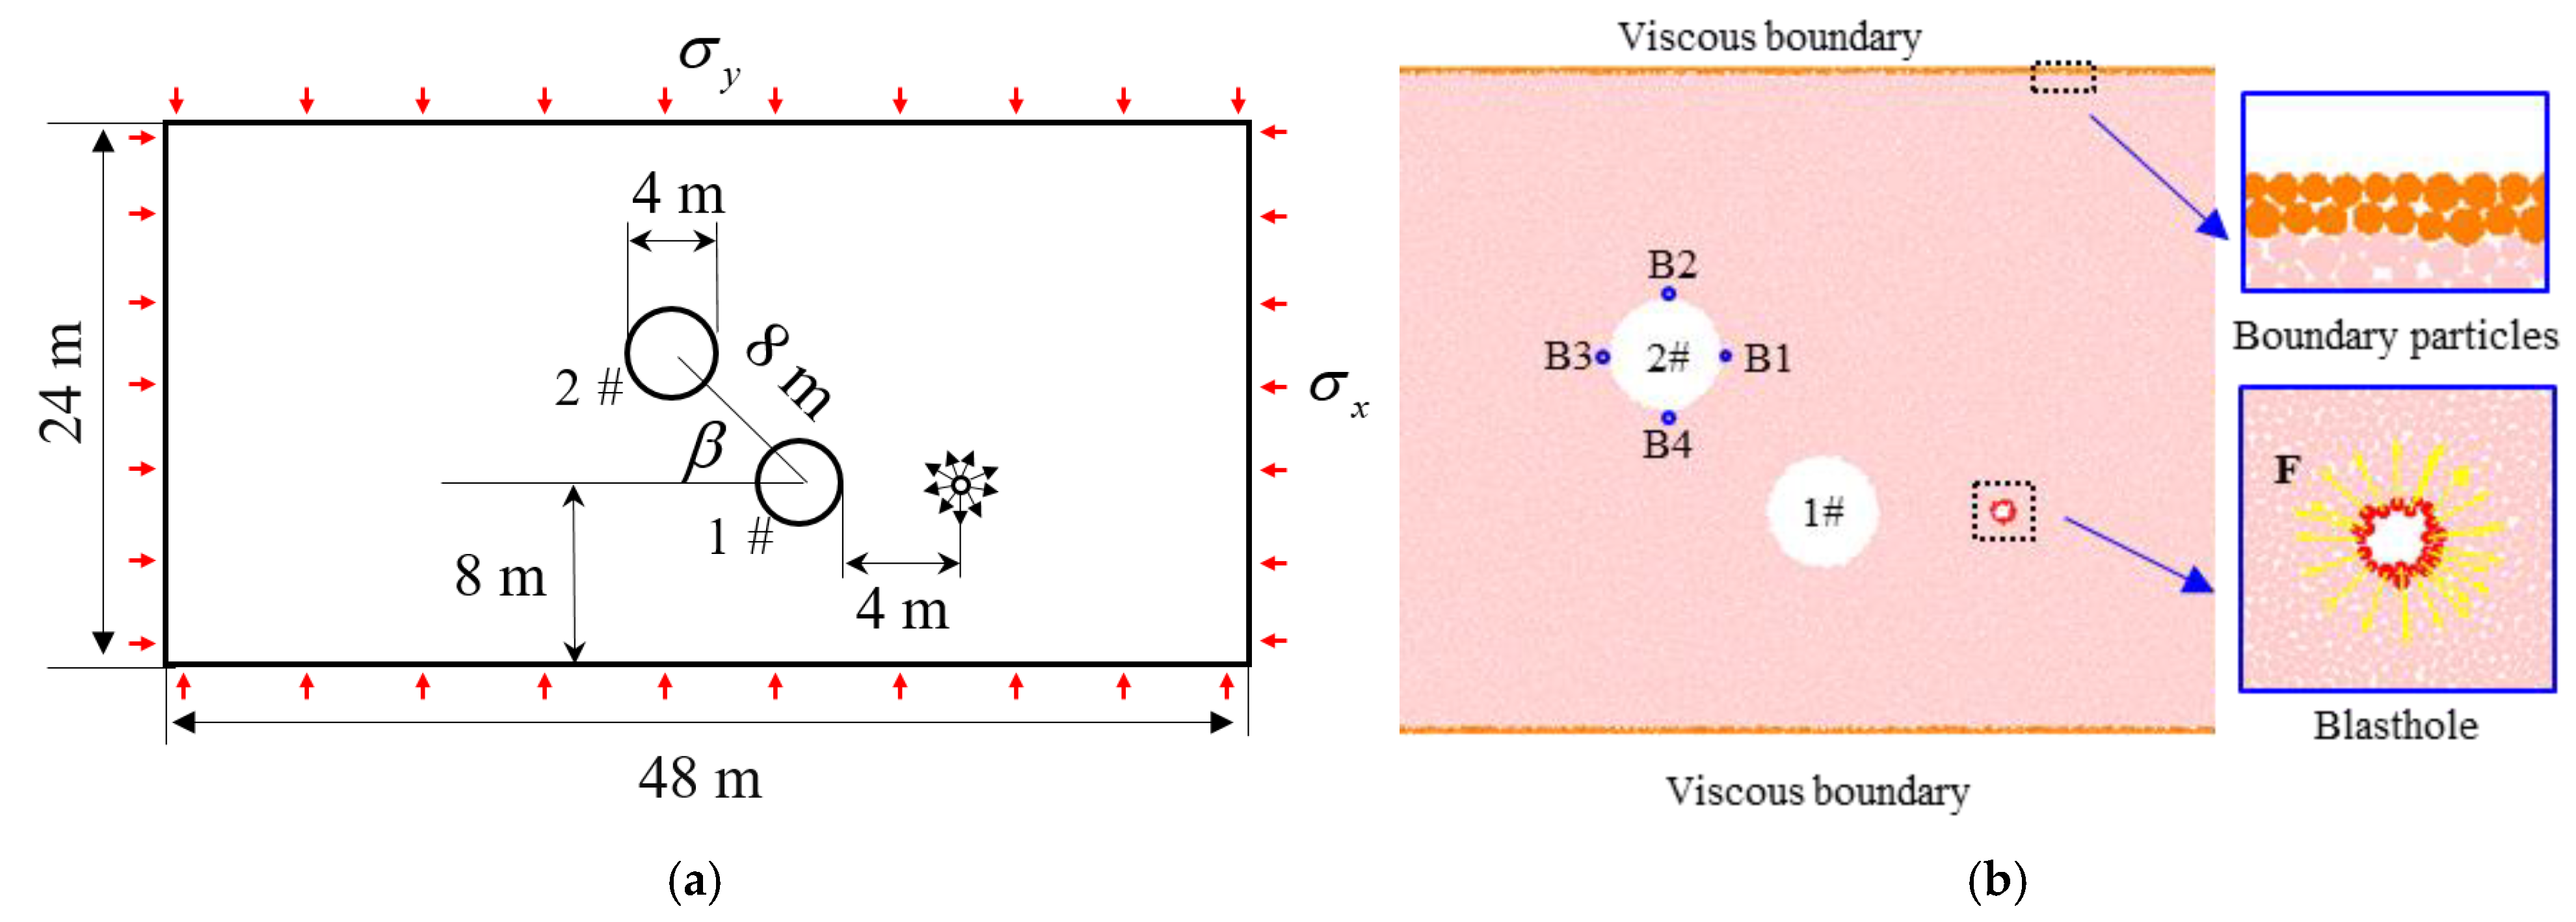
2. Description of Numerical Model

2.1. Description of PFC2D

The discrete element method PFC2D is widely used in rock engineering because it has the advantage of synchronous microcracks display and does not need to consider the convergence issue in calculations. PFC2D provides several typical modeling methods to simulate different mechanical properties of materials, such as the contact bond (CB) model, parallel bond (PB) model, smooth joint (SJ) model, flated joint (FJ) model, etc. Generally, the CB model is used to simulate the soil material or the bulk material, because it can only transfer the force and not moments through the contact between particles. The PB model is suitable for rock-like materials because it can effectively transmit forces and moments [37,38]. The SJ model is usually used to simulate structural planes such as joints, cracks and bedding-in materials. FJ mode is an increasingly popular new modeling method for rock-like materials because it provides a more realistic ratio between the tensile strength and compression strength of materials. However, because the FJ model will generate too many micro-cracks, it also has certain disadvantages in observing the failure mode of the rock mass. Therefore, the PB model was chosen to simulate the mechanical behavior of rock mass in this study. As shown in Figure 2a, a series of non-uniform-sized rigid particles can be seen as the basic constituent element of the PB model, the linear contact is arranged between the particles and a parallel bond can be conceived as a finite-size concrete cemented between particles. The mechanical behavior between particles can be assumed to be produced by a series of linear springs, viscous dashpots and two specific boned elements (with the normal and shear strengths σ ¯ c and τ ¯ c ) [38], as shown in Figure 2b.
For the linear contact, the moment is zero and the contact force can be iterated by:
{ F n = F n l + F n d F s = F s l + F s d
where the subscripts n and s denote normal and shear direction, respectively. The subscripts l and d denote linear spring and dashpot contributions, respectively. It is worth noting that the contact activation state is determined by the comparison between the contact gap (gc) and the reference gap (gr). When gc > gr, the linear contact is inactivated and the calculations of force-displacement is ignored. When gcgr, the linear contact is activated and the force components F n l , F s l , F n d , F s d of linear contact can be upgraded by the following equations:
F n l = k n ( g r g c )
F s l = { ( F s ( l ) ) 0 k s Δ U s , if   the   contact   is   not   sliding μ F n , if   the   contact   is   sliding  
F n d = 2 β n m c k n v n
F s d = { 2 β s m c k s v s , if   the   contact   is   not   sliding 0 , if   the   contact   is   sliding
where ( F s l ) 0 denotes the shear force of linear contact at the last step. Δ U s represents the relative shear displacement increment. μ denotes the friction coefficient. mc denotes the effective mass of linear contact. vn and vs denote the relative normal velocity and shear velocity, respectively. k n and k s denote the normal and shear stiffness of linear contact, respectively.
For the parallel bond, there is a linear relationship between force and displacement. In addition, the bending moment M ¯ b is also calculated. The force components F ¯ n , F ¯ s and the bending moment M ¯ b can be iterated by:
F ¯ n : = F ¯ n k ¯ n A Δ U n
F ¯ s : = F ¯ s k ¯ n A Δ U s
M ¯ b : = M ¯ b k ¯ n I Δ θ b
where A is the area of the parallel bond cross-section. I is the moment of inertia of the parallel bond. Δ θ b is the relative rotation increment. k ¯ n and k ¯ s denote the normal and shear stiffness of parallel bond, respectively. The maximum normal and shear stresses acting on the parallel bond can be calculated:
σ ¯ max = F ¯ n A + | M ¯ b | R ¯ I
τ ¯ max = | F ¯ s | A
where R ¯ is the radius of the bond cross-section. The failure state of the parallel bond can be determined by a comparison between these stresses and the tensile and shear strengths
{ σ ¯ max > σ ¯ c   , failed   in   tension τ ¯ max > τ ¯ c   , failed   in   shear
where the tensile strength is preset manually and the shear strength can be updated by the Mohr-Coulomb criterion:
τ ¯ c = c ¯ σ ¯ tan ϕ
where c ¯ is the cohesion and ϕ is the friction angle.

2.2. Modelling Procedure and Calibration of PB Model Parameters

Calibration of the numerical model should be performed to obtain appropriate micro-parameters of the PB model for matching macroscopic behaviors between the numerical model and experiment. In this work, the granite specimens from Linglong gold mine were tested by the uniaxial compression method and the corresponding numerical specimens were established to calibrate these results. A series of trial and error procedures are executed by adjusting the microscopic parameters of the numerical model so that the macroscopic mechanical characteristics of the numerical model, including UCS, elastic modulus and Poisson, have a good match with that of actual granite. The empirical uniaxial compression strength (UCS) is about 158.45 MPa, the elastic modulus is 32.3 GPa and the Poisson’s ratio is 0.258. The corresponding numerical results are listed in Table 1. As shown in Table 1, the error between the numerical results and the real granite is less than 5%, indicating that the calibrated numerical model can well represent the real granite. The stress–strain curves and failure modes of the numerical model and granite are also compared in Figure 3 [24]. These results also show that the numerical model is in good agreement with the testing result The obtained calibrated micro-parameters of the PB model are listed in Table 2.
The in-situ stress of Linglong Gold Mine was considered in this work. The tunnels are assumed to be excavated along the direction of minimum horizontal principal stress. Thus, the linear functions of the maximum horizontal principal stress and vertical principal stress are presented as follows [39]
σ h max = 0.4612 + 0.0588 h
σ v = 0.4683 + 0.0316 h
where σhmax and σv are the maximum horizontal principal stress and vertical principal stress, respectively. h is the depth.
The numerical model with dimensions of 48 m × 24 m was established by the calibrated PB model, as shown in Figure 4. The radius of particles is in the range of 0.06 m–0.096 m. The viscous boundary condition is set to reduce the reflected wave at the boundary [40]. The depth of 1200 m was investigated. Correspondingly, the horizontal and vertical stresses applied to the model boundaries are 71.02 MPa and 37.45 MPa, respectively. Two tunnels excavated before these boundary stresses were loaded. The tunnel modelling process in this study involves the main factor: tunnel distribution. As shown in Figure 4, two circular tunnels with the same diameter (4 m) are considered. The distance between the two tunnel centers is set to 8 m. The tunnel dip β is defined as the angle between the two tunnel centers and the horizontal direction. As shown in Figure 4a, the tunnel distribution can be obtained by changing the tunnel dip. In this study, three different tunnel dips were considered: 0°, 45,° and 90°.
The real blasting wave is extremely complex and it is almost impossible to completely reconstruct it through numerical simulation. For this reason, some scholars proposed the simplified triangular wave method to replace the real blasting wave [24,41,42]. Their results show that this simplified triangular wave can effectively reflect the effects of blasting. To this end, the triangular wave method was adopted in this study. Before the blasting, a borehole with a radius of 0.3 m was first excavated, then a triangle stress wave was applied to the borehole periphery, as shown in Figure 5. The tunnel close to the borehole can be regarded as the adjacent tunnel and the tunnel far away from the borehole is the non-adjacent tunnel. The distance between the borehole location and the adjacent tunnel is set as 4 m. The peak stress of the triangle stress wave is 3 GPa, the rising time tr is 250 μs and the total time tm is 1250 μs. The time ratio k = tm/tr, which is defined as the ratio of rising time to total time, is set to 5. Four measuring circles with a radius of 0.3 m are arranged around the non-adjacent tunnel. The measuring circles near the non-adjacent tunnel are named B1, B2, B3 and B4, as shown in Figure 4b.

3. Modelling Results

3.1. Dynamic Stress Characteristics

When a blast is executed, the nearby surrounding rock will directly break into pieces and the far-field surrounding rock will accumulate or release deformation under the attenuated stress wave, causing unexpected damage. Generally, the stress evolution of surrounding rock induced by the blasting disturbance is mainly manifested in two aspects: dynamic stress and static stress. In PFC2D, the stress recorded by the measuring circle actually includes the static part and dynamic part. Figure 6 presents the typical stress–time curve recorded by measuring circles. It can be seen from Figure 6 that the static stress before blasting (t < 0 μs) is usually a stable value and the static stress after blasting will be stabilized again. For expedient analysis, the dynamic part is separated from the superimposed curve in the subsequent sections. Furthermore, it should be noted that the tensile stress is positive and the compressive stress is negative.
In the periphery of the tunnel, the radial stress is usually very small, so only the tangential stress is discussed in this study. In this section, the dynamic tangential stress was examined. Figure 7 presents the tangential stress waves around non-adjacent tunnels under different tunnel dips. As shown in Figure 7, these stress curves generally undergo one or multiple peaks, of which the compression peak is less than zero and the tensile peak is greater than zero. It can be found these peaks exhibit different variation trends at different locations, as follows:
(1)
For zone B1, when β = 0° and 45°, the maximum tensile peaks are generally greater than the maximum compression peaks, so attention should be paid to the tensile failure of surrounding rock in the vicinity of this zone. When β = 90°, the tensile peak is not obvious and the maximum compression peak is 180.4 MPa, which is far greater than the maximum tensile stress. The result shows that, when β = 90°, the compression failure tends to occur near zone B1.
(2)
For zone B2, the maximum tensile peak is generally greater than the maximum compression peak, which indicates that the tensile failure tends to be near this zone.
(3)
For zone B3, the stress amplitudes of these curves are commonly smaller than those of other zones. When β = 0° and 45°, the maximum peak stress is tensile and when β = 90°, the maximum stress is compressive. The result is similar to that of zone B1.
(4)
For zone B4, the result is similar to that of zone B2, in which the maximum stress is generally tensile. In addition, it should be noted that, when β = 90°, the tensile peak is also not obvious.
(5)
Generally, the stress wave waveform will not change significantly in zones B2 and B4, but the stress amplitude will. In zones B1 and B3, both the waveform and amplitude of the stress wave will change. In addition, it can be observed that the first peaks of zones B1, B3 and B4 decrease first and then increase and the first peaks of zone B2 increase first and then decrease.

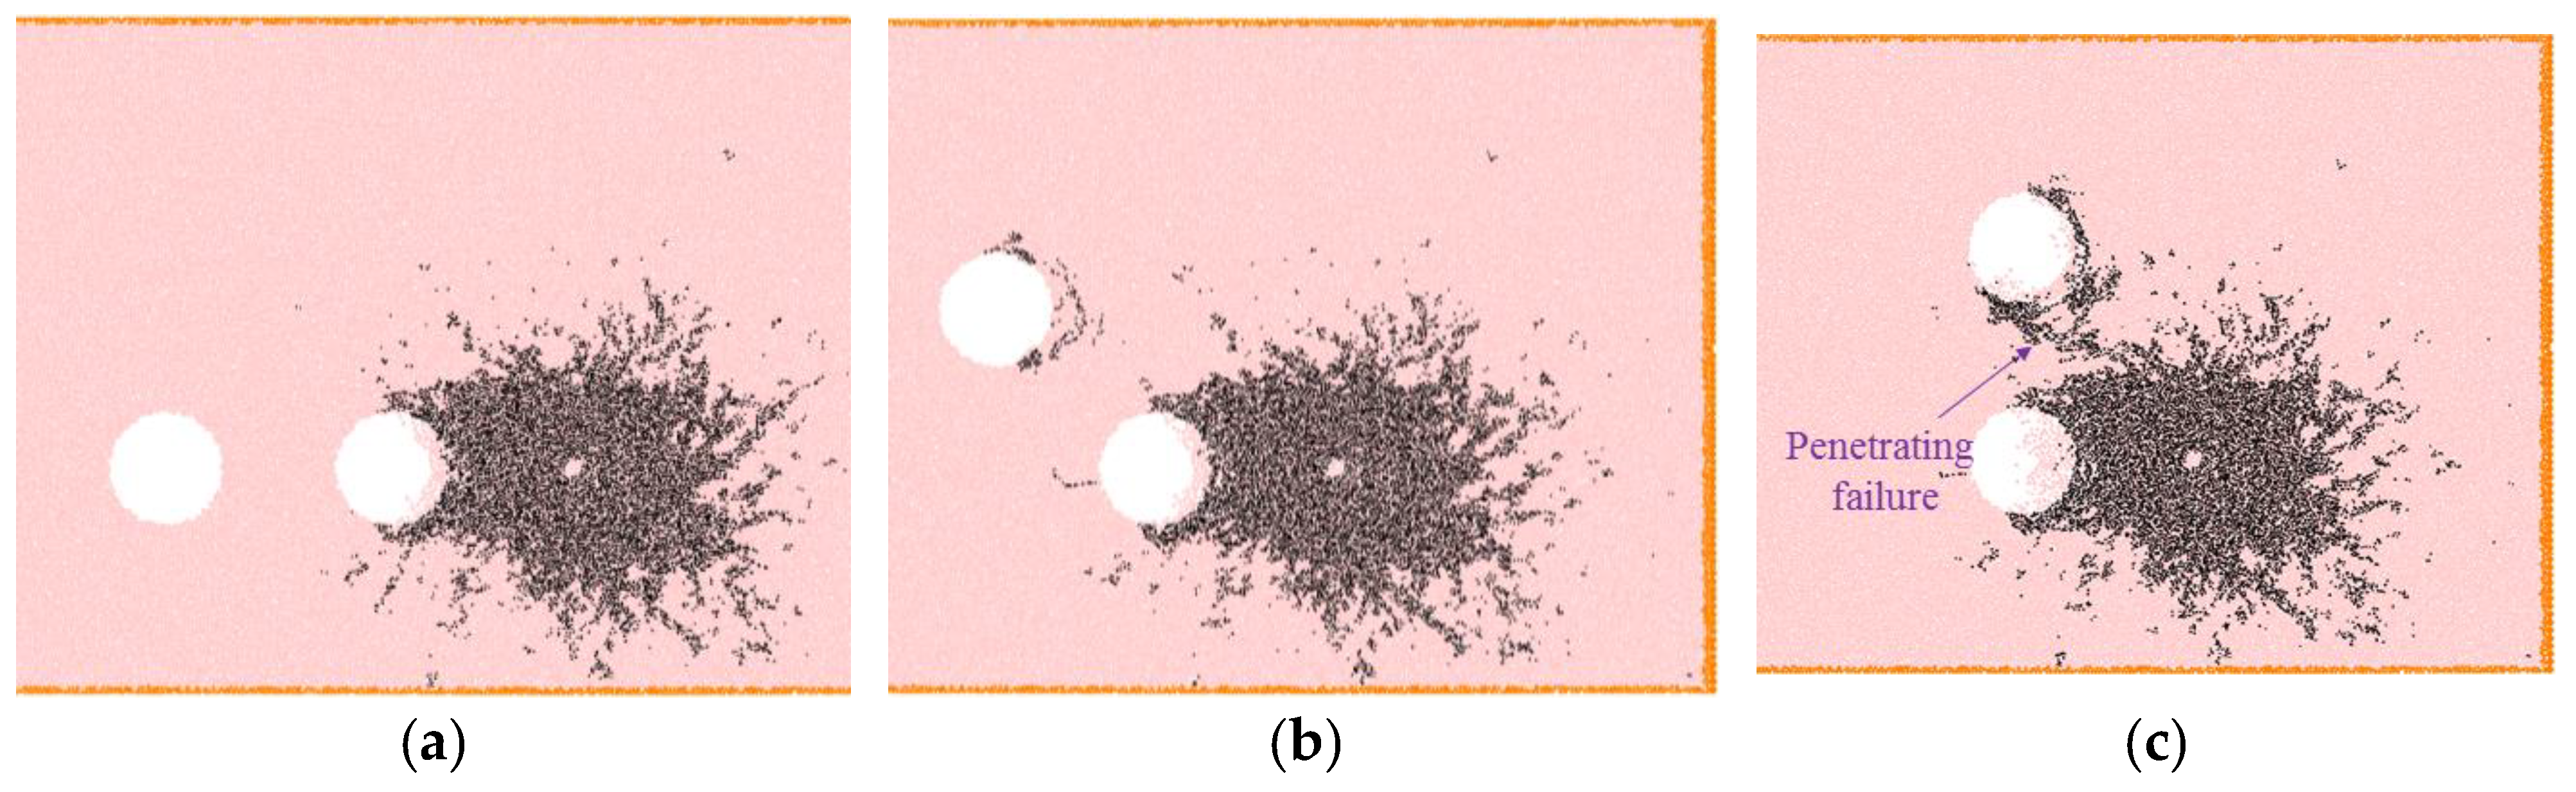
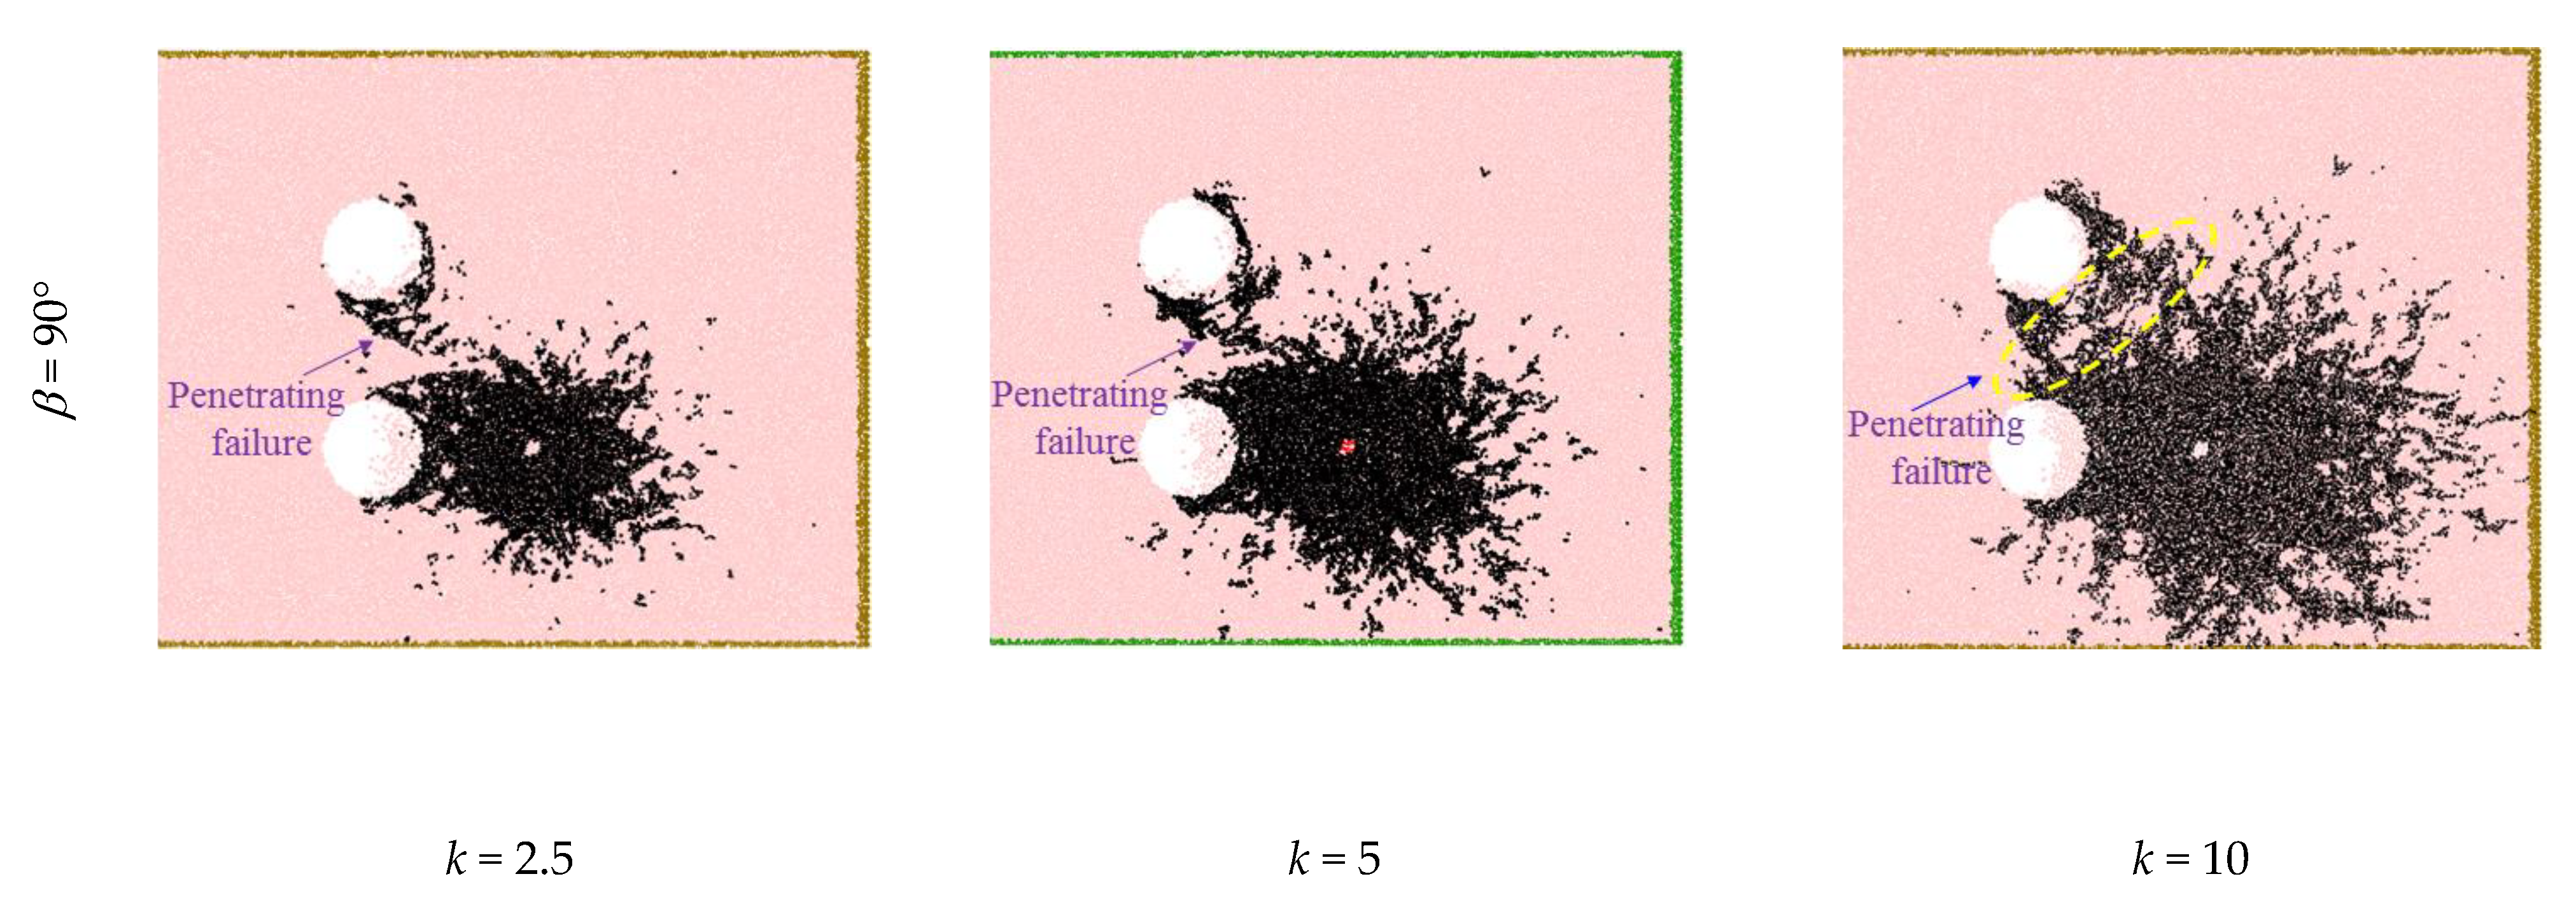
3.2. Damage Characteristics

Figure 8 presents the microcrack distribution under different tunnel dips. As shown in Figure 8, when β = 0°, the microcracks were mainly distributed in the right sidewall of the adjacent tunnel and almost no microcracks were formed in the vicinity of the non-adjacent tunnel. When β = 45°, there are some microcracks distributed at the roof, right sidewall and floor of the non-adjacent tunnel and the vicinity of the adjacent tunnel, while almost no microcracks are generated between the adjacent and non-adjacent tunnels. Besides, it can be observed that the failure on the right sidewall of the non-adjacent tunnel is spalling. When β = 90°, there are a large number of microcracks generated at the roof, right sidewall and floor of the non-adjacent tunnel. Obviously, the larger the tunnel dip is, the more severe the damage to the non-adjacent tunnel caused by blasting disturbance. In addition, it can also be found that, when β = 90°, an obvious penetrating failure zone merges between adjacent and the non-adjacent tunnels. Based on these results, it can be inferred that, when the tunnel dip exceeds a critical value, the disaster hazard induced by blasting will be more severe, because the cascading failure tends to occur between multiple tunnels.
Figure 9 shows the development process of this microcrack. As shown in Figure 9, the microcrack development process can be generally divided into four stages: no crack generation stage (t < 0.1 ms), rapid microcrack growth stage (t = 0.1–2.5 ms), slow microcrack growth stage (t = 2.5–5.6 ms) and stable microcrack stage (t < 5.6 ms). In the no crack generation stage (t < 0.1 ms), there are almost no new microcracks formations in the models. In the rapid microcrack growth stage (t = 0.1–2.5 ms), the microcracks will increase rapidly and the damage caused by this stage is also the most serious. In this stage, the microcrack curves of different tunnel dip almost coincide, because the damage of surrounding rock is mainly concentrated around the borehole and the left sidewall of the adjacent tunnel. In the slow microcrack growth stage (t > 2.5 ms), the damage begins to occur around the non-adjacent tunnel as the stress wave propagation. Therefore, the three microcrack curves gradually separate. In this stage, the growth rate of the microcrack gradually slows down. In the stable microcrack stage (t > 5.6 ms), the total number of microcracks in the surrounding rock gradually tends to be stable and the damage of the surrounding rock is basically completed.

3.3. Evolution Characteristics of Strain Energy

The blasting disturbance usually causes the accumulation, release and dissipation of the strain energy. Some studies believe that the evolution of strain energy is a major cause of disasters and an important feature reflecting the stability of surrounding rock. [4,43,44,45]. For example, Li et al. [4] assessed the rock burst characteristics around a tunnel based on an energy index, namely strain energy density (SED). The results show that as a large amount of strain energy is released, the strain rock burst will occur on the floor and corner. Luo and Gong [43] also assessed the established invariable feature of the ultimate internal elastic index based on the law of energy release and dissipation during rock failure. To accurately evaluate the evolution characteristics of strain energy, the strain energy density (SED) is applied in this work because it is not affected by the volume of the measuring area. According to PFC2D, the strain energy stored in linear contact and parallel bond can be obtained:
E s = 1 2 ( | F n | 2 k n + | F s | 2 k s )
E ¯ s = 1 2 ( | F ¯ n | 2 A k ¯ n + | F ¯ s | 2 A k ¯ s + | M ¯ b | 2 I k ¯ n )
where E s and E ¯ s denote the strain energies of linear contact and parallel bond, respectively. F n and F s denote the normal and shear force of linear contact, respectively. F ¯ n and F ¯ s denote the normal and shear force of parallel bond, respectively. Therefore, the SED can be given by:
S E D = m ( E s ) i + ( E ¯ s ) i A
where m is the total number of linear contacts in the measuring area. A is the area of the measuring area.
Figure 10 shows the SED-time curve of typical areas under different tunnel dips. As shown in Figure 10, before the blasting wave arrives (t < 0 μs), some strain energy is accumulated in the surrounding rock and can be regarded as the initial SED. During the blasting, the SED will increase sharply, then release rapidly and finally reach an approximately stable value (final SED). In addition, it can be found that, for zones B1 and B3, the maximum SEDs tend to decrease first and then increase with the tunnel dip. However, for zone B2, the maximum SEDs increase first and then decrease with the tunnel dip, which is contrary to the cases of zones B1 and B3. For zone B4, the maximum SEDs are positively correlated with tunnel dip. Furthermore, it can be found that, after the blasting wave path, the strain energy does not recover to the initial value, indicating that the blasting disturbance causes some irreversible deformation and even some severe damage.

4. Discussion

In the past decades, some scholars have realized that the stress wave wavelength is an important factor affecting and controlling the failure characteristics of surrounding rock [30,46,47]. For this reason, we will focus on the influence of stress wave wavelength on the dynamic response and damage characteristics of the non-adjacent tunnel. Generally, the different stress wave wavelengths can be obtained by adjusting the duration of the stress wave. Therefore, in this section, the blasting wave amplitude and rise time are kept the same as those in Section 2.2 and three time ratios k = tm/tr (2.5, 5 and 10) are set.
Usually, the damage behavior of the surrounding rock is controlled by its total stress. However, the total stress of the surrounding rock is not only related to the dynamic stress but also closely related to the static stress. In order to accurately evaluate the dynamic effect caused by blasting disturbance, some scholars generally define a dynamic stress amplification factor (DSAF) [40,48]. For this reason, a dynamic stress amplification factor is applied to this work:
φ = max ( σ ( t ) σ s 0 )
where φ is the dynamic stress amplification factor. σ ( t ) is the total stress and σ s 0 is the static stress before blasting. Figure 11 presents the dynamic stress amplification factor around a non-adjacent tunnel. As shown in Figure 11, for zone B1, the DSAFs increase slightly at first and then increase sharply with the tunnel dip β. For zone B2, the DSAFs tend to increase first and then decrease with the tunnel dip. Especially, when the time ratio k = 10, the DSFA decreases slightly at first. For zones B3 and B4, the DSAFs tend to decrease initially and then increase with the tunnel dip, but for the case of k = 2.5, it can be found that the DSAFs monotonically increase with the tunnel dip. On the other hand, the DSAF generally increases with the time ratio k, which means that the longer the stress wave wavelength, the greater the total maximum stress in the surrounding rock.
Figure 12 presents the microcrack distribution in surrounding rock under different wavelengths. When β = 0°, there are almost no microcracks around the non-adjacent tunnel, but when the wavelength increases to a certain extent (e.g., k = 10), the microcracks will gradually extend from the adjacent tunnel to the non-adjacent tunnel, such as the microcrack C1. This phenomenon shows that, when the wavelength exceeds a certain critical value, the instability of adjacent tunnels may lead to instability in non-adjacent tunnels. When β = 45° and β = 90°, it is clear that, with the increase of time ratio k, the damage around the non-adjacent tunnel becomes more and more serious. Besides, the interaction between the two tunnels seems to be more obvious under the higher wavelength. For example, when β = 45°, no penetrating failure zone forms between the two tunnels under the smaller time ratios (e.g., k = 2.5), but does do so under larger time ratios (e.g., k = 10). Certainly, when β = 90°, the penetrating failure zones were also formed between the two tunnels, but it is obvious that the penetrating failure zones increase with the wavelength. These results show that the long stress wave is more likely to cause damage to the non-adjacent tunnel than the short stress wave. Therefore, the designing and protecting strategy of underground engineering can be optimized. For example, for dynamic disturbance with a short wavelength, the roof and floor of a non-adjacent tunnel should be protected. However, for dynamic disturbance with a long wavelength, the areas between the adjacent tunnel and non-adjacent tunnel should also be monitored to determine whether there is a trend of penetrating failure.
The rapid release of strain energy is an important index of rock burst intensity. Generally, more release of strain energy will cause severe rock burst. To further evaluate the strain energy evolution law before and after blasting, the SED variation is defined, which is the difference between initial SED and final SED. The value of SED variation greater than zero represents the accumulation of strain energy and the value less than zero represents the release of strain energy.
Figure 13 presents the variation of strain energy density before and after blasting. For zone B1, the SED variations tend to initially increase and then decrease with the tunnel dip β. Especially, when k = 10, the SED variation directly decreases with the tunnel dip β. This is the reason that the accumulated deformation of zone B1 tends to increase with the tunnel dip β, but when the tunnel dip approaches a specific value, some damage will occur around the zone B1, which leads to the partial deformation recovery of the zone B1 and the decrease in SED variation. For example, when β = 45° and k = 2.5 or 5, there is almost no damage in zone B1, so the corresponding SED variation is positive; but when β = 45° and k = 10, there is obvious damage in zone B1 (as shown in Figure 12), so the corresponding SED variation is negative.
For zone B2, as the tunnel dip β increases, the damage to surrounding rock will be more and more serious. Therefore, the SED variation tends to decrease with the tunnel dip β (such as in the case of k = 5 and 10). Especially, when k = 2.5, the SED variation exhibits a trend of decreasing first and then increasing. This is because, when the tunnel dip is 90°, the total energy obtained by zone B2 is greater than those of the other dips. Another reason is that when k = 2.5, the stress wavelength is too short and there is not enough damage in zone B2. The combination of these two causes leads to the insufficient release of strain energy. Therefore, the SED variation in the case of β = 90° and k = 2.5 is the largest.
For zones B3 and B4, the SED variations decrease with the tunnel dip β. In addition, it is worth noting that, for zones B2 and B4, the SED variation decreases with the time ratio k. The results suggest that the strain energy release of the roof and floor will increase with the wavelength. For zones B1 and B3, there is no simple positive or negative correlation between the SED variation and wavelength.
In summary, the stress evolution, energy evolution and damage characteristics of the surrounding rock are closely related to the tunnel dip and stress wave wavelength. In practical engineering, the effect of the nearby blasting disturbance can be predicted to a certain extent based on the existing wavelength information of the blasting wave and tunnel distribution information. For example, in two successive blasting activities with different charge lengths, the information of the second blasting, such as the damage and energy evolution characteristics of the roof and floor of the non-adjacent tunnel, can be effectively predicted based on the first blasting. Therefore, it is very necessary to evaluate the dynamic response and damage of non-adjacent tunnels with different tunnel distributions. It should be noted that the real rock stratum may contain a large number of random discontinuities (not considered in this study). According to previous studies [49,50], these discontinuities often affect the mechanical behavior of surrounding rock widely. Therefore, in our subsequent research, the properties of these discontinuities, including size, density, distribution and cohesiveness, will be further considered to reveal the dynamic behavior of the tunnels.

5. Conclusions

This work extends the existing research on the mechanical problem of multiple tunnels under static load to the dynamic problem, because blasting disturbance often triggers a different mechanical response from that under static load. In addition, it is also different from previous studies in that the focus of this work has shifted from a single tunnel or the tunnel near the disturbance source to a remote non-adjacent tunnel. To study the dynamic behavior of the non-adjacent tunnel, the numerical models of two tunnels with different distributions were established by the particle flow code (PFC2D).
The dynamic stress evolution around the non-adjacent tunnel is initially examined. It can be found that the tunnel distribution can affect the dynamic stress response around the non-adjacent tunnel. In the roof and floor of the non-adjacent tunnel, the stress wave waveform is commonly unchanged, while the stress amplitude will change obviously. In the sidewalls of the non-adjacent tunnel, both the waveform and amplitude of the stress wave will change obviously. In addition, the damage of the surrounding rock is closely related to the tunnel distribution. Generally, the damage around the non-adjacent tunnel increases with the tunnel dips. When β = 0°, there is no damage around the non-adjacent tunnel, but when β = 90°, there is obvious damage around the non-adjacent tunnel and the penetrating failure forms between the two tunnels. On the other hand, the evolution of strain energy was examined. In general, the strain energy density (SED) will undergo a stage of rapid accumulation and release and the maximum strain energy density in different areas around the non-adjacent tunnel will show different trends with the increase in tunnel dip.
The dynamic response and damage characteristic of the non-adjacent tunnel caused by the blasting wave with different wavelengths was further examined. It can be found that the tunnel dip has an obvious influence on the dynamic stress amplification factor (DSAF) and the effect of tunnel dip changes with wavelength. Generally, the DSAF around the non-adjacent tunnel increases with the wavelength. By observing the distribution characteristics of microcracks around non-adjacent tunnel under different wavelength, it can be found that the long wavelength is more likely to induce rock mass damage than the short wavelength. Subsequently, the SED variation before and after blasting was further analyzed. In the right sidewall of the non-adjacent tunnel, the SED variations tend to increase first and then decrease with the tunnel dip. In the roof of the non-adjacent tunnel, the SED variations tend to decrease with the tunnel dip. In the left sidewall and floor, the SED variations tend to decrease with the tunnel dip. In addition, the longer the wavelength, the more conducive to the strain energy release of the roof and floor. Overall, this study provides some insight into the dynamic behavior of local twin tunnels. Some prediction and analysis, including stability analysis of surrounding rock, vibration assessment of surrounding rock and optimization and control of blasting method, can be preliminarily given.

Author Contributions

Methodology, J.Q.; investigation, J.Q. and F.F.; writing—original draft preparation, J.Q.; writing—review and editing F.F.; project administration, J.Q.; funding acquisition, F.F. All authors have read and agreed to the published version of the manuscript.

Funding

This research was funded by the National Natural Science Foundation of China (No. 52004143) and the China postdoctoral science foundation (2020M682881 and 2021T140473).

Data Availability Statement

The data used to support the findings of this study are available from the corresponding author upon request.

Conflicts of Interest

The authors declared that there are no conflict of interest to the work submitted.

References

  1. Xie, H.P.; Gao, F.; Ju, Y.; Zhang, R.; Gao, M.Z.; Deng, J.H. Novel idea and disruptive technologies for the exploration and research of deep earth. Adv. Eng. Sci. 2017, 49, 1–8. (In Chinese) [Google Scholar]
  2. Wang, S.; Sun, L.; Li, X.; Zhou, J.; Du, K.; Wang, S.; Khandelwal, M. Experimental investigation and theoretical analysis of indentations on cuboid hard rock using a conical pick under uniaxial lateral stress. Geomech. Geophys. Geo-Energ. Geo-Resour. 2022, 8, 34. [Google Scholar] [CrossRef]
  3. Feng, F.; Chen, S.J.; Li, D.Y.; Hu, S.T.; Huang, W.P.; Li, B. Analysis of fractures of a hard rock specimen via unloading of central hole with different sectional shapes. Energy Sci. Eng. 2019, 7, 2265–2286. [Google Scholar] [CrossRef] [Green Version]
  4. Weng, L.; Huang, L.; Taheri, A.; Li, X.B. Rockburst characteristics and numerical simulation based on a strain energy density index: A case study of a roadway in Linglong gold mine, china. Tunn. Undergr. Space Technol. 2017, 69, 223–232. [Google Scholar] [CrossRef]
  5. Chen, S.J.; Feng, F.; Wang, Y.J.; Li, D.Y.; Huang, W.P.; Zhao, X.D.; Jiang, N. Tunnel failure in hard rock with multiple weak planes due to excavation unloading of in-situ stress. J. Cent. South. Un. 2020, 27, 2864–2882. [Google Scholar] [CrossRef]
  6. Lu, J.; Yin, G.Z.; Gao, H.; Li, X.; Zhang, D.M.; Deng, B.Z.; Wu, M.Y.; Li, M.H. True triaxial experimental study of disturbed compound dynamic disaster in deep underground coal mine. Rock Mech. Rock Eng. 2020, 53, 2347–2364. [Google Scholar] [CrossRef]
  7. Xie, H.P.; Gao, F.; Ju, Y. Research and development of rock mechanics in deep ground engineering. Chin. J. Rock Mech. Eng. 2015, 34, 2161–2178. (In Chinese) [Google Scholar]
  8. Li, X.B.; Qiu, J.D.; Zhao, Y.Z.; Chen, Z.H.; Li, D.Y. Instantaneous and long-term deformation characteristics of deep room-pillar system induced by pillar recovery. Trans. Nonferrous Met. Soc. China 2020, 30, 2775–2791. [Google Scholar] [CrossRef]
  9. Li, D.Y.; Han, Z.Y.; Sun, X.L.; Zhou, T.; Li, X.B. Dynamic mechanical properties and fracturing behavior of marble specimens containing single and double flaws in SHPB tests. Rock Mech. Rock Eng. 2019, 52, 1623–1643. [Google Scholar] [CrossRef]
  10. Lu, J.; Zhang, D.M.; Huang, G.; Li, X.; Gao, H.; Yin, G.Z. Effects of loading rate on the compound dynamic disaster in deep underground coal mine. Int. J. Rock Mech. Min. Sci. 2020, 134, 104453. [Google Scholar] [CrossRef]
  11. Brady, B.H.G. Rock Mechanics: For Underground Mining; Springer: Berlin, Germany, 2004. [Google Scholar]
  12. Timoshenko, S.; Goodier, J.N. Theory of Elasticity; McGrawHill Book Company: New York, NY, USA, 1951. [Google Scholar]
  13. Exadaktylos, G.E.; Stavropoulou, M.C. A closed form elastic solution for stresses and displacements around tunnels. Int. J. Rock Mech. Min. Sci. 2002, 39, 905–916. [Google Scholar] [CrossRef]
  14. Zhao, K.; Liu, C.W.; Zhang, G.L. Solution for perimeter stresses of rocks around a rectangular chamber using the complex function of elastic mechanics. J. Min. Safety Eng. 2007, 24, 361–365. (In Chinese) [Google Scholar]
  15. Zhu, W.C.; Liu, J.; Tang, C.A.; Zhao, X.D.; Brady, B.H. Simulation of progressive fracturing processes around underground excavations under biaxial compression. Tunn. Undergr. Space Technol. 2005, 20, 231–247. [Google Scholar] [CrossRef]
  16. Gong, F.Q.; Luo, Y.; Li, X.B.; Si, X.F.; Tao, M. Experimental simulation investigation on rockburst induced by spalling failure in deep circular tunnels. Tunn. Undergr. Space Technol. 2018, 81, 413–427. [Google Scholar] [CrossRef]
  17. Si, X.F.; Huang, L.Q.; Li, X.B.; Ma, C.D.; Gong, F.Q. Experimental investigation of spalling failure of D-shaped tunnel under three-dimensional high-stress conditions in hard rock. Rock Mech. Rock Eng. 2021, 54, 3017–3038. [Google Scholar] [CrossRef]
  18. Luo, Y. Influence of water on mechanical behavior of surrounding rock in hard-rock tunnels: An experimental simulation. Eng. Geo. 2020, 277, 105816. [Google Scholar] [CrossRef]
  19. Li, X.B.; Weng, L. Numerical investigation on fracturing behaviors of deep-buried opening under dynamic disturbance. Tunn. Undergr. Space Technol. 2016, 54, 61–72. [Google Scholar] [CrossRef]
  20. Si, X.F.; Gong, F.Q. Strength-weakening effect and shear-tension failure mode transformation mechanism of rockburst for fine-grained granite under triaxial unloading compression. Int. J. Rock Mech. Min. Sci. 2020, 131, 104347. [Google Scholar] [CrossRef]
  21. Xia, X.; Li, H.B.; Li, J.C.; Liu, B.; Yu, C. A case study on rock damage prediction and control method for underground tunnels subjected to adjacent excavation blasting. Tunn. Undergr. Space Technol. 2013, 35, 1–7. [Google Scholar] [CrossRef]
  22. Chen, Z.; Huang, L.Q.; Li, X.B.; Weng, L.; Wang, S. Influences of the height to diameter ratio on the failure characteristics of marble under unloading conditions. Int. J. Geomech. 2020, 20, 04020148. [Google Scholar] [CrossRef]
  23. Feng, F.; Chen, S.J.; Wang, Y.J.; Huang, W.P.; Han, Z.Y. Cracking mechanism and strength criteria evaluation of granite affected by intermediate principal stresses subjected to unloading stress state. Int. J. Rock Mech. Min. Sci. 2021, 143, 104783. [Google Scholar] [CrossRef]
  24. Qiu, J.D.; Li, D.Y.; Li, X.B.; Zhu, Q.Q. Numerical investigation on the stress evolution and failure behavior for deep roadway under blasting disturbance. Soil. Dyn. Earthq. Eng. 2020, 137, 106278. [Google Scholar] [CrossRef]
  25. Qiu, J.D.; Li, X.B.; Li, D.Y.; Zhao, Y.Z.; Hu, C.W.; Liang, L.S. Physical model test on the deformation behavior of an underground tunnel under blasting disturbance. Rock Mech. Rock Eng. 2021, 54, 91–108. [Google Scholar] [CrossRef]
  26. Li, C.J.; Li, X.B. Influence of wavelength-to-tunnel-diameter ratio on dynamic response of underground tunnels subjected to blasting loads. Int. J. Rock Mech. Min. Sci. 2018, 112, 323–338. [Google Scholar] [CrossRef]
  27. Zhu, W.C.; Zuo, Y.J.; Shang, S.M.; Li, Z.H.; Tang, C.A. Numerical simulation of instable failure of deep rock tunnel triggered by dynamic disturbance. Chin. J. Rock Mech. Eng. 2007, 26, 915–921. (In Chinese) [Google Scholar]
  28. Kulynych, V.; Chebenko, V.; Puzyr, R.; Pieieva, I. Modelling the influence of gaseous products of explosive detonation on the processes of crack treatment while rock blasting. Min. Miner. Depos. 2021, 15, 102–107. [Google Scholar] [CrossRef]
  29. Slashchova, O.; Yalanskyi, O. Forecast of potentially dangerous rock pressure manifestations in the mine roadways by using information technology and radiometric control methods. Min. Miner. Depos. 2019, 13, 9–17. [Google Scholar] [CrossRef]
  30. Arnau, C.; Robert, A.; Jordi, R.; Teresa, P. Dynamic response of a double-deck circular tunnel embedded in a full-space. Tunn. Undergr. Space. Technol. 2016, 59, 146–156. [Google Scholar]
  31. Behshad, N.; Robert, A.; Arnau, C.; Jordi, R. Control of ground-borne underground railway-induced vibration from double-deck tunnel infrastructures by means of dynamic vibration absorbers. J. Sound Vib. 2019, 461, 114914. [Google Scholar]
  32. Li, C.J.; Li, X.B.; Liang, L.S. Dynamic response of existing tunnel under cylindrical unloading wave. Int. J. Rock Mech. Min. Sci. 2020, 131, 104342. [Google Scholar] [CrossRef]
  33. Feldgun, V.R.; Karinski, Y.S.; Yankelevsky, D.Z. The effect of an explosion in a tunnel on a neighboring buried structure. Tunn. Undergr. Space Technol. 2014, 44, 42–55. [Google Scholar] [CrossRef]
  34. Chen, R.S.; Chen, W.S.; Hao, H.; Li, J.D. Effect of internal explosion on tunnel secondary and adjacent structures: A review. Tunn. Undergr. Space Technol. 2022, 126, 104536. [Google Scholar] [CrossRef]
  35. Li, J.C.; Li, H.B.; Ma, G.W.; Zhou, Y.X. Assessment of underground tunnel stability to adjacent tunnel explosion. Tunn. Undergr. Space Technol. 2013, 35, 227–234. [Google Scholar] [CrossRef]
  36. Wen, X. Investigation report on intelligent mining technology of Kiruna Iron Mine. Min. Technol. 2014, 14, 1343–1347. (In Chinese) [Google Scholar] [CrossRef]
  37. Qiu, J.D.; Luo, L.; Li, X.B.; Li, D.Y.; Chen, Y.; Luo, Y. Numerical investigation on the tensile fracturing behavior of rock-shotcrete interface based on discrete element method. Int. J. Min. Sci. Technol. 2020, 3, 293–301. [Google Scholar] [CrossRef]
  38. Itasca Consulting Group Inc. Pfc2d User’s Manual, Version 4.0; Itasca Consulting Group Inc.: Minneapolis, MN, USA, 2008. [Google Scholar]
  39. Cai, M.F.; Liu, W.D.; Li, Y. In-situ stress measurement at deep position of Linglong gold mine and distribution of in-situ stress field in mine area. Chin. J. Rock Mech. Eng. 2010, 29, 227–233. (In Chinese) [Google Scholar]
  40. Li, X.B.; Li, C.J.; Cao, W.Z.; Tao, M. Dynamic stress concentration and energy evolution of deep buried tunnels under blasting loads. Int. J. Min. Sci. Tech. 2018, 104, 131–146. [Google Scholar] [CrossRef]
  41. Gibson, R.L.; Toksöz, M.N.; Dong, W. Seismic radiation from explosively loaded cavities in isotropic and transversely isotropic media. Bull. Seismol. Soc. Am. 1996, 86, 1910–1924. [Google Scholar]
  42. Krauthammer, T.; Astarlioglu, S.; Blasko, J.; Soh, T.B.; Ng, P.H. Pressure–impulse diagrams for the behavior assessment of structural components. Int. J. Impact Eng. 2008, 35, 771–783. [Google Scholar] [CrossRef]
  43. Luo, S.; Gong, F. Linear energy storage and dissipation laws of rocks under preset angle shear conditions. Rock Mech. Rock Eng. 2020, 53, 3303–3323. [Google Scholar] [CrossRef]
  44. Mansurov, V.A. Prediction of rockbursts by analysis of induced seismicity data. Int. J. Rock Mech. Min. Sci. 2001, 38, 893–901. [Google Scholar] [CrossRef]
  45. Ma, D.; Wang, J.J.; Cai, X.; Ma, X.T.; Zhang, J.X.; Zhou, Z.L. Effects of height/diameter ratio on failure and damage properties of granite under coupled bending and splitting deformation. Eng. Fract. Mech. 2019, 220, 106640. [Google Scholar] [CrossRef]
  46. Zhang, Y.; Liu, Y.X.; Tan, Y.Z.; Feng, J. Effect of underground stress waves with varied wavelengths on dynamic responses of tunnels. Geotech. Geol. Eng. 2017, 35, 2371–2380. [Google Scholar] [CrossRef]
  47. Wang, X.; Cai, M. Influence of wavelength-to-excavation span ratio on ground motion around deep underground excavations. Tunn. Undergr. Space Technol. 2015, 49, 438–453. [Google Scholar] [CrossRef]
  48. Pao, Y.H.; Mow, C.C. Diffraction of elastic waves and dynamic stress concentrations. J. Appl. Mech. 1973, 40, 213–219. [Google Scholar] [CrossRef] [Green Version]
  49. Xia, C.C.; Sun, Z.Q. Jointed Rock Mechanics of Engineering Rock; Tongji University Press: Shanghai, China, 2002. (In Chinese) [Google Scholar]
  50. Prudencio, M.; Jan, M.V.S. Strength and failure modes of rock mass models with non-persistent joints. Int. J. Rock Mech. Min. Sci. 2007, 44, 890−902. [Google Scholar] [CrossRef]
Figure 1. Mining methods in Kiruna Iron Mine in Sweden [36].
Mathematics 10 03705 g001
Figure 2. Schematic of parallel bond model: (a) composition; (b) mechanical behavior.
Mathematics 10 03705 g002
Figure 3. Experimental and numerical results of granite specimen under uniaxial compression: (a) stress-strain curve; (b) failure mode [24].
Mathematics 10 03705 g003
Figure 4. Schematic diagram of numerical models: (a) numerical model design scheme; (b) measuring circles setting and partial numerical model (1#—adjacent tunnel, 2#—non-adjacent tunnel).
Mathematics 10 03705 g004
Figure 5. Blasting stress wave.
Mathematics 10 03705 g005
Figure 6. Typical stress–time curve recorded by measuring circle.
Mathematics 10 03705 g006
Figure 7. Tangential stress waves around non-adjacent tunnel under different tunnel dips: (a) B1; (b) B2; (c) B3; (d) B4.
Mathematics 10 03705 g007
Figure 8. Microcrack distribution under different tunnel dip: (a) β = 0°; (b) β = 45°; (c) β = 90°.
Mathematics 10 03705 g008
Figure 9. Development process of the microcrack.
Mathematics 10 03705 g009
Figure 10. SED-time curve of typical zones under different tunnel dips: (a) B1; (b) B2; (c) B3; (d) B4.
Mathematics 10 03705 g010
Figure 11. Dynamic stress amplification factor under various tunnel dips and wavelengths: (a) B1; (b) B2; (c) B3; (d) B4.
Mathematics 10 03705 g011
Figure 12. Microcrack distribution in surrounding rock under different wavelength.
Mathematics 10 03705 g012aMathematics 10 03705 g012b
Figure 13. Variation of strain energy density before and after blasting: (a) B1; (b) B2; (c) B3; (d) B4.
Mathematics 10 03705 g013aMathematics 10 03705 g013b
Table 1. Macro mechanical properties of materials.
Mechanical ParametersGraniteNumerical SampleError (± %)
Density (kg/m3) 27402740-
Uniaxial compressive strength (MPa)158.45156.581.18
Elastic modulus (GPa)32.331.542.35
Poisson’s ratio0.2580.2541.55
Table 2. Micro mechanical properties of PB model.
Component ParametersValue
ParticleDensity (kg/m3)2740
Radius (m)0.06–0.096
Damping0.1
Linear contactModulus Ec (Gpa)15.7
Stiffness ratio (kn/ks)1.9
Friction coefficient µ0.7
Normal damping βn0
Shear damping βs0
Parallel bondFriction angle ϕ 30°
Modulus E ¯ c (Gpa)15.7
Stiffness ratio ( k ¯ n / k ¯ s )1.9
Tensile strength σ ¯ c (MPa)94 ± 10
Cohesion c ¯ (MPa)94 ± 10
Publisher’s Note: MDPI stays neutral with regard to jurisdictional claims in published maps and institutional affiliations.

