Article

Prediction of Surface Roughness in Turning Applying the Model of Nonlinear Oscillator with Complex Deflection

1
Bánki Donát Faculty of Mechanical and Safety Engineering, Obuda University, 1081 Budapest, Hungary
2
Faculty of Technical Sciences, University of Novi Sad, 21000 Novi Sad, Serbia
*
Author to whom correspondence should be addressed.
Mathematics 2022, 10(17), 3214; https://doi.org/10.3390/math10173214
Submission received: 30 July 2022 / Revised: 16 August 2022 / Accepted: 2 September 2022 / Published: 5 September 2022

Abstract

:
This paper deals with prediction of the roughness of a cutting surface in the turning process, applying the vibration data of the system. A new type of dynamic model for a workpiece-cutting tool system, appropriate for vibration simulation, is developed. The workpiece is modelled as a mass-spring system with nonlinear elastic property. The cutting tool acts on the workpiece with the cutting force which causes strong in-plane vibration. Based on the experimentally measured values, the cutting force is analytically described as the function of feed ratio and cutting speed. The mathematical model of the vibrating system is a non-homogenous strong nonlinear differential equation with complex function. A new approximate solution for the nonlinear equation is derived and analytic description of vibration is obtained. The solution depends on parameters of the excitation force, velocity of rotation and nonlinear properties of the system. Increasing the feed ratio at a constant velocity of the working piece, the frequency of vibration decreases and the amplitude of vibration increases; increasing the velocity of working piece for constant feed ratio causes an increase of the frequency and a decrease of the amplitude of vibration. Experiments demonstrate that the analytical solution of the nonlinear vibration model in turning process is in direct correlation with the cutting surface roughness. The predicted surface roughness is approximately (1–2) × 10−3 times smaller than the amplitude of vibration of the nonlinear model considered in this paper.

1. Introduction

Modern manufacturing requires good quality assurance of the turned parts. One of the quality indicators is the roughness of the machined surface. To meet the requirement for minimum surface roughness a significant amount of research has already been carried out. The investigations are mostly based on experimental data obtained by measuring during turning process. Thus, experiments are done for workpieces made of various materials such as Ti-6Al-4V [1,2], dry grey cast iron [3], Inconel 718 alloy [4], stainless steel [5,6,7], for AISI 5140 [8], and AISI 316L steel for biomedical purposes [9]. The roughness properties of the turning EN19 steel, cut with the coated carbide tool [10], AISID2 turning with minimal quantity of lubrication (MQL) [11], dry turning [12] and hard turning of AISI 52100 steel [13], and Haynes 263 and Inconel 718 superalloys turning with cryogenic cooling [14] have also been considered. The obtained results show that the roughness level differs for various workpieces and turning properties and parameters. Bonifacio and Diniz [15] found that the surface roughness varies due to tool wear. Suarez et al. found the effect of high-pressure cooling on the wear patterns on IN718 alloy [16] and of the cutting forces in turning of Haynes 282 [17]. De Aguiar et al. [18] concluded that tool wear is in correlation with vibration and Bhogal et al. [19] stated that vibration has an effect on the surface roughness. Nitin Ambhore et al. [20] evaluated the surface roughness by measuring the vibration acceleration. Abouelatta and Mádl [21] studied the correlation between surface roughness and cutting vibrations in turning. Selvam [22] found that there was a correlation between the measured frequency spectra of tool vibration and also the surface profile in turning [23]. Upadhyay et al. [1] and González-Laguna, A. et al. [24] extended the conclusion by analyzing the measured vibration signals. Based on the measured results it is concluded that the vibration properties, but also the roughness of the surface and the wear in turning [25], depend on the cutting tool parameters [26] and also on cutting parameters [27] e.g., speed, depth of cut, lubrication conditions and feed rate [12]. In addition, it is seen that based on the measured vibration properties of the system the prediction of the surface roughness is possible. To reduce the surface roughness, a significant number of methods for vibration elimination have been developed [28]. Special attention is given to avoidance of chatter [29] and regenerative vibration [30]. Recently, the tendency is towards describing mathematically the surface roughness and the vibration properties of cutting. For vibration prediction, simulation models [31], numeric [32] and evolutionary algorithms [33] and also machine learning [34] have been developed. Based on the experimentally obtained results, roughness of the surface is given in the polynomial form as the function of cutting speed, cutting depth and feed ratio [35]. Thomas et al. [36] stated that the correct vibration–surface roughness relationship requires knowledge of the cutting force. In [37], the circular and axial components of the cutting force are applied for vibration calculation. Empirical formulas of the cutting force are assumed as the product of cutting depth and feed rate [38] or even cutting speed [39]. Using the linear oscillatory model excited with cutting force, the prediction of the surface roughness has been carried out [6]. Unfortunately, the results were in large discrepancy with real systems.
The main reason for this is that the applied models are quite simple and differ considerably from the real system. In spite of the fact that the system is strongly nonlinear, for computing reasons, the models were assumed to be linear or with weak nonlinearity [40]. In addition, the considered models had a single degree-of-freedom, i.e., vibration was analyzed only in one direction.
To overcome the previous mentioned drawbacks, in this paper the model is assumed in a more complex form. Nonlinearity of the system is included in the model and the vibrations are analyzed in two orthogonal directions. The motion is described with the non-homogenous complex function strong nonlinear differential equation. In this paper, a solving procedure based on a homogenous complex function equation [41,42,43] is developed. The approximate solution is applied for discussion of vibration of the cutting system. The influence of feed rate and circular velocity of workpiece on the nonlinear cutting system is analyzed. The obtained vibration result is in correlation with the experimentally obtained surface roughness. The correlation is appropriate for qualitative analysis, as due to nonlinearity there is an extreme sensitivity on parameter variation of the system. In spite of that, the model suggested in the paper is highly recommended for prediction of surface roughness based on the computed vibration parameters.
The paper is divided into five sections. After the Introduction, in Section 2 the cutting system is modelled. The in-plane vibration of the workpiece–tool system is considered. The mathematical model is the function of the complex deflection function. In Section 3 the approximate solving procedure for the strong non-homogenous nonlinear differential equation with complex function is introduced. It is proved that the analytical solution is on the top of the numerical one. In Section 4 the model of the cutting force, based on the measured one, is developed. The calculated and the measured cutting forces are considered and compared. In Section 5 the vibration analyses of the cutting system caused with cutting force is done. The data are compared with measured values of surface roughness. The correlation between the vibration amplitude and measure surface roughness is found. The paper ends with a conclusion.

2. Modelling of the Cutting System

In Figure 1a the model of the cutting process is plotted. The system contains the workpiece and the cutting tool. The workpiece is assumed as a rotor which is rotating with angular velocity Ω. On the workpiece the active cutting force acts which causes the rotor center O to move to the new position (Figure 1b). If the motion of O along the rotor axis is negligible in comparison to that in x and y direction, vibration becomes in-plane in the Oxy coordinate system. Then, the rotor is assumed as a one mass system with two degrees-of-freedom. The motion of the rotor center is described with a complex deflection function z(t):
z ( t ) = x ( t ) + i y ( t )
where i =   1 is the imaginary unit and x(t) and y(t) are deflections in two orthogonal directions. The rotor has the total mass m. The elastic force of the rotor is assumed to be nonlinear and to have a linear and a nonlinear term, i.e.,
F e = z ( c 1 + c 3 ( z z ¯ ) ) ,  
where ( · ¯ ) is the complex conjugate function of ( · ) and z z ¯ = x 2 + y 2 is the OO1 distance, c1 and c3 are coefficients of linear and nonlinear term of the elastic force, respectively.
On the rotor the cutting force acts. The cutting force has three components in three orthogonal directions: one along the workpiece and two in a plane orthogonal to the length of the workpiece.
In our paper, we consider the in-plane vibration and we apply the two components of the force: F x and F y in x and y direction. Thus, the total cutting force F z in x-y plane is
F z = F x + i F y
Assuming that the x direction corresponds to the radial direction and the y to the circular one, the force is
F z = F r + i F c
where F r is the radial and F c is the circular component of the cutting force. The additional effect in machining vibration is due to the gyroscopic force F g which is the result of the Coriolis acceleration in rotor, which takes into account the angular velocity of rotation Ω and velocity of the displacement z ˙ . Thus, for the gyroscopic coefficient g, the gyroscopic force is F g = i g Ω z ˙ .
Using the aforementioned, the mathematical model of the rotor is
m z ¨ i g Ω z ˙ + c 1 z + c 3 z ( z z ¯ ) = F z
It is a second order nonlinear differential equation with complex function and with constant excitation which describes the in-plane excited vibration with constant force.

3. Analytic Solving Procedure

Finding the closed analytic solution of the strong nonlinear Equation (4) is not an easy task. In this section the procedure for approximate solving is introduced. Solution of the Equation (4) is assumed in the form
z = A z + R e x p ( i ψ )
where ψ = ω t + θ ,   R, Az, ω, θ are constants. R is the amplitude of vibration, θ is the phase angle, ω is the frequency of vibration, and Az is a complex function. Substituting (5) into (4) it is
m ω 2 R e x p ( i ψ ) + g Ω ω R e x p ( i ψ ) + c 1 ( A z + R e x p ( i ψ ) ) + c 3 ( A z + R e x p ( i ψ ) ) 2 ( A z ¯ + R e x p ( i ψ ) ) = F
After some modification and separating the constant terms and those multiplied with e x p ( i ψ ) it follows
/ :   A z ( c 1 + c 3 ( ( A z A z ¯ ) + 2 R 2 ) = F z
e x p ( i ψ ) : m ω 2 + g Ω ω + c 1 + c 3 ( 2 A z A z ¯ + R 2 ) = 0
Solving the algebraic Equations (7) and (8), the unknown values of A z and ω   are obtained. Using (2) and the fact that
A z = A x + i A y ,
where Ax and Ay are values in x and y orthogonal directions, the Equation (7) is rewritten into two coupled equations
A x ( c 1 + c 3 ( ( A x 2 + A y 2 ) + 2 R 2 ) = F x
A y ( c 1 + c 3 ( ( A x 2 + A y 2 ) + 2 R 2 ) = F y
For reasons of calculation the two third order coupled Equations (10) and (11) are modified into
( A x 2 + A y 2 ) ( c 1 + c 3 ( ( A x 2 + A y 2 ) + 2 R 2 ) ) 2 = ( F x 2 + F y 2 )
Solving (12) the amplitude of vibration R is obtained as
R = F 2 a c 3 a 2 2 c 1 2 c 3
where a = A x 2 + A y 2 is the initial constant distance of the rotor center to O and F = F x 2 + F y 2 is the intensity of the cutting force.
(a)
Analyzing (13) it is seen that for F a ( c 1 + c 3 a 2 ) 0 the amplitude of vibration is zero. We can realize this case if the cutting force is smaller than the elastic force of the rotor. Unfortunately, in real systems the realization of the cutting process requires the cutting force to be significantly higher than the elastic force. So, it is concluded that in real conventional cutting processes vibrations always exist and therefore total elimination is impossible.
(b)
For F a ( c 1 + c 3 a 2 ) > 0 vibration of the system occurs. According to (5) the vibrations in two orthogonal directions are
x = A x + R c o s ( ω t + θ ) ,
y = A y + R s i n ( ω t + θ )
For the known value of a, the amplitude of vibration R (13) depends on the intensity of cutting force and elastic property of the cutting system. Substituting (13) into (10) and (11), we obtain the values of Ax and Ay in the form
A x = a F x F ,                       A y = a F y F .
According to (8) and (9) the frequency of vibration is
ω = g Ω + ( g Ω ) 2 + 4 m ( c 1 c 3 ( 2 a 2 + R 2 ) ) 2 m
Frequency of vibration depends on the amplitude of vibration R, parameters of elasticity, on value of a and the intensity of the cutting force F. For (13) the frequency expression is transformed into
ω = g Ω 2 m + 1 2 m ( g Ω ) 2 + 4 m ( c 1 1 2 ( 3 a 2 c 3 c 1 + F a ) )
Finally, for θ = 0 vibration in x and y direction is
x = a F x F + R c o s ( t ( g Ω 2 m + 1 2 m ( g Ω ) 2 + 4 m ( c 1 1 2 ( 3 a 2 c 3 c 1 + F a ) ) )
y = a F x F + R s i n ( t ( g Ω 2 m + 1 2 m ( g Ω ) 2 + 4 m ( c 1 1 2 ( 3 a 2 c 3 c 1 + F a ) ) )
To prove the accuracy of the approximate solution given with (19) and (20), it has to be compared with the exact solution of (4). To obtain the exact numerical solution of (4), it has to be rewritten into two coupled second order equations
m x ¨ + g Ω y ˙ + c 1 x + c 3 ( x 2 + y 2 ) x = F x
m y ¨ g Ω x ˙ + c 1 y + c 3 ( x 2 + y 2 ) y = F y
For parameter values m = 1, c1 = 10, c3 = 1, a = 1, g = 1, F = 10 the numerical solution of (21) and (22) is obtained by using the Runge Kutta procedure. In Figure 2 the numerically and analytically obtained x-t (19) and y-t (20) diagrams are plotted. Comparing the diagrams, it is seen that for short time intervals the difference in solutions is negligible. The difference is seen for long time intervals and is evident in the frequency of vibration. The frequency of vibration obtained analytically is higher than the exact one obtained by numerical calculation. However, the analytically obtained amplitude of vibration agrees with the numerically obtained one. Due to the fact that the analytically obtained solutions are close to exact numerical results, it is concluded that the suggested analytical model is appropriate for analysis of the influence of cutting force parameters on the vibration properties of the cutting system.

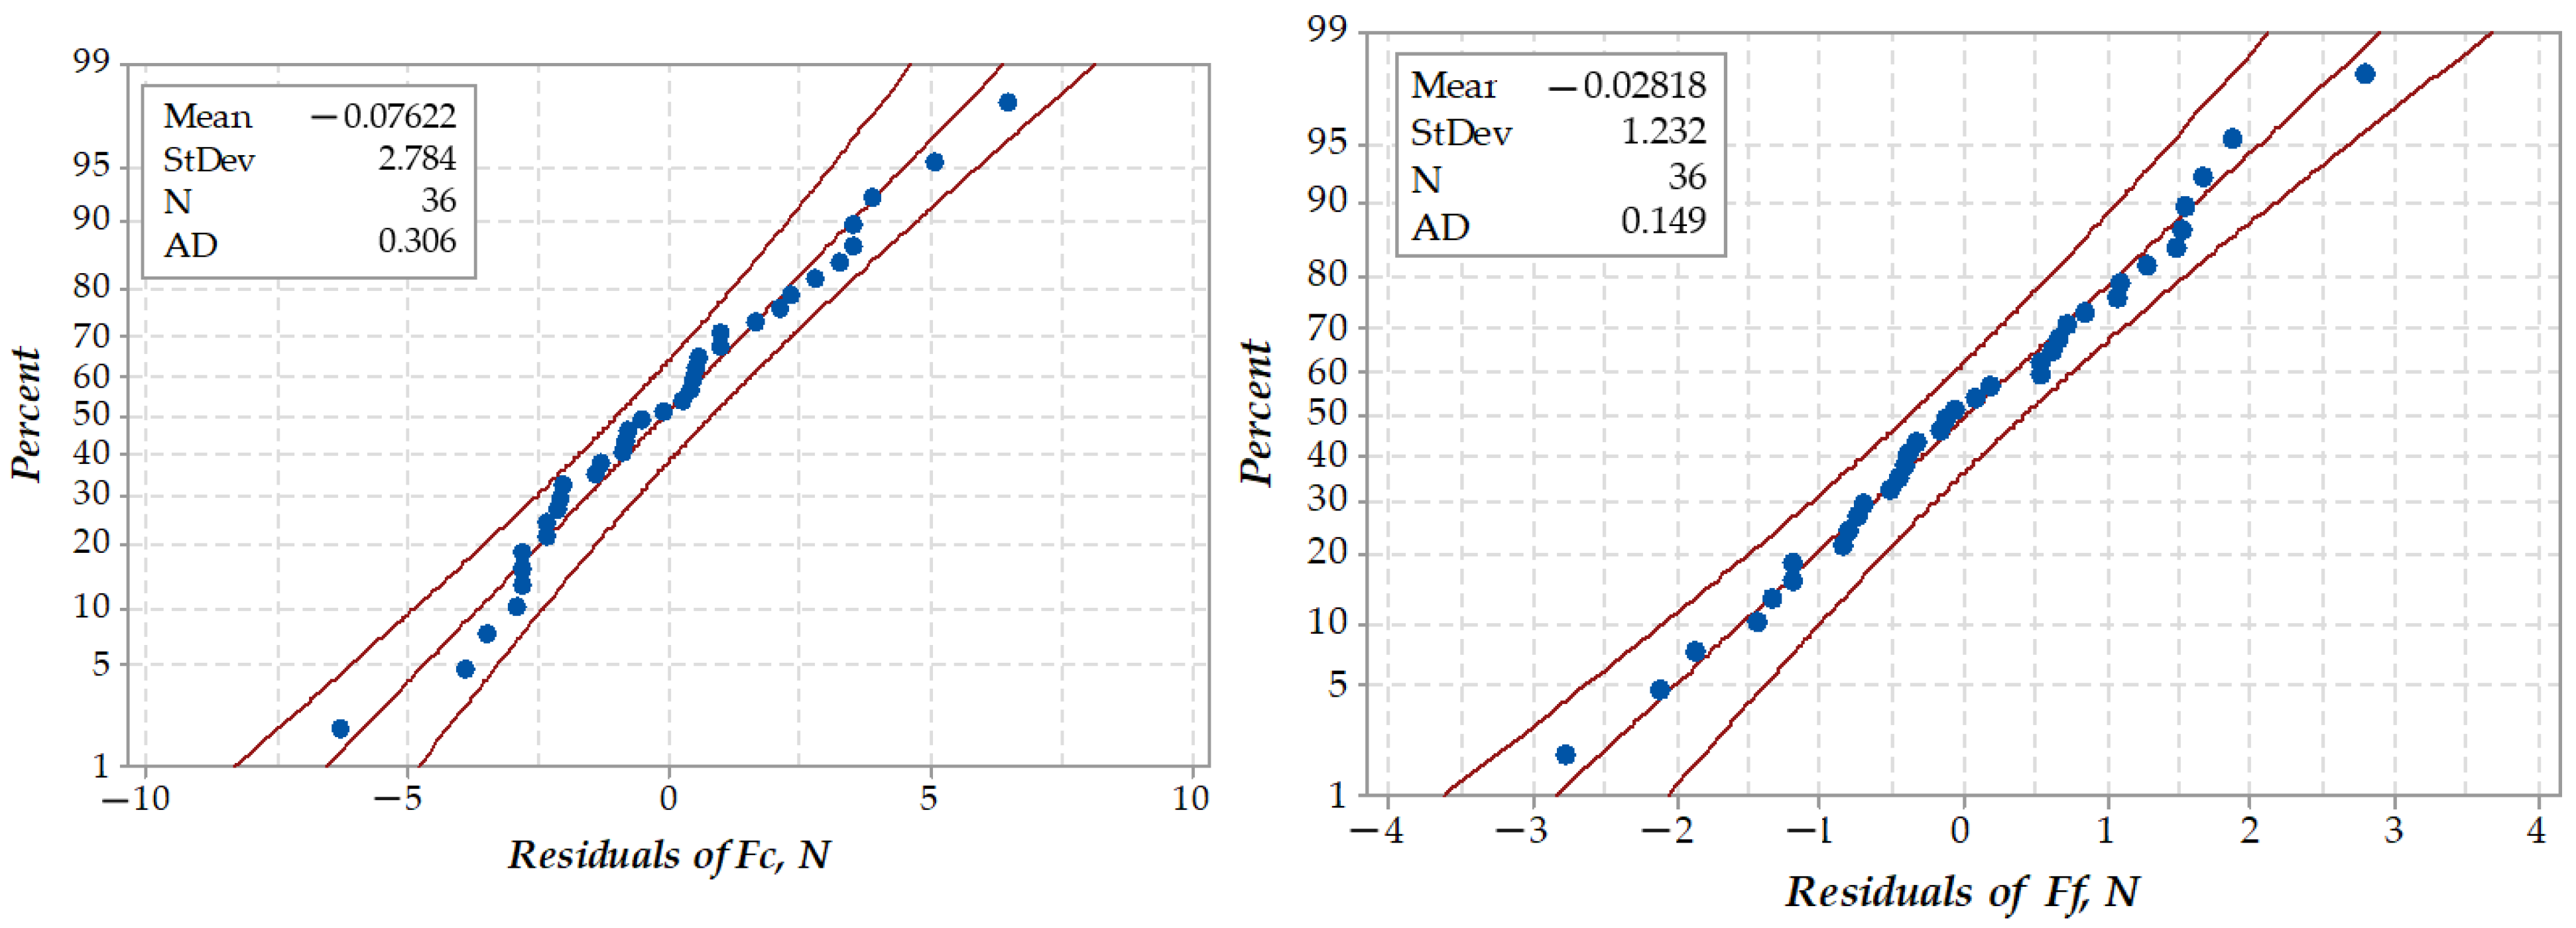
4. Measuring and Modelling of the Cutting Force

For mathematical modelling of the cutting force, the experimentally measured force is applied. In Figure 3 the experimental rig for turning process and cutting force measuring is shown. In the working piece holder of the Dugard Eagle BNC-1840 CNC lathe, the working piece is settled. The diameter of the working piece was 60 mm and the material was C45 (1.0503). A Kistler 9251A force measuring device with a 5019 multichannel charge amplifier was used to measure the force components during machining experiments. The cutting tool code was PDJNR 2525M 15 and the insert code was DCMT 11 T3 08-PM 4325 (Manufacturer: Sandvik Coromant Co., Sandviken, Sweden). The measured values of the cutting force in radial Fr and circular Fc directions are evaluated applying the DynoWare software (version 3.2.5.0).
Measuring of the cutting force was done for various cutting parameters. Namely, the goal was to achieve as wide a range of machining parameters as possible, as is used in the industry. Therefore, six different feed rates and six different cutting speeds were used to cut the working piece surface (6 f 6 v) at a total of 36 measuring points (see Figure 4). The depth of cut was constant, a = 1.6 mm. In addition, four other machining experiments were performed within the investigated machining parameter range to confirm the model. The locations of the points for experimental and model verification are shown in Figure 4. The measured cutting force components are given in Table 1.
Based on the measured values, the force F in the cutting surface x-y is calculated as F = F r 2 + F c 2 . Comparing the measured values, it is obvious that the circular cutting component is significantly higher than the components in radial direction. In addition, the measured data show the deep dependence of the force on the feed and velocity parameters. For the constant rotating velocity, due to variation of the feed rate from 0.18 mm to 0.3 mm the force increases 2 to 2.5 times. The influence is more significant for smaller velocities than for higher speeds. For the constant feed rate and variable velocity of the working piece, there was a change in the cutting force F. The force decreases with increases in the velocity of 5–6%. In spite of the fact that the influence of velocity on the force is smaller than that of the feed rate, both parameters are included into the mathematical model. The model of the force F = F(f,v) is assumed in the polynomial form, i.e.,
F c = a 0 + a 1   v + a 2   f + a 3   v 2 + a 4   f 2 + a 5   v   f
F r = b 0 + b 1   v + b 2   f + b 3   v 2 + b 4   f 2 + b 5   v   f
where ai and bi, i = 1, 2, 3, 4, 5 are unknown parameters. Using the already well-known fitting procedure, the parameters ai and bi are calculated. Models of the cutting forces in circular and radial directions based on the measured values are obtained
F c = 153.7 + 3015.9   f + 71   f 2 0.225   v 0.591   v   f + 0.000322   v 2
F r = 44.3 + 384.6   f + 104.2   f 2 + 0.029   v 0.379   v   f + 0.000076   v 2
where f (mm) is the feed rate and v (m/min) is the circular velocity of the workpiece. Values for Fr and Fc are calculated and shown in Table 1 according to (25) and (26). In Figure 5 the calculated and analytically obtained values of Fr and Fc are plotted. It is obvious that the calculated values are on the top of the measured ones. The error between the calculated and measured force is estimated and given in Table 1. The difference error is smaller than 2%.
In Figure 6 the residuals in a probability plot are shown. It is visible that the mean of the residuals is practically zero. The standard deviations of the residuals are very small (2.78 N for Fc and 1.23 N for Fr), and in both components of force the residuals follow a normal distribution.
Finally, it is concluded that expressions (25) and (26) are the appropriate models for the cutting force.

5. Discussion and Result Analysis

Using the mathematical model of the cutting force (25) and (26) the equations of motion (21) and (22) we obtain
m x ¨ + g Ω y ˙ + c 1 x +   c 3 ( x 2 +   y 2 ) x =   44.3 + 384.6   f + 104.2   f 2 + 0.029   v 0.379   v   f +   0.000076   v 2
m y ¨ g Ω x ˙ + c 1 y +   c 3 ( x 2 + y 2 ) y =   153.7 + 3015.9   f + 71   f 2 0.225   v 0.591   v   f +   0.000322   v 2
Using the aforementioned analytic solving procedure and the relations (27) and (28) we calculate the amplitude and frequency of vibration, according to (13) and (17), respectively, where
F 2 = ( 153.7 + 3015.9   f + 71   f 2 0.225   v 0.591   v   f + 0.000322   v 2 ) 2 + ( 44.3 + 384.6   f + 104.2   f 2 + 0.029   v 0.379   v   f + 0.000076   v 2 ) 2
As the cutting force depends on the feed value and the velocity it is expected that these parameters have an influence on the vibration property of the system and roughness of the cutting surface. Using the values given in Table 1 and relations (13) and (18), the amplitude and frequency of vibration of the workpiece–cutting tool system are calculated and shown in Table 2.
Analyzing the obtained results, it is seen that for the same value of velocity the amplitude of vibration increases while the frequency of vibration decreases with increasing of the feed ratio. The relative amplitude variation is 19.437%, 19.878%, 19.514% and the relative frequency variation is 7.0193%, 7.0193%, 6.5064% for v = 200, 280, 400 m/min, respectively.
On the contrary, for certain constant feed values, the amplitude of vibration decreases and the frequency of vibration increases by increasing the velocity v. Thus, for f = 0.18, 0.22, 0.30 mm the amplitude variations are 2.4768%, 1.9555%, 1.9827% and frequency variations are 2.4393%, 2.25714%, 2.9744%, respectively.
In this paper, the two most usual roughness parameters were measured: the Ra (arithmetic average height) parameter and the ten points height Rz (according to DIN, the average of the summation of the five highest peaks and the five lowest valleys along profile) parameter [44]. Measuring was done with Mitutoyo Surfest SJ 301 roughness tester for the measuring length of 4 mm, cut-off parameter 0.8, base length number N = 5 and measuring speed of 0.5 mm/s. In Table 3, some of the measured values are shown.
In Figure 7, the roughness diagrams for v = 200 m/min and various feed values are plotted. It is shown that by increasing the feed ratio, the amplitude and frequency of roughness increase.
In Figure 8, the roughness of the surface for various values of the circular velocity of the working piece and constant food ratio is plotted. The amplitude of the roughness is almost constant, independent of the velocity of the working piece.
Comparing the results plotted in Figure 7 and Figure 8, it is concluded that the circular velocity has a smaller influence on the surface roughness than the feed ratio. The same result is obtained by analyzing (25) and (26). Namely, it is seen that the force terms connected with feed ratio are more significant than those with circular velocity.
In Table 4, surface roughness–vibration amplitude correlation parameters for various workpiece velocity and feed ratios are calculated.
The averaged prediction coefficients for surface roughness are calculated and presented in Table 4. The coefficients give the possibility to predict the surface roughness based on the computed vibration amplitude. Namely, the predicted surface roughness Ra or Rz is the product of the calculated vibration amplitude R (13) for turning with a certain velocity, feed ratio and cutting depth of a certain material and of the corresponding averaged coefficient.

6. Conclusions

This paper deals with prediction of the roughness of a cutting surface in the turning process, applying the vibration data of the system. Vibration of the working piece is caused by action of the cutting force of the cutting tool. The model of the system is assumed as a one-mass two degrees-of-freedom rotor excited with a constant force. The mathematical description of vibration is a strong nonlinear differential equation with complex deflection function. There is no closed form solution for the equation and in this paper the approximate solving procedure was developed. The obtained solution was shown to depend on vibration parameters which give the possibility to predict the roughness of the surface by varying the feed rate and velocity in the cutting process without conducting experiments and experimental measuring. The additional conclusions are as follows:
  • The nonlinear oscillator excited with the constant excitation force is the suitable model for vibration simulation of the workpiece-cutting tool in the turning process.
  • Using the fitting method of the measured values of the cutting force, the force function on velocity of the workpiece and feed ratio in turning may be derived. The numerically computed force correlates with the experimentally measured one.
  • The mathematical procedure for solving two coupled differential equations described with complex displacement functions gives approximate solutions which are suitable for the description of vibrations in the cutting process.
  • If the nonlinearity of the system is higher, i.e., the rigidity of the workpiece is higher, the amplitude of vibration is smaller.
  • The amplitude and frequency of vibration strongly depend on the variation of the feed ratio. Upon increasing the feed ratio at a constant velocity of the working piece, the frequency of vibration decreases and the amplitude of vibration increases. The amplitude variation is up to 20% and the frequency of variation up to 8%. A higher value of variation is evident for a smaller velocity of the working piece.
  • If the feed ratio is constant, upon increasing of the velocity of working piece the frequency of vibration also increases, while the amplitude of vibration decreases. However, the frequency and amplitude variation are not higher than 2.5%. Hence, it is concluded that the increase of the velocity of the workpiece does not have a significant influence on variation of the vibration properties.
  • Comparing the analytic vibration results with experimentally measured surface roughness, it is shown that they are in agreement. Thus, for the constant cutting velocity and increasing of feed ratio, both amplitude of vibration and surface roughness are increasing too. The higher the feed ratio, the higher the roughness value. Conversely, if the cutting feed is constant, the increase of the cutting velocity does not have a significant influence on variation of the vibration and the roughness of the cutting surface.
  • Finally, the mathematical model suggested in the paper gives the vibration parameters which give the possibility to predict the roughness of the surface by varying the feed rate and velocity in cutting process without conducting experiments and experimental measuring. The ratio of surface roughness (in μm) and amplitude of vibration of the workpiece (in mm) is approximately (1–2) × 10−3.
The intention of the recent machining industry using computer-aided electronic and mechanical support systems is to improve the development of the Industry 4.0 [45]. In this sense, future investigations should be directed toward application of the results presented in this paper for controlling surface roughness in turning based on the calculated amplitude of vibration.
The authors plan to continue their research on solving the problem of interaction of transversal and axial vibrations in the turning process, with the aim of vibration elimination and minimization of the cutting surface roughness.

Author Contributions

Conceptualization, L.C.; Formal analysis, I.N.; Investigation, R.H. and I.N.; Methodology, L.C.; Writing—original draft, L.C. and R.H. All authors have read and agreed to the published version of the manuscript.

Funding

This research received no external funding.

Institutional Review Board Statement

Not applicable.

Informed Consent Statement

Not applicable.

Data Availability Statement

The measured and used data are available in this study. Further necessary data presented are available on request from the corresponding author.

Conflicts of Interest

The authors declare no conflict of interest.

References

  1. Upadhyay, V.; Jain, P.K.; Mehta, N.K. In-process prediction of surface roughness in turning of Ti-6Al-4V alloy using cutting parameters and vibration signals. Measurement 2013, 46, 154–160. [Google Scholar] [CrossRef]
  2. Sahu, N.K.; Andhare, A.B.; Andhale, S.; Abraham, R.R. Prediction of surface roughness in turning of Ti-6Al-4V using cutting parameters. In Proceedings of the IOP Conference Series: Materials Science and Engineering, Dubai, United Arab Emirates, 28–29 November 2017; IOP Publishing: Bristol, UK, 2018; Volume 346, p. 6. [Google Scholar]
  3. Herwan, J.; Kano, S.; Ryabov, O.; Sawada, H.; Kasashima, N.; Mizaka, T. Predicting surface roughness of dry cut grey cast-iron based on cutting parameters and vibration signals from different sensor positions in CNC turning. Int. J. Autom. Technol. 2020, 14, 217–228. [Google Scholar] [CrossRef]
  4. Wenping, M.; Shaowei, Z. Vibration of tool wear and surface roughness characteristics in turning of Inconel 718 alloy with ceramic insert under LN(2) machining. J. Braz. Soc. Mech. Sci. Eng. 2020, 42, 369. [Google Scholar]
  5. Fernández-Abia, A.I.; Barreiro, J.; López de Lacalle, L.N.; Martínez, S. Effect of very high cutting speeds on shearing, cutting forces and roughness in dry turning of austenitic stainless steels. Int. J. Adv. Manuf. Technol. 2011, 57, 61–71. [Google Scholar] [CrossRef]
  6. Abu-Mahfouz, I.; Banerjee, A.; Pahman, E. Evaluation of clustering techniques to predicts surface roughness during turning of stainless steel using vibration signals. Materials 2021, 14, 5050. [Google Scholar] [CrossRef]
  7. Liu, N.; Liu, B.; Jiang, H.; Wu, S.; Yang, C.; Chen, Y. Study on vibration and surface roughness in MQCL turning on stainless steel. J. Manuf. Processes 2021, 65, 343–353. [Google Scholar] [CrossRef]
  8. Kuntoglu, M.; Aslan, A.; Pimenov, D.Y.; Glasin, K.; Mikoljczek, T.; Sharma, S. Modeling of cutting parameters and tool geometry for multi criterion optimization of surface roughness and vibration via response surface methodology in turning of AISI 5140 steel. Materials 2020, 13, 4242. [Google Scholar] [CrossRef]
  9. Alfonso, R.D.R.; Rodríguez, R.P.; Robledo, P.C.Z.; Santana, M.R.; Quiza, R. Optimization of the cutting regime in the turning of the AISI 316L steel for biomedical purposes based on the initial progression of tool wear. Metals 2021, 11, 1698. [Google Scholar] [CrossRef]
  10. Shankar, N.V.S.; Shankar, H.R.; Kumar, N.P.; Saichandu, K. Process parameter optimization for minimizing vibrations and surface roughness during turning EN19 steel using coated carbide tool. Mater. Today Proc. 2020, 24 Pt 2, 788–797. [Google Scholar] [CrossRef]
  11. Ozbek, O.; Saruhan, H. The effect of vibration and cutting zone temperature on surface roughness and tool wear in eco-friendly MQL turning of AISID2. J. Mater. Res. Technol. 2020, 9, 2762–2772. [Google Scholar] [CrossRef]
  12. Magalhães, L.C.; Carlesso, G.C.; López de Lacalle, L.N.; Souza, M.T.; Palheta, F.D.O.; Binder, C. Tool wear effect on surface integrity in AISI 1045 steel dry turning. Materials 2022, 15, 2031. [Google Scholar] [PubMed]
  13. Ambhore, N.; Kamble, D.; Chinchanikar, S. Prediction of cutting tool vibration and surface roughness in hard turning of AISI52100 steel. In Proceedings of the 14th International Conference on Vibration Engineering and Technology of Machinery (VETOMAC XIV), MATEC Web Conferences. Lisbon, Portugal, 10–13 September 2018; Volume 211, p. 03011. [Google Scholar]
  14. Amigo, F.J.; Urbikain, G.; Pereira, O.; Fernández-Lucio, P.; Fernández-Valdivielso, A.; López de Lacalle, L.N. Combination of high feed turning with cryogenic cooling on Haynes 263 and Inconel 718 superalloys, J. Manuf. Processes 2020, 58, 208–222. [Google Scholar] [CrossRef]
  15. Kuntoğlu, M.; Gupta, M.K.; Aslan, A.; Salur, E.; Collado, A.G. Influence of tool hardness on tool wear, surface roughness and acoustic emissions during turning of AISI 1050. Surf. Topogr. Metrol. Prop. 2022, 10, 015016. [Google Scholar] [CrossRef]
  16. Suárez, A.; López de Lacalle, L.N.; Polvorosa, R.; Veiga, F.; Wretland, A. Effects of high-pressure cooling on the wear patterns on turning inserts used on alloy IN718. Mater. Manuf. Processes 2017, 32, 678–686. [Google Scholar] [CrossRef]
  17. Suarez, A.; Veiga, F.; López de Lacalle, L.N.; Polvorosa, R.; Wretland, A. An investigation of cutting forces and tool wear in turning of Haynes 282. J. Manuf. Processes 2019, 37, 529–540. [Google Scholar] [CrossRef]
  18. De Aguiar, M.M.; Diniz, A.E.; Pederiva, R. Correlating surface roughness, tool wear and tool vibration in the milling process of hardened steel using long slender tools. Int. J. Mach. Tools Manuf. 2013, 68, 1–10. [Google Scholar]
  19. Bhogal, S.S.; Sindhu, C.; Dhami, S.S.; Pabla, B.S. Minimization of surface roughness and tool vibration in CNC milling operation. J. Optim. 2015, 2015, 192030. [Google Scholar] [CrossRef]
  20. Ambhore, N.; Kamble, D.; Chinchanikar, S. Evaluation of cutting tool vibration and surface roughness in hard turning of AISI 52100 steel: An experimental and ANN approach. J. Vib. Eng. Technol. 2020, 8, 455–462. [Google Scholar]
  21. Abouelatta, O.B.; Madl, J. Surface roughness prediction based on cutting parameters and tool vibrations in turning operations. J. Mater. Process. Technol. 2001, 118, 269–277. [Google Scholar] [CrossRef]
  22. Kuntoglu, M.; Aslan, A.; Pimenov, D.Y.; Usca, U.A.; Salur, E.; Gupta, M.K.; Mikolajczyk, T.; Giasin, K.; Kapłonek, W.; Sharma, S. A Review of indirect tool condition monitoring systems and decision-making methods in turning: Critical analysis and trends. Sensors 2021, 21, 108. [Google Scholar] [CrossRef]
  23. Okokpujie, I.P.; Salawu, E.Y.; Nwoke, O.N.; Okokonkwo, M.C.; Ohijeagbon, I.O.; Okokpujie, K. Effects of process parameters on vibration frequency in turning operations of Perspex, Effects Material. In Proceedings of the World Congress in Engineering, London, UK, 4–6 July 2018; Volume II. [Google Scholar]
  24. González-Laguna, A.; Barreiro, J.; Fernández-Abia, A.; Alegre, E.; González-Castro, V. Design of a TCM system based on vibration signal for metal turning processes. Procedia Eng. 2015, 132, 405–412. [Google Scholar]
  25. Prasad, B.S.; Babu, M.P. Correlation between vibration amplitude and tool wear in turning: Numerical and experimental analysis. Eng. Sci. Technol. Int. J. 2017, 20, 197–211. [Google Scholar] [CrossRef]
  26. Ince, M.A.; Asilturki, J. Effects of cutting tool parameters on vibration. In Proceedings of the 2016 3rd International Conference on Mechanics and Mechatronics Research (ICMMR 2016), MATEC Web Conference. Chongqing, China, 15–17 June 2016; Volume 77, p. 07006. [Google Scholar]
  27. Bezyayzchnyi, V.F.; Sutyagin, A.N. Influence of vibration on surface roughness in turning. Russ. Eng. Res. 2019, 39, 612–616. [Google Scholar] [CrossRef]
  28. Urbikain, G.; Olvera, D.; Lopez de Lacalle, L.N.; Beranoagirre, A.; Elias-Zuniga, A. Prediction methods and experimental techniques for chatter avoidance in turning systems: A review. Appl. Sci. 2019, 9, 4718. [Google Scholar] [CrossRef] [Green Version]
  29. Urbikain, G.; Campa, F.-J.; Zulaika, J.-J.; López de Lacalle, L.N.; Alonso, M.-A.; Collado, V. Preventing chatter vibrations in heavy-duty turning operations in large horizontal lathes. J. Sound Vib. 2015, 340, 317–330. [Google Scholar]
  30. Urbikain, G.; López de Lacalle, L.N.; Fernández, A. Regenerative vibration avoidance due to tool tangential dynamics in interrupted turning operations. J. Sound Vib. 2014, 333, 3996–4006. [Google Scholar]
  31. Urbikain, G.; López de Lacalle, L.N.; Arsuaga, M.; Alvarez, A.; Alonso, M.A.; Veiga, F. A reliable turning process by the early use of a deep simulation model at several manufacturing stages. Machines 2017, 5, 15. [Google Scholar] [CrossRef]
  32. Urbikain, G.; Olvera, D.; López de Lacalle, L.N.; Elías-Zúñiga, A. Stability and vibrational behaviour in turning processes with low rotational speeds. Int. J. Adv. Manuf. Technol. 2015, 80, 871–885. [Google Scholar]
  33. Sivalingam, V.; Sun, J.; Mahalingam, S.K.; Nagarajan, L.; Natarajan, Y.; Salunkhe, S.; Nasr, E.A.; Davim, J.P.; Hussein, H.M.A.M. Optimization of process parameters for turning Hastelloy X under different machining environments using evolutionary algorithms: A comparative study. Appl. Sci. 2021, 11, 9725. [Google Scholar] [CrossRef]
  34. Dubey, V.; Sharma, A.K.; Pimenov, D.Y. Prediction of surface roughness using machine learning approach in MQL turning of AISI 304 steel by varying nanoparticle size in the cutting fluid. Lubricants 2022, 10, 81. [Google Scholar]
  35. Su, Y.; Li, C.; Zhao, G.; Li, C.; Zhao, G. Prediction models for specific energy consumption of machine tools and surface roughness based on cutting parameters and tool wear. Proc. Inst. Mech. Eng. Part B J. Eng. Manuf. 2020, 235, 1225–1234. [Google Scholar]
  36. Kuntoglu, M.; Aslan, A.; Saglam, H.; Pimenov, D.Y.; Giasin, K.; Mikolajczyk, T. Optimization and analysis of surface roughness, flank wear and 5 different sensorial data via Tool Condition Monitoring System in turning of AISI 5140. Sensors 2020, 20, 4377. [Google Scholar] [CrossRef]
  37. Raut, L.B.; Shaikh, M.A. Prediction of vibrations, cutting force of single point cutting tool by using artificial neutal network in turning. Int. J. Mech. Eng. Technol. 2014, 5, 125–133. [Google Scholar]
  38. Krolczyk, G.M.; Wojciechowski, S.; Chudy, R.; Zak, K.; Maruda, R.W. Surface quality and topographic inspection of variable compliance part after precise turning. Appl. Surf. Sci. 2018, 434, 91–101. [Google Scholar]
  39. Wayal, V.; Ambhore, N.; Chinchanikar, S.; Bokhse, V. Investigation on cutting force and vibration signals in turning: Mathematical modelling using response surface methodology. J. Mech. Eng. Autom. 2015, 5, 64–68. [Google Scholar]
  40. Cveticanin, L.; Dregelyi, A.; Horvath, R.; Zukovic, M. Dynamics of mass variable rotor and its application in modeling tuning operation. Acta Mech. 2021, 232, 1605–1620. [Google Scholar]
  41. Cveticanin, L. A new approach for solving of a complex-valued differential equation. J. Sound Vib. 2004, 278, 1181–1195. [Google Scholar]
  42. Cveticanin, L. Approximate solution of a strongly non-linear complex differential equation. J. Sound Vib. 2005, 284, 503–512. [Google Scholar] [CrossRef]
  43. Cveticanin, L. Strong Nonlinear Oscillators—Analytical Solutions, Mathematical Engineering, 2nd ed.; Springer: Berlin/Heidelberg, Germany, 2018. [Google Scholar]
  44. Gadelmawla, E.S.; Kour, M.M.; Maksoud, T.M.; Elewa, I.M.; Soliman, H.H. Roughness parameters. J. Mater. Process. Technol. 2002, 123, 133–145. [Google Scholar] [CrossRef]
  45. Patil, R.B.; Mellal, M.A.; Bewoor, A.K.; Al-Dahidi, S. Reliability, maintainability, and availability analysis of a computerized numerical control machine tool using Markov Chains. Acta Polytech. Hung. 2021, 18, 45–70. [Google Scholar]
Figure 1. (a) Model of the cutting system; (b) scheme of the one-mass oscillatory cutting system.
Mathematics 10 03214 g001
Figure 2. (a) x-t and (b) y-t diagrams determined analytically (full line) and numerically (dotted line).
Mathematics 10 03214 g002
Figure 3. Experimental rig.
Mathematics 10 03214 g003
Figure 4. Feed-cutting speed parameter combinations for force measuring.
Mathematics 10 03214 g004
Figure 5. The calculated values as a function of measured values.
Mathematics 10 03214 g005
Figure 6. The investigation of the residuals on probability plots.
Mathematics 10 03214 g006
Figure 7. Roughness diagrams for various values of feed: (a) f = 0.18 mm, (b) f = 0.2 mm, (c) f = 0.3 mm (v = 200 m/min).
Mathematics 10 03214 g007aMathematics 10 03214 g007b
Figure 8. Roughness diagrams for various values of circular velocity of the working piece: (a) 200 m/min, (b) 240 m/min, (c) 280 m/min, (d) 400 m/min (f = 0.22 mm).
Mathematics 10 03214 g008aMathematics 10 03214 g008b
Table 1. Measured and calculated forces.
Experimental Runsf, mmv, m/minFr, N meas.Fr, N calc.ΔFr, %Fc, N meas.Fc, N calc.ΔFc, %F, N
10.12008585.120.14410410.70.16418.72
20.142009998.47−0.54531525.9−0.97540.15
30.18200113112.15−0.76649640.9−1.27658.76
40.22200126126.160.13763755.7−0.97773.33
50.26200140140.510.36879870.2−1.01890.08
60.3200154155.190.77991984.5−0.661002.9
70.12408486.112.45405405.0−0.01413.62
80.142409898.850.86523519.2−0.72532.10
90.18240113111.92−0.96637633.3−0.58646.95
100.22240127125.33−1.33755747.1−1.05765.61
110.26240139139.070.05872860.7−1.31883.01
120.3240155153.14−1.21989974.1−1.531001.1
130.12808887.34−0.76402400.3−0.42411.52
140.1428010099.47−0.53517513.6−0.65526.58
150.18280113111.94−0.95629626.7−0.36639.07
160.22280126124.74−1.01746739.6−0.86757.55
170.26280136137.871.36859852.3−0.79869.70
180.3280151151.340.22984964.7−2.00995.52
190.13208988.81−0.21398396.7−0.33407.83
200.1432099100.341.33511509.1−0.38520.50
210.18320111112.201.07623621.2−0.29632.81
220.22320124124.390.31738733.2−0.66748.34
230.26320137136.91−0.06858844.9−1.55868.87
240.3320147149.771.85967956.3−1.11978.11
250.13609290.53−1.63396394.1−0.49406.66
260.14360101101.450.44507505.5−0.29516.96
270.18360112112.700.62619616.7−0.37629.05
280.22360125124.28−0.58735727.7−1.00745.55
290.26360139136.20−2.06852838.5−1.61863.26
300.3360150148.45−1.04959949.0−1.05970.66
310.14009492.49−1.63399392.5−1.66409.92
320.14400102102.800.78503503.00.00513.24
330.18400112113.441.27614613.3−0.12624.12
340.22400124124.420.34733723.3−1.34743.41
350.26400135135.730.54846833.1−1.54856.70
360.3400148147.38−0.42952942.7−0.98963.44
370.123009693.92−2.22463454.8−1.80472.85
380.2380118118.640.54677670.2−1.02687.21
390.28300144143.90−0.07921904.5−1.83932.19
400.2220124118.82−4.36713694.1−2.72723.70
Table 2. Amplitude R and frequency ω of vibration for various values of feed rate f and velocity v.
f = 0.18 mm
v = 200 m/minv = 280 m/minv = 400 m/min
R (mm)1.42621.41321.3966
ω   ( s 1 ) 95.9596.92698.349
f = 0.22 mm
v = 200 m/minv=280 m/minv = 400 m/min
R (mm)1.55461.53861.5242
ω   ( s 1 ) 93.66394.7296.135
f = 0.30 mm
v = 200 m/minv = 280 m/minv = 400 m/min
R (mm)1.77031.76381.7352
ω   ( s 1 ) 89.21590.12191.950
Table 3. Measured roughness values for various values of feed rate and velocity.
f = 0.18 mm
v = 200 m/minv = 280 m/minv = 400 m/min
Average surface roughness, Ra, µm1.671.371.45
Ten-points height, Rz, µm7.196.316.79
f = 0.22 mm
v = 200 m/minv = 280 m/minv = 400 m/min
Average surface roughness, Ra, µm2.272.021.91
Ten-points height, Rz, µm8.858.678.89
f = 0.30 mm
v = 200 m/minv = 280 m/minv = 400 m/min
Average surface roughness, Ra, µm3.813.553.47
Ten-points height, Rz, µm16.0615.3415.31
Table 4. Correlation parameters for surface roughness on amplitude of vibration.
f = 0.18 mm
v = 200 m/minv = 280 m/minv = 400 m/minAveraged prediction coef.
(Ra/R) 10−31.17610.971631.03571.0611
(Rz/R) 10−3 5.06344.475204.85004.7962
f = 0.22 mm
v = 200 m/minv = 280 m/minv = 400 m/minAveraged prediction coef.
(Ra/R) 10−31.46451.32031.25661.3471
(Rz/R) 10−35.70975.66675.84875.7417
f = 0.30 mm
v = 200 m/minv = 280 m/minv = 400 m/minAveraged prediction coef.
(Ra/R) 10−32.15252.0172.00582.0584
(Rz/R) 10−39.07348.71598.84978.8797
Publisher’s Note: MDPI stays neutral with regard to jurisdictional claims in published maps and institutional affiliations.

