Article

SEIARN: Intelligent Early Warning Model of Epidemic Spread Based on LSTM Trajectory Prediction

1
College of Science, North China University of Science and Technology, Tangshan 063210, China
2
Hebei Engineering Research Center for the Intelligentization of Iron Ore Optimization and Ironmaking Raw Materials Preparation Processes, North China University of Science and Technology, Tangshan 063210, China
3
Hebei Key Laboratory of Data Science and Application, North China University of Science and Technology, Tangshan 063210, China
4
The Key Laboratory of Engineering Computing in Tangshan City, North China University of Science and Technology, Tangshan 063210, China
5
Tangshan Intelligent Industry and Image Processing Technology Innovation Center, North China University of Science and Technology, Tangshan 063210, China
6
College of Artificial Intelligence, North China University of Science and Technology, Tangshan 063210, China
7
College of Economics, North China University of Science and Technology, Tangshan 063210, China
*
Author to whom correspondence should be addressed.
Mathematics 2022, 10(17), 3046; https://doi.org/10.3390/math10173046
Submission received: 23 June 2022 / Revised: 15 August 2022 / Accepted: 16 August 2022 / Published: 24 August 2022
(This article belongs to the Special Issue Engineering Calculation and Data Modeling)

Abstract

:
A SEIARN compartment model with the asymptomatic infection and secondary infection is proposed to predict the trend of COVID-19 more accurately. The model is extended according to the propagation characteristics of the novel coronavirus, the concepts of the asymptomatic infected compartment and secondary infection are introduced, and the contact rate parameters of the improved model are updated in real time by using the LSTM trajectory, in order to make accurate predictions. This SEIARN model first builds on the traditional SEIR compartment model, taking into account the asymptomatic infection compartment and secondary infection. Secondly, it considers the disorder of the trajectory and uses the improved LSTM model to predict the future trajectory of the current patients and cross-track with the susceptible patients to obtain the contact rate. Then, we conduct real-time updating of exposure rates in the SEIARN model and simulation of epidemic trends in Tianjin, Xi’an, and Shijiazhuang. Finally, the comparison experiments show that the SEIARN model performs better in prediction accuracy, MSE, and RMSE.

1. Introduction

The epidemic of COVID-19 began in Wuhan. Due to its high infectivity, long incubation period, complex transmission sources, and difficult diagnosis, the work centered on epidemic screening and precise prevention and control is still very important [1]. The outbreak of COVID-19 has caused economic losses, traffic bans, talent losses, and shortages of various resources. Since the outbreak of COVID-19 on the eve of the Spring Festival, the large-scale population flow and crowd gathering during the Spring Festival transportation aggravated the epidemic. How to scientifically grasp the epidemic situation is absolutely critical to the prevention and control of the epidemic [2,3]. Since the end of 2019, COVID-19 has spread rapidly around the world [4]. Affected by climate change and frequent human gathering activities, the epidemic trend remains unstable and intermittently shows a worsening trend [5]. In China, 143,838 confirmed cases, 5706 deaths, 9148 confirmed cases, and 801 asymptomatic infections have been reported so far according to the Health Commission (as on 15 February 2022). In addition to causing great distress to people’s health and life, the epidemic situation has also seriously affected the country’s economic development. In the first quarter of 2020, China’s economy shrank 6.8 percent year on year, a 13.2 percent drop from the same period in 2019. Therefore, how to build a prediction model with high accuracy, carry out risk early warning, and take epidemic prevention measures in time is the key problem of epidemic prevention [6].
Since the outbreak of the epidemic, scholars at home and abroad have carried out relevant research on the transmission models of novel coronavirus. Most of these models are based on classical infectious disease models, such as the mathematical model of infectious disease dynamics SIR model [7,8,9], SEIR model [2,3,4,5,6,10,11,12], and SEIAR model. [13,14,15,16,17,18,19,20], which divide the population into susceptible s, latent e, infectious I, confirmed J, and rehabilitated R groups. Ordinary differential equations are established through the transmission mechanism of one group transferring to another group, so as to reveal the law of epidemic spread [8,9,10,11]. In recent years, relevant scholars have done a lot of research on the dynamics model of infectious diseases and achieved fruitful results. However, there are still some deficiencies in the study of an epidemic trend prediction model. On the one hand, these studies did not take into account both asymptomatic and secondary infection effects. Medical studies have shown that the spread of COVID-19 involves both asymptomatic infection and secondary infection, and these two groups are more likely to form a broad and sustained trend of transmission. Therefore, it is necessary to consider the asymptomatic infection and the effect of secondary infection in the transmission model of COVID-19. On the other hand, the above models only consider the stationarity of the sequence [10]. According to the growth inertia forecast future trend, the parameter setting does not have a real-time nature. Still, the outbreak factor, as well as the human factor, in the epidemic situation dissemination can’t be neglected. There are many outbreaks, heavy human factors, and a large number of people who return to school or rework. At present, only a limited number of influencing factors are considered in the epidemic dynamics model, which can easily lead to low prediction accuracy. The intelligent algorithm for multi-source fusion data processing and analysis can reduce the incompleteness caused by artificial design features and more accurately predict the development trend [21,22,23]. In particular, the novel coronavirus is spread by contact, and human-to-human contact often makes the trend of the epidemic unstable. It is very important to study how to update the model parameters in real time according to the cross trajectory.
Based on the above problems, in order to reasonably and accurately predict the development trend of the epidemic situation, combined with the transmission characteristics of the novel coronavirus, considering the influence of domestic prevention and control measures, this paper introduced the concept of secondary infection into the traditional SEIR warehouse model, a modified SEIARN compartment model with which the asymptomatic infection and secondary infection was constructed. In order to improve the accuracy of the prediction, the improved LSTM model is used to predict the future trajectories of the patients, the contact rate is obtained by crossing the trajectories with the susceptible patients, and the contact rate is updated in real time and taken as the SEIARN model parameter in order to forecast the trend of an epidemic situation in the next phase. It provides a new method for the accurate prediction of epidemic situations. The main contributions of this paper are:
(1) A new COVID-19 prediction model, SEIARN, is proposed; by introducing the asymptomatic compartment, the infected compartment in the traditional SEIR model is divided into asymptomatic infected compartment and symptomatic infected compartment, so as to improve the prediction accuracy of the model.
(2) Based on the disorder of patient trajectories, an improved LSTM model is proposed to predict the future trajectories of existing patients and track cross acquisition contact rates with susceptible people. The exposure rate is substituted into the propagation dynamics equation of the SEIARN model, and the parameters are updated in real time to fully consider the impact of sudden factors and human factors on the SEIARN model.
The main structure of this paper is as follows. The first part introduces the basic principles of LSTM and SEIR models based on the warehouse concept. The second part focuses on describing the structure of the SEIARN model, and introduces the integration of LSTM and SEIR models, as well as the parameter adjustment of the LSTM model and the improvement of the SEIR model. The third part is the experiment part, including the model accuracy experiment, parameter analysis, model adaptability analysis, and model comparison analysis experiment. The last part is the summary of this article.

2. Related Works

2.1. Epidemic Model

2.1.1. Classical SEIR Model

The compartment model is a commonly used dynamical modeling method for infectious diseases, which was first proposed by Kennack and McKendrick [16]. The compartment model can divide the population into compartments according to the law and characteristics of infectious diseases, and each compartment represents different groups in the process of infectious diseases. The traditional SEIR compartment model [17] divides the crowd into four chambers:
  • Susceptible compartment: a healthy person who is not infected but may contract the virus through contact with infected or latent persons.
  • Exposed compartment: a person who is infected with the virus before the onset of symptoms and who is active in a healthy population.
  • Infectious compartment: a group of virus carriers who show clinically recognized symptoms and characteristics during the 14-day incubation period. These people have a strong ability to transmit the virus to susceptible persons in contact with them.
  • Recovered compartment: includes infected, cured, and dead.
The SEIR compartment model is built on the following assumptions:
  • The total number of people in the four compartments remained unchanged, that is N = S + E + I + R .
  • An infected person becomes infected with the virus and then becomes a latent person. At this stage, the latent person can also transmit the virus.
  • Contact between an infected person and a susceptible person is contagious.
  • Once cured, the infected person becomes permanently immunized and becomes the remover.
The flow diagram of a conventional SEIR model chamber is shown in Figure 1.
The model differential equation is:
{ d S d t = λ β S I N d E d t = λ β S I N α E d I d t = α E γ I d R d t = γ I
where β is the risk of contracting it every time you come into contact with an infected person. λ is the contact rate between the sleeper and the infected, β × λ is the effective contact rate, S / N is the susceptible crowd in the total compartment proportion, therefore, the unit time with the susceptible crowd contact becomes the latent person number for ( λ β S I ) / N . α is the probability of the latent person transforming into the infected person, generally for the latent period reciprocal. γ is the probability of recovery for the infected.

2.1.2. Prediction Model of COVID-19

In recent years, scholars at home and abroad have conducted extensive research on the establishment of the prediction model of COVID-19. For example, Wang et al. [2] used the Bayesian optimization method to find the optimal parameters of the traditional SEIR model, which improved the effect of the model and increased the robustness of the model. Yarsky [3] proposed using a genetic algorithm to adjust SEIR model parameters, and the simulation results are in good agreement with the actual data. Luo et al. [4] improved the key parameters of the SEIR model based on the particle swarm optimization algorithm and proposed an adaptive PSO-SEIR model to be applied to the evaluation of COVID-19 epidemic prevention and control strategies in different countries and periods. Jin et al. [5] used cluster analysis combined with the SEIR model to show the development trend of the domestic epidemic situation under different epidemic prevention measures taken by the country. Zhang et al. [6] used the improved SIR model equation and Runge Kutta method to simulate the relationship between the proportion of four groups of people and time and predicted the transmission law of COVID-19. Ding et al. [7] and Rajesh et al. [8] reasonably estimated the parameters of the model based on the SIR model of infectious diseases, combined with the development characteristics of COVID-19 and combined it with the actual data. Chen et al. [9] proposed a time-dependent SIR model, which tracks the transmission and recovery rate of time t. Gu et al. [10] proposed the establishment of a SEIR transmission dynamics model considering the virus transmission capacity of patients in the incubation period and tracking the impact of isolation interventions on the epidemic. Radulescu and Manuel et al. [11,12], respectively, adapted the traditional SEIR epidemic model to the specific dynamic compartment and epidemic parameters of COVID-19 and studied some basic characteristics of the SEIR epidemic model affected by vaccination and treatment control. Wang et al. [13] introduced the concept of asymptomatic infected persons and proposed to build a SEIADR model, which has better fitting effect and authenticity. Wang et al. [14] built an optimization model based on the parameters of the SEIRD model, estimated the parameters using particle swarm optimization algorithm, and analyzed and predicted the inflection point of the epidemic of COVID-19 in Hubei Province. Fan et al. [15] built a phased SIR-f model, combined with the methods of growth situation identification, stage division, and impact analysis of prevention and control measures, and used simulation to accurately describe the change law of epidemic data over time and the impact of prevention and control measures. Mei et al. [16] combined the limit learning machine with the dynamic model and proposed a new limit IR prediction model, which can accurately predict the epidemic trend in real time. Yang et al. [17] proposed a new COVID-19 propagation nonlinear dynamic model. Considering the actual prevention and control measures, the model divides the total population into seven groups: susceptible, latent, isolated observation, asymptomatic infection, symptomatic infection, hospitalized isolation treatment, and rehabilitation; the basic regeneration number is obtained and analyzed; the discharge rate and mortality of the model are fitted to the time-varying function; and the remaining parameters and some initial state values of the model are fitted by using the number of confirmed cases. Ketu et al. [18] introduced a CNN-LSTM hybrid deep learning prediction model, which can correctly predict the COVID-19 epidemic in India. Many scholars have combined the SEIR model with other models. Zhao et al. [19] proposed an improved epidemic dynamics CSEIR model based on the SEIR model, which adds the transmission process of latent follow-up admission and incidence follow-up admission to the traditional SEIR model to describe the epidemic development trend. Liang [20] proposed to build a SEIR model and LSTM model based on population mobility to predict the occurrence and development of early COVID-19 in China, and further use TFT architecture to optimize the prediction model, so as to improve the accuracy and applicability of the model.

2.2. Classical LSTM Model

The commonly used time series forecasting models are the LSTM neural network and the ARIMA time series. The ARIMA principle is the moving average and the autoregressive [24], and its forecasting results are close to the historical average, so it is suitable for the series with less fluctuation. The LSTM neural network stores the past data to the “Memory nerve” [25], and its prediction result is far from the historical average. Considering the disorder and uncontrollability of patient trajectories, the model of the LSTM neural network was chosen as the prediction model.
The LSTM is a kind of special RNN, in which there is only one state in a single RNN loop structure, and there are four states in a single loop structure (also called a cell). In contrast to RNN, the LSTM loop structure maintains a persistent unit state that is passed on to determine which information is to be forgotten or passed on. The model structure is shown in Figure 2.
The LSTM takes the long memory line S as the mainline and adds three gates: forgetting gate, input gate, and output gate to protect the state of the control unit. Adding three gates is a selective way of getting information through, consisting of a Sigmoid neural network and a matrix multiplication, which is equivalent to adding three neural network layers. The three gate principles are as follows.
  • Forget gate:
The forget gate accepts a long-term memory S t 1 (the output from the previous unit module) and decides to retain and forget the part of S t 1 . Its main principle: put the long-term memory input S t 1 in t 1 times the forgetting factor f t . The forgetting factor is calculated from short-term memory h t 1 and event information x t :
f t = σ ( W f [ h t 1 , x t ] + b f )
  • Input gate:
The input gate determines what new information is stored in the cellular state. The input gate consists of two parts: The Sigmoid layer and the tanh layer. The Sigmoid layer identifies the variables that need updating; the tanh layer creates a new candidate value vector to generate the candidate memory. The principle is to take the long-term memory i t from the forgetting gate and the short-term memory g t from the learning gate and merge the two directly. The calculation is:
{ i t = σ ( W t [ h t 1 , x t ] + b i ) C ˜ t = tanh ( W c [ h t 1 , x t ] + b c )
  • Output gate:
The output gate uses the Sigmoid function to determine the output part of the cell state, and then the cell state is processed through the tanh layer. The idea is to get o t by a Sigmoid function, and o t is multiplied by tanh to get the final output. The calculation is:
{ o t = σ ( W o [ h t 1 , x t ] + b o ) h t = o t tanh ( C t )

3. Intelligent Early Warning Model of Epidemic Spreading Based on SEIARN

Based on the traditional SEIR compartment model, the model is extended according to the propagation characteristics of the novel coronavirus, the concepts of the asymptomatic infected compartment and secondary infection are introduced, and the contact rate parameters of the improved model are updated in real time by using the LSTM trajectory, in order to make accurate predictions.

3.1. Model Principle Based on Compartment Optimization

Asymptomatic infection in the transmission of new pneumonia is a key factor in the establishment of the warehouse because of its unrecognizable characteristics and its tendency to spread more widely and more permanently. The traditional SEIR compartment model can be divided into two parts: the asymptomatic infected compartment and the symptomatic infected compartment, which can improve the prediction accuracy of the model.
On the basis of the traditional SEIR compartment model, combined with the current epidemic spreading trend and domestic epidemic prevention measures, an improved dynamic model of SEIARN infectious disease was put forward. The population is divided into five compartments: the susceptible (S), the exposed (E), the asymptomatic (A), the infectious (I), and the recovered (R):
  • Susceptible compartment S: healthy people who are not infected with the virus but have been exposed to the asymptomatic or symptomatic infected people will move to the exposed compartment at different rates.
  • Exposed compartment E: a person who is infected with the virus before the onset of symptoms, including people in contact with the asymptomatic infected people and people in contact with the symptomatic infected people.
  • Infectious compartment I: a person who is a carrier of the virus and has clinically recognized symptoms and characteristics during the 14-day incubation period can transmit the virus to susceptible persons in contact with them. The symptomatic infections have a weak transmission ability due to easy isolation and short contact time with susceptible persons.
  • Asymptomatic compartment A: a carrier who has no clinically recognized symptoms or characteristics during the 14-day incubation period can transmit the virus to susceptible persons who come into contact with it. The asymptomatic infections have a strong transmission ability due to not easy to be isolated and long contact time with susceptible persons.
  • Recovered compartment R: including infected people, cured, and dead. The cured people have a certain probability of becoming susceptible and at risk of being secondary infections.
The flow diagram of the SEIARN compartment model is shown in Figure 3.
The flow chart shows that the susceptible person becomes infected with the virus and becomes a latent person. At this stage, the exposed person also transmits the virus. After a period of time, the exposed person is divided into two groups. Most people become symptomatic and become infected, and a minority of the population becomes asymptomatic. According to relevant information, the degree of transmission is similar to the degree of infection. Still, the asymptomatic infection is not easy to detect, so neither is the number of infections, and finally through treatment can become a removal, but after becoming a removal, they could be susceptible again.

3.2. Dynamic Equation of Propagation Based on Contact Rate Optimization

Determining the parameters in the differential equation of the SEIARN compartment model is also the key process of modeling. Especially the contact rate parameter. This is because COVID-19 is spread by contact, and human-to-human contact tends to destabilize the epidemic trend. The real-time updating of the contact rate parameters by crossing trajectories can fully consider the sudden factors of epidemic spread and the influence of human factors on the SEIARN model, which is of great significance for early epidemic warning. The algorithm flow chart is shown in Figure 4.

3.2.1. Equation of Propagation Dynamics

The dynamic propagation equation of the SEIARN is:
d S d t = θ R λ 1 β 1 S I N λ 2 β 2 S A N d E d t = n 1 λ 1 S I N + n 2 λ 2 S A N α ( 1 m ) E α m E d A d t = α ( 1 m ) E γ 1 A d I d t = α m E γ 2 I d R d t = γ 1 A + γ 2 I θ R
where β 1 is the probability that an infected person will contract the disease every time they come into contact with a symptomatic infection, λ 1 is the contact rate of symptomatic infections and susceptible infections (see Section 3.2.2 for detailed calculation), the product of λ 1 and β 1 is called the effective exposure rate for the susceptible and symptomatic infections. S / N is the proportion of susceptible people in the total population, so the number of people who becomes the exposed person through contact with symptomatic infections per unit time is ( λ 1 β 1 S I ) / N .
β 2 is the probability that an infected person will contract the disease every time they come into contact with an asymptomatic infection. λ 2 is the contact rate of asymptomatic infections and susceptible infections (see Section 3.2.2 for specific calculation), the product of λ 2 and β 2 is called the effective exposure rate for the susceptible and asymptomatic infections. The number of people who becomes an exposed person through contact with the asymptomatic infections per unit time is ( λ 2 β 2 S A ) / N .
α is the probability of an exposed person turning into an infected person, usually the inverse of the incubation period. m is the proportion of susceptible infections in infected persons, an exposed person has the probability of a α × ( 1 m ) to become an asymptomatic infection and has the probability of a α × ( 1 m ) to become a symptomatic infection.
γ 1 is the recovery probability of asymptomatic infection, γ 2 is the recovery probability of symptomatic infection.
θ is the probability of secondary infection among recovered infected persons, so the recovered compartment will flow to the susceptible compartment with the probability of θ .

3.2.2. Parameter Optimization Method Based on Improved LSTM

Suppose the above parameters are set as static parameters based on historical data. Regardless of the impact of emergencies on the epidemic trend, the accuracy of the prediction also decreases. To achieve the purpose of accurate forecast, the epidemic trend is updated in real-time, and the improved LSTM model is used to aggregate single object trajectory data and cross trajectory to obtain the contact rate parameters of the SEIARN model.
  • Improved LSTM model
In the LSTM prediction trajectory, due to the serious disorder of motion trajectory data of patients and pedestrians, it is impossible to accurately predict the trajectory. By adjusting the dropout parameter, the abnormal data is inactivated, and the condition of the information is eliminated. During training, dropout will make each value in the output change to 1/keep_prob times the original probability keep_prob and 0 with a probability of 1-keep_prob. Randomly inactivate some neurons in each round of training, giving each neuron a chance to learn more efficiently. It will make the network more robust and reduce overfitting.
For the dropout inactivation rate parameter, define the direction vector from the trajectory starting point to the current dwell point r . The ordered vector r t composed of continuous adjacent points x t and x t + 1 in its time series will have an included angle with r . If the tip is less than 90 degrees, it proves that its trajectory is moving towards the destination, and there is a specific directionality; if the tip is greater than 90 degrees, it demonstrates that the patient is affected by random events and cannot correctly reflect its general trajectory law. This dwell point data is abnormal, and it should be inactivated; the formula for the inactivation rate is:
d r o p o u t = i = 0 T 1 q i T , q i = { 0 ,   r i r > 0 1 ,   r i r < 0
where d r o p o u t is the inactivation rate. T is the number of sample points. r i is the direction vector composed of the ith coordinate data and the i + 1 coordinate data. r is the direction vector composed of the first sample point and the last sample point. q i is a 0–1 variable, which is used to count the number of abnormal data. Its value is 0, representing that the i + 1 coordinate point of pedestrian advance conforms to the trend of target direction and is not included in the count; if the value is 1, the i + 1 coordinate point represents the pedestrian’s advance is inconsistent with the trend of the target direction. This point is regarded as an abnormal data point and included in the count.
Therefore, by considering the disorder of pedestrian movement trajectory [18,19], adjusting the dropout parameters can inactivate some abnormal data, so that every neuron has the opportunity to learn more efficiently, which will make the network more robust and reduce overfitting.
Since the patient trajectory is represented by longitude and latitude, the dwell point of each patient forms a time series, and its LSTM input latitude is determined to be 2. The number of neural network layers is defined as three layers, including forgetting gate, input gate, and output gate. Sigmoid function is selected as the activation function of the LSTM prediction model [20,26]. To better meet the disorder and uncontrollability of patient and pedestrian trajectories, its parameters are adjusted, and final results are obtained through final training. The LSTM trajectory prediction process is shown in Figure 5.
  • Calculation of contact rate
Determine pedestrian and patient contact by determining whether two consecutive longitude and latitude lines at the same time point intersect. Determine if the longitude and latitude of pedestrian i ( l a n i p , l o n i p ) and the longitude and latitude of patient j ( l a n j p , l o n j p ) intersect. As well as the number of intersections at point P.
o v l w h e t h e r = j = 1 n | l o n i p l a n j p l a n i p l o n j p |
where o v l w h e t h e r is an indicator of whether the trajectories of a pedestrian and n patients intersect. If the index is greater than 0, it is proved that there is a crossing. The greater the value is, the more the included angle of the straight line tends to 90 degrees, and it can only cross once, indicating that the more inconsistent the trajectories are. If the index is equal to zero, it proves that there is no crossover. Secondly, we can generate zero one variable from | l o n i p l a n j p l a n i p l o n j p | .
o v l n u m i = p = 1 k j = 1 n q j , q j = { | l o n i p l a n j p l a n i p l o n j p | > 0 | l o n i p l a n j p l a n i p l o n j p | = 0
where o v l n u m i is the number of times that the ith pedestrian crosses the tracks of n patients in K periods, where k represents the number of line segments, and K + 1 is the number of time points; N means the number of patients.
Through the above two formulas, we can judge whether the trajectories intersect, the degree of intersection, and the number of trajectory crossings, so the trajectory contact of all pedestrians in this area is:
z o v l n u m = d = 1 z i = 1 k j = 1 n q d j
where q d j is the track intersection between the d-th pedestrian and the j-th patient.
To assess overall trends in outbreak trends, define the overall exposure rate.
C o n t a c t   r a t e s = 1 z z o v l n u m b e r
where C o n t a c t   r a t e s stands for contact with patients in s area, it means the number of connections between all pedestrians and patients, and the proportion of all pedestrians is the overall contact rate.
This contact rate is based on the improved LSTM model, which is of guiding significance for improving the parameters of the SEIARN model in real-time and improving the prediction accuracy of the model.

4. Experiments and Analysis

4.1. Data Sources

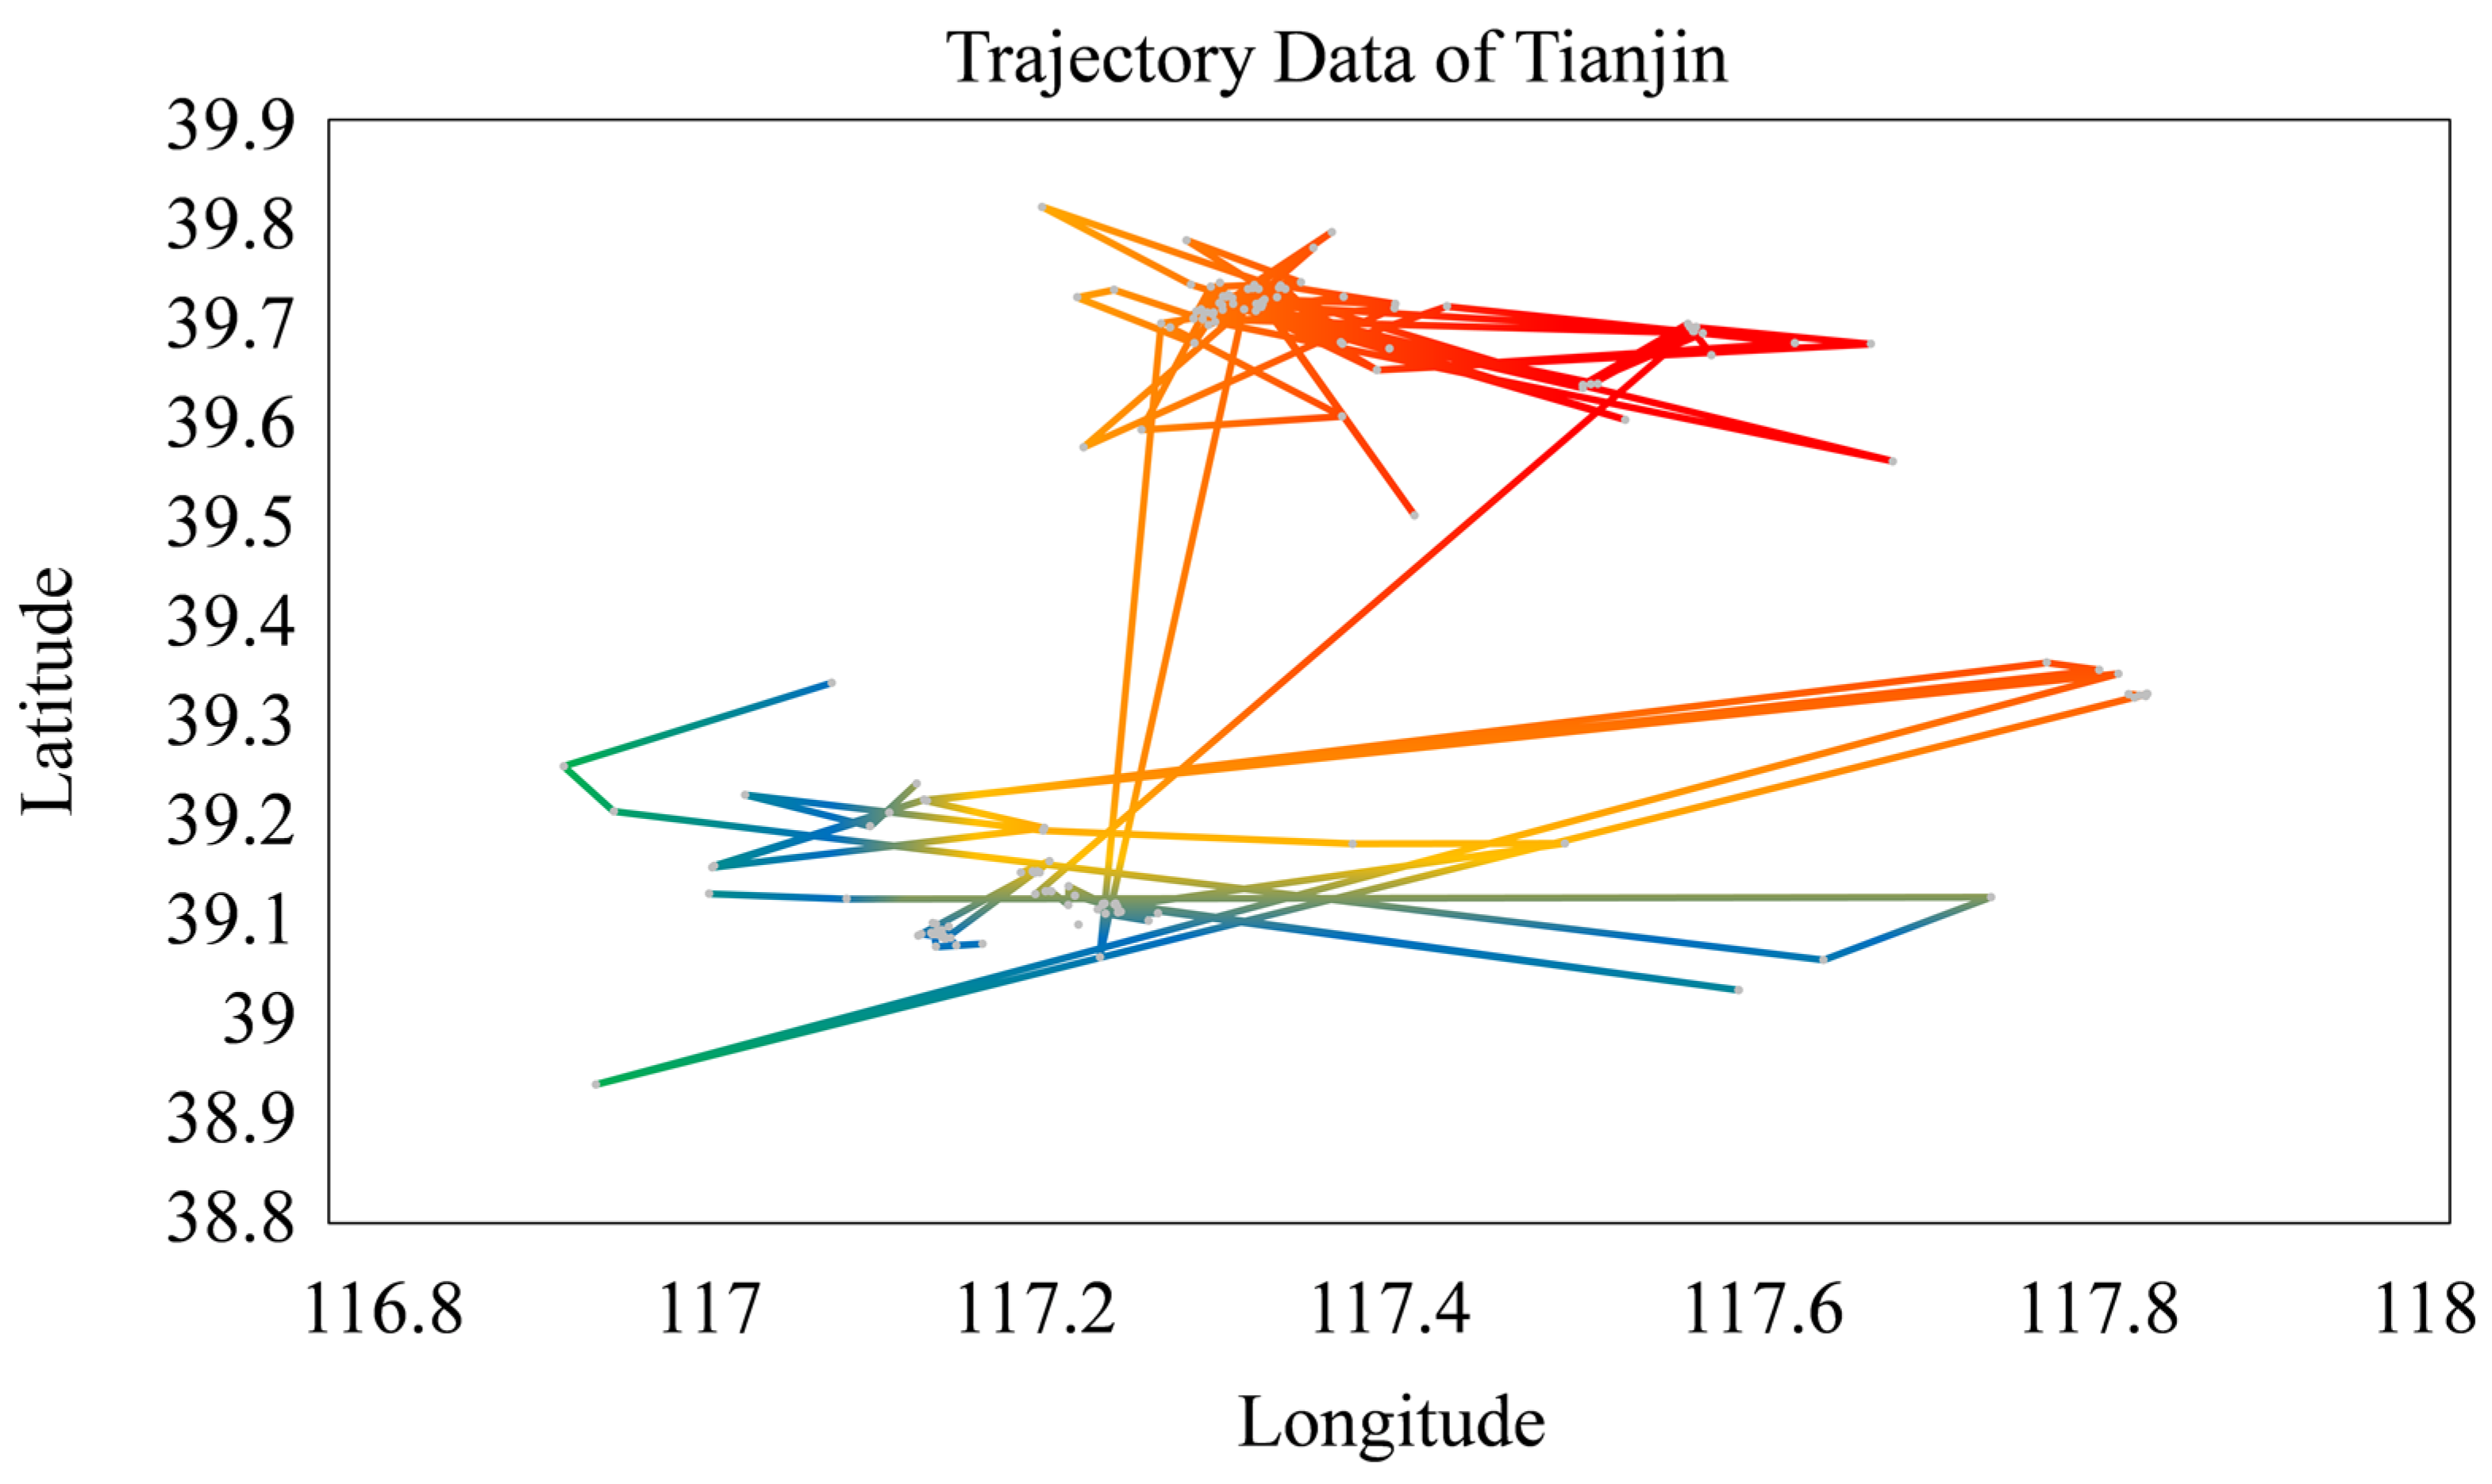
4.1.1. Trace Data Sources

The trajectory data starts from the patient’s movement trajectory, and the patient’s residence point is used as the most contagious range. Shijiazhuang City, Tianjin City, and Xi’an City in Shaanxi Province, where the secondary epidemic is more serious, were selected as the research sites. Through the network crawler technology to obtain data from the local daily newspaper and the official website of the Health Commission, the patient trajectory text from 1 to 24 January 2021 was collected. The coordinates of the stop point were obtained according to the geographical location using natural language processing, and the coordinate distribution map of the stop point was drawn in Figure 6, Figure 7 and Figure 8.
As shown in the figure above, the southeast part of Lianhu District of Xi’an City, the junction of Nankai District of Tianjin City and the junction of Hebei District of Tianjin City, and the western part of Xinhua District of Shijiazhuang have more patient trajectories. Since most patients belong to the nearest infection, the most representative single patient movement trajectory in each region is taken as the research object, as shown in Table 1.
It can be seen from the table that during 1 January 2021–21 January 2021, the following places had the track of patients diagnosed with COVID-19, such as Nankai District and Hebei District of Tianjin, Lianhu District and Yanta District of Xi’an, Xinhuahe Development Zone, xinhuahe Development Zone, Shijiazhuang. Because the movement track of pedestrians is personal privacy, it cannot be collected. Based on the above considerations, the trajectory is randomly generated according to the actual situation.

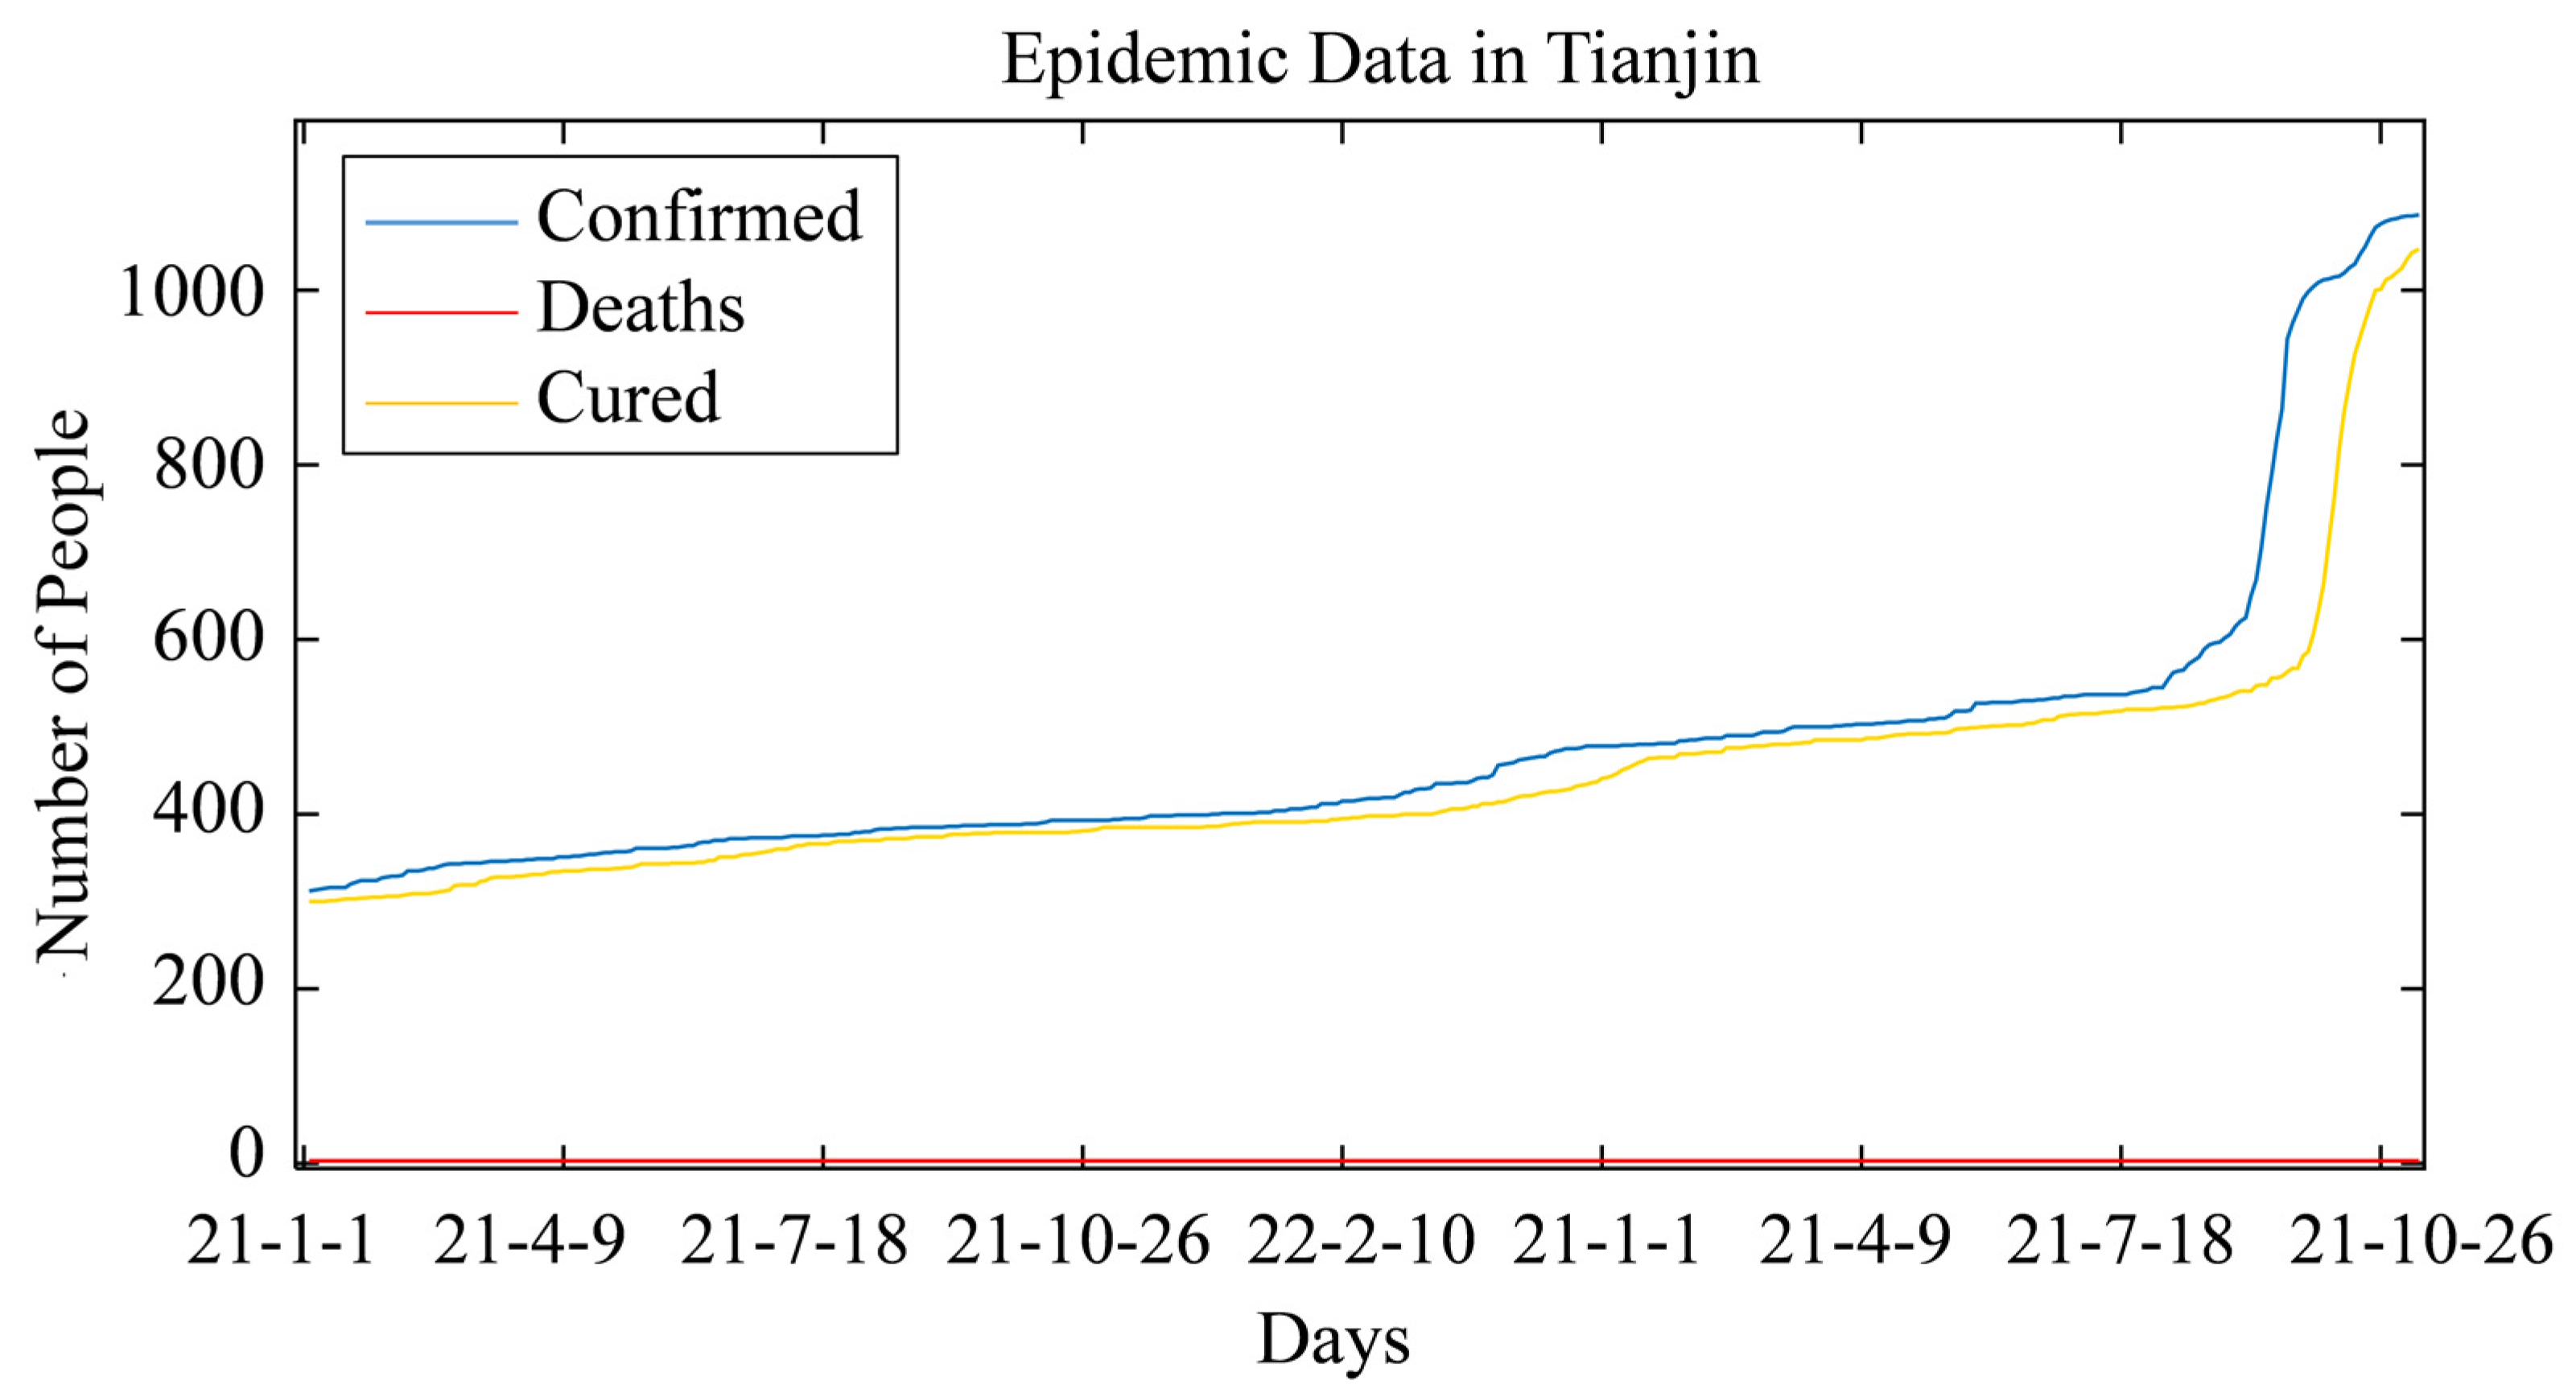
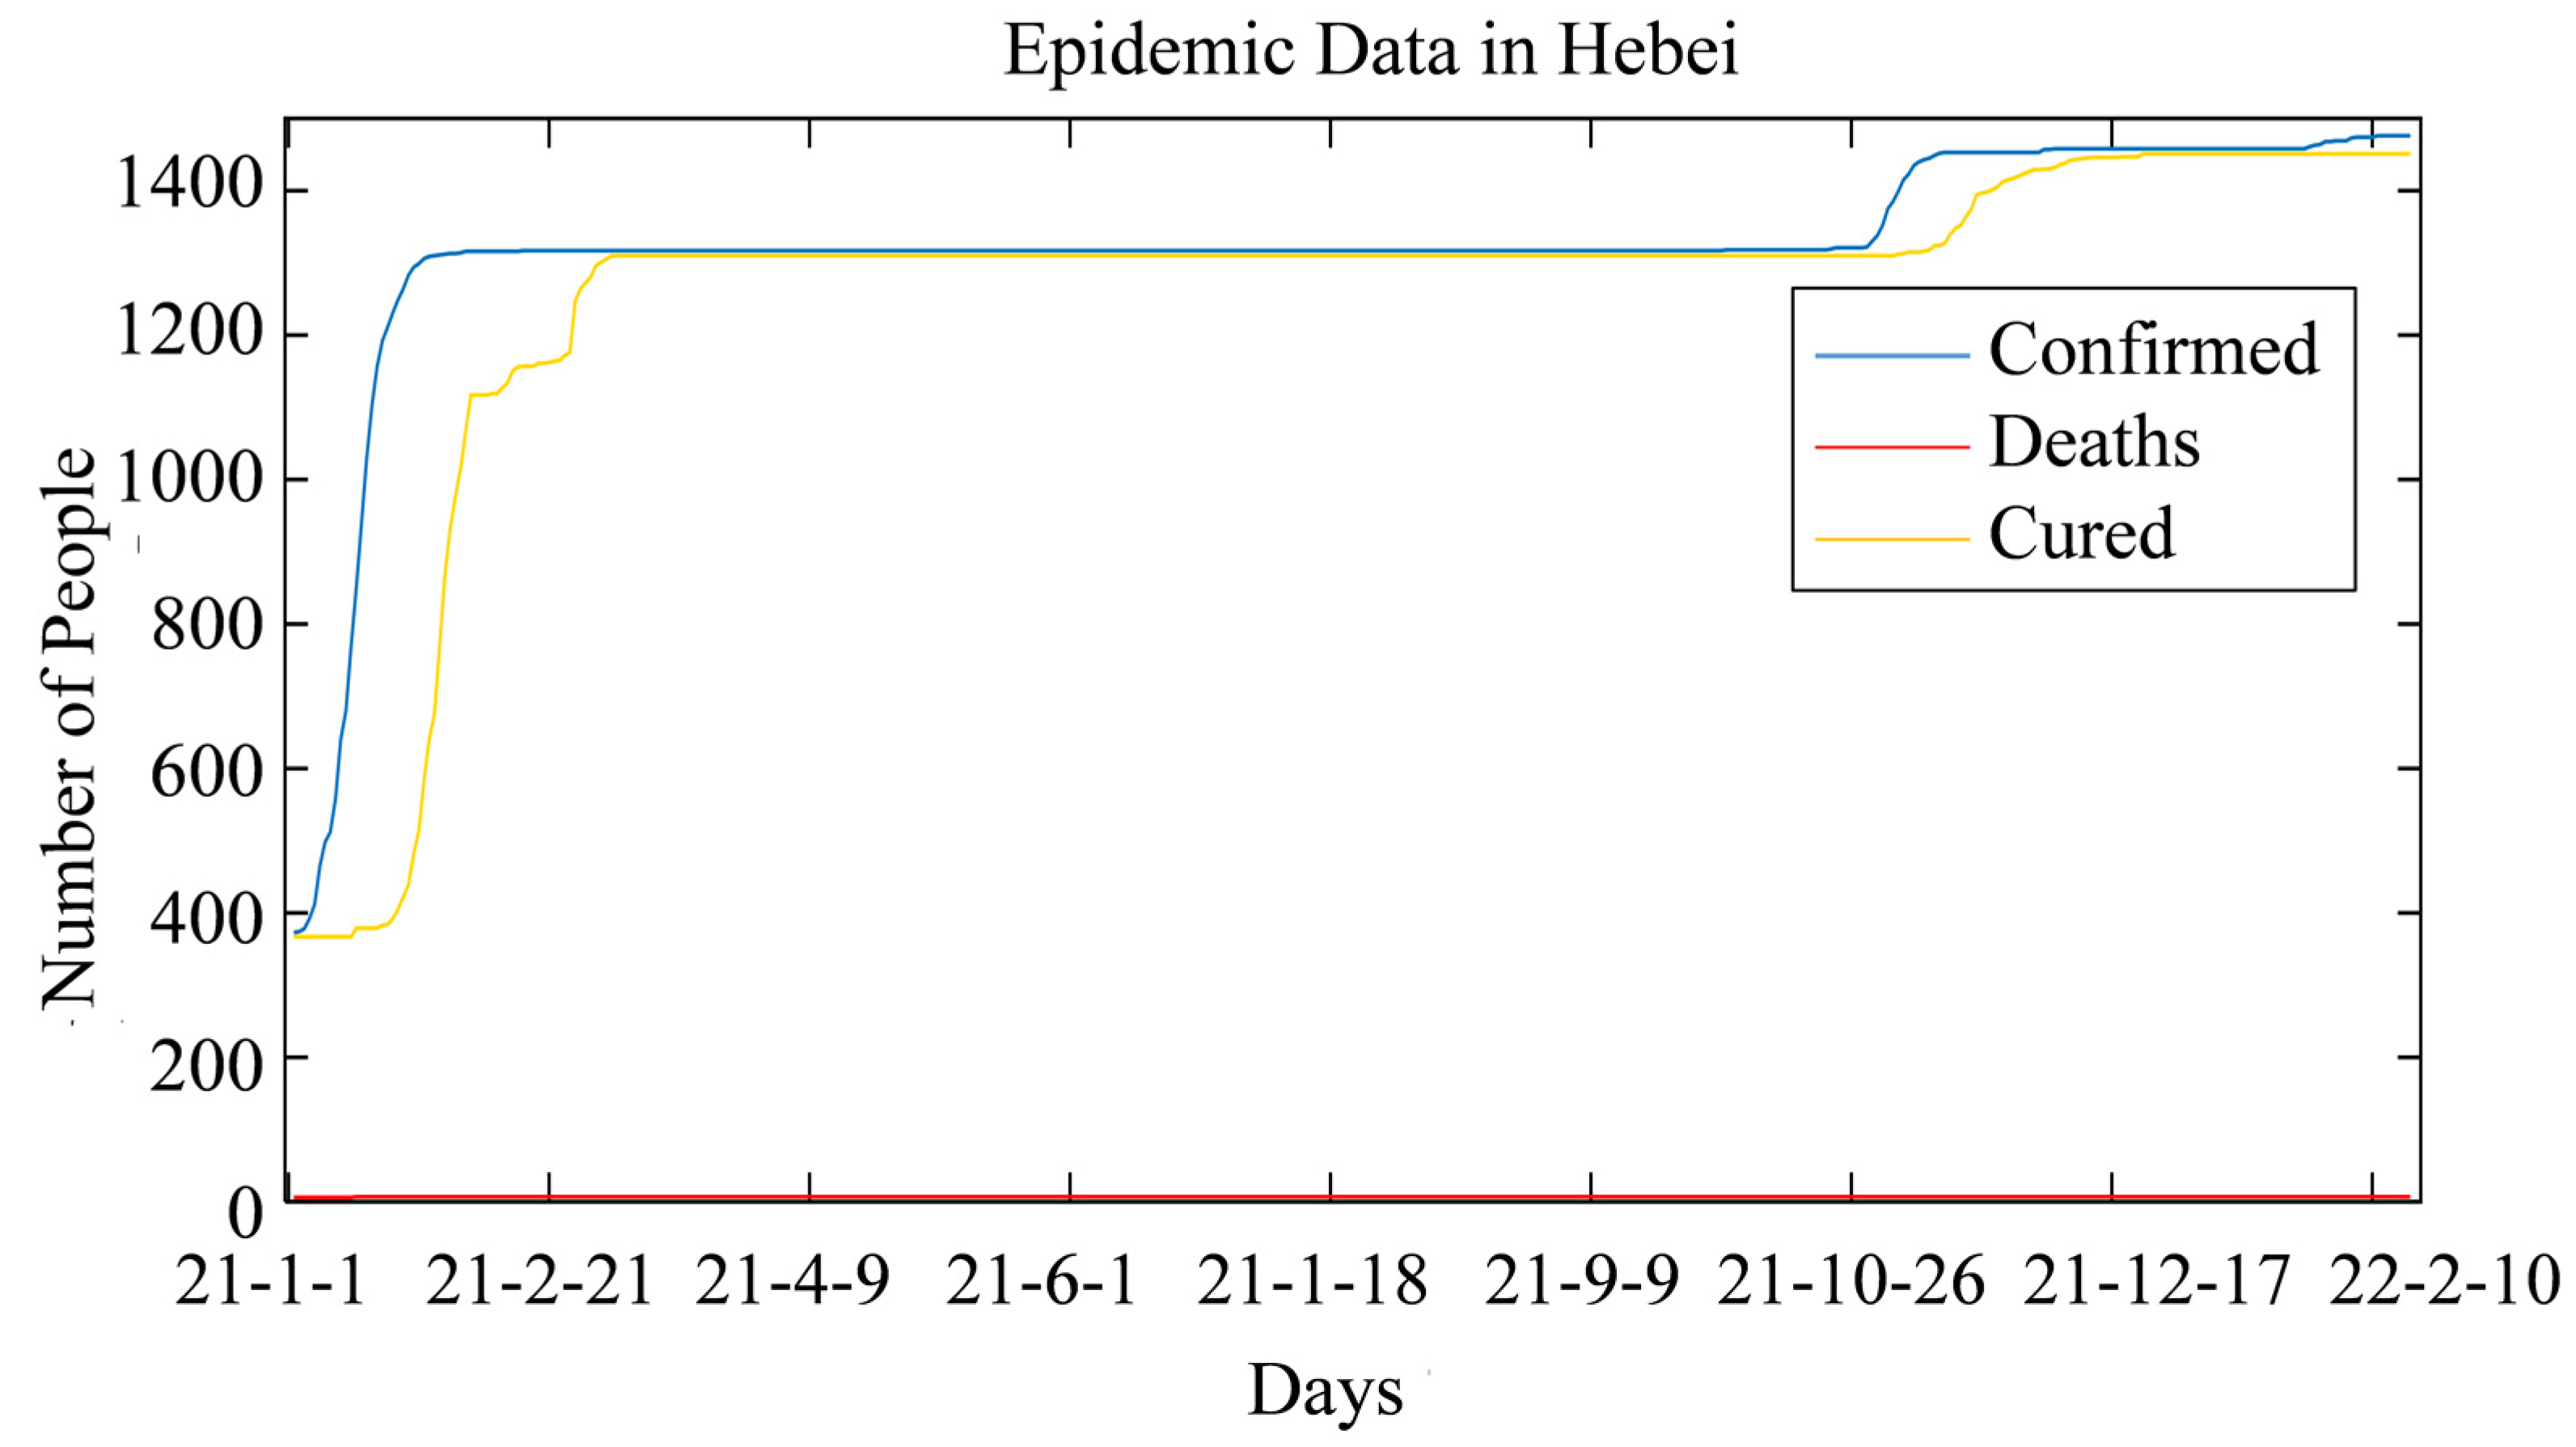
4.1.2. Sources of Pandemic Data

Because Shijiazhuang and Xi’an city are single cities, the amount of disease data is small, considering their prevention and control and provincial policies. Therefore, the model is expanded to Hebei province and Shaanxi province. The SEIARN was verified by local data, and the contact rate of each section was assumed to be equal to that of Shijiazhuang and Xi’an. The data from 1 January 2021–10 February 2022 were obtained by crawling the online data, which is summarized in Figure 9, Figure 10 and Figure 11.
It can be seen from the above figure that a large-scale epidemic broke out in Tianjin from 28 December 2021 to 10 February 2022. Before 28 December 2021, the epidemic situation is relatively stable, but there was still an increase; the epidemic situation in Shaanxi is similar to that in Tianjin. The trend of the number of infected people was relatively stable before 14 December 2021, and then there was explosive growth. Hebei has experienced two growths, the growth rate is low, and the overall trend is steady.

4.2. Experimental Results

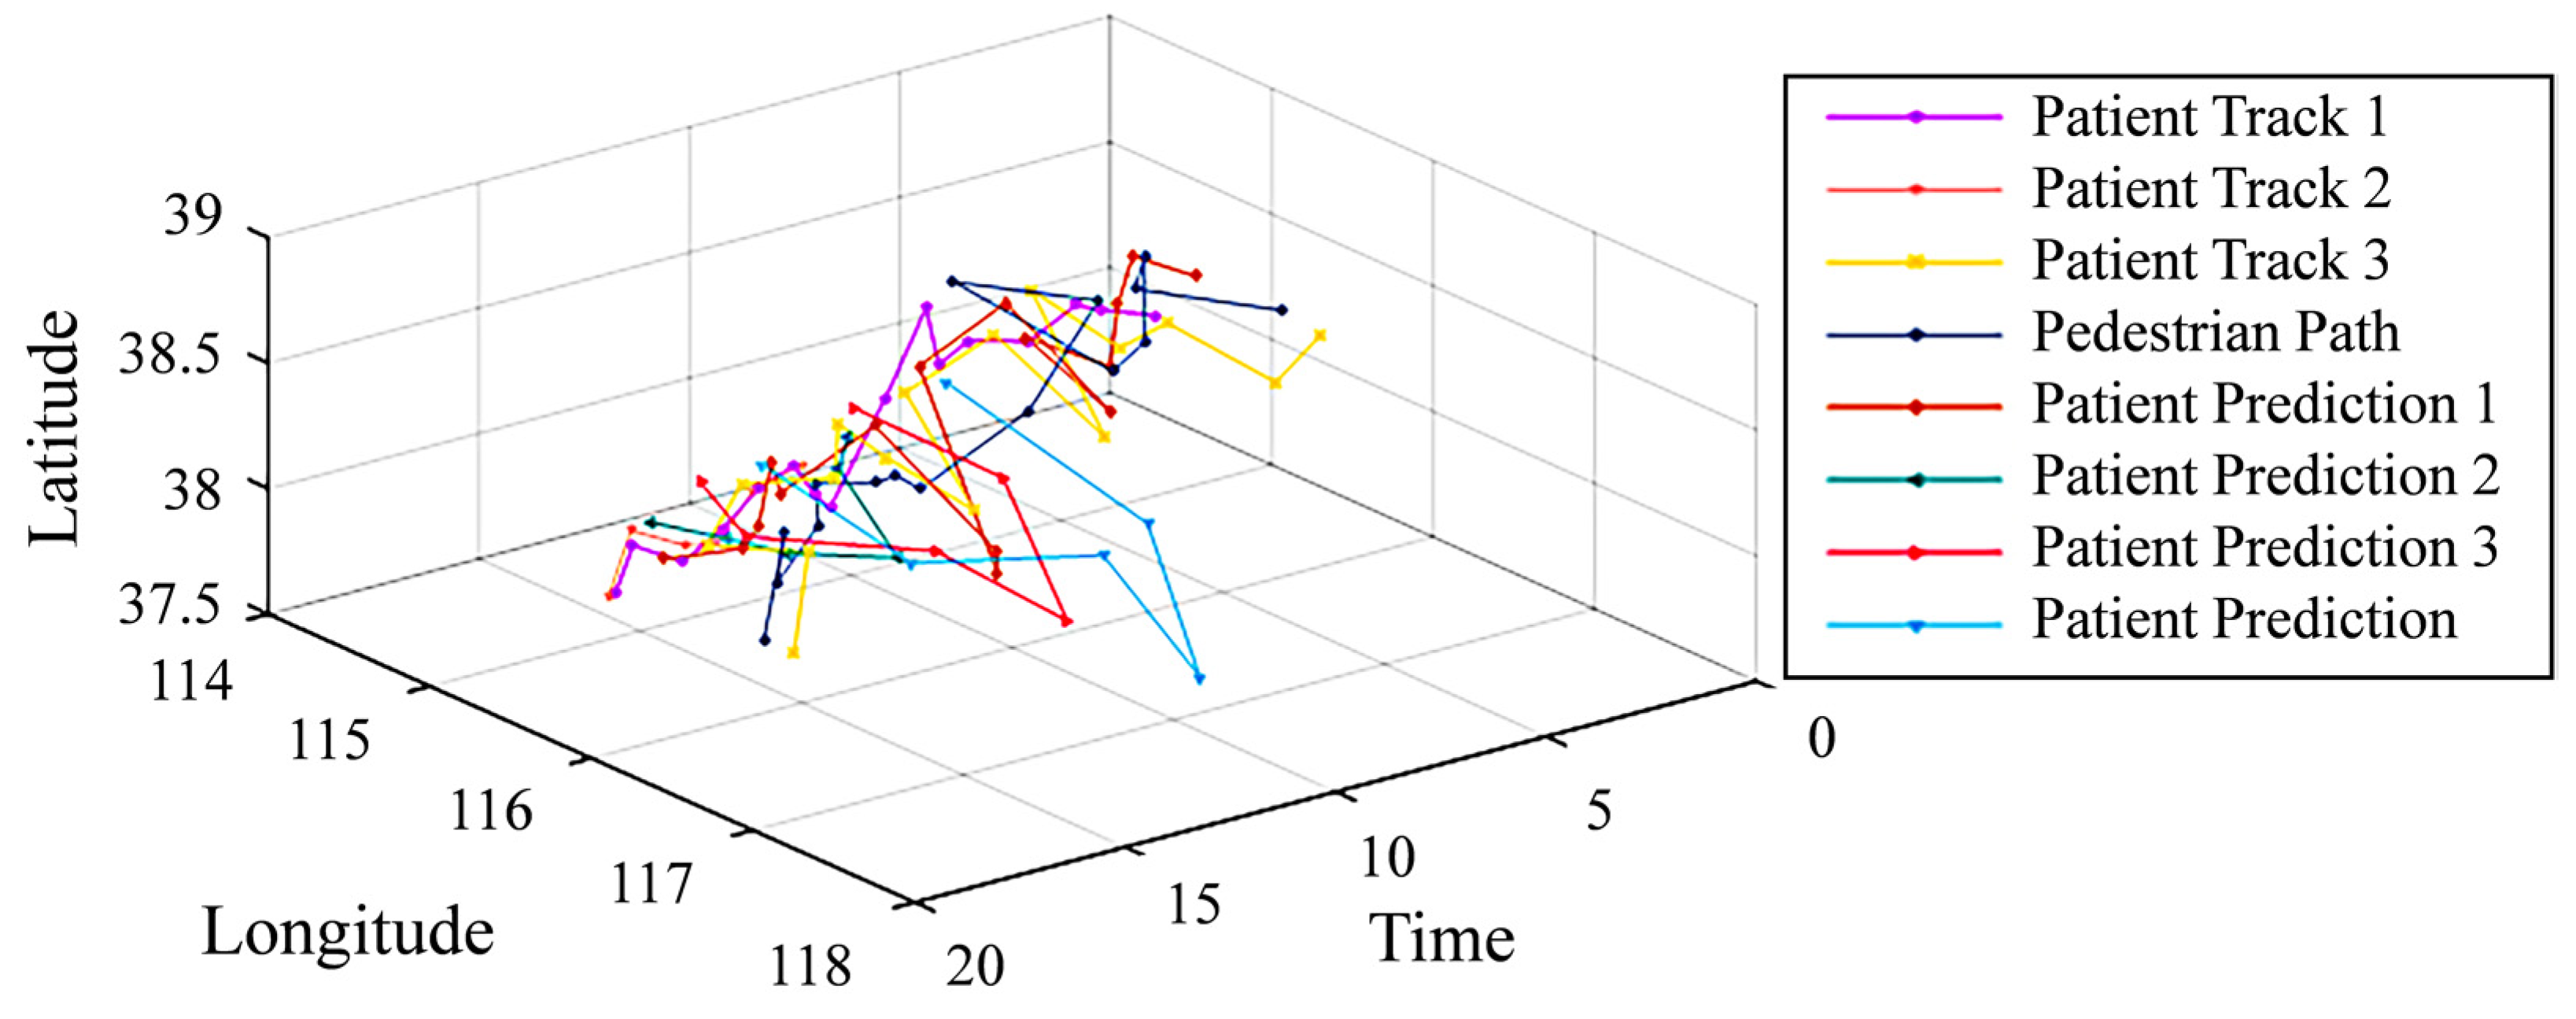
4.2.1. Predict Trajectory and Contact Rate

Taking the data of Hebei Province as an example, ordinary pedestrian data and COVID-19 patient data are brought into the LSTM model [21]. In real life, the trajectory of two people cannot guarantee the complete consistency of their activities. To simplify the complexity of the model and facilitate viewing and understanding, it is assumed that the time of each dwell point is the same. The longitude and latitude data of pedestrians and patients with novel coronavirus at the first 13 time points are brought into the model to predict the longitude and latitude of the following six time points, as shown in Figure 12 and Figure 13.
Through the above figure, the predicted data is compared with the actual data to obtain the accuracy. The accuracy rates of longitude and latitude prediction of pedestrians and patients were 98.5% and 95.12%, respectively, and the accuracy rates of both were more than 90%. This shows that the improved LSTM model has a good prediction effect.
Through the expected trajectory of pedestrians and patients, the trajectory crossing diagram is shown in Figure 14.
According to Equations (7)–(10), the Contact   rate s contact rate between patients and pedestrians is 2.647%.

4.2.2. Epidemic Trend Prediction Based on SEIARN Model

The contact number parameters between symptomatic infected persons and susceptible persons in the SEIARN model are determined by the C o n t a c t   r a t e s contact rate in the above LSTM trajectory intersection and the liable group S(0). Other parameters refer to previous studies, and the SEIARN model is established with the epidemic data of Hebei Province on 1 January 2021 as the initial condition. The final meaning and value of each parameter are shown in Table 2.
Taking Hebei Province as an example, this paper makes a retrospective study on the epidemic situation, and establishes a model based on the above parameters. Take the epidemic data of Hebei Province on 1 January 2021, as the initial time to evaluate the epidemic trend of one year. Compared with the actual data, the epidemic trend curve is drawn, as shown in Figure 15 and Figure 16.
As the chart above shows, the trend of the epidemic will be stable without the interference of the increase of sudden cases. Considering the occurrence of sudden instances, the current suspected instances, infected instances, cured instances, and other data changes can be monitored in real-time through the LSTM model and with timely revision of the SEIARN model. Comparing the actual data of daily infection, cure, and death with the predicted data, the average accuracy results are shown in Table 3.
It can be seen from Table 3 that the prediction accuracy of the number of cured people and the number of deaths has reached more than 80%. It belongs to the level of accurate prediction. The prediction effect of the number of infected people is poor, considering the unknowability and abruptness of the epidemic development. Based on the actual situation, the second round of epidemics broke out in Hebei Province in the first quarter of 2021. This sudden phenomenon cannot be accurately predicted.

4.3. SEIARN Model Parameter Value Analysis

Through the above SEIARN model to predict the trend of the epidemic situation, we can understand that model’s accuracy in predicting the number of infected people is low. In addition to the evaluation of the actual parameters in this paper. The above parameters of the asymptomatic rehabilitation rate γ 1 and symptomatic rehabilitation rate γ 2 without literature support are exhaustively analyzed. The value range of the two parameters is [0, 1], and the set step size is 0.1. Traverse all value combinations of the two parameters to obtain the average accuracy of the SEIARN model in predicting the number of infections, deaths, and cured people under each variety, as shown in Figure 17.
As shown in Figure 17, when the step size is 0.1, γ 1 = 0.3, γ 2 = 0.1, the average accuracy of its SEIARN model is the maximum, at 0.8017. When γ 1 and γ 2 are in the interval of [0, 0.3], the accuracy of its model has reached more than 0.7, which has a high predictive level. Therefore, the accuracy of the above model parameters γ 1 is 0.26 and γ 2 is 8.7 × 10⁻² in this paper, which belongs to the higher prediction level.

4.4. Model Suitability Analysis

In order to verify the adaptive range of SEIARN model, based on the excellent prediction results of the epidemic trend in Hebei Province, this paper makes further predictions for Xi’an and Tianjin, where the secondary epidemic is more serious. Due to the small base of the overall sick population in Xi’an, the prediction scope is extended to Shaanxi Province. According to the track data collected above, the improved LSTM model is used to predict the track and calculate the contact rate. The track prediction and contact rate calculation results are shown in Table 4.
Table 4 shows that the patient contact rate in Tianjin is higher than that in Shaanxi Province and Hebei Province. The analysis of the actual situation shows that the geographical location and economy of Tianjin indirectly or directly lead to more population contact.
To predict the epidemic development trend of the above two places, the epidemic trend prediction model based on the SEIARN model is brought into the epidemic trend prediction model. Its parameters refer to the above research. SEIARN models are established with the epidemic data of 1 January 2021 in Tianjin and Shaanxi Province as the initial conditions to predict the trend of infection, cure, and death in local areas from 1 January 2021–10 February 2022. Some parameters and average accuracy are shown in Table 5.
It can be seen from the above table that the accuracy of the number of infections in Tianjin is 68.42% higher than that in Hebei Province, and the accuracy of the number of deaths is 89.77% higher than that in Hebei Province. The reason is that the death toll in Tianjin and Shaanxi Province is relatively fixed and does not fluctuate. The error of prediction results is small, resulting in high accuracy. The accuracy of the number of cured people was slightly lower than that of Hebei Province, with a prediction accuracy of 82.31%. To sum up, the prediction effect is lower than that of Hebei Province, and the average accuracy of the three regions is higher than 80%. It shows that the SEIARN model has strong adaptability and provides a scientific reference for local public health management departments to formulate preventive measures.

4.5. Comparative Analysis of Models

To further prove the superiority of this model, the epidemic data of Hebei Province are brought into the traditional the SEIR, SEIAR models, SEIAR model with relapse effect, and a new nonlinear dynamics model to predict the number of infections, cures, and deaths, and their average accuracy is calculated. It is compared with the experimental results of the SEIARN model based on the LSTM trajectory prediction, as shown in Figure 18.
As shown in Figure 18, the SEIARN model based on the LSTM trajectory prediction has the highest accuracy in all data predictions. In predicting the number of infected people, its accuracy is significantly higher than the other four algorithms, which is 68.42%. In predicting the number of cured people and the number of deaths, its accuracy is also improved compared with the other two algorithms, which are enhanced by 16.77%, 7.43%, 45.96%, and 0.88%. Compared with the studies of other scholars, the SEIARN model based on the LSTM trajectory prediction still has some advantages in prediction accuracy. From Table 6, Table 7 and Table 8, the other indicators of the SEIARN model based on the LSTM trajectory prediction also outperform the other four models overall, indicating that the algorithm has good stability.
The SEIARN model based on the LSTM trajectory prediction is improved, based on the other two models. This algorithm obtains the actual patient contact rate through the improved LSTM model and takes into account the characteristics of pneumonia epidemic such as asymptomatic infected persons and secondary infection. The SEIAR model introduces asymptomatic infection based on the SEIR model, but it cannot accurately reflect the propagation characteristics of COVID-19. Therefore, the accuracy of the data is less than that of the SEIARN model based on LSTM trajectory prediction.

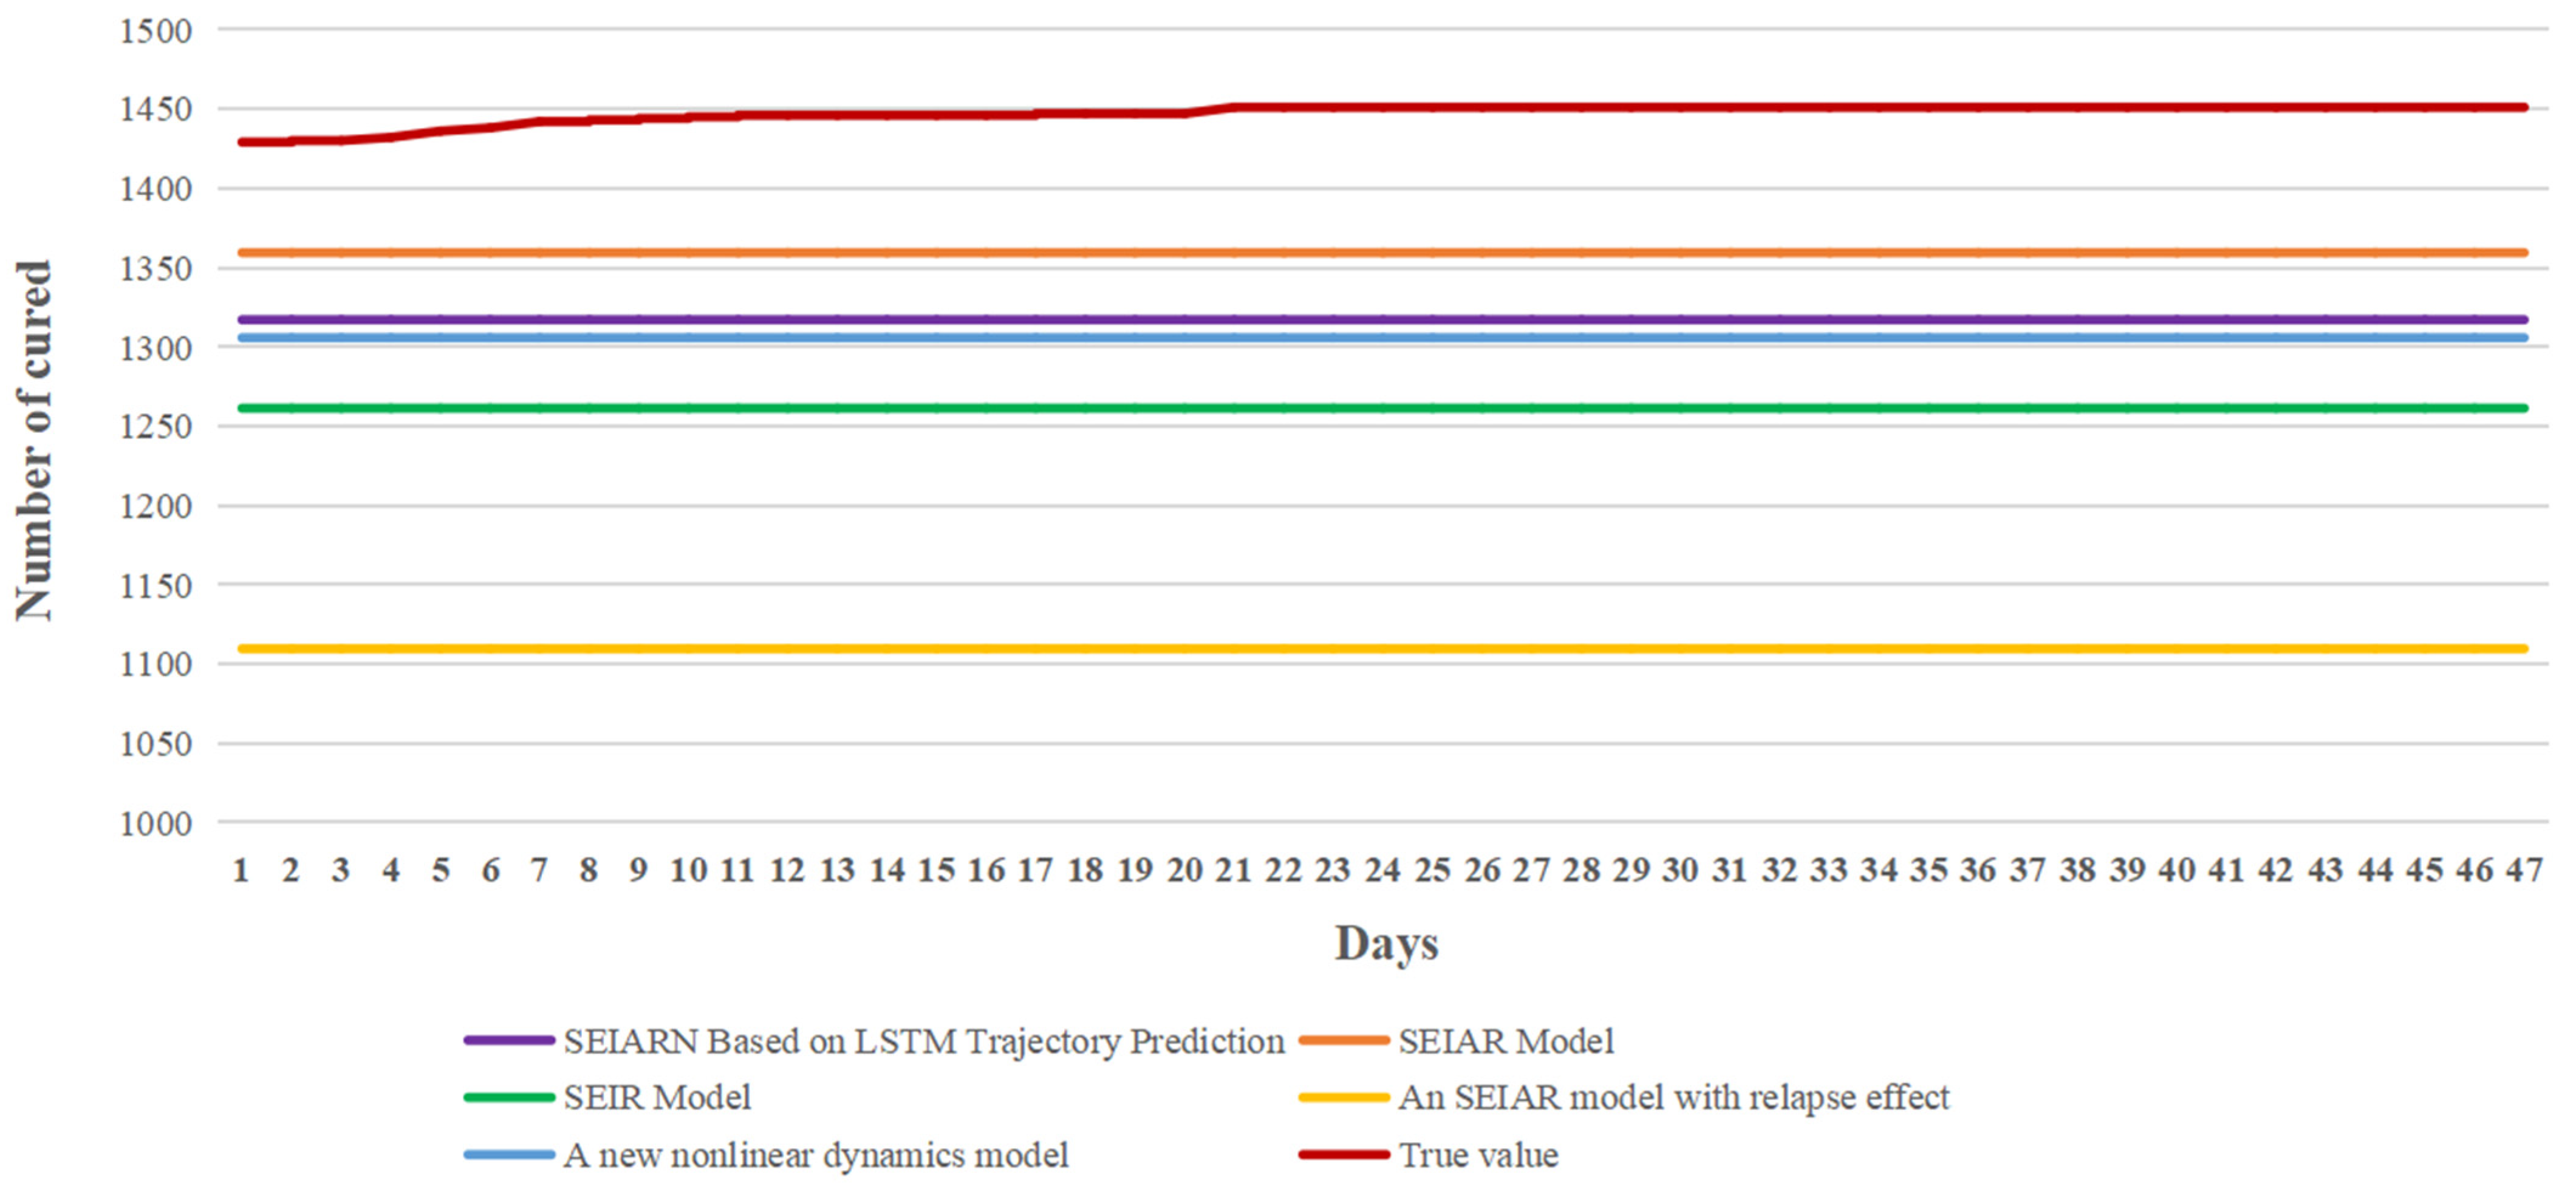
4.6. Model Prediction Comparison

Five models—SEIARN based on LSTM trajectory prediction, SEIR model, SEIAR model, SEIAR model with relapse effect, and a new nonlinear dynamics model—were used to predict the epidemic data in Hebei in the next 47 days starting from 2 December 2021. The prediction results of the five models are shown in Figure 19, Figure 20 and Figure 21. Since SEIARN based on LSTM trajectory prediction needs to update parameters in real time through trajectory prediction, large errors will inevitably occur in the long-term prediction because parameters cannot be updated accurately and in real time. For the prediction results of current patients, our model has a large prediction error compared with the real value, but in terms of performance, our model is basically consistent with the prediction results of the other four models, indicating that our model still has good stability in long-term prediction. For the prediction of the number of deaths and the number of cured people, the prediction results of our model for the two data are close to the real value.

5. Conclusions

5.1. Numerical Results

The SEIARN model based on LSTM trajectory prediction constructed in this paper predicts and analyzes the epidemic situation of COVID-19. Among them, LSTM trajectory prediction is used to adjust the contact rate parameters of the model in real-time, which improves the prediction effect of the model. Analyze the epidemic situation transformation from 20 December 2020–1 December 2021 and the track intersection between pedestrians and infected persons. Use the LSTM track prediction model to obtain the contact rate and substitute it into the SEIARN model for simulation and prediction. The results show that the relevant results are consistent with the actual COVID-19 data. Compared with the traditional SEIR model, improved SEIR models, and two existing studies on models, the proposed model has better applicability. It is reliable in the analysis of epidemic situations. It can provide some theoretical support for future decision making regarding epidemic intervention.
According to the prediction results of the model, the epidemic development in Hebei Province shows a stable trend and tends to be tough. However, due to the failure to take the unknown factors and emergencies into account, the model will inevitably be different from reality, resulting in a specific deviation in the analysis and prediction results. Therefore, we should remain vigilant. The government should still enhance the awareness of prevention and control of personnel. The government should strictly manage the detection of foreign personnel, control the expansion and development of transmission areas, and prevent the recurrence of epidemics.

5.2. Limitations of the Proposed Model

The proposed SEIARN model based on LSTM trajectory crossing has higher prediction accuracy than the existing prediction methods. However, in the process of trajectory crossing, it is approximately assumed that each dwell point has the same time in a particular range, ignoring the dwell difference of practical factors. In this paper, trajectory intersection points will be calculated according to the actual situation, to obtain a more accurate contact rate. The results confirm the reliability of the model in the situation analysis of infectious disease transmission. It can provide some theoretical support for future decision making regarding epidemic intervention. However, the model will inevitably be different from reality, resulting in a specific deviation in the analysis and prediction results. In order to further improve the accuracy of the model, this paper will continue to optimize and improve the parameters of the LSTM and the SEIARN model to ensure that the epidemic situation in each province and even the whole country can be tracked, and it will start locally and expand to the entire country to effectively control the development of the epidemic situation.

Author Contributions

Conceptualization, L.W.; Data curation, Y.S. (Yuwen Sun); Formal analysis, L.W.; Funding acquisition, L.W.; Investigation, R.W.; Methodology, L.W.; Project administration, C.Z.; Resources, L.W. and C.Z.; Software, Y.D. and R.W.; Supervision, C.Z.; Validation, Z.Y.; Visualization, Y.D., R.W., Y.S. (Yuwen Sun), Z.Y. and Y.S. (Yuqing Sun); Writing—original draft, Y.D., Y.S. (Yuwen Sun), Z.Y. and Y.S. (Yuqing Sun); Writing—review & editing, C.Z. and Z.Y. All authors have read and agreed to the published version of the manuscript.

Funding

This research was funded by Key R&D projects in Hebei Province (No. 20270902D), the Hebei Province Professional Degree Teaching Case Establishment and Construction Project (No. KCJSZ2022073), and the Hebei Postgraduate Course Civic Politics Model Course and Teaching Master Project (No. YKCSZ2021091).

Institutional Review Board Statement

Not applicable.

Informed Consent Statement

Not applicable.

Data Availability Statement

Not applicable.

Conflicts of Interest

The authors declare no conflict of interest.

References

  1. Xu, X.C.; Chang, Z.H.; Tang, Y. Novel coronavirus pneumonia’s impact on China’s economy from statistical data. Econ. Trends 2020, 5, 41–51. [Google Scholar]
  2. Wang, Q.; Chen, J.X.; Xiong, D.P.; He, X.F. New Coronavirus prediction and analysis based on Bayesian Optimization SEIR model. J. Anhui Univ. Eng. 2020, 35, 83–90. [Google Scholar]
  3. Yarsky, P. Using a genetic algorithm to fit parameters of a COVID-19 SEIR model for US states. Math. Comput. Simul. 2021, 185, 687–695. [Google Scholar] [CrossRef]
  4. Luo, D.T.; Qian, H.; Liu, C.; Huang, S.X. Effect evaluation of COVID-19 control strategy in different countries and periods: Based on adaptive pso-SEIR model. Sci. Bull. 2021, 66, 453–464. [Google Scholar]
  5. Jin, X.Y.; He, K.R. Evaluation and suggestion on effectiveness of New Coronavirus’s epidemic prevention policy based on improved SEIR model. Economist 2021, 2, 13–16. [Google Scholar]
  6. Zhang, Y.X.; Lin, J. Prediction and Analysis of Propagation of Novel Coronavirus Pneumonia Epidemic Based on SIR Model. J. Anhui Univ. Technol. (Nat. Sci.) 2020, 37, 94–101. [Google Scholar]
  7. Ding, M.L.; Peng, R.L.; Guo, R.W. Study on novel coronavirus pneumonia transmission problem based on infectious disease model. J. Qilu Univ. Technol. 2020, 34, 8–76. [Google Scholar]
  8. Rajesh, A.; Pai, H.; Roy, V.; Samanta, S.; Ghosh, S. COVID-19 prediction for India from the existing data and SIR (D) model study. medRxiv 2020, 1–14, preprint. [Google Scholar]
  9. Chen, Y.C.; Lu, P.E.; Chang, C.S.; Liu, T.H. A time-dependent SIR model for COVID-19 with undetectable infected persons. IEEE Trans. Netw. Sci. Eng. 2020, 7, 3279–3294. [Google Scholar] [CrossRef]
  10. Gu, B. Forecast and analysis of COVID-19 epidemic based on improved SEIR model. J. Phys. Conf. Ser. 2021, 1802, 042050. [Google Scholar] [CrossRef]
  11. Rǎdulescu, A.; Williams, C.; Cavanagh, K. Management strategies in a SEIR-type model of COVID 19 community spread. Sci. Rep. 2020, 10, 21256. [Google Scholar] [CrossRef] [PubMed]
  12. De la Sen, M.; Ibeas, A.; Nistal, R. About partial reachability issues in an SEIR epidemic model and related infectious disease tracking in finite time under vaccination and treatment controls. Discret. Dyn. Nat. Soc. 2021, 2021, 5556897. [Google Scholar] [CrossRef]
  13. Wang, G.Z.; Chi, X.H.; Zhou, Q. Epidemic prediction and analysis based on improved SEIR model. J. Henan Inst. Technol. 2020, 28, 29–33. [Google Scholar]
  14. Wang, Y.; Hu, J.C. Prediction and analysis of COVID-19 using PSO algorithm for estimating SEIRD model parameters. J. Chengdu Univ. Inf. Technol. 2021, 36, 368–373. [Google Scholar]
  15. Fan, Y.R.; Yang, T.; Kong, H.F. Assessment and prediction of COVID-19 based on staged SIR-f model. Comput. Appl. Softw. 2020, 37, 51–56+62. [Google Scholar]
  16. Mei, W.J.; Liu, Z.; Zhu, J.Y.; Du, L. Extreme IR Model for COVID -19 Real-Time Forecasting. J. Univ. Electron. Sci. Technol. China 2020, 49, 362–368. [Google Scholar]
  17. Yang, B.; Yu, Z.H.; Cai, Y.L. Study on mathematical modeling of New Coronavirus pneumonia transmission and control. J. Xi’an Jiaotong Univ. 2021, 55, 162–172. [Google Scholar]
  18. Ketu, S.; Mishra, P.K. India perspective: CNN-LSTM hybrid deep learning model-based COVID-19 prediction and current status of medical resource availability. Soft Comput. 2022, 26, 645–664. [Google Scholar] [CrossRef]
  19. Zhao, X.; Sun, G.X.; Zhao, Y. Prediction of COVID-19 outbreak and assessment of prevention and control measures based on improved SEIR model. J. Qingdao Univ. (Nat. Sci. Ed.) 2021, 34, 1–8. [Google Scholar]
  20. Liang, J.Y. Establishment and Optimization of Prediction Model on COVID-19 Epidemic. Master’s Thesis, Guangzhou Medical University, Guangzhou, China, 2021. [Google Scholar]
  21. Tkachenko, R.; Izonin, I. Model and principles for the implementation of neural-like structures based on geometric data transformations. In Proceedings of the International Conference on Computer Science, Engineering and Education Applications, Kiev, Ukraine, 18–20 January 2018; Springer: Cham, Switzerland, 2018; pp. 578–587. [Google Scholar]
  22. Tkachenko, R. An Integral Software Solution of the SGTM Neural-like Structures Implementation for Solving Different Data Mining Tasks. In Proceedings of the International Scientific Conference “Intellectual Systems of Decision Making and Problem of Computational Intelligence”, Zalizniy Port, Ukraine, 24–28 May 2021; Springer: Cham, Switzerland, 2021; pp. 696–713. [Google Scholar]
  23. Zhang, L.Y.; Guo, J.F.; Wang, J.; Wang, J.Z.; Li, S.S.; Zhang, C.Y. Hypergraph and Uncertain Hypergraph Representation Learning Theory and Methods. Mathematics 2022, 10, 1921. [Google Scholar] [CrossRef]
  24. Li, A.L.; Zhang, F.L.; Gao, Q.; Wang, R.J. Trajectory next footprint prediction model based on adaptive timestamp and multi-scale feature extraction. Comput. Sci. 2021, 48, 191–197. [Google Scholar]
  25. Mikhailov, S.; Kashevnik, A. Car Tourist Trajectory Prediction Based on Bidirectional LSTM Neural Network. Electronics 2021, 10, 1390. [Google Scholar] [CrossRef]
  26. Bajiya, V.P.; Tripathi, J.P.; Kakkar, V.; Wang, J. Global Dynamics of a Multi-group SEIR Epidemic Model with Infection Age. Chin. Ann. Math. Ser. B 2021, 42, 833–860. [Google Scholar] [CrossRef]
Figure 1. Flow diagram of a conventional SEIR model chamber.
Mathematics 10 03046 g001
Figure 2. Structure diagram of LSTM neural network.
Mathematics 10 03046 g002
Figure 3. Flow diagram of a conventional SEIARN model chamber.
Mathematics 10 03046 g003
Figure 4. Algorithm flowchart.
Mathematics 10 03046 g004
Figure 5. LSTM prediction process.
Mathematics 10 03046 g005
Figure 6. Heat map of trajectory data of Xi’an city.
Mathematics 10 03046 g006
Figure 7. Heat map of trajectory data of Tianjin city.
Mathematics 10 03046 g007
Figure 8. Heat map of trajectory data of each city.
Mathematics 10 03046 g008
Figure 9. Relevant epidemic data of Tianjin city.
Mathematics 10 03046 g009
Figure 10. Relevant epidemic data of Xi’an city.
Mathematics 10 03046 g010
Figure 11. Relevant epidemic data of Hebei city.
Mathematics 10 03046 g011
Figure 12. Comparison diagram of pedestrian predicted trajectory.
Mathematics 10 03046 g012
Figure 13. Comparison diagram of patient predicted trajectory.
Mathematics 10 03046 g013
Figure 14. Track crossing diagram.
Mathematics 10 03046 g014
Figure 15. Epidemic trend based on SEIARN that trend chart for infected and cured patients.
Mathematics 10 03046 g015
Figure 16. Epidemic trend based on SEIARN that trend chart for lurkers and reapers.
Mathematics 10 03046 g016
Figure 17. SEIARN parameter traversal result graph.
Mathematics 10 03046 g017
Figure 18. Schematic diagram of model comparison results.
Mathematics 10 03046 g018
Figure 19. Comparison chart of the number of infected people.
Mathematics 10 03046 g019
Figure 20. Comparison chart of the number of deaths.
Mathematics 10 03046 g020
Figure 21. Comparison chart of the number of cured people.
Mathematics 10 03046 g021
Table 1. Table of the most representative single patient trajectories.
TianjinXi’an, Shaanxi
LocationAddressLocationAddress
Garden Shade Community Station117.144565, 39.09177345 Cuihua North Road108.956961, 34.225502
Linyuan Beili Community117.140883, 39.089576188 Cuihua Road108.956162, 34.217596
Lin Yuen Road Bank of China117.143379, 39.087896Yujiazhuang Station108.869362, 34.198944
Lin Yuan Wet Market117.141529, 39.087807Xin Suzaku Market108.917471, 34.195764
Wang Dingdi supermarket117.150945, 39.095768Qujiang Exhibition Station108.950642, 34.195795
Garden View Apartment117.15197, 39.084268KFC Suzaku shop108.940885, 34.223241
Shijiazhuang, Hebei
locationaddresslocationaddress
Yuhua District114.531362, 38.006453Jiansheng Road114.500305, 38.019991
Xinhua114.463347, 38.05106Xinle City114.684014, 38.343296
Xinhua West Road114.424514, 38.051049Gaocheng District114.688951, 38.024039
Table 2. Initial conditions and parameter values of the SEIARN model.
VariableMeaningValueSourceVariableMeaningValueSource
β 1 A rate of symptomatic5.2 × 10−7Reference [8] n 2 asymptomatic contacts60Reference [6]
β 2 Asymptomatic infection rate4.3 × 10−9Reference [8] n 1 Number of symptoms90S(0)∗ C s
α Latent confirmatory rate0.084Reference [8]S(0)Initial susceptibility7.46 × 106data
γ 1 Asymptomatic recovery rate0.26estimateE(0)Initial latent population81data
γ 2 a recovery rate for symptoms8.7 × 10−2estimateA(0)Initial asymptomatic215data
m Proportion of symptoms0.8Reference [6]I(0)initial symptoms770data
θ Disease recurrence rate7 × 10−9Reference [9]R(0)Initial recovery367data
Table 3. Statistics of the SEIARN results.
Number of InfectionsNumber of CuredDeath Toll
Average accuracy68.42%82.31%89.77%
Predict the mean data5612508
True data mean6112617
The average difference49.2056.210.54
Table 4. Summary of relevant track results of Tianjin and Shaanxi Province.
Patient Trajectory AccuracyPedestrian Trajectory AccuracyExposure Rate
Tianjin 97.56%94.18%3.174%
Shaanxi 98.73%96.44%2.253%
Table 5. Summary of parameters and average accuracy results.
TianjinShaanxi
ParameterReferenceParameterReferenceParameterReferenceParameterReference
α 0.084A(0)51 α 0.084A(0)68
θ 7 × 10 9 I(0)1 θ 7 × 10 9 I(0)1
β 1 5.2 × 10 7 R(0)301 β 1 5.2 × 10 7 R(0)499
β 2 4.3 × 10 9 S(0)1.29 × 10⁶ β 2 4.3 × 10 9 S(0)3.95 × 10⁶
γ 1 0.16E(0)46 γ 1 0.17E(0)73
γ 2 0.084 n 1 60 γ 2 0.074 n 1 60
m 0.8 n 2 90 m 0.8 n 2 90
Acc of infected 69.78%Acc of infected 65.44%
Acc of cured78.25%Acc of cured80.32%
Acc of deaths95.70%Acc of deaths95.70%
RMSE of infected 261.6728RMSE of infected 183.363
RMSE of cured196.7453RMSE of cured93.2538
RMSE of deaths0.000097461RMSE of deaths0.00016682
Table 6. Model prediction results of infected persons.
ModelAccuracy RateMSERMSEMAPE
SEIARN Based on LSTM Trajectory Prediction68.42%26916.39300.1296
SEIR Model43.12%23,269152.54380.1272
SEIAR Model55.95%29,038170.40610.1326
SEIAR model with relapse effect22.46%69,286263.22310.1752
A new nonlinear dynamics model67.54%34718.62000.1212
Table 7. Model prediction results of rehabilitation population.
ModelAccuracy RateMSERMSEMAPE
SEIARN Based on LSTM Trajectory Prediction82.31%26,137161.67000.1372
SEIR Model72.43%287,110535.82700.4911
SEIAR Model78.02%48,671220.61560.2314
SEIAR model with relapse effect59.86%93,161,5119652.02110.9815
A new nonlinear dynamics model79.32%32,084179.12120.1455
Table 8. Model prediction results of death toll.
ModelAccuracy Rate MSERMSEMAPE
SEIARN Based on LSTM Trajectory Prediction89.77%0.95960.97960.0338
SEIR Model84.61%11.86533.44460.464
SEIAR Model88.66%0.18550.43070.0323
SEIAR model with relapse effect75.22%133.837111.56880.6541
A new nonlinear dynamics model85.12%1.01181.00590.0318
Publisher’s Note: MDPI stays neutral with regard to jurisdictional claims in published maps and institutional affiliations.

