Article

Statistical Tables in Spanish Primary School Textbooks

by
María M. Gea
*,
Jocelyn D. Pallauta
,
Carmen Batanero
and
Silvia M. Valenzuela-Ruiz
Department of Mathematics Education, Education Faculty, Cartuja Campus, University of Granada, 18071 Granada, Spain
*
Author to whom correspondence should be addressed.
Mathematics 2022, 10(15), 2809; https://doi.org/10.3390/math10152809
Submission received: 17 July 2022 / Revised: 30 July 2022 / Accepted: 1 August 2022 / Published: 8 August 2022

Abstract

:
Statistics is introduced in primary education in Spain, and its teaching is largely supported by textbooks, which are freely provided to the children. In this research, we analyse the activities based on statistical tables included in two complete collections of primary education mathematics textbooks. These activities are classified according to the type of table, the data presented in them, the activity requested from the student in relation to the table, and the data context, according to those suggested in the PISA studies. Using content analysis, we found that tables of distribution of a variable predominate, mainly with frequencies. The most frequent activity is the reading of information from the table, while the personal context appears in the majority of the activities. This analysis serves to highlight how the teaching of statistical tables is developed throughout primary education and inform the teachers about relevant variables that should be considered in their teaching.

1. Introduction

Statistical tables constitute an important tool in summarising and communicating information and are widely used in the media as well as in science and technology [1,2]. According to Postigo and Pozo [3], tables are used in the study of science and social sciences to construct and communicate abstract concepts as well as to bridge the gap between experiential data and scientific formalizations.
Consequently, the ability to read, interpret and build statistical tables is a component of statistical literacy which is today needed for all citizens [4,5,6,7] as a prerequisite for ensuring active participation in social action and public policy [8]. Taking into account these goals, different curricular guidelines, including the Spanish documents [9,10], propose working with statistical tables throughout primary education (6 to 11-year-olds) in order to record, classify and summarise qualitative and quantitative data as well as to read and build tables with absolute and relative frequencies.
Although statistical tables are considered easy by teachers, due to their wide use [11], research shows the need to reinforce their teaching, given the cognitive skills involved in their understanding and construction [12,13,14,15,16].
A resource that influences how the curriculum is reflected in the classroom is the textbook, which to a large extent guides the teaching and learning process [17], given that it is widely used by both teachers and students, thereby making it an agent of opportunity in the classroom [18,19]. From the official curricular guidelines to the teaching implemented in the classroom, an important step is the written curriculum reflected in textbooks [20]. Teachers in many countries use textbooks to decide what to teach to their students [21,22]. Moreover, textbooks reflect the views of mathematics of those teachers to whom the book is directed [23]. According to Weiland [19], in the case of statistics, the textbook can have a notable influence on the curriculum implemented in the classroom, which is mainly because teachers have less knowledge of statistics than in other areas of mathematics.
In this sense, the textbooks could become the main access to the didactic-mathematical knowledge progressively produced by research in mathematics education, so that analysis of the textbooks plays a key role in improving the didactic–mathematical knowledge and competencies of the mathematics teacher [24]. According to Font and Godino [24], the evaluation of the relevance and suitability of the textbooks should be a key component in mathematics teacher training programs to develop the global competency of analysis and didactic intervention of the mathematics teacher, with a view to provide quality instruction.
The didactic research on instruction optimization is mainly addressed by two approaches [25] according to clarifying the instructional principles directly applied in the teaching and learning process (research-based design) or the mathematical objects and processes involved in the mathematical practices (descriptive-interpretative). In this last case, textbooks analysis reports valuable findings to evaluate the representativeness of the meaning of the mathematical objects intended to be promoted in the school curriculum [24].
However, previous research has mainly examined students’ competence to build or read statistical tables (e.g., [12,15,26]) with little attention paid to how statistical tables are presented in the textbooks. Consequently, this work aims to analyse the activities on statistical tables presented in two complete series of Spanish textbooks for primary education (1st to 6th degrees; 6 to 11-year-olds). This study will allow us to know how the authors of the textbooks interpret the curricular guidelines and can orient the teacher to plan his or her teaching throughout these educational stages.
The following sections describe the foundations and background of this work, which is followed by a detailed description of the methodology used, as well as the results and the main conclusions.

2. Theoretical Background

This work is based on three different foundations. Firstly, we use Lahanier-Reuter’s [27] classification of statistical tables and the different complexity levels proposed by Arteaga [28] for statistical graphs, adapted to tables [29,30]. Secondly, we draw on the importance of context in mathematics and statistics and on the categories of contexts defined in the PISA studies [31]. Finally, the paper builds on previous research that analysed statistical tables in mathematics textbooks.

2.1. Types of Tables and Their Semiotic Complexity

2.1.1. Interpreting Statistical Tables

A statistical table is a complex mathematical object because when working with a table, the reader has to interpret each component and finally the table as a whole [16]. Bertin [32] described a series of steps required in the interpretation of statistical graphs, which are also necessary when dealing with statistical tables:
  • External identification, to find the conceptual and real-world referents which support the information contained in the table (e.g., variables being represented).
  • Internal identification of the relevant dimensions of variation in the table content (e.g., values range or intervals of variation for each variable represented).
  • Perception of the correspondence, by which the reader uses the graphical dimensions levels in the table to draw conclusions about the levels of each conceptual dimension in the real world.
All this information is encoded in the table and should be interpreted by the reader, although the difficulty of such interpretation will depend on the number and abstractness of the underlying mathematical objects, which vary in the type of table, as described below.

2.1.2. Classification of Statistical Tables and Their Semiotic Complexity

We use the classification of statistical tables proposed by Lahanier-Reuter [27], which considered their content and purpose, and which are described in more detail in the results section. Moreover, we will assign to each of these types of statistical tables an increasing level of complexity, which takes into account the mathematical objects involved in its interpretation. These levels proposed originally for statistical graphs [28] were later applied to statistical tables [29,30]. The lack of knowledge regarding part of the objects linked to each type of table could explain the students’ difficulties and errors. The types of tables considered in this paper and their semiotic complexity are summarized below, with further clarifications and examples in Section 4.1:
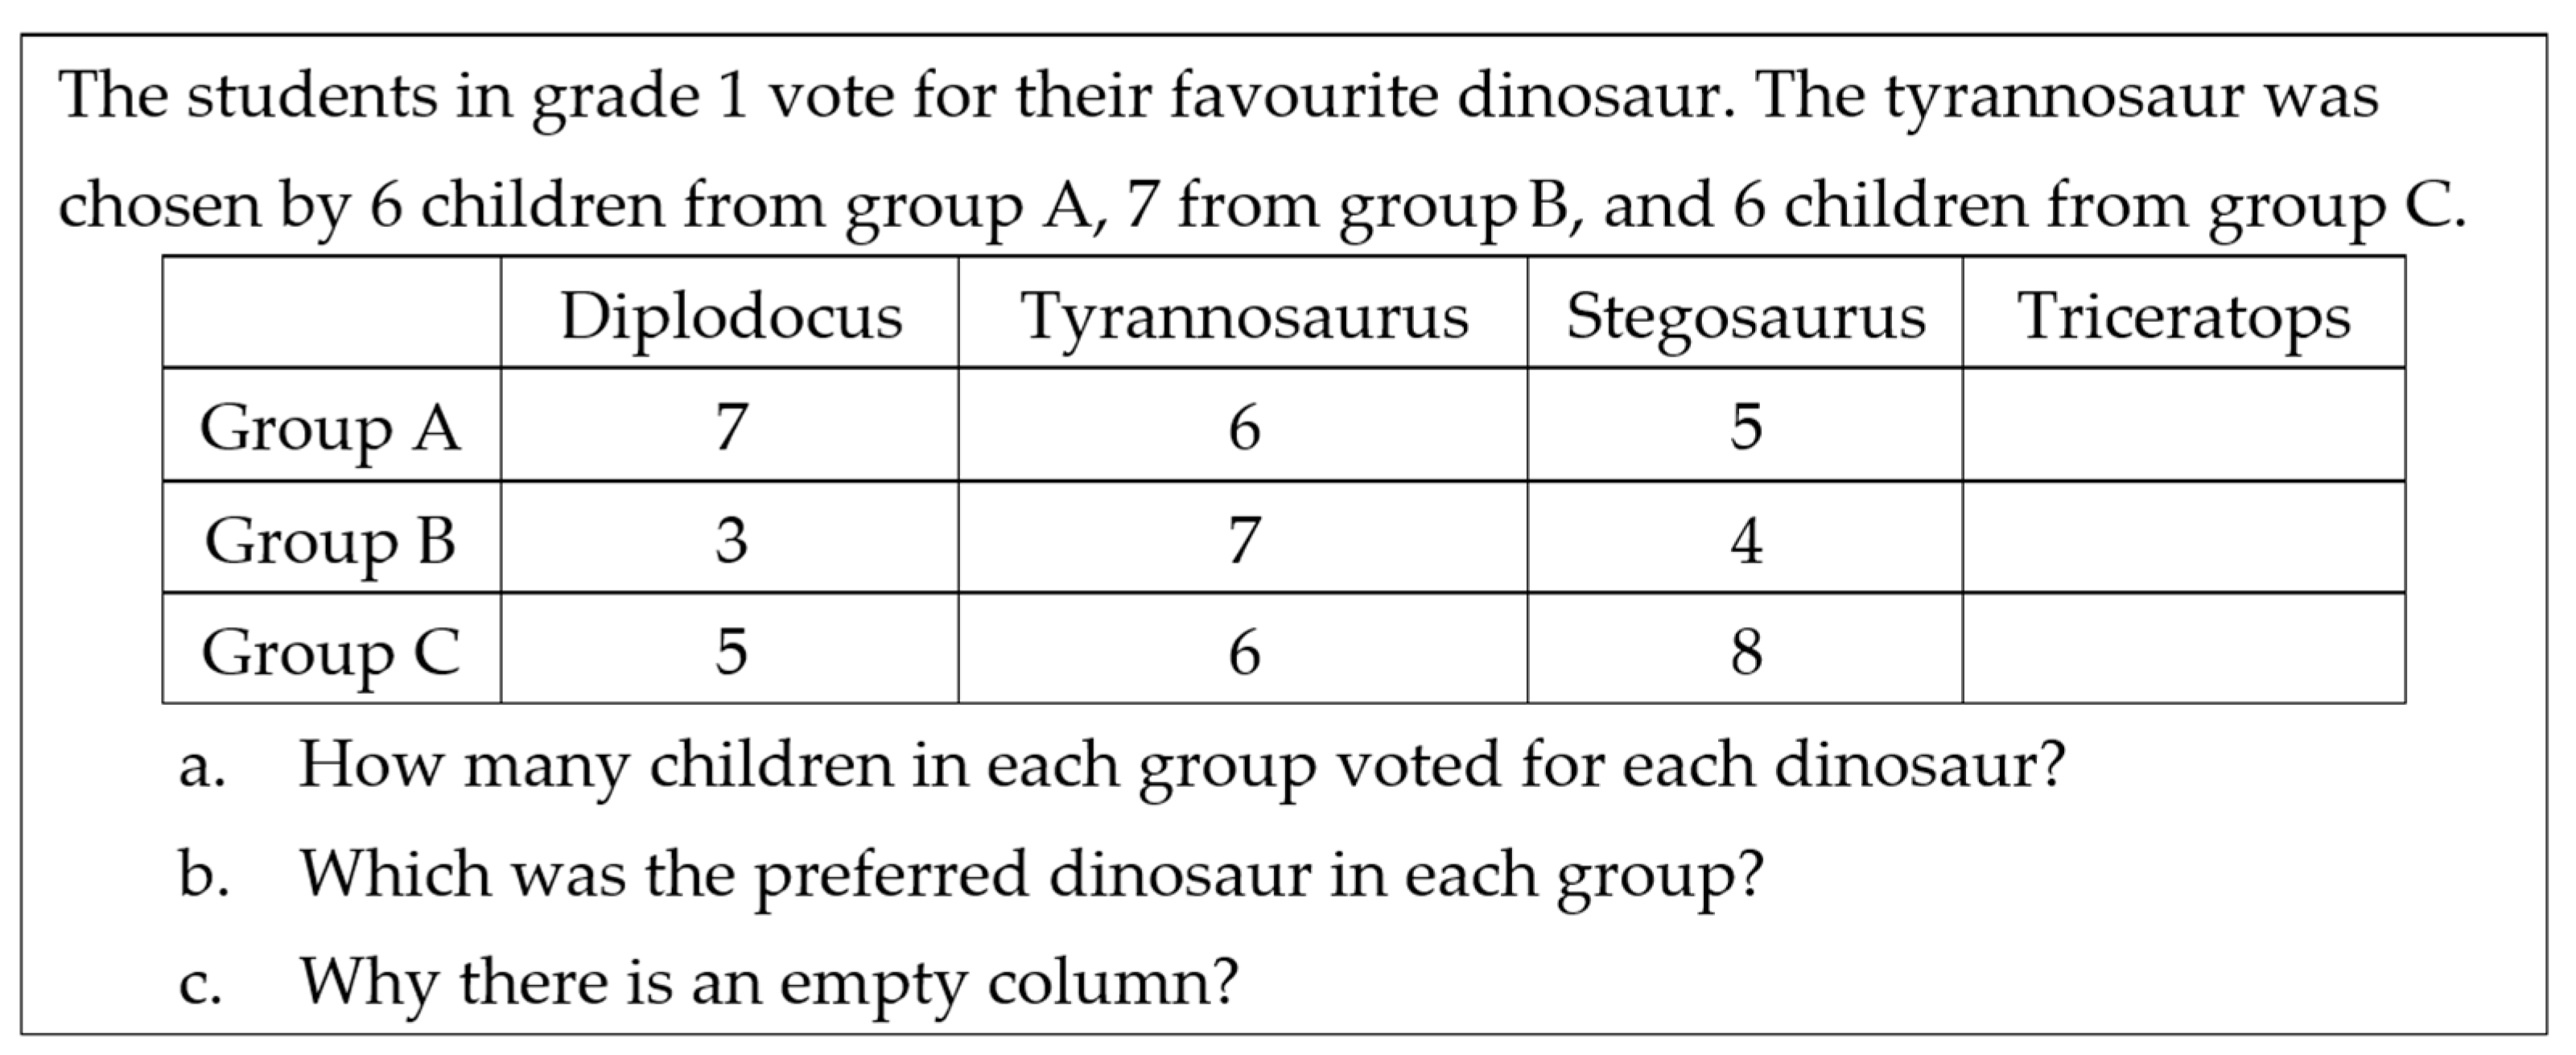
  • Data table. They are used to register the values of one or several variables for each element of the population or sample, particularly when these values are collected. Although the idea of a variable and its values are implicitly used, the concepts of frequency or frequency distribution are not needed to work with these tables. Pallauta and Arteaga [29] assigned a complexity level C2 to the data tables. The level C1 corresponds to the representation of isolated data [28]: for example, data from only one student. An example is given in Figure 1.
  • One-variable distribution table. These tables display the frequency distribution of a statistical variable, which may be categorical or quantitative. In these tables, the concepts of variable, frequency, and frequency distribution are implicit, and Pallauta and Arteaga [29] assigned to them a complexity level C3. Furthermore, in our work, we subdivide these types of tables into three types, which are described in Section 4.1.
  • Two-way tables. They represent the joint distribution of a two-dimensional statistical variable and can be classified at complexity level C4 [29]. New implicit mathematical objects appear, such as conditional, compound, and marginal frequencies or statistical association between the variables.

2.2. The Role of Context in Mathematics and Statistics

There is a growing interest in rich contexts in mathematics education because understanding and solving contextualised problems is part of scientific culture, that is, the set of knowledge and skills that citizens need in situations that require scientific knowledge [34]. Contexts attract students’ attention and connect what they learn at school with society, encouraging them to continue learning [35].
Researchers such as Wijaya et al. [36] suggest that context can affect the resolution of a problem, and in some cases, cause difficulties for the students: hence, the need to consider the context in the teaching and learning of mathematics. Additionally, the context of a mathematical problem may impact the cognitive processes that are to be brought into play and arouse the student’s motivation to solve the problems [19,36,37].
Within mathematics, the importance of context has grown due to the PISA tests [31] that are exerting a notable influence on students’ mathematics preparation in most countries. In these tests, rather than assessing students’ knowledge, their competence to solve contextualised problems in various types of everyday situations is analysed [38]. The contexts proposed in these tests are personal, occupational, social, and scientific, which are described in the results section.
In statistics, context plays an even more relevant role because, as Gattuso and Ottaviani [39] point out, statistical concepts are often presented to students without any links to the real-world context, using artificial examples. One of the main differences with other areas of mathematics is indeed the importance of the context, since the purpose of statistics is to answer real questions and not to try to fit them into pre-established theories [40].

2.3. Previous Research

In this section, we summarise studies that have analysed statistical tables in textbooks, considering different variables and educational levels.
One of the earliest precedents is provided by Díaz-Levicoy et al. [41], who analysed 58 tables included in four Chilean textbooks aimed at the 1st and 2nd grades of primary education (two books in each grade), considering the type of table, activity proposed to the students and context (in the PISA classification), among other variables. Their results indicated a majority of counting tables (74.1%) followed by one-variable distribution tables with absolute frequencies (19%), while data tables (5.2%) and two-way tables (3.4%) were scarce. The most common activity was computing from the table (41.4%), completing missing the information in a table (36.2%) and translating the table to a graph (27.6%). The most frequent contexts were personal (69%) and social (19%). In another analysis of three Chilean 3rd grade primary school textbooks [42], the most common activity was calculating, reading, and justifying (65.9%), which was followed by translating the table to a graph (42.9%), with the personal context being the most frequent (83.5%); the authors did not analyse the type of table.
García-García et al. [43] examined 12 Mexican primary school textbooks (1st to 6th grade) from two different publishers, analysing the table type and context, among other variables. Although the authors did not report the percentages obtained, they observed a high prevalence of frequency and data tables, while two-way tables were scarce. The activities more requested from the student were calculating and completing the table, with the most common context being personal.
An immediate precedent [44] is the analysis of 990 school tasks related to statistical tables presented in Chilean school textbooks from grades 5 to 8 (10 to 13 years of age), where the authors considered, among others, the aforementioned variables. The results showed a high percentage of one-variable distribution tables with ordinary frequencies (44.6%) followed by data tables (21.5%). The type of activity most requested from the student was to compute different measures of centre or probabilities (36.3%) and to read the information presented in the table (22.1%). In terms of contexts, the one that appeared most strongly was the personal context (41.7%), which was followed by the occupational context (16.8%); the authors added random experiments as a new context due to its significant presence (16.1%) in the activities proposed.
Our work complements this previous research by examining Spanish textbooks throughout the different grades of primary education, which were only considered by Pallauta et al. [30] for the last two years of primary education. Furthermore, only the work by García-García et al. [43] looked at the complete primary education cycle (grades 1 to 6) in Mexico. In what follows, the method and results of the study are presented, concluding with a discussion of the results and some implications for teaching.

3. Methods

3.1. Sample of Textbooks and Activities

In Spain, various textbooks publishers for primary education are officially authorised by some of the different Autonomous Communities in the country, such as Andalusia. Their books can be chosen by any school and consequently distributed free of cost to their students. In particular, the Council for Education and Sport in the Autonomous Community of Andalusia informs the textbooks selected in Andalusian schools for each subject, level, and educational centre [45]. Thus, to select the textbook series in this study, we considered recent textbooks from two of the most widely spread and traditional publishers (in terms of the number of schools who use them) in Spain, which are freely provided to the children with the aforementioned system in Andalusia. The sample was made of 12 Spanish textbooks aimed at primary school grades 1 to 6 (6 to 11-year-olds). The textbooks selected have been published in 2018 and 2019 by two editorials Anaya and SM (see Appendix A Table A1), and they were fully updated and conformed to the current curricular guidelines [9]. A total of twelve textbooks were analysed, two for each grade level (1 to 6).
In these textbooks, we reviewed all the tasks (activities) in which a statistical table was used (explicitly or implicitly), either as an object of study in itself or as a tool to answer other questions. For this purpose, the entire textbook was reviewed for grades 1 to 2, as the topic of statistics and probability is distributed throughout the textbook in these grades, while the statistics and probability unit is dealt with as a separate topic from the remaining contents in grades 3 to 6. Therefore, for grades 3 to 6, the complete units of statistics and probability were analysed. A total of 405 activities using statistical tables were analysed, 226 in SM and 179 in Anaya.

3.2. Analysis

We used the content analysis, which is considered as a family of methods created for making valid and reliable inferences from texts or other tools of communications [46,47]. Systematic stages were followed, where the first step was to identify the book section including contents of statistics and probability. The second step was to identify the paragraphs presenting situations in which the statistical table was used (explicitly or implicitly). The content of these paragraphs was then examined so that, in a cyclically and inductively manner, the variables of analysis were studied in order to draw up a list of categories. To ensure the reliability of the coding, continuous revisions of the texts were carried out by the authors, and discordant cases were discussed together until an agreement was reached. Finally, as a fourth and last step, summary tables of results were produced to facilitate the drawing of conclusions

3.3. Categories for the Different Variables

The following dependent variables were considered: type of statistical table, type of activity, and the context in which the statistical table is used. The independent variables were the school grade and publisher. In Section 3.3, we present for each of the dependent variables, firstly, the description of the categories used, including examples found in the textbooks that serve to clarify these categories, considering the gender equity in the examples selected.

3.3.1. Type of Tables and Data Represented

We used the classification of tables proposed by Lahanier-Reuter [27], within which we subdivided the category of frequency distribution table for one variable according to the types of frequencies represented: counting tables, frequency tables, and grouped data in intervals tables.
Data table. In these tables, each datum is represented isolated, forming a list, without combining all the data with similar values. According to Arteaga [28], they correspond to the semiotic complexity level C2 since the frequency associated with each category of the variable does not appear and, therefore, the concept of distribution does not emerge, while the concept of a variable does. The implicit mathematical objects are those of variable and value, as well as the type of variable (qualitative or quantitative), which depends on the table. Likewise, in these tables, the children work with different magnitudes and numerical sets. They correspond to what Estrella and Estrella [48] describe as simple data tables since they are arranged in rows or columns in which the values of each variable are represented individually for each element of the data set. These values are recorded numerically, textually, or symbolically. Figure 1 presents an example, aimed at the 6th grade of primary education, where the average temperatures in Celsius degrees (a quantitative variable that takes decimal values) reached along seven months (ordinal variable) are represented. The student is asked to calculate the mean and range of the data and to explain how he or she proceeded in the latter case.
One-variable distribution table. In this table, which is associated with a C3 level of semiotic complexity [28], the frequency distribution of a variable is represented so that each modality of the variable is linked to one or more types of frequency. Each frequency included in the table can be conceived as an application between the set of modalities of the variable and the numerical set of natural numbers (absolute frequency) or real numbers (relative or percentage frequency). If the variable is numerical, the numerical order is also used, since the frequency distribution appears ordered with respect to the modality of the variable. We distinguish three different types:
  • Counting tables. In some frequency tables, a column is added to facilitate the calculation of the absolute frequency, where generally, dashes or other marks are used to represent each value of the variable collected. In the early grades, this column facilitates the data organisation, since children still have immature thinking to perform this process by themselves [49]. They are characterised in that each occurrence of a certain modality or value of the variable is recorded using a symbol in an additional column and the specific variable category (row) (see example in Figure 2).
  • Frequency tables. In addition to or instead of the counting column, frequency tables usually have different columns in which the absolute frequency, relative frequency, or percentage of the variable distribution are represented. Figure 3 shows an example from a 6th grade textbook, which includes the counting column and the absolute and relative frequency for a qualitative variable. In the relative frequency column, we find the expression of relative frequencies in fractions and decimal numbers. In the last row, the totals and their calculation are explained.
  • Frequency tables of data grouped in intervals. In this type of table, the values of a numerical variable are grouped into class intervals, which implies dealing with intervals, and their extremes, as well as using approximate values in the calculation of summary statistics. Figure 4 shows an example used to explain the construction of the histogram and frequency polygon directed at grade 6.
  • Two-way table. These tables present the cross classification of two statistical variables and involve a C4 level of semiotic complexity [28]. Three types of frequencies can be calculated in these tables: joint (compound), marginal to the row or column, and conditional to the row or column. Therefore, three types of distributions such as joint, marginal, or conditional are also implicit.
In the example shown in Figure 5, proposed for grade 1, the preferred dinosaur type and class group are related, and children are asked to read some elements of the table, performing calculations and interpreting the null frequency. This question is difficult for the children, who usually would expect a frequency of 0 in the categories with missing data.

3.3.2. Activities Proposed to the Students

The activities that the texts propose to work with these tables were classified according to the categories described by Pallauta et al. [44] and are exemplified and analysed below.
A1. Reading a table. In this activity, the children are asked to obtain information represented (explicitly or implicitly) in a statistical table, which requires familiarity with its structure, identifying the variable displayed (which can be deduced from the table title and labels), and finally, correctly reading the specific values or frequencies requested in the task. This reading activity may require different reading levels, according to the classification by Friel et al. [53]. For example, question (a) in the two-way table reproduced in Figure 5 requires only a reading data level (the lower by Friel et al. [53]), as the children are only asked to read the data values in the table. However, question (b) requires the second reading between data levels in this classification because it requires making comparisons with the data in the table to perform the mode.
A2. Completing a table. Sometimes, children are given a table, with some empty cells to complete, and they are requested to finish the table as an exercise to reinforce their learning of the different steps required in its construction. These steps are: preparing the title, deciding the number of rows and columns, as well as its content and labels, and adequately filling the cells of the table. Generally, some frequencies (at least the absolute frequencies) have to be computed from a data table or a graph, such as in the example shown in Figure 6 directed to grade 3.
A3. Building a table. In this case, the student has to build the whole table, sometimes from data in the form of lists or provided in a short story or problem. This construction involves the identification of the modalities of the variable, the classification of the data, the counting and calculation of frequencies. Finally, the modalities of the variable and its frequencies should be organised in the table (e. g., Figure 7 presents an activity directed to grade 3).
A4. Computing with the data represented. This task consists of calculating some summary statistics of central tendency, spread, or position (e.g., the mean or the range) or computing probabilities. Other times, the table is used to describe how to perform these calculations and helps developing the students’ algorithmic abilities. The purpose of the table in the activity is to facilitate the computation of these statistics. An example is shown in Figure 1.
A5. Translating the table to a graph. Students learn at the same time to construct and read statistical tables and graphs and, for this reason, activities of translation from these two data representations are frequent in the books. In this category, we count the activities where the child should represent graphically the information displayed in a statistical table, which requires knowledge of the conventions of graph construction; sometimes, it also involves calculations such as the example suggested for grade 2 shown in Figure 8.
A6. Inventing a problem or table. In this type of task, the child should create a context for the information displayed in a statistical table by choosing a variable that makes sense and is consistent with the information represented (e.g., Figure 9, suggested for grade 3). We also include in this category those activities where children should create a table that conforms to given summary statistics, for example, the mean.
A7. Registering data. When the table is a tool used to record data that have been previously collected by the students or have been obtained by conducting random experiments (e.g., the example taken from a grade 1 book in Figure 10).
A8. Reasoning from the table. When the student is asked to provide some justifications from the table; for example, he or she should justify the most appropriate graph to represent the data displayed in the table, explain how changing the frequency of a category affects the mean, or should use the table to make a decision (e.g., question (b) in Figure 1 or question (d) in Figure 2, an activity intended for 3rd grade).

3.3.3. Data Contexts

We analysed the context in which the statistical tables are presented in the textbooks, using the categories proposed in PISA [31] described below, and to which we added “random experiment” as a new context, due to its use in the textbooks to reinforce different topics associated with probability.
  • Personal context. Problems classified in this group focus on the child or his/her family, as well as the peer group’s frequent activities. Examples include (but are not limited to) those involving the age or physical characteristics of students, personal preferences, sports, school tasks, or games. For example, the tables displayed in Figure 1, Figure 4, Figure 5, Figure 6, Figure 7, Figure 8 or Figure 10 were classified in personal contexts.
  • Occupational context. In this category, the context is focused on the world of work. Examples are shown in Figure 2 and Figure 9. We also found activities linked to production on a livestock farm, sales in a store, number of animals on a farm, number of excursions organized by a travel agency, and rooms booked in a hotel.
  • Societal context. Problems framed in situations developed in the local community, or a wider society, to which the learner has access through different media, or social networks. One example is presented in Figure 3; others include types of vehicles observed by the student, types of vehicles in a parking lot, visitors to a museum, the number of people practicing different sports in a ski resort, the preferred schedules of children and adults in a swimming pool, destinations of airline passengers, movie viewers of different film directors, electricity consumption, and abandoned pets picked up in an animal centre.
  • Scientific context. This context is linked to different applications of mathematics to the natural world, science, and technology. Common context, both in 5th and 6th grades in both editorials was meteorology. Another example used in 6th grade in Anaya was related to endangered species.
Random experiment. There were some situations posed in the context of random experiments (throwing coins, dice, pins, selecting numbered cards or coloured balls from an urn, etc.). An example is shown in Figure 11, where the table is used to work the frequentist meaning of probability.

4. Results

4.1. Type of Tables and Data Represented

In Table 1, we summarise the type of table presented in the textbooks by grade and can observe that the total number of activities is smaller in the two first grades and increases substantially from the third grade onwards. When comparing the type of tables, we see the predominance of one-variable distribution tables, especially frequency tables. Grouped data in intervals tables only appear in 4th and 6th grade in a very small proportion, and paradoxically, two-way tables are more common in the first grades, since they are used to help children classify some data by two attributes. Another explanation is that this type of table is also employed to provide data from which students learn to construct two-way bar graphs. That is a significant difference with the situation in México, because García-García et al. [43] showed that the relevance of two-way tables in grades 1st, 2nd, and 4th was scarce.
We also find a proportion of frequency tables similar to that of Díaz-Levicoy et al. [41] in the first two grades and a much higher presence in higher grades, in particular in 5th and 6th grades, where students are introduced to relative frequencies and use the tables as help in computing summary statistics.
As regards the difference in editorials (Table 2), SM includes more data tables, while Anaya presents more counting tables. The distribution in all the other categories is similar in both editorials.

4.2. Activities Proposed to the Students

The activities included in the textbooks are summarised in Table 3 and Table 4, where we notice a predominance of reading activities, especially in the first two grades, where this activity is almost exclusive. The results are different from those by Díaz-Levicoy et al. [41] in Chilean textbooks for 1st and 2nd grade, since in that research, the most common activity was computing from the table (41.4%), which is very scarce in the Spanish textbooks and does not appear until 5th grade. We also observe differences with Díaz-Levicoy et al. [41] in the frequency of activities for completing or building a table (36.2%) and translating the table to a graph (27.6%). Even when scarce, we value the activities of inventing a table, registering data, and reasoning, since they contribute to the education of children’s statistical reasoning.
The differences between editorials (Table 4) are small, with some more computation activities in Anaya, which does not include inventing activities, and it proposes fewer suggestions for collecting data; on the contrary, justification activities are more frequent in this editorial.

4.3. Data Contexts

The contexts of the activities are summarised in Table 5 and Table 6. From Table 5, we observe that the main context is the personal one, coinciding with Díaz-Levicoy et al. [42] in Chilean grade 3 texts, as well as García-García et al. [43] in Mexican primary school texts. No doubt, the authors’ textbooks follow the curricular [9] recommendations of providing children with situations that interest them and are understood by them. The high percentage of this context diminishes a little with the grade, so they include other contexts, the scientific examples being more abundant in 5th and 6th grade. Surprisingly, the random experiment context appears in 1st grade and then disappears until 5th grade. The frequency of the social context has been lower than that reported by Díaz Levicoy et al. [41] in Chilean textbooks of 1st and 2nd grade.
As regards the comparison of editorials (Table 6), the main difference is that Anaya presents more occupational contexts and fewer random experiment contexts. Anyway, similar probability ideas are included in both editorials, although SM proposes more activities to use the statistical tables to present probability.

5. Discussion and Conclusions

The analysis performed of the activities linked to statistical tables in Spanish primary school textbooks adds new information to existing research, since this is the first analysis of how statistical tables are considered in the whole primary education grades textbooks in Spain. Moreover, the list of activities analysed adds some new categories that have not been considered in previous research, such as inventing a problem or a table and reasoning from a table. These categories were not found in previous studies of statistical tables in primary school textbooks from other countries.
The study points to some differences in the way in which statistical tables are worked within Spain as compared to Mexico and with the first grades of primary education in Chile. Apart from the new activities described, the most frequent activity in the sample of textbooks analysed in our study was reading the table, while in [41], in Chilean textbooks for grades 1 and 2, predominance was given to computing from the table. There were also fewer activities of building and completing tables in the Spanish textbooks than in [41]. Moreover, more relevance was given to two-way tables in Spain in several grades, and we also found a small proportion of grouped data in intervals tables in 4th and 6th grades that were not mentioned in previous studies.
Concerning the PISA contexts [31], we highlight the high frequency of the personal context in agreement with previous studies [41,43], and as suggested in the curricular guidelines [9,10] in which the importance of providing close contexts for the student is highlighted. Furthermore, we also note the use of the random experiment context, in the study of probability, as the experiences of games of chance are part of the immediate environment and can allow the teacher to design teaching of statistics based on real data [56] that can be more meaningful for the student.
The results presented here may be of interest to the book producers as well as to the teachers, who can use the variables and categories analysed to organise their teaching plans. According to the epistemological reflection provided by [25], our descriptive and explanatory results contribute to developing the prescriptive and evaluative scientific knowledge for teaching, because effective actions are raised following the analysis performed of the activities linked to statistical tables in Spanish primary textbooks as part of a particular reality in the teaching and learning of mathematics, as is the written curriculum reflected in textbooks [20].
These variables and categories analysed may also be used in teacher training programs as suggested by Font and Godino [24], where the teachers’ educator could organise activities in which the prospective teachers analyse the type of table, activity, and context in given tasks or vice versa, and the prospective teachers are asked to propose tasks for the students with a combination of the above variables. This enables teacher trainers to prepare specialised programs focused on resources directly aimed at the learning of mathematics with an emphasis on effective teaching [24].
According to Godino et al. [25], the analysis of the meaning of the mathematical objects and the resources involved in the instructional processes is a powerful tool to establish a well-founded network of actions named didactic configuration, which identifies the types of interactions between mathematical knowledge, teacher and students involving three components (epistemic, instructional, and cognitive–affective). In particular, the epistemic configuration has proved useful to improve the didactic–mathematical knowledge and competencies of the mathematics teacher through the analysis of textbooks in the context of teacher training [24].
As highlighted in the introduction, today, it is ever more important to achieve the statistical literacy of all students so that they become critical consumers and active citizens [5,7,8]. A recent example is the number of statistical tables published in the context of uncertainty that society has faced due to the pandemic generated by COVID-19 and that any competent citizen needs to interpret in order to understand the related information and make good decisions [57]. Consequently, we suggest that the scientific community should provide some recommendations to orient the teaching and learning of statistical tables in particular and statistics in general at the primary school level.
Finally, we point to the need to continue this research, with the analysis of new variables that characterise the activity carried out with statistical tables, and with new editorials that serve to generalise the findings of this research.

Author Contributions

Conceptualization: M.M.G., J.D.P. and C.B.; data collection and analysis: M.M.G. and J.D.P.; validation: all authors; writing—original draft: all authors. All authors have read and agreed to the published version of the manuscript.

Funding

Research project PID2019-105601GB-I00/AEI/10.13039/501100011033 (Ministerio de Ciencia e Innovación) research group FQM-126 (Junta de Andalucía, Spain), and scholarship ANID Number: 72190280.

Institutional Review Board Statement

Not applicable.

Informed Consent Statement

Not applicable.

Data Availability Statement

Data are available from J. Pallauta upon request.

Conflicts of Interest

The authors declare no conflict of interest.

Appendix A

Table A1. Textbooks in the sample.
SM1Bernabeu, J., Garín, M., & Modrego, R. (2019). Matemáticas 1 primaria. Más Savia. SM.
SM2Bernabeu, J., Garín, M., Martín G., Herrero, N., Morales, F., Vidal J.M., & Pérez M.N. (2019). Matemáticas 2 primaria. Más Savia. SM.
SM3Bernabeu, J., Garín, M., de Casacuberta, A., Cusó, M., Pérez M.N., Morales, F., Vidal, J.M., & Valvanera, A. (2019). Matemáticas 3 primaria. Más Savia. SM.
SM4Bernabeu, J., Garín, M., Díaz, J.G., García, M., Pérez M.N., Morales, F., Vidal, J.M., & Bellido, A. (2019). Matemáticas 4 primaria. Más Savia. SM.
SM5Garín, M., Bernabeu, J., Bellido, A., Pérez, M.N., Morales, F., Vidal, J.M, Armas, Z., González, Y., Macías, C., Peña, M., & Navarro, A. (2019). Matemáticas 5 primaria. Más Savia. SM.
SM6Bernabeu, J., González, Y., Garín, M., Nieco M., Pérez, B., García, M., Pérez, M.N., Morales, F., Vidal, J.M., & Bellido, A. (2019). Matemáticas 6 primaria. Más Savia. SM.
A1Carvajal, A. I., & de la Rosa, L. I. (2019). Matemáticas 1. Pieza a Pieza. Anaya.
A2Carvajal, A. I., & de la Rosa, L. I. (2018). Matemáticas 2. Pieza a Pieza. Anaya.
A3Ferrero, L., Gómez, J. M., Martín, P., & Quevedo, V. J. (2019). Matemáticas 3. Pieza a Pieza. Anaya.
A4Carvajal, A. I., Ferrero, L., Gómez, J. M., Martín, P., & de la Rosa, L. I. (2018). Matemáticas 4. Pieza a Pieza. Anaya.
A5Ferrero, L., Gómez, J. M., Martín, P., & Quevedo, V. J. (2018). Matemáticas 5. Pieza a Pieza. Anaya.
A6Carvajal, A. I., Ferrero, L., Gómez, J. M., Martín, P., & de la Rosa, L. I. (2019). Matemáticas 6. Pieza a Pieza. Anaya.

References

  1. Estrella, S. El formato tabular: Una revisión de literatura. Actual. Investig. Educ. 2014, 14, 449–478. [Google Scholar]
  2. Estrella, S.; Mena-Lorca, A.; Olfos-Ayarza, R. Naturaleza del objeto matemático Tabla. MAGIS 2017, 10, 105–122. [Google Scholar] [CrossRef] [Green Version]
  3. Postigo, Y.; Pozo, J.I. Cuando una gráfica vale más que 1000 datos: La interpretación de gráficas por alumnos adolescentes. Infancia Aprendizaje 2000, 90, 89–110. [Google Scholar] [CrossRef] [Green Version]
  4. Gal, I. Adults’ statistical literacy: Meanings, components, responsibilities. Int. Stat. Rev. 2002, 70, 1–25. [Google Scholar] [CrossRef]
  5. Gal, I. Understanding statistical literacy: About knowledge of contexts and models. In Actas del Tercer Congreso Internacional Virtual de Educación Estadística; Contreras, J.M., Gea, M.M., López-Martín, M.M., Molina-Portillo, E., Eds.; University of Granada: Granada, Spain, 2019; Available online: www.ugr.es/local/fqm126/civeest.htm (accessed on 16 July 2022).
  6. Johannssen, A.; Chukhrova, N.; Schmal, F.; Stabenow, K. Statistical literacy—Misuse of statistics and its consequences. J. Stat. Data Sci. Educ. 2021, 29, 54–62. [Google Scholar] [CrossRef]
  7. Sharma, S. Definitions and models of statistical literacy: A literature review. Open Rev. Educ. Res. 2017, 4, 118–133. [Google Scholar] [CrossRef] [Green Version]
  8. Engel, J. Statistical literacy for active citizenship: A call for data science education. Stat. Educ. Res. J. 2017, 16, 44–49. [Google Scholar] [CrossRef]
  9. Ministerio de Educación, Cultura y Deporte (MECD). Real Decreto 126/2014, de 28 de Febrero, Por el Que Se Establece el Currículo Básico de la Educación Primaria; MECD: Madrid, Spain, 2014. [Google Scholar]
  10. Ministerio de Educación y Formación Profesional (MEFP). Real Decreto 157/2022, de 1 de Marzo, Por el Que Se Establecen la Ordenación y las Enseñanzas Mínimas de la Educación Primaria; MEFP: Madrid, Spain, 2022.
  11. Koschat, M.A. A case for simple tables. Am. Stat. 2005, 59, 31–40. [Google Scholar] [CrossRef]
  12. Gabucio, F.; Martí, E.; Enfedaque, J.; Gilabert, S.; Konstantinidou, A. Niveles de comprensión de las tablas en alumnos de primaria y secundaria. Cult. Educ. 2010, 22, 183–197. [Google Scholar] [CrossRef]
  13. Garcia-Mila, M.; Marti, E.; Gilabert, S.; Catells, M. Fifth through eight grade students’ difficulties in constructing bar graphs: Data organisation, data aggregation, and integration of a second variable. Math. Think. Learn. 2015, 16, 201–233. [Google Scholar] [CrossRef] [Green Version]
  14. Martí, E. Tables as cognitive tools in primary education. In Representational Systems and Practices as Learning Tools in Different Fields of Learning; Andersen, C., Scheuer, N., Pérez Echeverría, M.P., Teubal, E., Eds.; Sense: Rotterdam, The Netherlands, 2009; pp. 133–148. [Google Scholar] [CrossRef]
  15. Pallauta, J.D.; Arteaga, P.; Garzón-Guerrero, J.A. Secondary School Students’ Construction and Interpretation of Statistical Tables. Mathematics 2021, 9, 3197. [Google Scholar] [CrossRef]
  16. Sharma, S.V. High school students interpreting tables and graphs: Implications for research. Int. J. Sci. Math. Educ. 2006, 4, 241–268. [Google Scholar] [CrossRef]
  17. Alkhateeb, M. The language used in the 8th grade mathematics textbook. Eurasia J. Math. Sci. Technol. Educ. 2019, 15, 3–13. [Google Scholar] [CrossRef]
  18. Fan, L.; Zhu, Y.; Miao, Z. Textbook research in mathematics education: Development status and directions. ZDM 2013, 45, 633–646. [Google Scholar] [CrossRef]
  19. Weiland, T. The contextualized situations constructed for the use of statistics by school mathematics textbooks. Stat. Educ. Res. J. 2019, 18, 18–38. [Google Scholar] [CrossRef]
  20. Herbel-Eisenmann, B.A. From intended curriculum to written curriculum: Examining the voice of a mathematics textbook. J. Res. Math. Educ. 2007, 38, 344–369. [Google Scholar] [CrossRef]
  21. Glasnovic, D. Requirements in mathematics textbooks: A five-dimensional analysis of textbook exercises and examples. Int. J. Math. Educ. Sci. Technol. 2018, 49, 1003–1024. [Google Scholar] [CrossRef]
  22. Jones, D.L.; Jacobbe, T. An analysis of the statistical content in textbooks for prospective elementary teachers. J. Stat. Educ. 2014, 22, 1–17. [Google Scholar] [CrossRef] [Green Version]
  23. Haggarty, L.; Pepin, B. An investigation of mathematics textbooks and their use in English, French, and German classrooms: Who gets an opportunity to learn what? Br. Educ. Res. J. 2002, 28, 567–590. [Google Scholar] [CrossRef]
  24. Font, V.; Godino, J.D. La noción de configuración epistémica como herramienta de análisis de textos matemáticos: Su uso en la formación de profesores. Educ. Math. Pesqui. 2006, 8, 67–98. [Google Scholar]
  25. Godino, J.D.; Batanero, C.; Font, V. The onto-semiotic approach: Implications for the prescriptive character of didactics. Learn. Math. 2019, 39, 37–42. [Google Scholar]
  26. Díaz-Levicoy, D.; Morales, R.; Arteaga, P.; López-Martín, M.M. Conocimiento sobre tablas estadísticas por estudiantes chilenos de tercer año de Educación Primaria. Educ. Math. 2020, 32, 247–277. [Google Scholar] [CrossRef]
  27. Lahanier-Reuter, D. Différents types de tableaux dans l’enseignement des statistiques. Spirale-Rev. Rech. Educ. 2003, 32, 143–154. [Google Scholar] [CrossRef]
  28. Arteaga, P. Evaluación de Conocimientos Sobre Gráficos Estadísticos y Conocimientos Didácticos en Futuros Profesores. Ph.D. Thesis, University of Granada, Granada, Spain, 2011. [Google Scholar]
  29. Pallauta, J.D.; Arteaga, P. Niveles de complejidad semiótica en gráficos y tablas estadísticas. Números 2021, 106, 13–22. [Google Scholar]
  30. Pallauta, J.D.; Batanero, C.; Gea, M.M. Complejidad semiótica de las tablas estadísticas en textos escolares chilenos y españoles de educación primaria. Teia Revista Educação Matemática Tecnológica Iberoamericana 2021, 12, 1–22. [Google Scholar] [CrossRef]
  31. OECD. PISA 2018 Assessment and Analytical Framework: Science, Reading, Mathematics and Financial Literacy; OECD Publishing: Paris, France, 2019. [Google Scholar] [CrossRef]
  32. Bertin. Semiologie Graphique; Gauthier-Villars: Paris, France, 1967. [Google Scholar]
  33. Bernabeu, J.; González, Y.; Garín, M.; Nieco, M.; Pérez, B.; García, M.; Pérez, M.N.; Morales, F.; Vidal, J.M.; Bellido, A. Matemáticas 6 Primaria. Más Savia; SM: Madrid, Spain, 2019. [Google Scholar]
  34. Rosales, E.M.; Rodríguez, P.; Romero, M. Conocimiento, demanda cognitiva y contextos en la evaluación de la alfabetización científica en PISA. Eureka 2020, 17, 2302. [Google Scholar] [CrossRef]
  35. Sanmartí, N.; Márquez, C. Aprendizaje de las ciencias basado en proyectos: Del contexto a la acción. Ápice 2017, 1, 3–16. [Google Scholar]
  36. Wijaya, A.; van den Heuvel-Panhuizen, M.; Doorman, M.; Robitzsch, A. Difficulties in solving context-based PISA mathematics tasks: An analysis of students’ errors. Math. Enthus. 2014, 11, 555–584. [Google Scholar] [CrossRef]
  37. Brehmer, D.; Ryve, A.; Van Steenbrugge, H. Problem solving in Swedish mathematics textbooks for upper secondary school. Scand. J. Educ. Res. 2016, 60, 577–593. [Google Scholar] [CrossRef]
  38. She, H.C.; Stacey, K.; Schmidt, W.H. Science and mathematics literacy: PISA for better school education. Int. J. Sci. Math. Educ. 2018, 16, 1–5. [Google Scholar] [CrossRef] [Green Version]
  39. Gattuso, L.; Ottaviani, M.G. Complementing mathematical thinking and statistical thinking in school mathematics. In Teaching Statistics in School Mathematics—Challenges for Teaching and Teacher Education; Batanero, C., Burrill, G., Reading, C., Eds.; Springer: Dordrecht, The Netherland, 2011; pp. 121–132. [Google Scholar] [CrossRef]
  40. Scheaffer, R.L. Statistics and quantitative literacy. In Quantitative Literacy: Why Numeracy Matters for Schools and Colleges; Madison, B.L., Steen, L.A., Eds.; National Council on Education and the Disciplines: Princeton, NJ, USA, 2003; pp. 145–152. [Google Scholar]
  41. Díaz-Levicoy, D.; Morales, R.; López-Martín, M.M. Tablas estadísticas en libros de texto chilenos de 1º y 2º año de educación primaria. Revista Paranaense Educação Matemática 2015, 4, 10–39. [Google Scholar]
  42. Díaz-Levicoy, D.; Vásquez, C.; Molina-Portillo, E. Estudio exploratorio sobre tablas estadísticas en libros de texto de tercer año de educación primaria. Tangram 2018, 1, 18–39. [Google Scholar] [CrossRef]
  43. García-García, J.; Díaz-Levicoy, D.; Vidal, H.; Arredondo, E. Las tablas estadísticas en libros de texto de educación primaria en México. Paradigma 2019, 40, 153–175. [Google Scholar]
  44. Pallauta, J.D.; Gea, M.M.; Arteaga, P. Caracterización de las tareas propuestas sobre tablas estadísticas en libros de texto chilenos de educación básica. Paradigma 2021, 40, 32–60. [Google Scholar] [CrossRef]
  45. Council for Education and Sport in the Autonomous Community of Andalusia. Available online: https://www.juntadeandalucia.es/educacion/portals/web/becas-y-ayudas/gratuidad-de-libros (accessed on 19 September 2019).
  46. Drisko, J.W.; Maschi, T. Content Analysis; Oxford University Press: Oxford, UK, 2016. [Google Scholar]
  47. Neuendorf, K. The Content Analysis Guidebook; Sage: Thousand Oaks, CA, USA, 2016. [Google Scholar]
  48. Estrella, S.; Estrella, P. Representaciones de datos en estadística: De listas a tablas. Revista Chilena Educación Matemática 2020, 12, 21–34. [Google Scholar] [CrossRef]
  49. Nisbet, S.; Jones, G.; Thornton, C.; Langrall, C.; Mooney, E. Children’s representation and organisation of data. Math. Educ. Res. J. 2003, 15, 42–58. [Google Scholar] [CrossRef]
  50. Ferrero, L.; Gómez, J.M.; Martín, P.; Quevedo, V.J. Matemáticas 3. Pieza a Pieza; Anaya: Madrid, Spain, 2019. [Google Scholar]
  51. Carvajal, A.I.; Ferrero, L.; Gómez, J.M.; Martín, P.; de la Rosa, L.I. Matemáticas 6. Pieza a Pieza; Anaya: Madrid, Spain, 2019. [Google Scholar]
  52. Bernabeu, J.; Garín, M.; Modrego, R. Matemáticas 1 Primaria. Más Savia; SM: Madrid, Spain, 2019. [Google Scholar]
  53. Friel, S.; Curcio, F.; Bright, G. Making sense of graphs: Critical factors influencing comprehension and instructional implications. J. Res. Math. Educ. 2001, 32, 124–158. [Google Scholar] [CrossRef] [Green Version]
  54. Bernabeu, J.; Garín, M.; de Casacuberta, A.; Cusó, M.; Pérez, M.N.; Morales, F.; Vidal, J.M.; Valvanera, A. Matemáticas 3 Primaria. Más Savia; SM: Madrid, Spain, 2019. [Google Scholar]
  55. Carvajal, A.I.; de la Rosa, L.I. Matemáticas 2. Pieza a Pieza; Anaya: Madrid, Spain, 2018. [Google Scholar]
  56. Alsina, Á.; Annexa, E. Estadística en contexto: Desarrollando un enfoque escolar común para promover la alfabetización. Tangram 2021, 4, 71–98. [Google Scholar] [CrossRef]
  57. Rodríguez-Muñiz, L.J.; Muñiz-Rodríguez, L.; Vásquez, C.; Alsina, Á. ¿Cómo promover la alfabetización estadística y de datos en contexto? Estrategias y recursos a partir de la COVID-19 para Educación Secundaria. Números 2020, 104, 217–238. [Google Scholar]
Figure 1. Example of data table (adapted from SM6 [33] (p. 147)).
Mathematics 10 02809 g001
Figure 2. Example of counting tables (adapted from A3 [50] (p. 61)).
Mathematics 10 02809 g002
Figure 3. Example of frequency tables (adapted from SM6 [33] (p. 142)).
Mathematics 10 02809 g003
Figure 4. Example of the grouped data table (adapted from A6 [51] (p. 209)).
Mathematics 10 02809 g004
Figure 5. Example of the two-way table (adapted from SM1 [52] (p. 167)).
Mathematics 10 02809 g005
Figure 6. Completing and reading a table (adapted from SM3 [54] (p. 101)).
Mathematics 10 02809 g006
Figure 7. Building a table (adapted from SM3 [54] (p. 101)).
Mathematics 10 02809 g007
Figure 8. Translating a table (adapted from A2 [55] (p. 189)).
Mathematics 10 02809 g008
Figure 9. Inventing questions for a table (adapted from SM3 [54] (p. 87)).
Mathematics 10 02809 g009
Figure 10. Registering data (adapted from SM1 [52] (p. 81)).
Mathematics 10 02809 g010
Figure 11. Random experiment context (adapted from A6 [51] (p. 213)).
Mathematics 10 02809 g011
Table 1. Percentage of type of table in the different grades.
Type of TableGradeTotal
n = 405
1
n = 35
2
n = 20
3
n = 86
4
n = 80
5
n = 103
6
n = 81
Data table 34.35.024.48.817.518.518.3
One variable distributionCounting 10.024.420.0 3.710.4
Frequency14.320.045.338.882.576.555.8
Grouped data 3.8 1.21.0
Two-way table 51.465.05.828.8 14.6
Table 2. Percentage of type of table in each editorial.
Type of TableEditorialTotal
n = 405
Anaya
n = 179
SM
n = 226
Data table 12.323.018.3
One variable distributionCounting17.94.410.4
Frequency58.154.055.8
Grouped data0.61.31.0
Two-way table 11.217.314.6
Table 3. Percentage of activities in the different grades.
Activity TypeGradeTotal
n = 405
1
n = 35
2
n = 20
3
n = 86
4
n = 80
5
n = 103
6
n = 81
A1. Reading68.660.053.555.044.729.648.4
A2. Completing8.65.09.312.54.97.48.1
A3. Building a table2.910.014.011.314.612.312.1
A4. Calculating 10.721.06.9
A5. Translating to a graph5.720.011.611.315.516.013.3
A6. Inventing 3.5 0.7
A7. Registering data5.75.02.35.05.82.54.2
A8. Reasoning8.6 5.85.03.911.16.2
Table 4. Percentages of activities in each editorial.
Activity TypeEditorialTotal
n = 405
Anaya
n = 179
SM
n = 226
A1. Reading50.346.948.4
A2. Completing5.610.28.1
A3. Building a table13.411.112.1
A4. Calculating9.54.96.9
A5. Translating to a graph12.314.213.3
A6. Inventing 1.30.7
A7. Registering data1.76.24.2
A8. Reasoning7.35.36.2
Table 5. Percentages of contexts in the different grades.
Context TypeGradeTotal
n = 405
1
n = 35
2
n = 20
3
n = 86
4
n = 80
5
n = 103
6
n = 81
Personal85.795.062.883.865.064.271.4
Social 5.023.311.31.93.78.6
Occupational 14.05.05.89.97.4
Scientific 10.712.35.2
Random experiment14.3 16.59.97.4
Table 6. Percentages of contexts in each editorial.
Context TypeEditorialTotal
n = 405
Anaya
n = 179
SM
n = 226
Personal70.971.771.4
Social7.39.78.6
Occupational14.51.87.4
Scientific3.96.25.2
Random experiment3.410.67.4
Publisher’s Note: MDPI stays neutral with regard to jurisdictional claims in published maps and institutional affiliations.

