Article

Validation of a New Telenursing Questionnaire: Testing the Test

by
Julio Emilio Marco-Franco
1,2,
Margarida Reis-Santos
3,
Isabel Barrachina-Martínez
2,*,
Silvia González-de-Julián
2 and
Ramón Camaño-Puig
1
1
Faculty of Nursing and Podiatry, Valencia University, 46010 Valencia, Spain
2
Research Centre for Economics Engineering, Universitat Politècnica de València, 46022 Valencia, Spain
3
Center for Health Technology and Services Research, Nursing School of Porto, Abel Salazar Biomedical Sciences Institute, University of Porto, 4200-072 Porto, Portugal
*
Author to whom correspondence should be addressed.
Mathematics 2022, 10(14), 2463; https://doi.org/10.3390/math10142463
Submission received: 24 May 2022 / Revised: 23 June 2022 / Accepted: 11 July 2022 / Published: 15 July 2022
(This article belongs to the Special Issue Mathematical Prediction Models Applied to Health Management)

Abstract

:
Background: Existing surveys on telenursing refer to specific areas of nursing after the implementation of a programme, but telenursing in general has not been fully evaluated from a prospective approach. Aim: Design and statistical validation of a telenursing questionnaire. Methods: A new questionnaire was designed with 18 paired (to avoid leading) questions (Likert-5) plus three dichotomous questions (randomly ordered, inspired by existing validated tests) to analyse the dimensions of: acceptance, usefulness and appropriateness of telenursing from the nursing point of view (7 min test). The questionnaire was validated by classical tests and item response tests (Rasch) using six computer-generated databases with different response profiles (tendency to be positioned against, neutral and positioned in favour) with two degrees of agreement between each pair of responses for each option. Results: Classical testing: Cronbach’s alphas (from 0.8 to 0.95), Kaiser–Meyer–Olkin (KMO) (0.93 to 0.95) and a significant p < 0.0001 for Bartlett’s test of sphericity were obtained. Rasch analysis: Reliability coefficients (0.94). Warm’s mean weighted likelihood estimates (0.94). Extreme infit-t and outfit-t values (+1.61 to −1.98). Conclusions: Both the classical test and the Rasch approaches confirm the usefulness of the new test for assessing nurses’ positioning in relation to telenursing.
MSC:
94A50; theory of questionnaires; 62P10 applications of statistics to biology and medical sciences

1. Introduction

Internet of Things (IoT) technology is a growing innovation in everyday life [1], but in nursing healthcare, it is still in an emerging and early developmental phase [2]. Overall, the development of information and communication technologies (ICT) in nursing science—and in particular in telenursing—is an urgent need, the prominent reasons for which include the shortage of nursing staff, which is expected to be half (13 million) of the current estimated global workforce within a decade [3].
Telenursing can make a significant contribution to increasing retention of qualified nurses who, for various reasons, are unable to undertake full face-to-face activity, but who would be willing to work during certain agreed periods and hours on a flexible basis, especially in the case of pregnant or aged nurses [4,5,6].
Telenursing enables improved access to rural or remote areas, savings in travel time, cost containment and better standardisation through the electronic nursing summary and allows the incorporation of aids through digitised decision trees that allow better personalisation of care, better monitoring and subsequent quality analysis [7,8]. Remote technology makes it possible to increase the possibilities of care for the general population to systematise health education recommendations and the early detection of situations requiring urgent care or advice on self-care [8,9,10].
Increasing computer processing capabilities and the ability of machines to learn from data (artificial intelligence) allow a continuous effort to find increasingly better solutions to complex problems both in basic research and in management [11,12,13,14].
Proper planning requires input from staff, and the case of telenursing is no exception [15]. It is necessary to provide a general and prospective overview in contrast to published works that focus on partial aspects (telephonic care) or on specific nursing specialities [8,16]. However, to date and to the best of our knowledge, there has not been a comprehensive assessment in prospective terms, i.e., nurses who are not yet working in telenursing, nor is there a validated questionnaire in this regard. The extension of the survey to both current and future users of telenursing with a focus on proper remote holistic nursing care delivery, leaving aside the use of ICT in teaching or nursing management, is a novel approach that will hopefully allow for better future planning.
The design and validation of a specific questionnaire for telenursing is presented here as a new instrument for future practical use. The variants considered cover all response possibilities in a real situation and even meaningless random responses to question pairs can be detected by summation of differences between pairs.

2. Materials and Methods

The progress of the questionnaire design was carried out in five phases: (1) review of the literature; (2) construct; (3) development of domains; (4) development of items (questions); (5) testing and validation [17,18].
The questions were inspired by the most commonly used questionnaires in the literature for this purpose: the System Usability Scale (SUS) [19], the Technology Acceptance Models (TAM, TAM3) [20,21] and the Telenursing Interaction and Satisfaction Questionnaire (TISQ) [22]. Each of the five authors selected questions independently, and these were reformulated according to the complexity of the text and the Flesh–Kincaid level of comprehension for text complexity [23,24].
The final number of items was selected as a compromise between including paired questions to prevent leading questions and including at least three paired questions for each dimension [25,26,27]. A final selection for these 18 questions was made by each author scoring the best questions from the set of 49 pre-selected questions and with three rounds of scoring the questions until complete agreement was achieved.
The domains tested included:
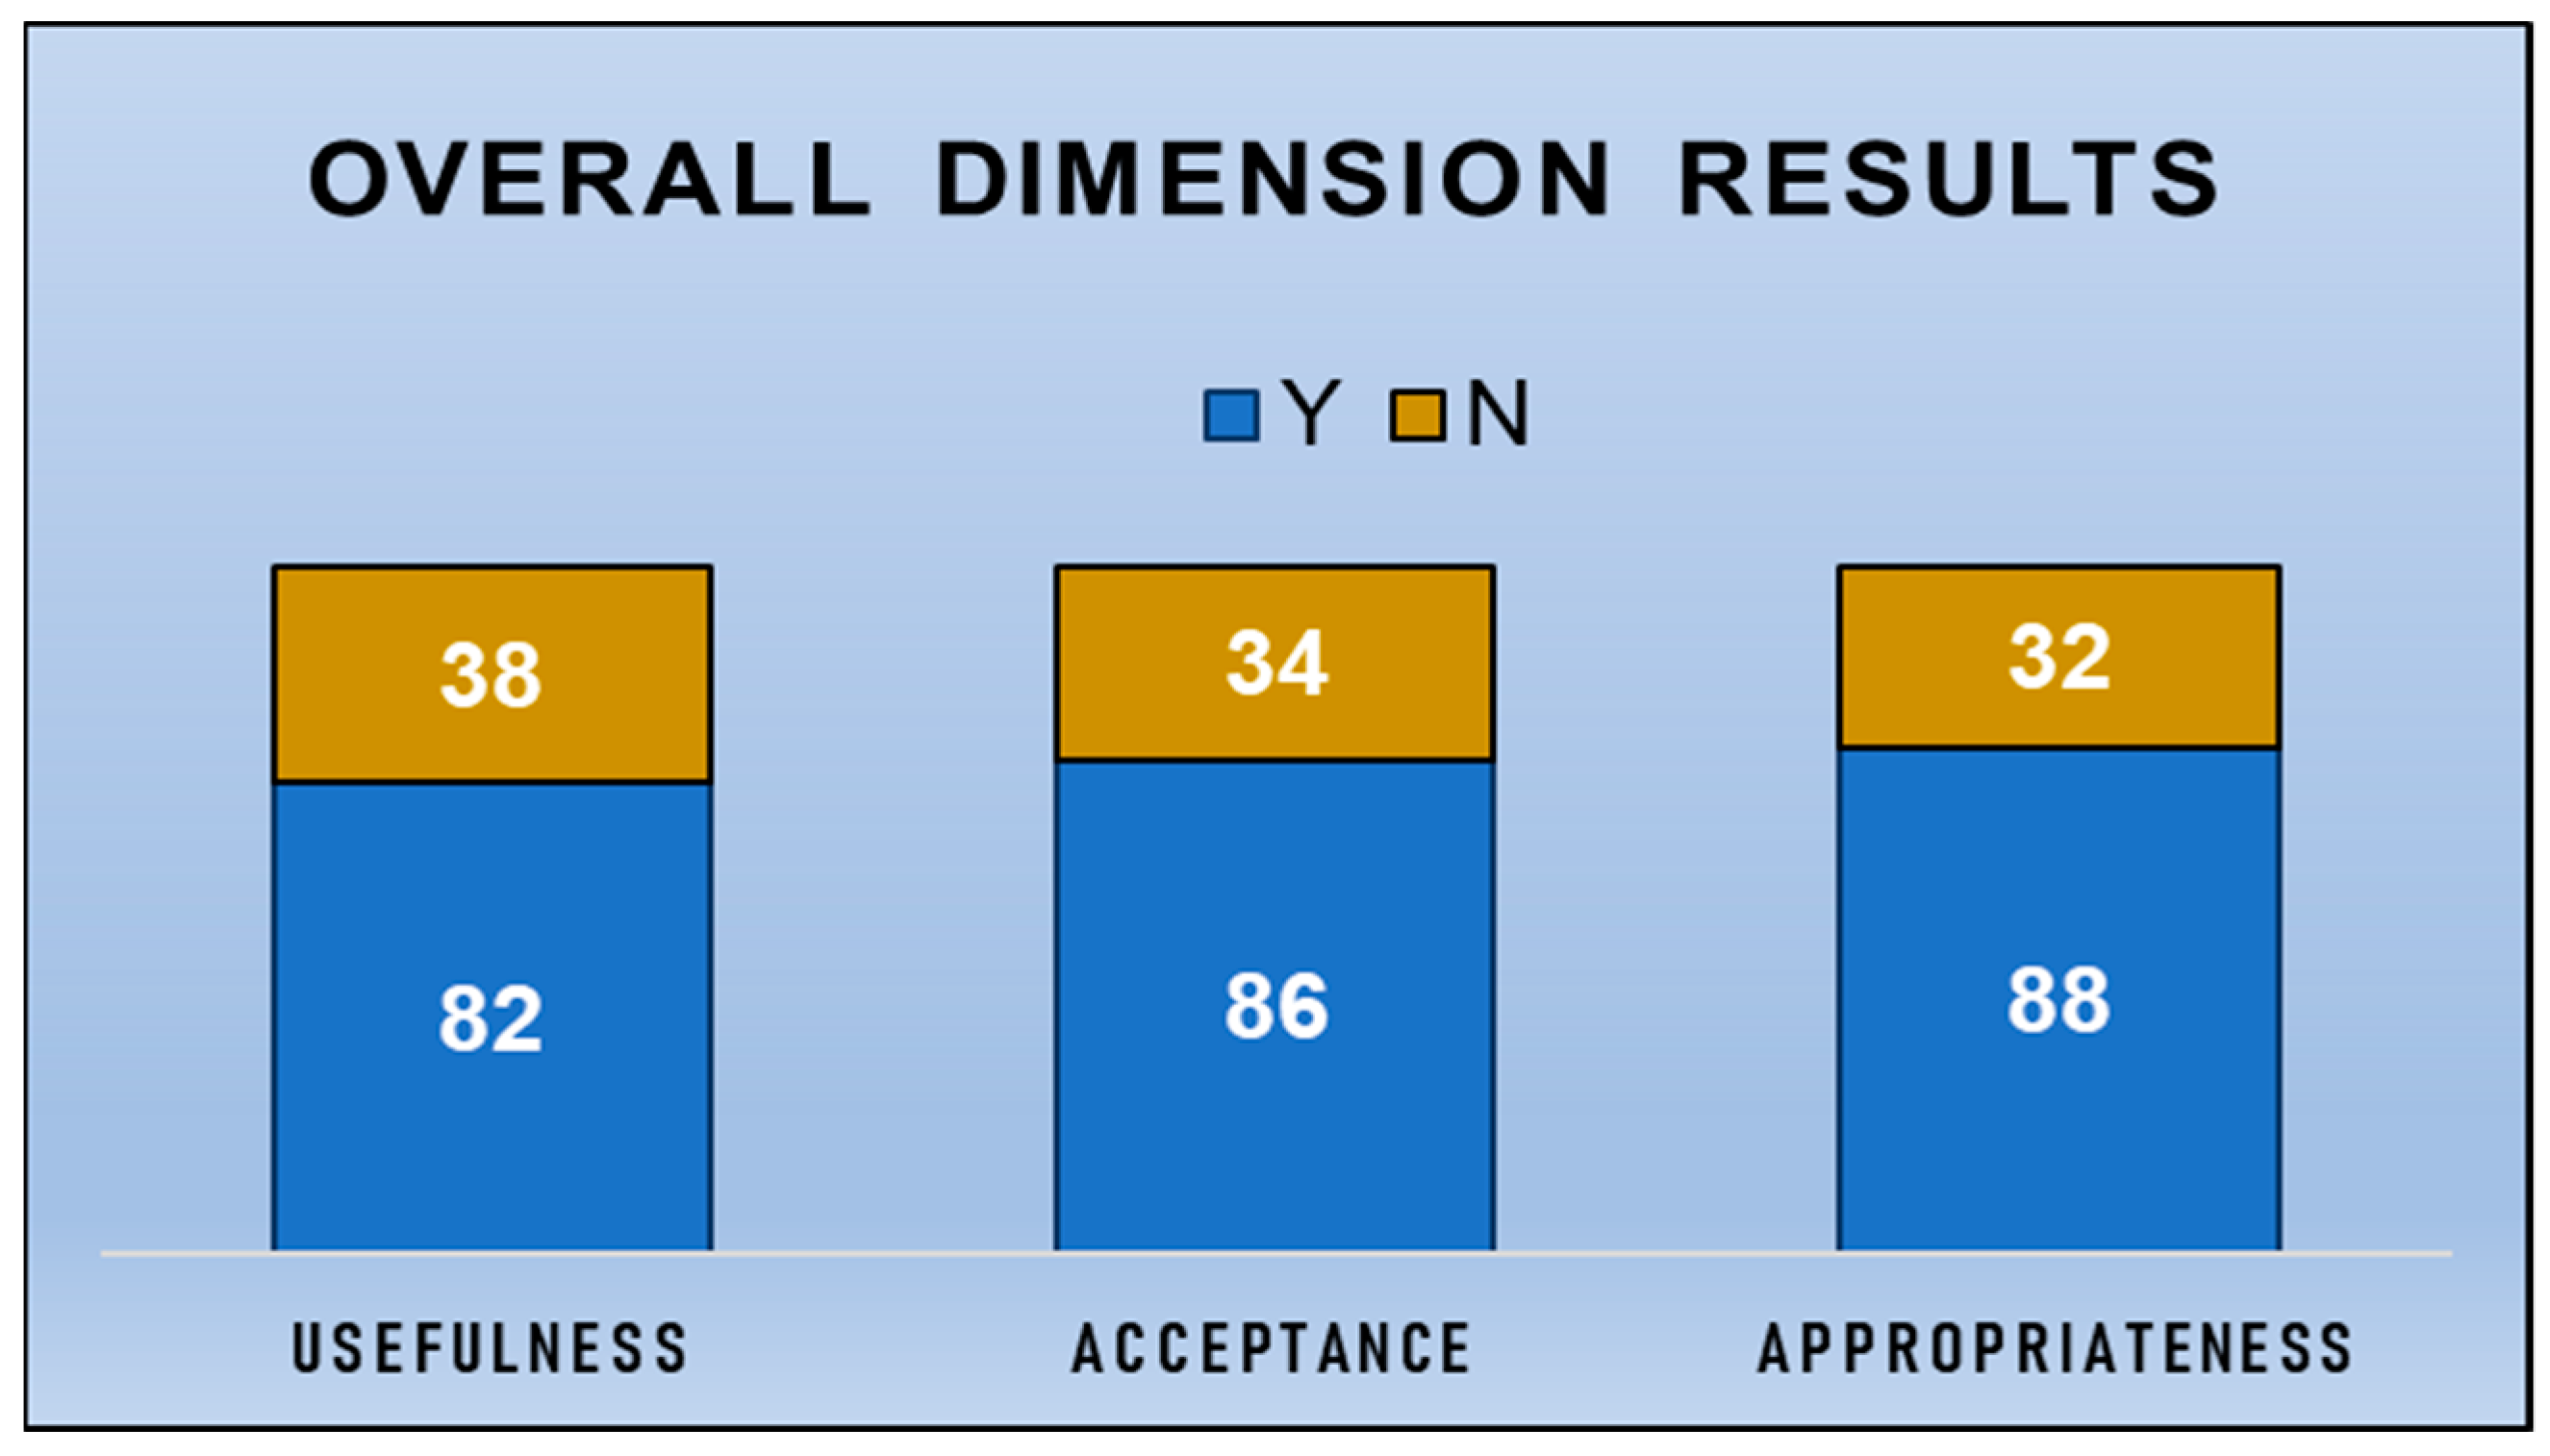
  • Perceived usefulness
  • Prospective acceptance
  • Appropriateness for nursing tasks
Each domain also included a global yes/no question.
The length of the questionnaire—and consequently, the estimated time to complete it—was carefully selected following the recommended principle of “the shorter the better” [28,29,30]. It is recommended that there be no fewer than three questions for each item [31], representing six questions (three pairs) per dimension and a total of 18 polytomous questions. In addition, there is one dichotomous question for each dimension, resulting in 21 questions to be completed in an estimated time of 7 min.
The structured questionnaire (Supplementary Materials) included three dichotomous questions and 18 polytomous questions with answers on a 5-point Likert scale.
To reproduce all possible variety of responses, covering all real possible answers in the different scenarios (in favour, against, consistency, inconsistency), six different databases were generated by a computer, with 120 fictitious respondents in each case. Each database corresponds to a different profile. These were designed with three levels of skewness, representing a majority (2/3) of answers against telenursing, an equal number of answers in favour and against and a third option with a majority in favour of telenursing (2/3). The design included in each case two variants: good-paired responses (pairwise difference range [−1 to +1]) and poor-paired responses (pairwise difference [−2 to +2]) (Table 1). The dichotomous variables were generated with the formula:
IF(SUM(x:y) ≥ 5;1;0)
where x:y represents the sum of the Likert values for each dimension.
Leading questions were ruled out by using paired (one positive and one negative) randomly disordered questions. Statistical processing requires reversing the score of the negative answers and reordering them, as all questions must grow in the same direction (Table 2).
Calculations were performed with IBM-SPSS statistics package V26 for Classical Test Theory (CTT).
Regarding the item response theory (IRT), a Rasch analysis was performed with R (basic packages: MASS, eRm, sirt, TAM), obtaining the inlier-sensitive or information-weighted fit (infit-t), i.e., standardized as a z-score, standardized outlier-sensitive fit (outfit-t), betas, level of difficulty, level of discrimination, reliability ratio, Warm’s mean weighted likelihood estimates (WLE), item characteristic curves (ICC) and item information curves (IIC).
Internal consistency of the three dimensions can be analysed using Cronbach’s alpha
α = k k 1 [ 1 Σ α k 2 α T o t a l 2 ] ,
where k is the number of items, Σ α k 2 is the variance of the item and α T o t a l 2 is the total variance.

3. Results

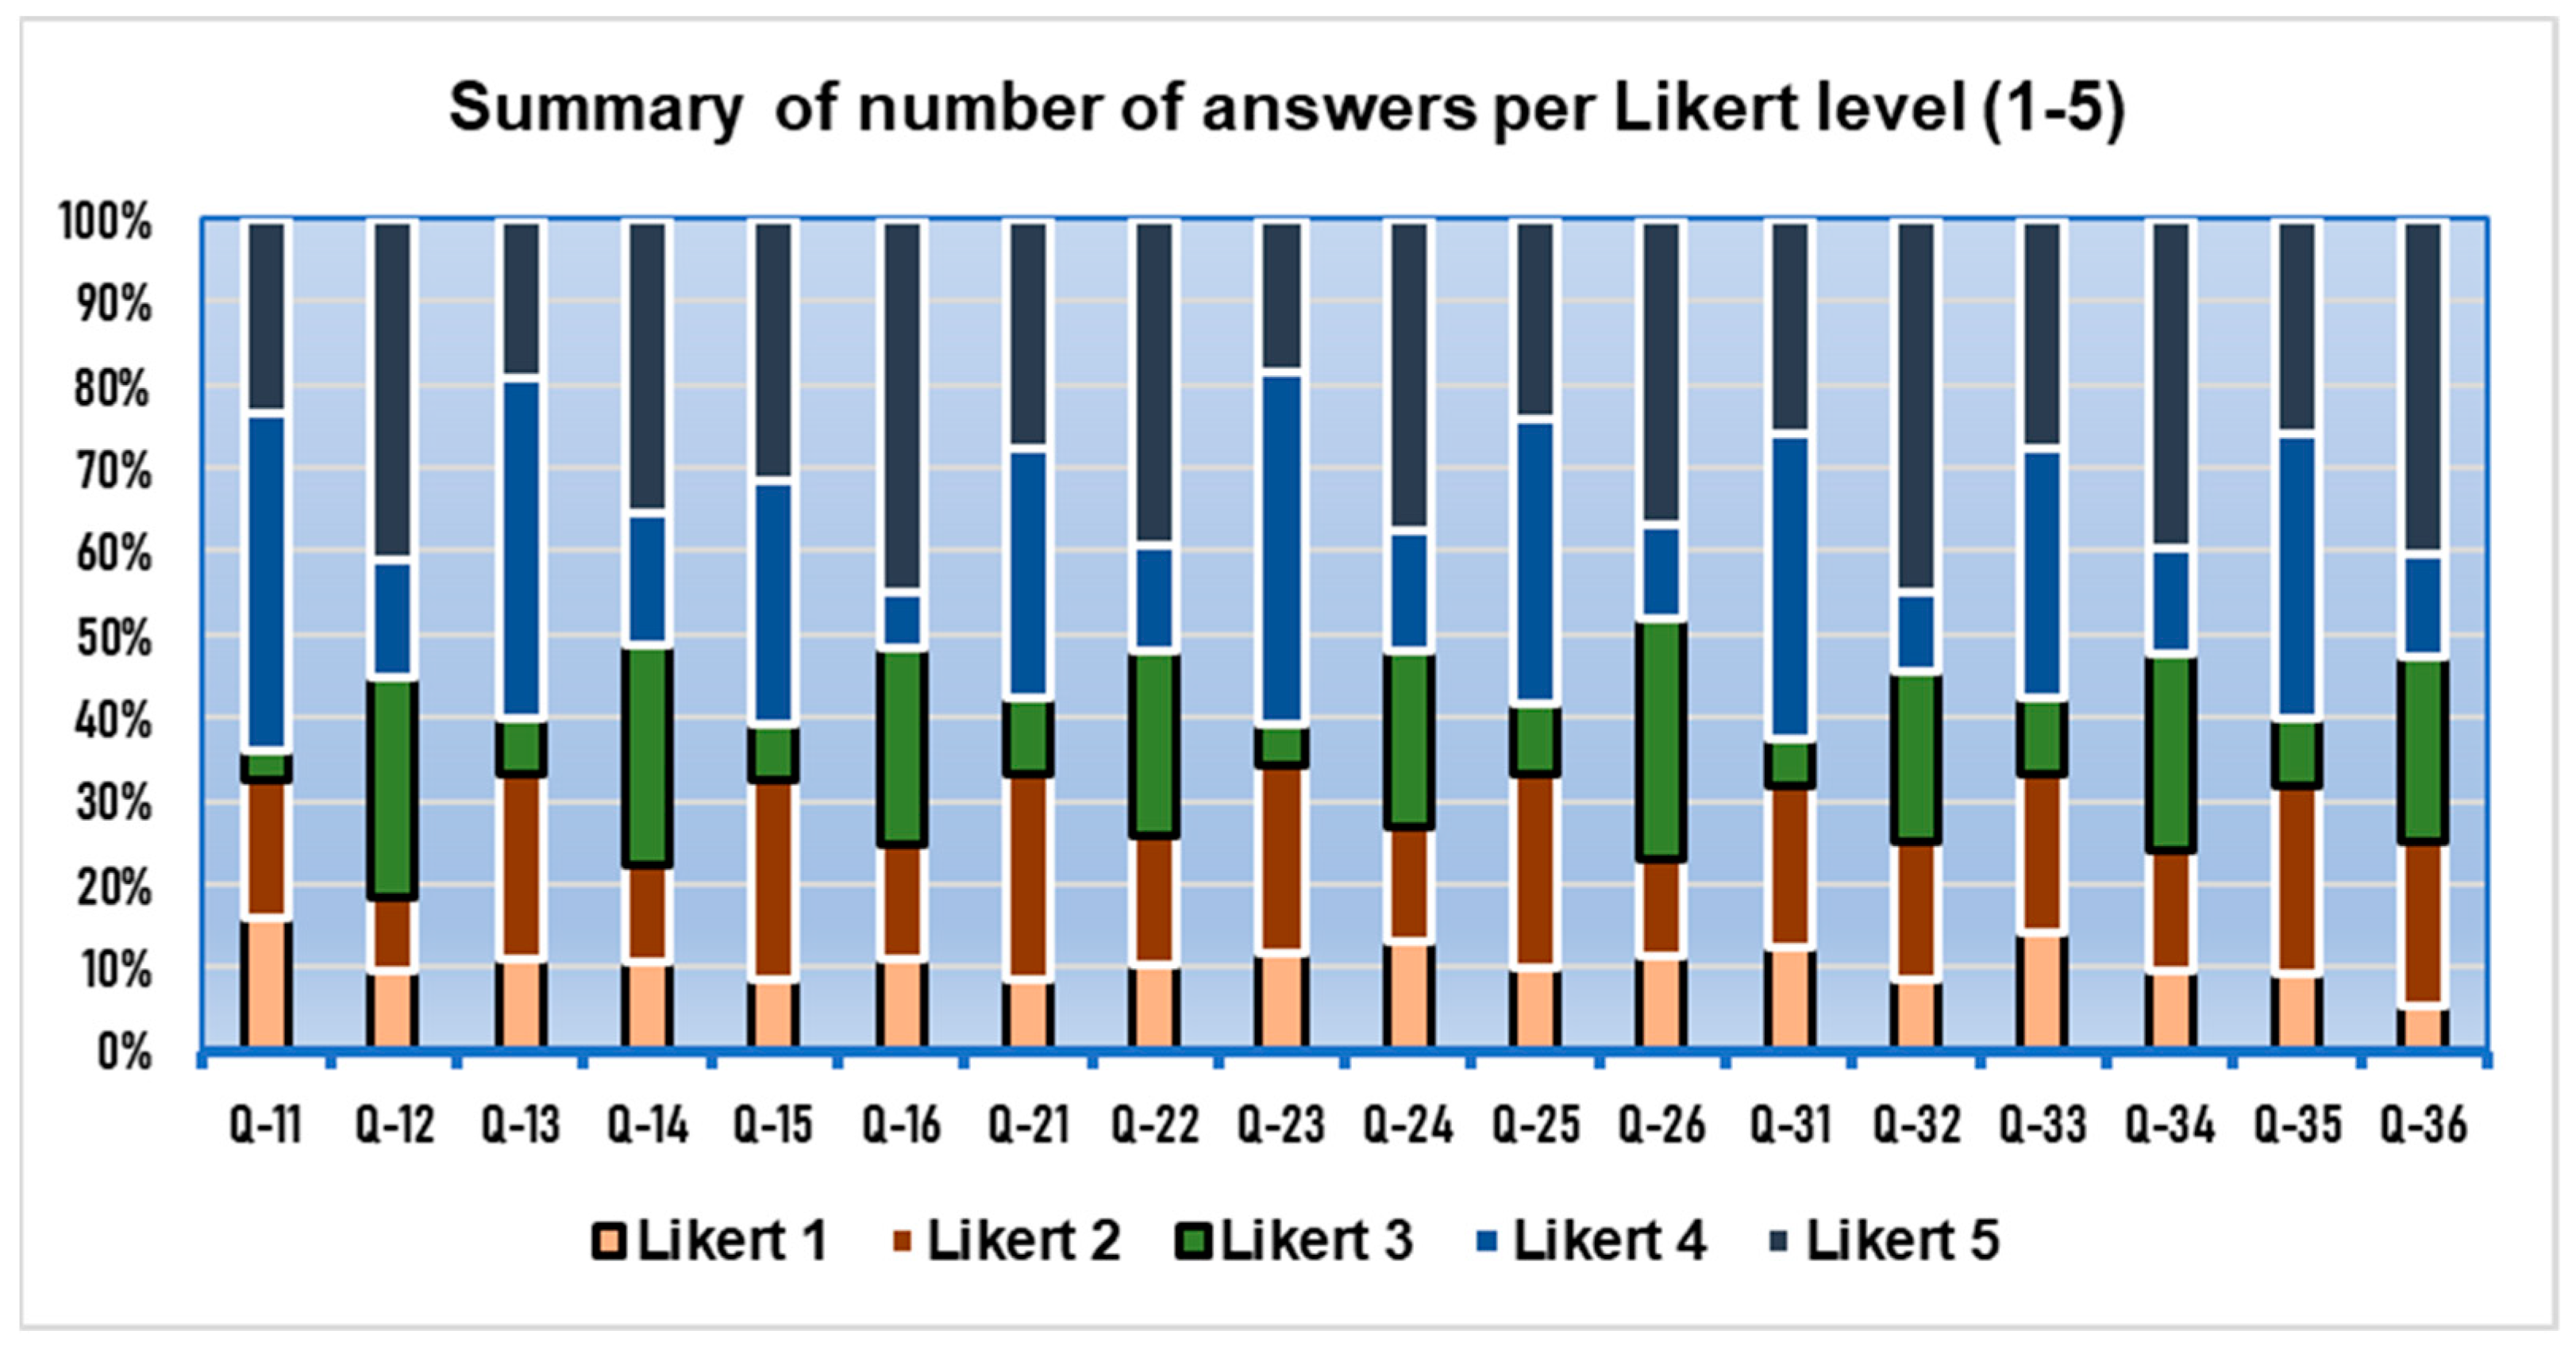
3.1. Descriptive Statistic Results

The basic results in terms of Likert answers are presented in Figure 1.
As for dichotomous responses, for the same database, Figure 2 shows an acceptability between 68.3% in usefulness and 73.3% in appropriateness.
A general statistical descriptive summary allows the intentionally different skewedness of the databases and other basic information to be seen (Table 3).
Note that polytomous ordinal variables (1 to 5) are treated as numerical. Results are only for comparative purposes, but no statistics may be computed due to this restriction [32].

3.2. CTT Statistics Results

Cronbach’s alpha uses the covariances between the items, whereas the standardised item format is based on the correlations between the items; in this case, this is already assumed as present. Therefore, the approach here is not to assume that the items have equal variances, as in practice, this is not often the case. Table 4 summarises the non-standardised Cronbach’s alpha of the polytomous variables for each database (based on covariances analyses) for each dimension. The 95% confidence intervals (CI) for Cronbach’s alpha have been computed using the interclass correlation coefficients which result identical to Cronbach’s alpha (when calculated with the two-way mixed consistency or two-way random consistency models). Hence, this is a CI for alpha as well (Table 4).
The principal component analysis was run to evaluate the strength of the partial correlation, or how the factors (items) explain each other and to test the adequacy of factor analysis. Kaiser–Meyer–Olkin (KMO) values indicate the sampling adequacy for factor analysis and Bartlett’s test of sphericity (method of covariances and varimax rotation) returned highly significant p-values (0.000), implying that the correlation matrix is indeed not an identity matrix (rejection of the null hypothesis) (Table 5).

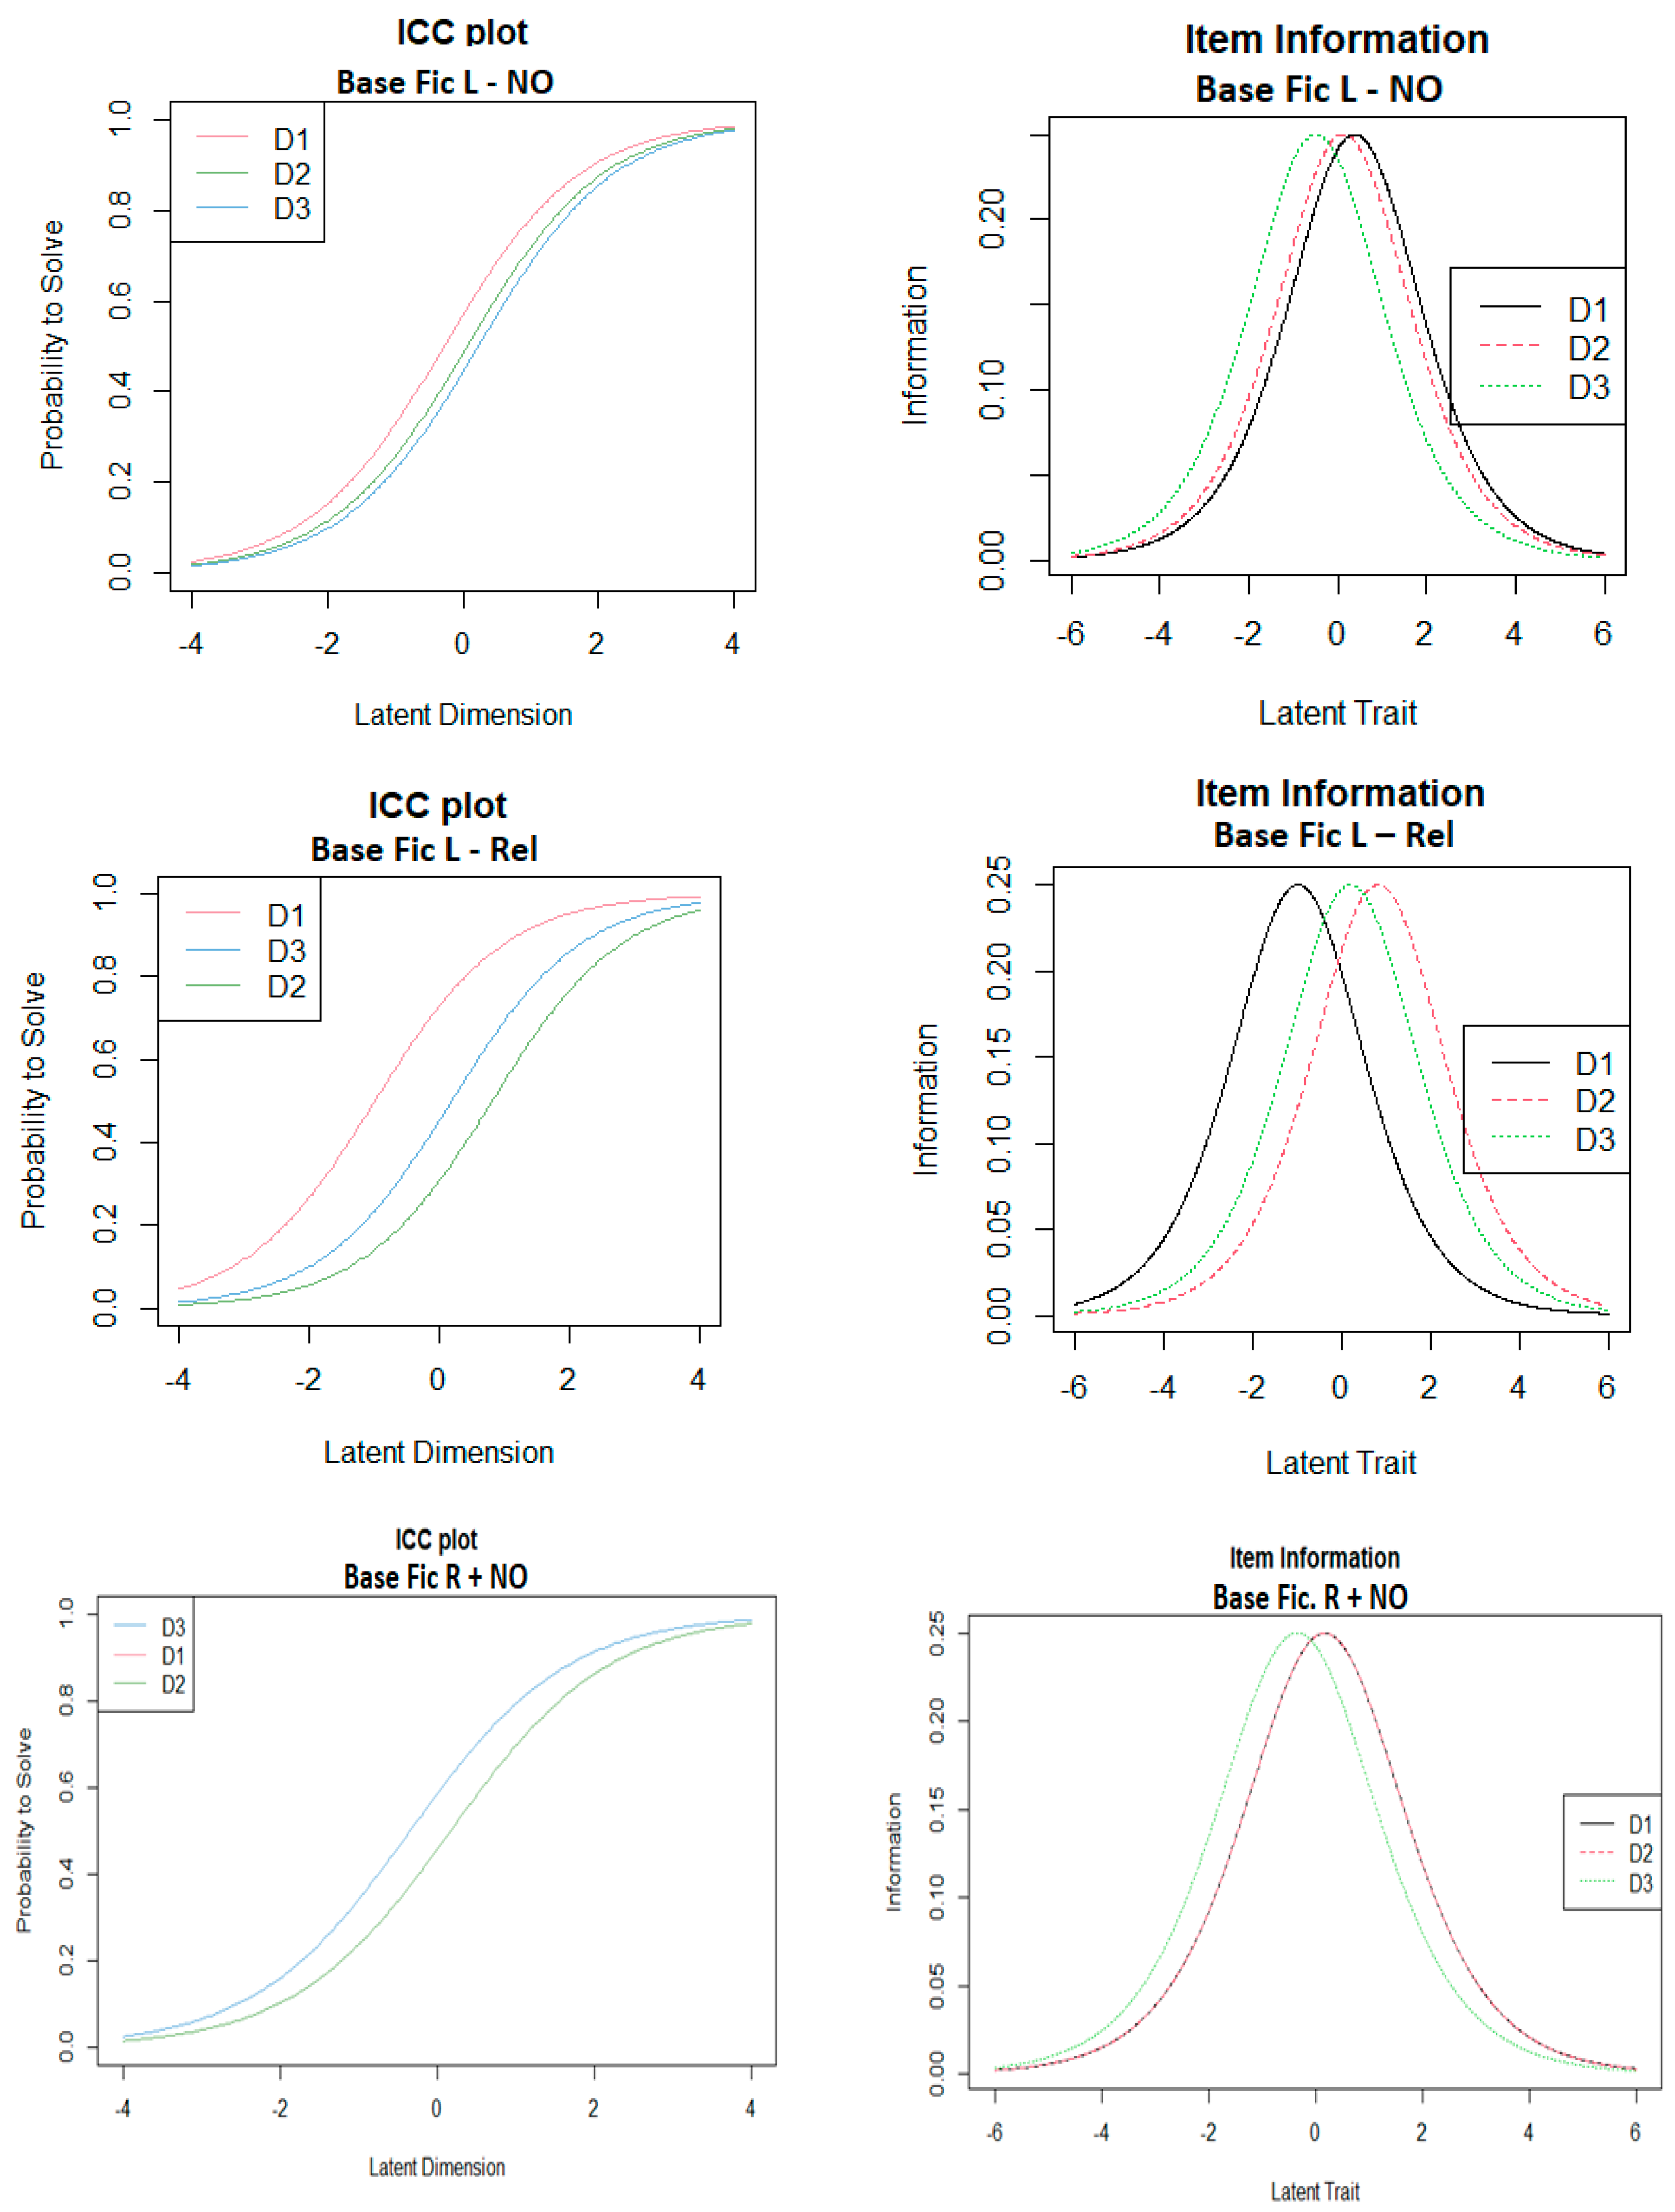
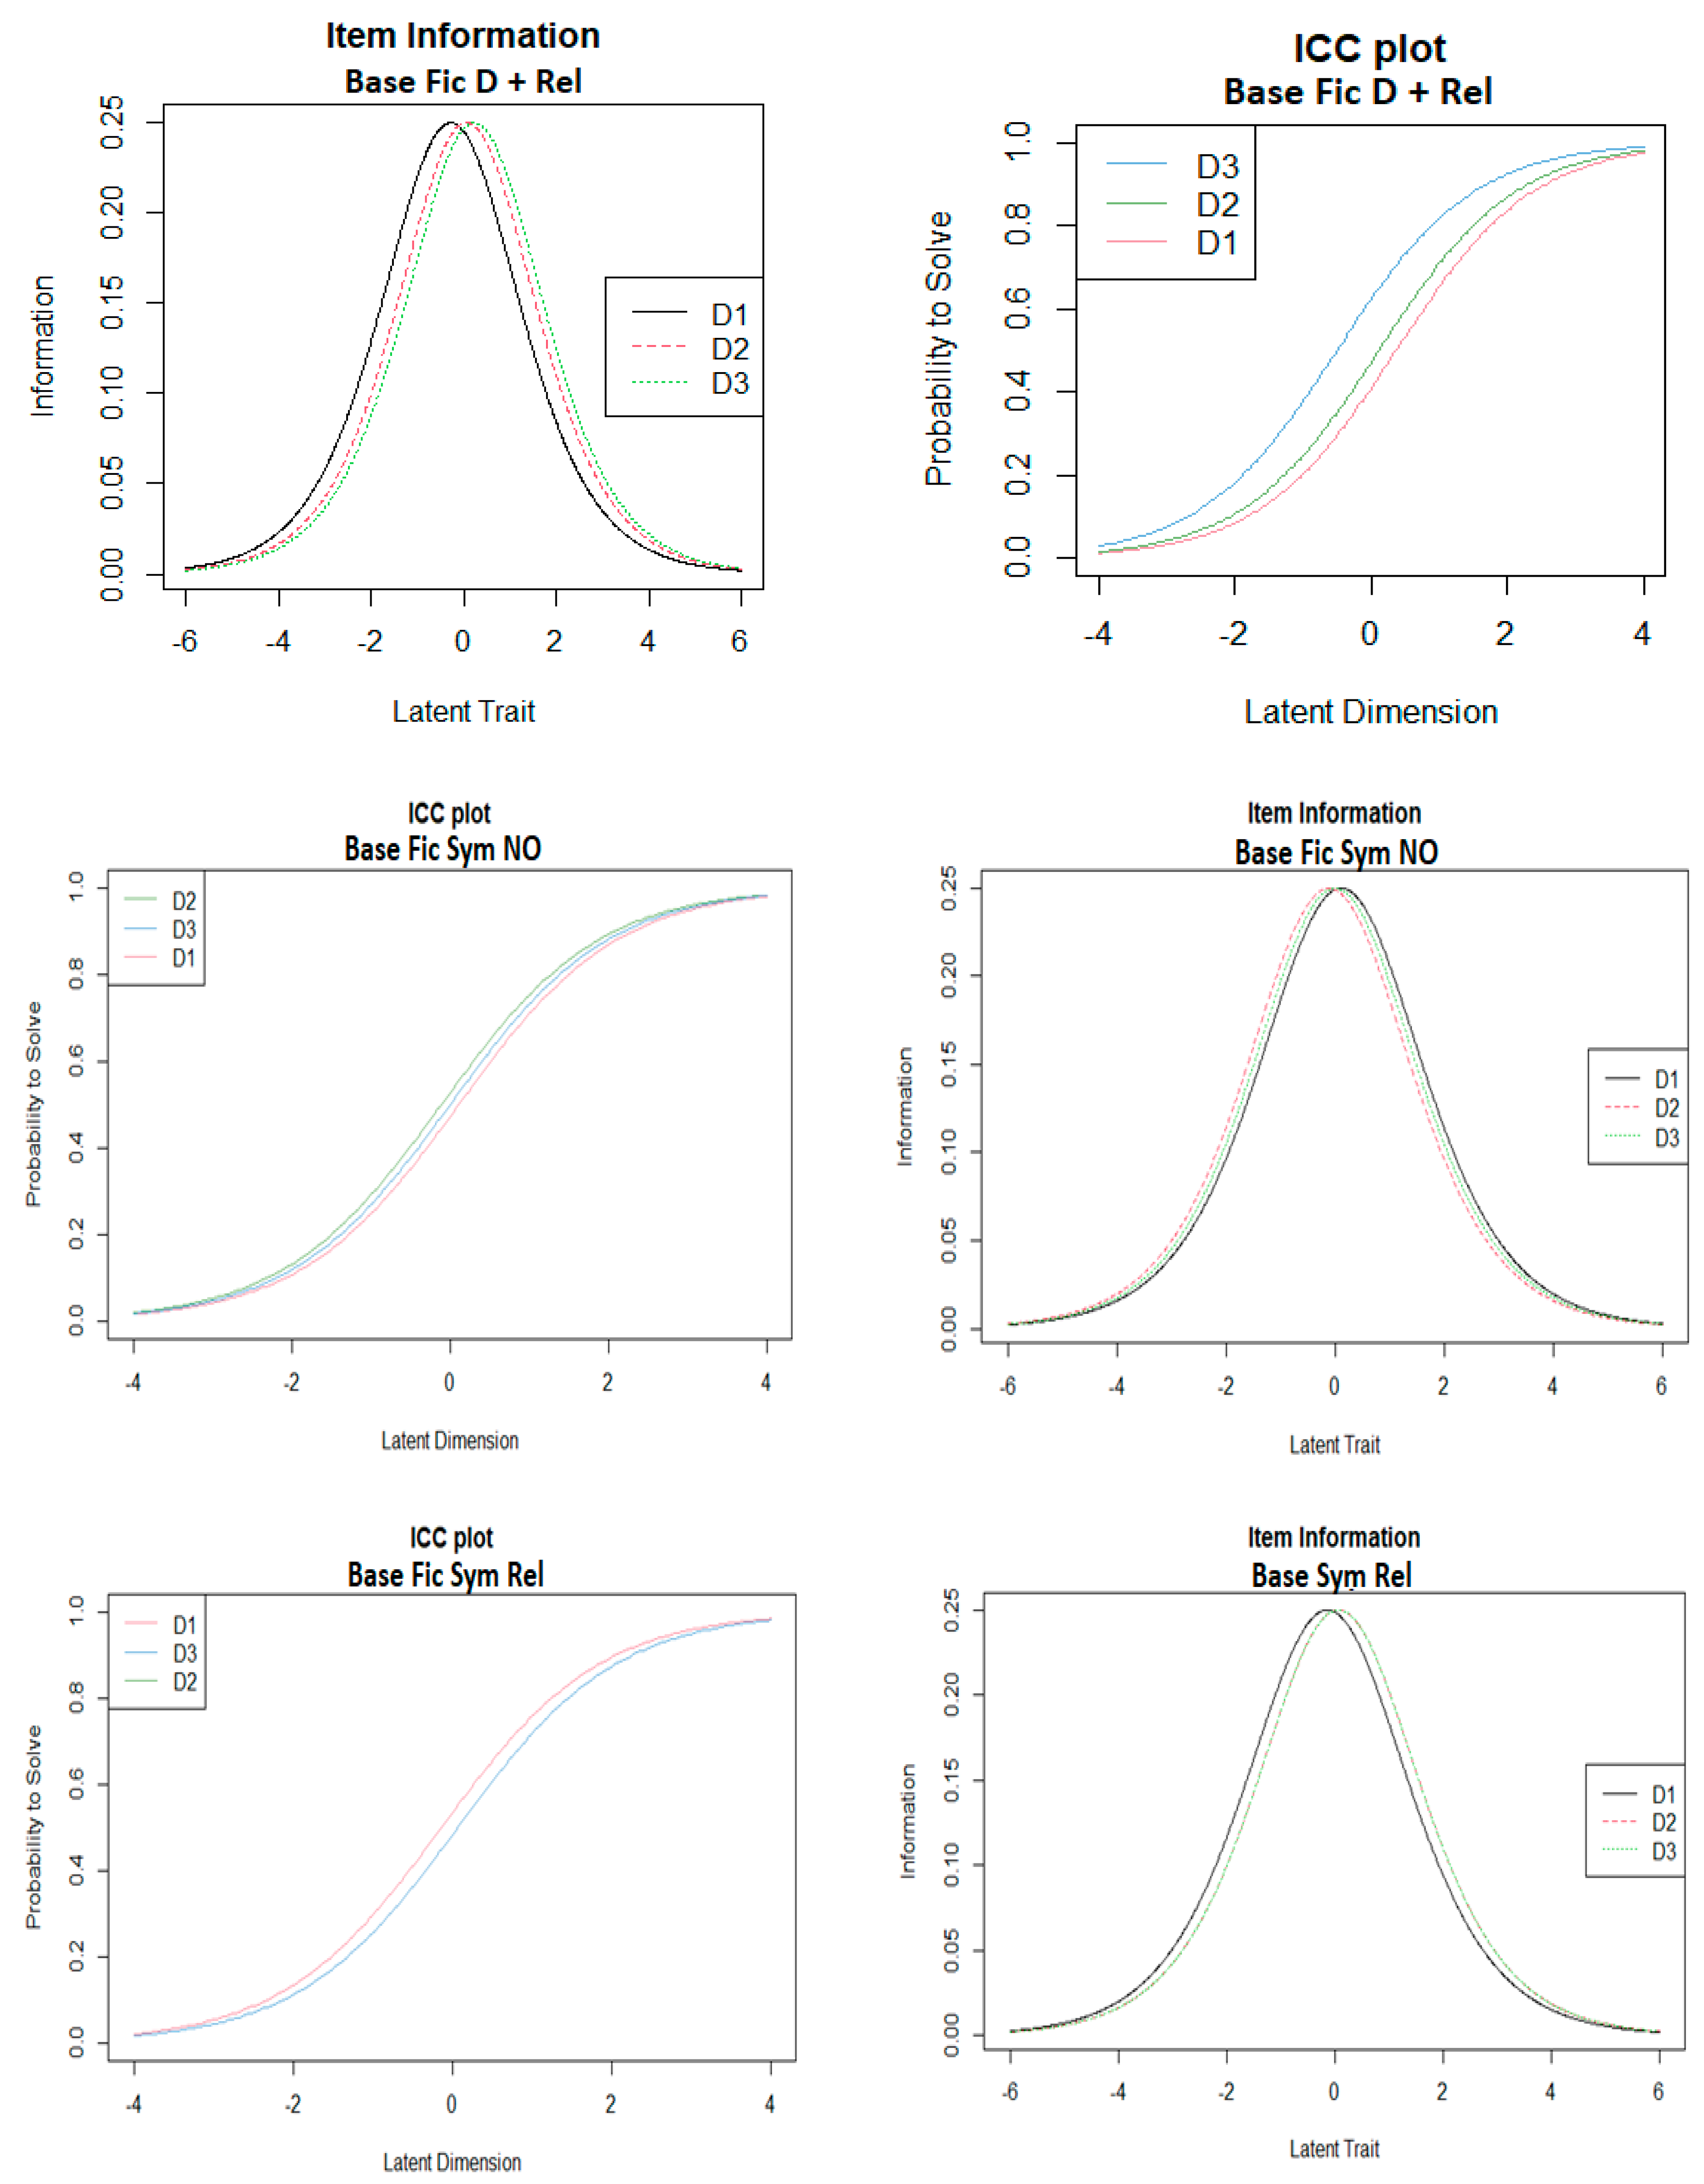
3.3. IRT-Rasch Results

The Rasch model was proposed by the Danish mathematician Georg Rasch after research between 1951 and 1959 and was first used to measure the intelligence of Danish soldiers, being subsequently widely used in psychometric assessments [33]. It was created for the analysis of dichotomous data, although later developments extended to polytomous data, either ordinal [34] or continuous [35]. The model analyses the responses of n individuals to i items and the probability of a positive outcome (favourable, or correct answer) (Xni = x = 1) x { 0 , 1 } (dichotomous in the original paper). It is given by the logistic function:
P ( X n i = 1 | β n , δ i ) = e β n δ i 1 + e β n δ i
where βn represents the first factor (individual factor) and δi the second factor (item factor).
It is possible to set a general rule of two factors—the former for personal ability and the second for item difficulty, expressed as log odds units (logits). It is a probabilistic latent structure model with remarkably increasing use for the evaluation of scales.
Rasch testing for dichotomous logistic data is the standard for exponential family models and is mainly based on conditional maximum likelihood. This provides the possibility of different approaches to likelihood estimation (LE). The Warm’s mean weighted likelihood estimates (WLE) of Rasch measures has been used, but a review of 215 studies and 23 software packages showed no significant differences between different LE approaches [36]. Expected a posteriori (EAP) person parameters were also included.
The results showed that the Rasch test of the EAP reliability score of 0.70 for the dichotomous data is not as good as the 0.94 for the Likert-5 polytomous data. However, the infit-t and outfit-t of the dichotomous variables are very centred, and the coefficients of reality of the polytomous variables, using Warm’s mean weighted likelihood estimates, are always >0.9 (Table 6). This suggests that a dichotomous-only questionnaire would not be as appropriate as a mixed model including polytomous Likert-scale data.
The item characteristic curves (ICC) and item information curves (IIC) are shown below (Figure 3).

4. Discussion

The results show that the questionnaire is robust for different possibilities of potential respondents and allows separate analysis of the three dimensions (usefulness, acceptability and appropriateness). Measurements, mainly based on questionnaires to assess a latent trait, are well-established research procedures in the social sciences, extending to many other fields. The construct in our paper is designed to obtain the positioning of nurses in relation to telenursing.
The questions have been optimised in terms of time and items, with paired questions to prevent leading questions and including at least 3 + 3 questions for each dimension [25,26,27]. It is important to consider that the paired questions must be score-reversed before running statistics.
It would even be possible to include only one question with a dichotomous answer (yes: I am in favour of telenursing; no: I am not in favour of telenursing), but although the construct basically seeks that information, a wider approach is intended with a more ambitious scope of measuring three dimensions: perceived usefulness, prospective acceptance and appropriateness for nursing tasks. The EAP Rasch results for categorical variables show a lower score (0.70) when compared with polytomous questions (0.94). The significant overall test validation data obtained can be explained by the combination of categorical and polytomous variables. Latent variable mixture models are a promising approach for the validation of outcomes [37].
The design conditions some statistic results. The three dimensions are strongly related, and consequently, a significant number of collinearities are expected. The constatation of collinearities are here an expression of the interconnection of the dimensions in the construct, and obviously, it only reflects a specifically designed questionnaire. It is unsurprising to find redundancy patterns corresponding to a sedimentation graphic sharply descending after the second or third variable; total variance was over 70% explained with only two or three questions (components). It must be noted that not all indices of reliability can be used in all situations, and even Cronbach alpha, for example, cannot be used in all circumstances [38]. This test measures internal consistency and is most useful when used in a survey with single-dimensional data; otherwise, it risks underestimating the true result. It is therefore convenient to use the methodology for each group of items (dimensions) that make up the construct. This does not mean that the consistencies of each of the three dimensions cannot be assessed and compared with each other between databases, but correlation of dimensions must be considered as a limitation for the applicability of some statistics.
Although Cronbach alpha is not applicable to dichotomous variables, and while the use of a Kuder–Richardson analysis could additionally be considered for the dichotomous data, given these dichotomous variables were obtained from the polytomous variables using a mathematical formula [1], the computation has been considered unnecessary.
Reliability depends on the sample used for the test, and this may be affected by other considerations. Both performance variability and group performance level may affect score reliability [25]. Let us imagine that all the nurses on the planet were totally convinced of the advantages of telenursing and validated it as positive. Different samples obtained by surveys using a Likert scale will provide consistent results of 5 = totally agree. In this extreme case, it will provide a variance of 0. Different samples will offer the same results (high reliability and high validity), although variance is 0. If this pattern is followed in the second question as well (i.e., virtually every answer close to 5), this could lead to a determinant of the matrix (Φ) close to 0 due to the strong correlation of the variables.
A low score in the Kaiser–Meyer–Olkin test will express a high value of the correlation coefficients—and, consequently, the inappropriateness of the factor analysis—but at the same time, for diagonality testing and due to this high correlation, the null hypothesis that the correlation matrix is the identity matrix (Bartlett’s test of sphericity) will be clearly rejected, as the comparison of the observed correlation matrix with the identity matrix will show a highly significant p. In conclusion, a larger variance of the total scores does not mean a higher reliability in all cases.
This emphasises the question that the statistical approach must focus on the particular data obtained and not on a blind application of mathematical tests and that not all indexes of reliability can be used in all situations [38]. It also reveals the weakness of the CTT that focuses on the test as a whole and the need to include a separate analysis of items with other latent structure models and/or probabilistic models.
An additive Likert scale was considered a popular option for this questionnaire compared to Thurstone or Guttman scales. However, two considerations are pertinent. Although often analysed as numerical, Likert scales are ordinal, and it is possible that in future surveys, data may be (left) negatively skewed (majority of favourable answers) with a significant number of values 4 or 5 considering the foreseeable tendency to consider telenursing as professionally positive. To what extent these two factors break the constraints of the analysis of variance (ANOVA) requiring continuous values with a Gaussian curve must be analysed in each case. In extreme cases, a non-parametric test could be used (Spearman tests of ranks). To evaluate the robustness of the questionnaire, databases with different types of skewness have been tested.
Note that there may be other reasons why factor analysis may not be appropriate. The main purpose of this multivariate statistical technique is to synthesise the observed interactions between a set of variables in a concise way and to explore the unobservable latent (hidden) variable presumed within the logic of the framework of the theory. However, in this case, the three dimensions are provided a priori. This could become an exploratory analysis; if the KMO were higher than 0.71—and therefore factor analysis could be considered appropriate—a collinearity would still to be expected, a rotation (in principle orthogonal, e.g., varimax rotation, with Kaiser normalisation) should be used and small coefficients (<0.5) should be deleted.
It is not advisable to analyse Cronbach’s alpha for the whole questionnaire or for the questions independently, as with a number of questions higher than 20, acceptable alpha values could result even though they may consist of two or three orthogonal dimensions; very high values (over 0.90) may also express the (expected) redundancy among items. Cronbach’s alpha is not to be used as the sole source of validity evidence [27]. Running Cronbach’s alpha for each dimension seems a rational in-between approach.
CTT has also been criticised for requiring imputation methodology for missing data, imprecision of standard errors and distortion (as commented above) of extreme cases and ordinal data handled through intervals [39]. As per Andrich, modern test theory—which includes IRT and its variant, Rasch measurement theory—will increasingly replace classical test theory in the analysis of rating scales and in the presentation of outcome measures [34].
IRT methodologies are widely used in educational contexts, psychological tests and questionnaires. The main characteristic of all IRT models is that the assessment of the latent trait is considered to be conditional on the respondent and the questionnaire items, and therefore IRT models are based on statistics obtained by estimating the respondent characteristics and item characteristics [40].
In real testing, the dichotomous (D1–D3) data will not be automatically generated by the computer, but it would be interesting to compare the results with those generated with the formula indicated above [1] (e.g., with the Kendall rank correlation coefficient test) to see the concordance between polytomous and dichotomous data.
The SPSS software does not include Rasch analysis in the current (26) version. However, conditional maximum likelihood estimation Rasch analysis (for dummy variables) has been reported with a log-linear subroutine [41], and there is also an R Integration Package for IBM SPSS Statistics. The most popular software for Rasch analysis includes Winsteps (paid) and R (free).
The major advantage of the Rasch model over the CTT is the property of joint measurement of item and subject parameters in the same construct. Another advantage is that the Rasch model assumes unidimensionality, i.e., that all responses are conditioned by a single latent variable, which in this case is the consideration of telenursing.
The computerised analysis customarily calculates the differences between observed and expected responses (i.e., expressing the residuals). For the respondent r and the item q (where r , n q i ), the residual yrq is computed as:
yrq = xrqPrq
where xrq is the observed response to the question and Prq the probability of a favourable answer to the question.
Usually, the residuals are standardised (zrq) by dividing the residual by the standard deviation (SD); thus:
z r q = y r q P r q ( 1 P r q )
This allows computation of the mean square (MNSQ) value of the (inlier-sensitive, weighted) Infit, which is the average of the quadratic residuals weighted with their weighted mean square (W), as a model fitting test.
Infit   ( MNSQ ) = n N W n i z n i 2 n N W n i
It is also possible to compute the Infit for one person or for one question. The Infit plays an essential role in Rasch testing. It expresses the global fit adjustment. The goodness of fit is a measure of symmetry (Gaussian curve) and has no rationale in computer-generated database testing, as the databases have been designed specifically for different skewness.
The Outfit is an outlier-sensitive fit statistic based on the conventional chi-square test:
Outfit   ( MNSQ   unweighted ) = u i = n = 1 N z n i 2 N
MNSQ statistics represent the size of the randomness. Although a very conservative extent (0.7–1.3) could be considered, a range of values between 0.5 and 1.5 of MNSQ is usually accepted. Outliers represent distortion of the model. Values over 2 may indicate very few observations, and, contrariwise, values lower than 0.5 may suggest misleading reliability.
The infit-t (or Z) and outfit-t are typical standardised values for the degree of fit of the person or the item factor. Values will typically fall between −1.9 and + 1.9 for reasonable predictability of the model as they do in our case. Values over 2 indicate unpredictability, and values of −2 and lower suggest extreme predictability (redundancy, overfit of the model) and pose the question of whether other dimensions are really influencing the results [42,43].
A notable additional possibility of Rasch analysis is the analysis of graphic data. The slope of the ICC represents the discrimination, or how much the probability of giving a correct answer increases as the latent element increases (probability of providing a correct answer for those in favour of telenursing in our case).
It is possible to measure the difficulty of the questions. As the scale is dichotomous, if the point with probability 0.5 (π) (y-axis) and its corresponding location (δ) (x-axis) are determined for a question (item), easy questions will shift the sigmoid curve to the left, and—consequently—for a given δ value, the probability of answering correctly will increase. In the opposite case, the shift will be to the right.
The minimum value of the curve represents the probability of giving a correct answer by chance. It can be useful in detecting respondents who answer without even reading the questions in the questionnaire.
Graphic plotting allows analysis of the items and their degree of understanding. Information testing allows us to know what number of questions provides the highest percentage of latent characteristics.
The fact that an evaluation of 15,120 (120 × 21 × 6) responses with different profiles was carried out is one of the novelties and strengths of this work, as practically all possible future response trends in a real population have been covered. In terms of limitations and future projection, the most notable aspect of the study is that no responses were obtained from actual nurses, leaving the field open for future research.

5. Conclusions

Both the CTT and IRT approaches, considering the specificities and the specific design of the questionnaire, confirm the validity of this test to assess nurses’ positioning in relation to telenursing.

Supplementary Materials

The following supporting information can be downloaded at: https://www.mdpi.com/article/10.3390/math10142463/s1.

Author Contributions

Conceptualization, J.E.M.-F. and R.C.-P.; methodology, J.E.M.-F.; software, J.E.M.-F.; validation, M.R.-S. and R.C.-P.; formal analysis, J.E.M.-F., I.B.-M. and S.G.-d.-J.; investigation, J.E.M.-F. and I.B.-M.; resources, M.R.-S., R.C.-P. and S.G.-d.-J.; data curation, J.E.M.-F. and I.B.-M.; writing—original draft preparation, J.E.M.-F.; writing—review and editing, M.R.-S., R.C.-P., I.B.-M. and S.G.-d.-J.; visualization, J.E.M.-F. and I.B.-M.; supervision, M.R.-S. and R.C.-P.; project administration, I.B.-M. All authors have read and agreed to the published version of the manuscript.

Funding

This research received no external funding.

Institutional Review Board Statement

Not applicable.

Informed Consent Statement

Not applicable.

Data Availability Statement

Databases will be freely provided by the corresponding author on request.

Acknowledgments

We would like to thank John Wright for help with English editing.

Conflicts of Interest

The authors declare no conflict of interest.

References

  1. Wang, J.; Lim, M.K.; Wang, C.; Tseng, M.L. The Evolution of the Internet of Things (IoT) over the Past 20 Years. Comput. Ind. Eng. 2021, 155, 107174. [Google Scholar] [CrossRef]
  2. Mieronkoski, R.; Azimi, I.; Rahmani, A.M.; Aantaa, R.; Terävä, V.; Liljeberg, P.; Salanterä, S. The Internet of Things for Basic Nursing Care—A Scoping Review. Int. J. Nurs. Stud. 2017, 69, 78–90. [Google Scholar] [CrossRef] [PubMed]
  3. Buchan, J.; Catton, H.; Shaffer, F. Sustain and Retain in 2022 and Beyond. Int. Counc. Nurses 2022, 71, 1–71. [Google Scholar]
  4. Quinn, P. A Grounded Theory Study of How Nurses Integrate Pregnancy and Full-Time Employment: Becoming Someone Different. Nurs. Res. 2016, 65, 170–178. [Google Scholar] [CrossRef]
  5. Alex, M.R. Occupational Hazards for Pregnant Nurses. Am. J. Nurs. 2011, 111, 28–37. [Google Scholar] [CrossRef] [Green Version]
  6. Gan, I. A Scoping Review of the Nursing Workforce’s Changing Demography: Supporting Baby-Boomer Nurses. J. Nurs. Manag. 2020, 28, 1473–1480. [Google Scholar] [CrossRef]
  7. Hübner, U.; Flemming, D.; Heitmann, K.U.; Oemig, F.; Thun, S.; Dickerson, A.; Veenstra, M. The Need for Standardised Documents in Continuity of Care: Results of Standardising the ENursing Summary. Stud. Health Technol. Inform. 2010, 160, 1169–1173. [Google Scholar]
  8. Kumar, S.; Snooks, H. Telenursing; Kumar, S., Snooks, H., Eds.; Springer: London, UK, 2011; ISBN 978-0-85729-528-6. [Google Scholar]
  9. Holmström, I. Decision Aid Software Programs in Telenursing: Not Used as Intended? Experiences of Swedish Telenurses. Nurs. Health Sci. 2007, 9, 23–28. [Google Scholar] [CrossRef]
  10. Haghi Kashani, M.; Madanipour, M.; Nikravan, M.; Asghari, P.; Mahdipour, E. A Systematic Review of IoT in Healthcare: Applications, Techniques, and Trends. J. Netw. Comput. Appl. 2021, 192, 103164. [Google Scholar] [CrossRef]
  11. Hung, T.N.K.; Le, N.Q.K.; Le, N.H.; Van Tuan, L.; Nguyen, T.P.; Thi, C.; Kang, J.-H. An AI-Based Prediction Model for Frug-Drug Interactions in Osteoporosis and Paget’s Diseases from SMILES. Mol. Inform. 2022, 41, 2100264. [Google Scholar] [CrossRef]
  12. Kindle, R.D.; Badawi, O.; Celi, L.A.; Shawn, S. Intensive Care Unit Telemedicine in the Era of Big Data, Artificial Intelligence, and Computer Clinical Decision Support Systems. Crit. Care Clin. 2019, 25, 483–495. [Google Scholar] [CrossRef] [PubMed]
  13. Paolilli, D.; Mertens, K.; Wickersham, C.; Rodriguez, E. Telecommuting for Nurses: Developing a Model for the Outpatient Oncology Nurse. Oncol. Nurs. Forum 2007, 34, 540. [Google Scholar]
  14. Clancy, T.R. Artificial Intelligence and Nursing: The Future Is Now. J. Nurs. Administation 2020, 50, 125–127. [Google Scholar] [CrossRef] [PubMed]
  15. Erlingsdottir, G.; Ersson, A.; Borell, J.; Rydenfält, C. Driving for Successful Change Processes in Healthcare by Putting Staff at the Wheel. J. Health Organ. Manag. 2018, 32, 69–84. [Google Scholar] [CrossRef]
  16. Snooks, H.A.; Williams, A.M.; Griffiths, L.J.; Peconi, J.; Rance, J.; Snelgrove, S.; Sarangi, S.; Wainwright, P.; Cheung, W.Y. Real Nursing? The Development of Telenursing. J. Adv. Nurs. 2008, 61, 631–640. [Google Scholar] [CrossRef]
  17. Parmanto, B.; Lewis, A.N., Jr.; Graham, K.M.; Bertolet, M.H. Development of the Telehealth Usability Questionnaire (TUQ). Int. J. Telerehabilitation 2016, 8, 3–10. [Google Scholar] [CrossRef]
  18. Kitchenham, B.; Pfleeger, S.L. Principles of Survey Research Part 3: Constructing a Survey Instrument. ACM SIGSOFT Softw. Eng. Notes 2002, 27, 20. [Google Scholar] [CrossRef]
  19. Lewis, J.R. The System Usability Scale: Past, Present, and Future. Int. J. Hum. Comput. Interact. 2018, 34, 577–590. [Google Scholar] [CrossRef]
  20. Davis, F.D. User Acceptance of Information Technology: System Characteristics, User Perceptions and Behavioral Impacts. Int. J. Man. Mach. Stud. 1993, 38, 475–487. [Google Scholar] [CrossRef] [Green Version]
  21. Venkatesh, V.; Bala, H. Technology Acceptance Model 3 and a Research Agenda on Interventions. Decis. Sci. 2008, 39, 273–315. [Google Scholar] [CrossRef] [Green Version]
  22. Mattisson, M.; Johnson, C.; Börjeson, S.; Årestedt, K.; Lindberg, M. Development and Content Validation of the Telenursing Interaction and Satisfaction Questionnaire (TISQ). Health Expect. 2019, 22, 1213–1222. [Google Scholar] [CrossRef] [PubMed]
  23. Solnyshkina, M.I.; Zamaletdinov, R.R.; Gorodetskaya, L.A.; Gabitov, A.I. Evaluating Text Complexity and Flesch-Kincaid Grade Level. J. Soc. Stud. Educ. Res. 2017, 8, 238–248. [Google Scholar] [CrossRef]
  24. Bakken, S.; Grullon-Figueroa, L.; Izquierdo, R.; Lee, N.J.; Morin, P.; Palmas, W.; Teresi, J.; Weinstock, R.S.; Shea, S.; Starren, J. Development, Validation, and Use of English and Spanish Versions of the Telemedicine Satisfaction and Usefulness Questionnaire. J. Am. Med. Inform. Assoc. 2006, 13, 660–667. [Google Scholar] [CrossRef] [Green Version]
  25. Fan, X.; Yin, P. Examinee Characteristics and Score Reliability: An Empirical Investigation. Educ. Psychol. Meas. 2003, 63, 357–368. [Google Scholar] [CrossRef]
  26. Krosnick, J.A.; Presser, S. Question and Questionnaire Design. In Handbook of Survey Research; Marsden, P.V., Wright, J.D., Eds.; Emerald Group Publishing Limited: Bingley, UK, 2010; pp. 263–313. ISBN 978-1-84855-224-1. [Google Scholar]
  27. Flake, J.K.; Fried, E.I. Measurement Schmeasurement: Questionable Measurement Practices and How to Avoid Them. Adv. Methods Pract. Psychol. Sci. 2020, 3, 456–465. [Google Scholar] [CrossRef]
  28. Hopper, J. How Many Questions in a 10-Minute Survey? Versta Research Methodology 2017. Available online: https://verstaresearch.com/blog/how-many-questions-in-a-10-minute-survey/ (accessed on 23 May 2022).
  29. Amaresan, S. How Long Should a Survey Be? 2021. Available online: https://blog.hubspot.com/service/ideal-survey-length (accessed on 23 May 2022).
  30. Taylor, E. How Many Questions Should I Ask in My Survey? 2018. Available online: https://www.driveresearch.com/market-research-company-blog/how-many-questions-should-i-ask-in-my-survey/ (accessed on 23 May 2022).
  31. Hair, J.F.; Black, W.C.; Babin, B.J.; Anderson, R.E. Multivariate Data Analysis: Pearson New International Edition; Pearson Education Limited: London, UK, 2013; ISBN 978-1292021904. [Google Scholar]
  32. Kampen, J.; Swyngedouw, M. The Ordinal Controversy Revisited. Qual. Quant. 2000, 34, 87–102. [Google Scholar] [CrossRef]
  33. Rasch, G. Probabilistic Models for Some Intelligence and Attainment Tests; Danish Institute for Educational Research: Copenhagen, Denmark, 1960; ISBN 0-226-70554-4. [Google Scholar]
  34. Andrich, D. A Rating Formulation for Ordered Response Categories. Psychometrika 1978, 43, 561–573. [Google Scholar] [CrossRef]
  35. Hohensinn, C. Pcirt: An r Package for Polytomous and Continuous Rasch Models. J. Stat. Softw. 2018, 84, 1–14. [Google Scholar] [CrossRef] [Green Version]
  36. Nicklin, C.; Vitta, J.P. Assessing Rasch Measurement Estimation Methods across R Packages with Yes/No Vocabulary Test Data. Lang. Test. 2022, 02655322211066822. [Google Scholar] [CrossRef]
  37. Sawatzky, R.; Ratner, P.A.; Kopec, J.A.; Zumbo, B.D. Latent Variable Mixture Models: A Promising Approach for the Validation of Patient Reported Outcomes. Qual. Life Res. 2012, 21, 637–650. [Google Scholar] [CrossRef] [PubMed]
  38. Streiner, D.L. Starting at the Beginning: An Introduction to Coefficient Alpha and Internal Consistency. J. Pers. Assess. 2003, 80, 99–103. [Google Scholar] [CrossRef] [PubMed]
  39. Embretson, S.E.; Hershberger, S.L. The New Rules of Measurement: What Every Psychologist and Educator Should Know; Embretson, S.E., Hershberger, S.L., Eds.; Lawrence Erlbaum Associates Publishers: Mahwah, NJ, USA, 1999; ISBN 0-8058-2860-5 (Hardcover). [Google Scholar]
  40. Baker, F.B.; Kim, S.-H. Item Response Theory. Parameter Estimation Techniques, 2nd ed.; Baker, F.B., Kim, S.-H., Eds.; Marcel Dekker Inc.: New York, NY, USA, 2004; ISBN 9780824758257. [Google Scholar]
  41. TenVergert, E.; Gillespie, M.; Kingma, J. Testing the Assumptions and Interpreting the Results of the Rasch Model Using Log-Linear Procedures in SPSS. Behav. Res. Methods Instrum. Comput. 1993, 25, 350–359. [Google Scholar] [CrossRef]
  42. Bond, T.G.; Yan, Z.; Heene, M. Applying the Rasch Model: Fundamental Measurement in the Human Sciences, 4th ed.; Routledge: New York, NY, USA, 2020; ISBN 978-0-367-14142-4. [Google Scholar]
  43. Linacre, J.M. What Do Infit and Outfit, Mean-Square and Standardized Mean? Rasch Meas. Trans. 2002, 16, 878. [Google Scholar]
Figure 1. Polytomous responses for a database with negative asymmetry and well-paired data (Fic L—Rel).
Mathematics 10 02463 g001
Figure 2. Dichotomous responses by dimensions. Same database (Fic L—Rel).
Mathematics 10 02463 g002
Figure 3. ICC and IIC charts for dichotomous variables (D1–D3).
Mathematics 10 02463 g003aMathematics 10 02463 g003b
Table 1. Codes and characteristics of databases.
Database CodeSymmetryPairwise Difference
Fic R + NOPositivePoor
Fic R + RelPositiveGood
Fic Syim NOCentralPoor
Fic Sym RelCentralGood
Fic L—NONegativePoor
Fic L—RelNegativeGood
Table 2. Required reordering of questions before running the statistics.
Polytomous
UsefulnessAcceptanceAppropriateness
−18417
−8−14−10
5215
−3−19−11
211220
−13−16−6
Dichotomous179
Note: Questions with a negative sign should be score-reversed (1 = 5, etc.).
Table 3. Descriptive statistics of the databases.
DatabaseFic R + NOFic R + RelFic Sym NOFic Sym RelFic L—NOFic L—Rel
Data (Ӯ)CategorialOrdinalCategorialOrdinalCategorialOrdinalCategorialOrdinalCategorialOrdinalCategorialOrdinal
Mean 0.55 0.47 0.67 0.62 0.74 0.73
Standard error 0.05 0.05 0.04 0.04 0.04 0.04
Median of
medians
2.8 2.0 3.0 3.0 4.0 4.0
Standard
deviation
0.50 0.50 0.47 0.49 0.44 0.44
Variance 0.25 0.25 0.22 0.24 0.20 0.20
Kurtosis −1.99 −2.02 −1.51 −1.78 −0.83 −0.86
Skewness −0.20 0.12 −0.72 −0.50 −1.09 −1.07
Mean of sums 66.00 56.33 85.00 74.33 88.33 88.00
Subject count 120 120 120 120 120 120
Positive responses (%)55.046.966.761.973.673.3
Table 4. Descriptive statistics of polytomous items. Cronbach’s alpha.
DatabaseFic R + NOFic R + RelFic Sym NOFic Sym RelFic L—NOFic L—Rel
DomainsUsAccAppUsAccAppUsAccAppUsAccAppUsAccAppUsAccApp
Cronbach α0.840.860.840.940.950.940.830.800.820.940.950.940.820.830.840.940.950.95
Cronbach α 0.94 0.98 0.93 0.98 0.94 0.98
95% CI0.93–0.960.91–0.980.91–0.950.97–0.980.92–0.950.97–0.98
(Covariances)
Note: Us = Usefulness. Acc = Acceptance. App = Appropriateness.
Table 5. Principal components analyses.
DatabaseFic R + NOFic R + RelFic Sym NOFic Sym RelFic L—NOFic L—Rel
KMO0.930.950.940.930.930.94
Bartlett0.0000.0000.0000.0000.0000.000
Table 6. Rasch analysis.
DatabaseFic R + NOFic R + RelFic Sym NOFic Sym RelFic L—NOFic L—RelAverages
DichotomousEAP Real0.740.750.670.720.640.660.70
D1-Infit-t0.35−0.980.450.210.47−1.10−0.10
D2-Infit-t0.350.23−0.43−0.66−1.612.03−0.01
D3-Infit-t−1.040.340.050.520.91−0.570.04
D1-Outfit-t0.33−1.010.440.200.451.24−0.14
D2-Outfit-t0.330.23−0.44−0.67−1.611.98−0.03
D3-Outfit-t−1.140.320.050.530.89−0.600.01
Beta-D1 (0.95 CI)−0.17−0.37−0.110.140.280.990.13
Beta-D2 (0.95 CI)−0.17−0.120.11−0.07−0.06−0.81−0.19
Beta-D3 (0.95 CI)0.340.480.00−0.07−0.22−0.190.06
D1-Dffclt0.03−0.03−0.47−0.13−0.71−0.10−0.24
D1-Dscrmn37.05817.3324.55913.03812.75737.20620.325
D1-P (x = 1|z = 0)0.2650.7480.8940.8521.0000.9740.789
D2-Dffclt0.028-0.076−0.517−0.118−0.683−0.051−0.236
D2-Dscrmn37.05817.3324.55913.03812.75737.20620.325
D2-P (x = 1|z = 0)0.2650.7890.9130.8231.0000.8700.777
D3-Dffclt0.014−0.063−0.492−0.118−0.670−0.066−0.233
D3-Dscrmn37.05817.3324.55913.03812.75737.20620.325
D3-P (x = 1|z = 0)0.380.86830.900.820.99980.9220.816
PolytomousEAP reliab.0.930.970.920.970.920.960.94
WLE reliab.0.920.960.910.970.920.960.94
Note: Warm’s Mean Weighted Likelihood Estimates.
Publisher’s Note: MDPI stays neutral with regard to jurisdictional claims in published maps and institutional affiliations.

