
Modelling and Fault Detection for Specific Cavitation Damage Based on the Discharge Pressure of Axial Piston Pumps


Abstract
:1. Introduction
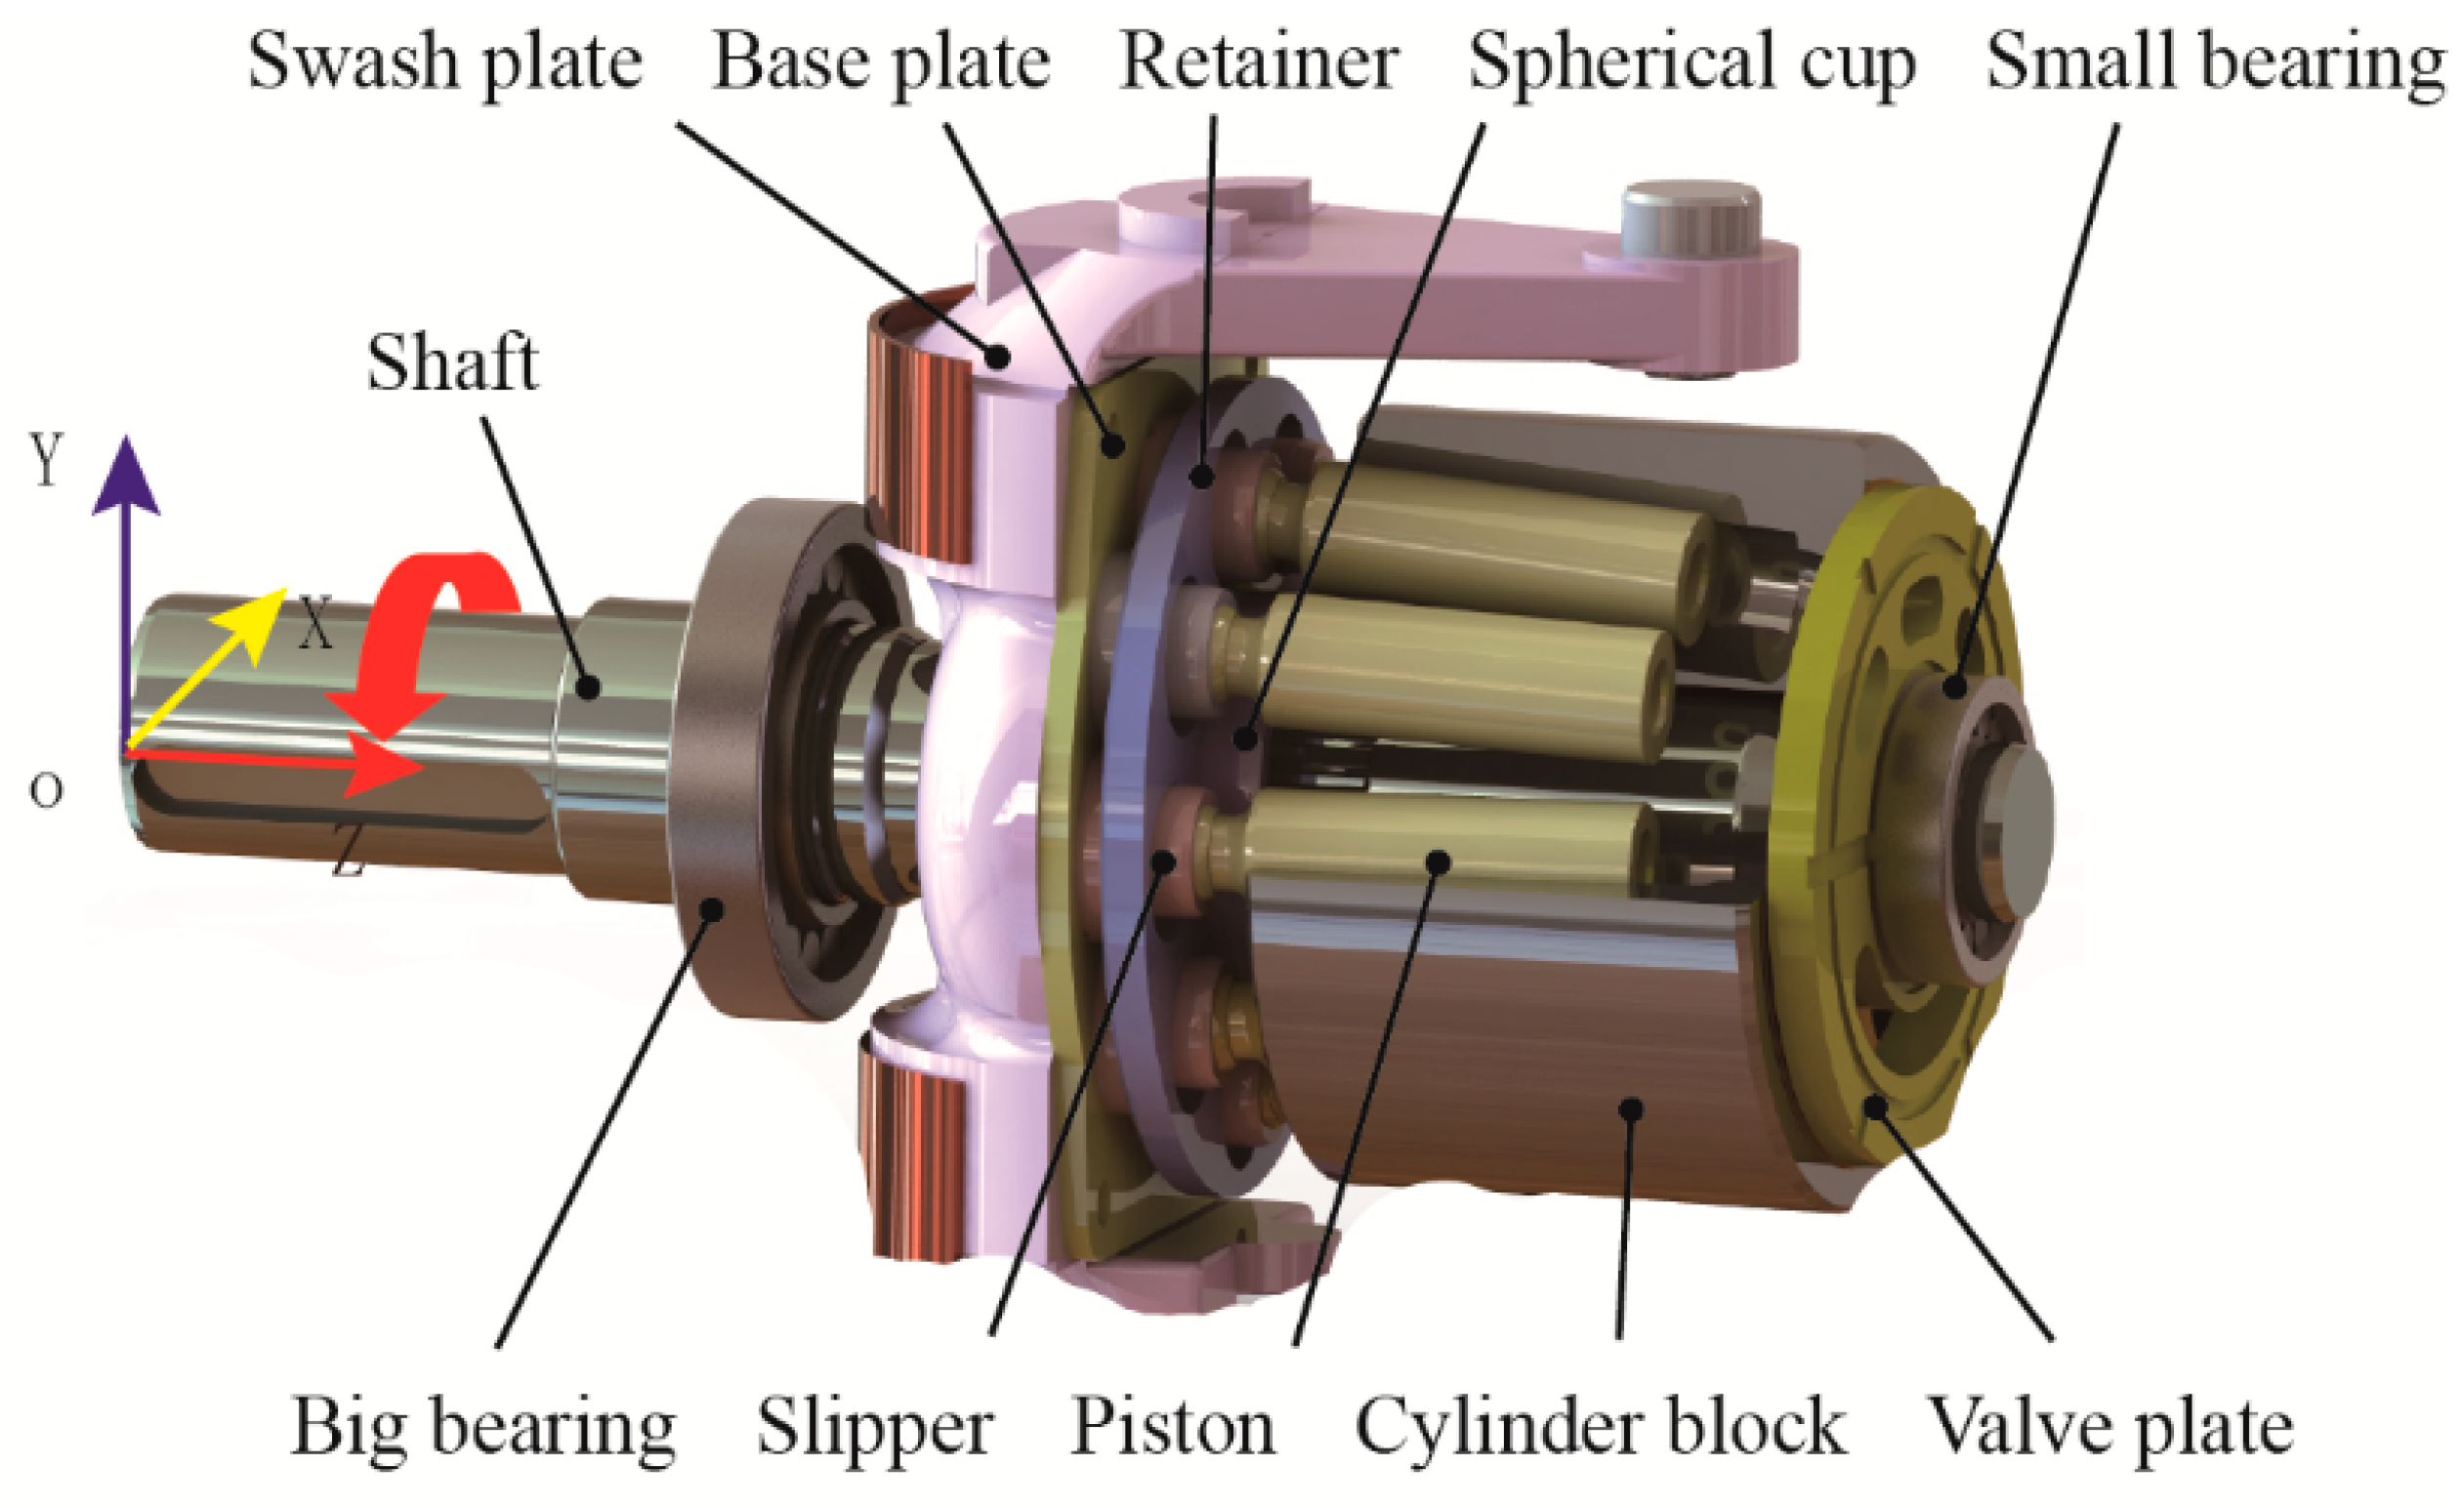
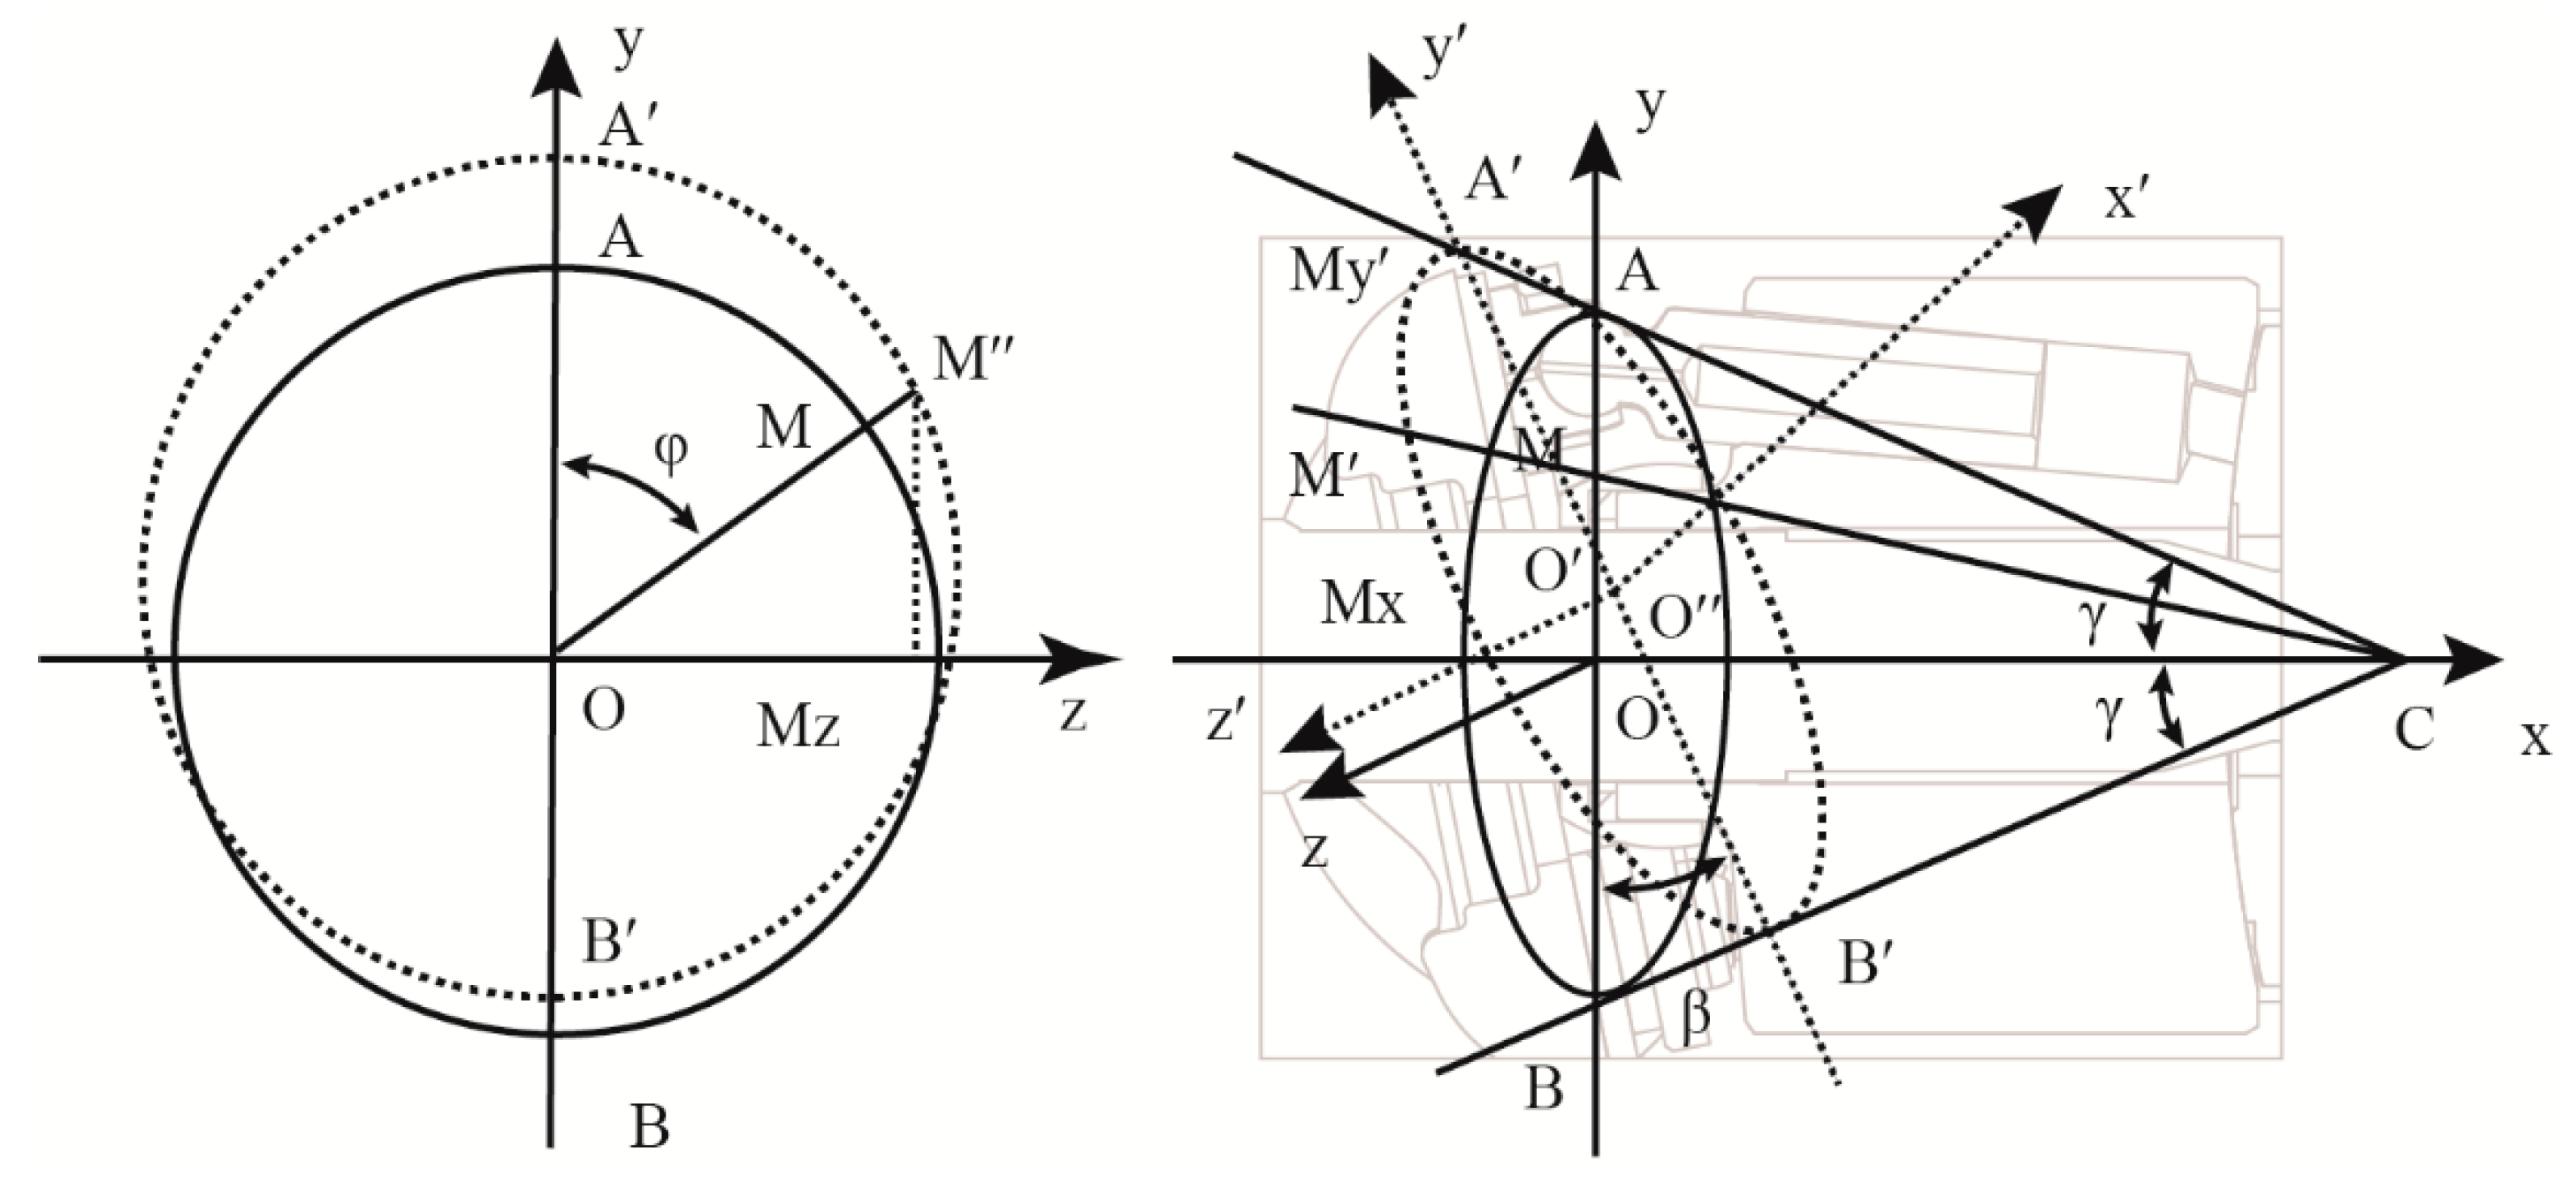
2. Simulation Model
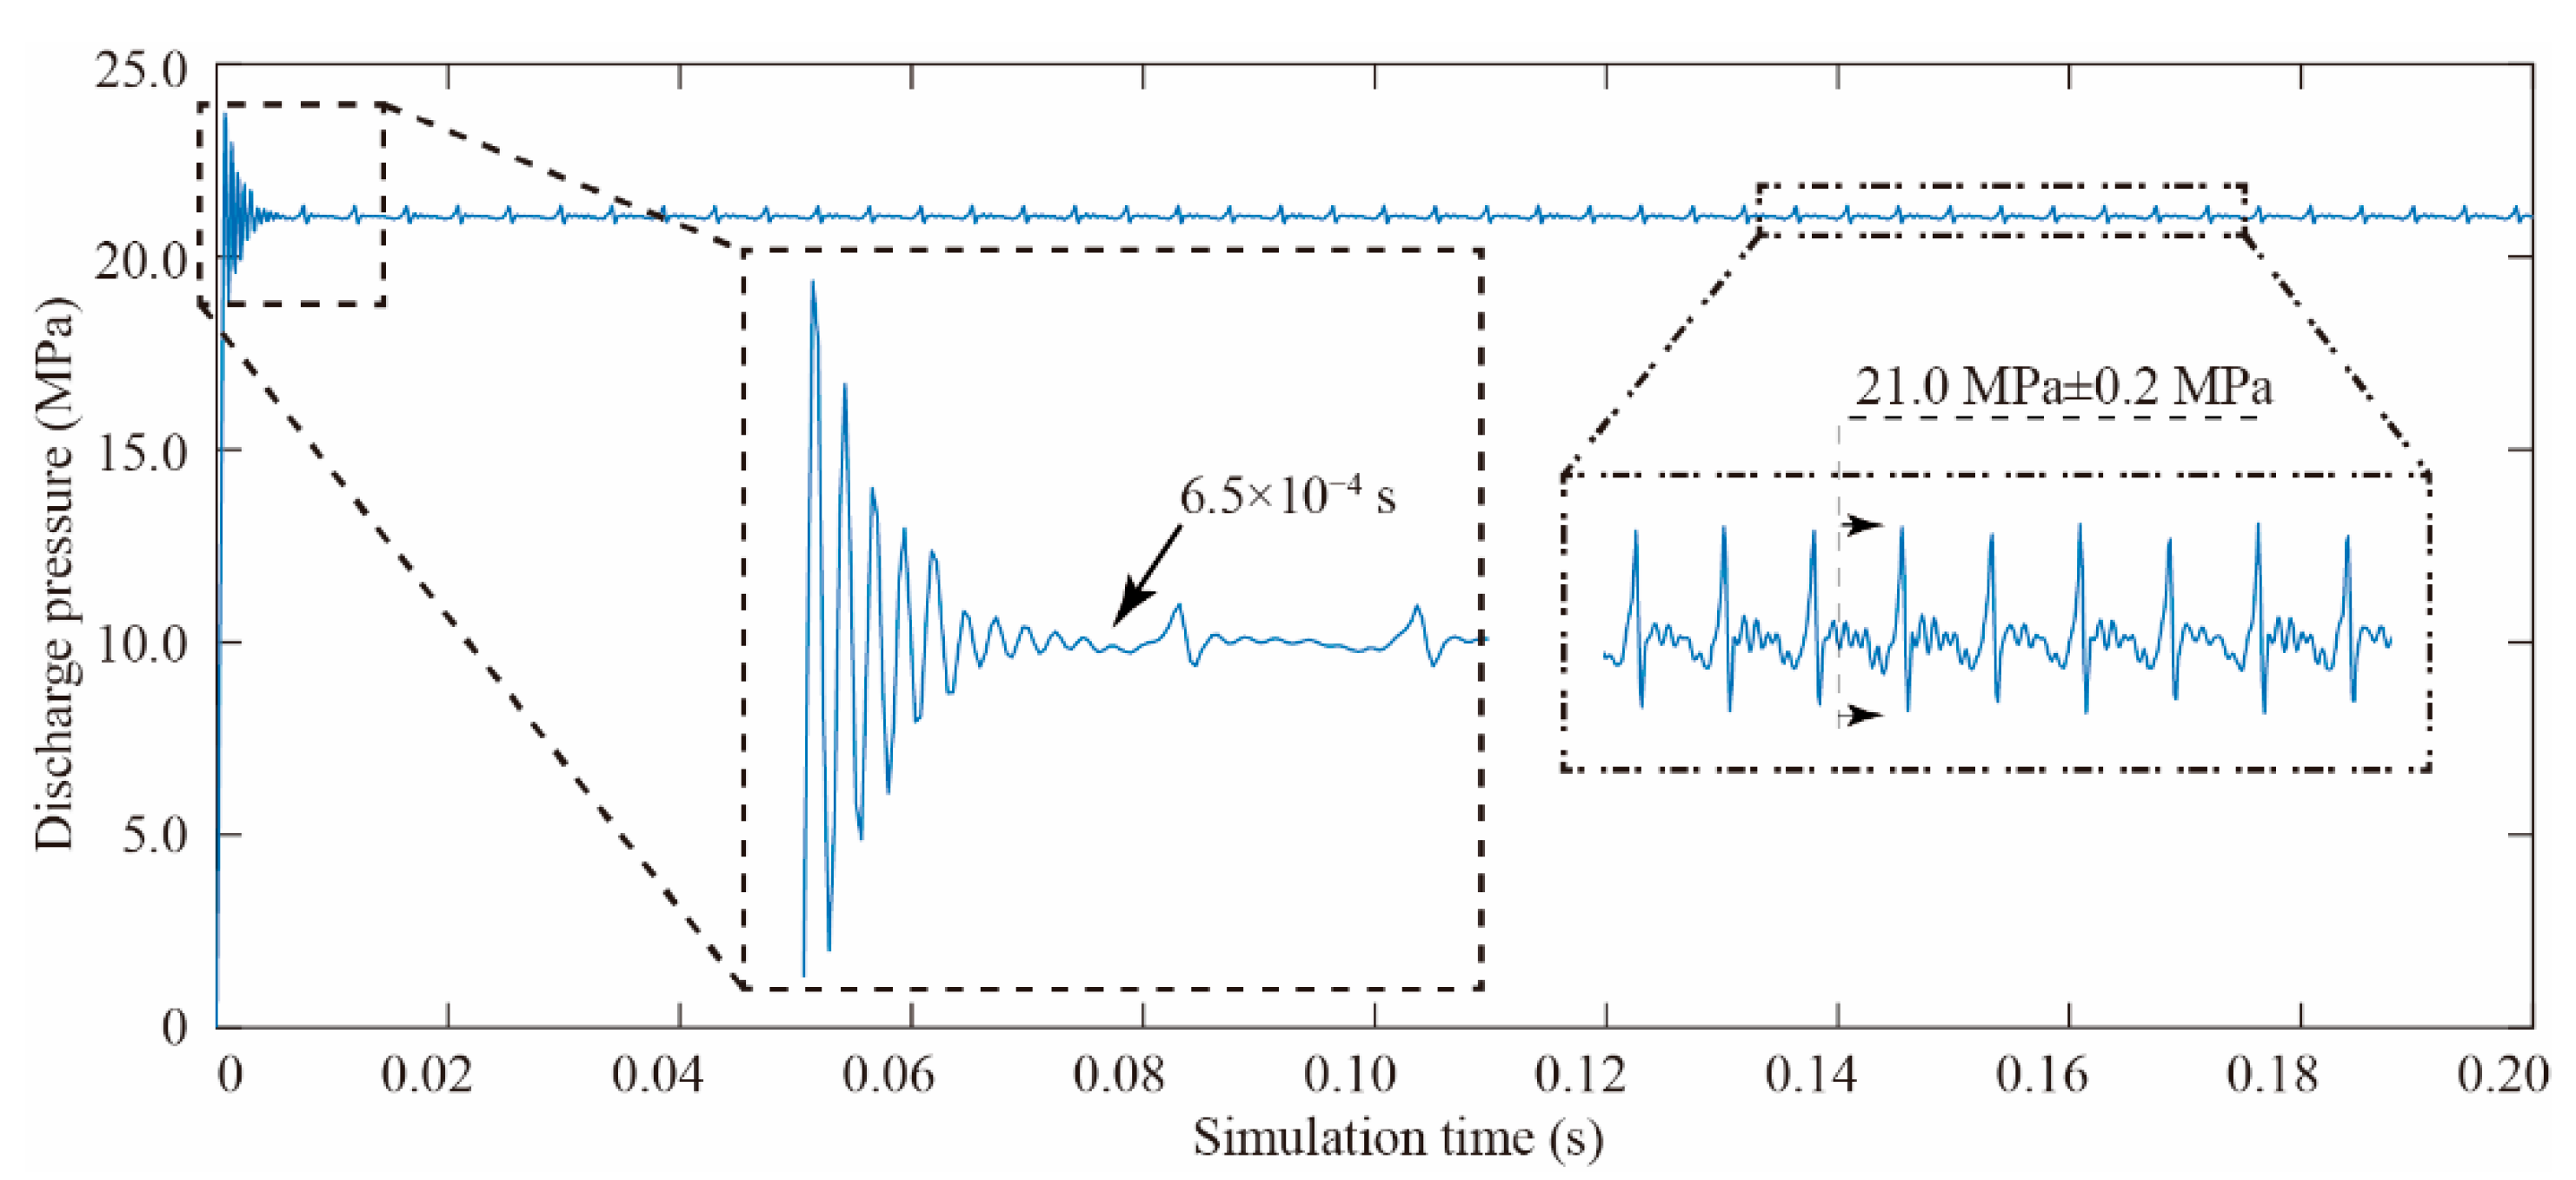
2.1. Discharge Pressure
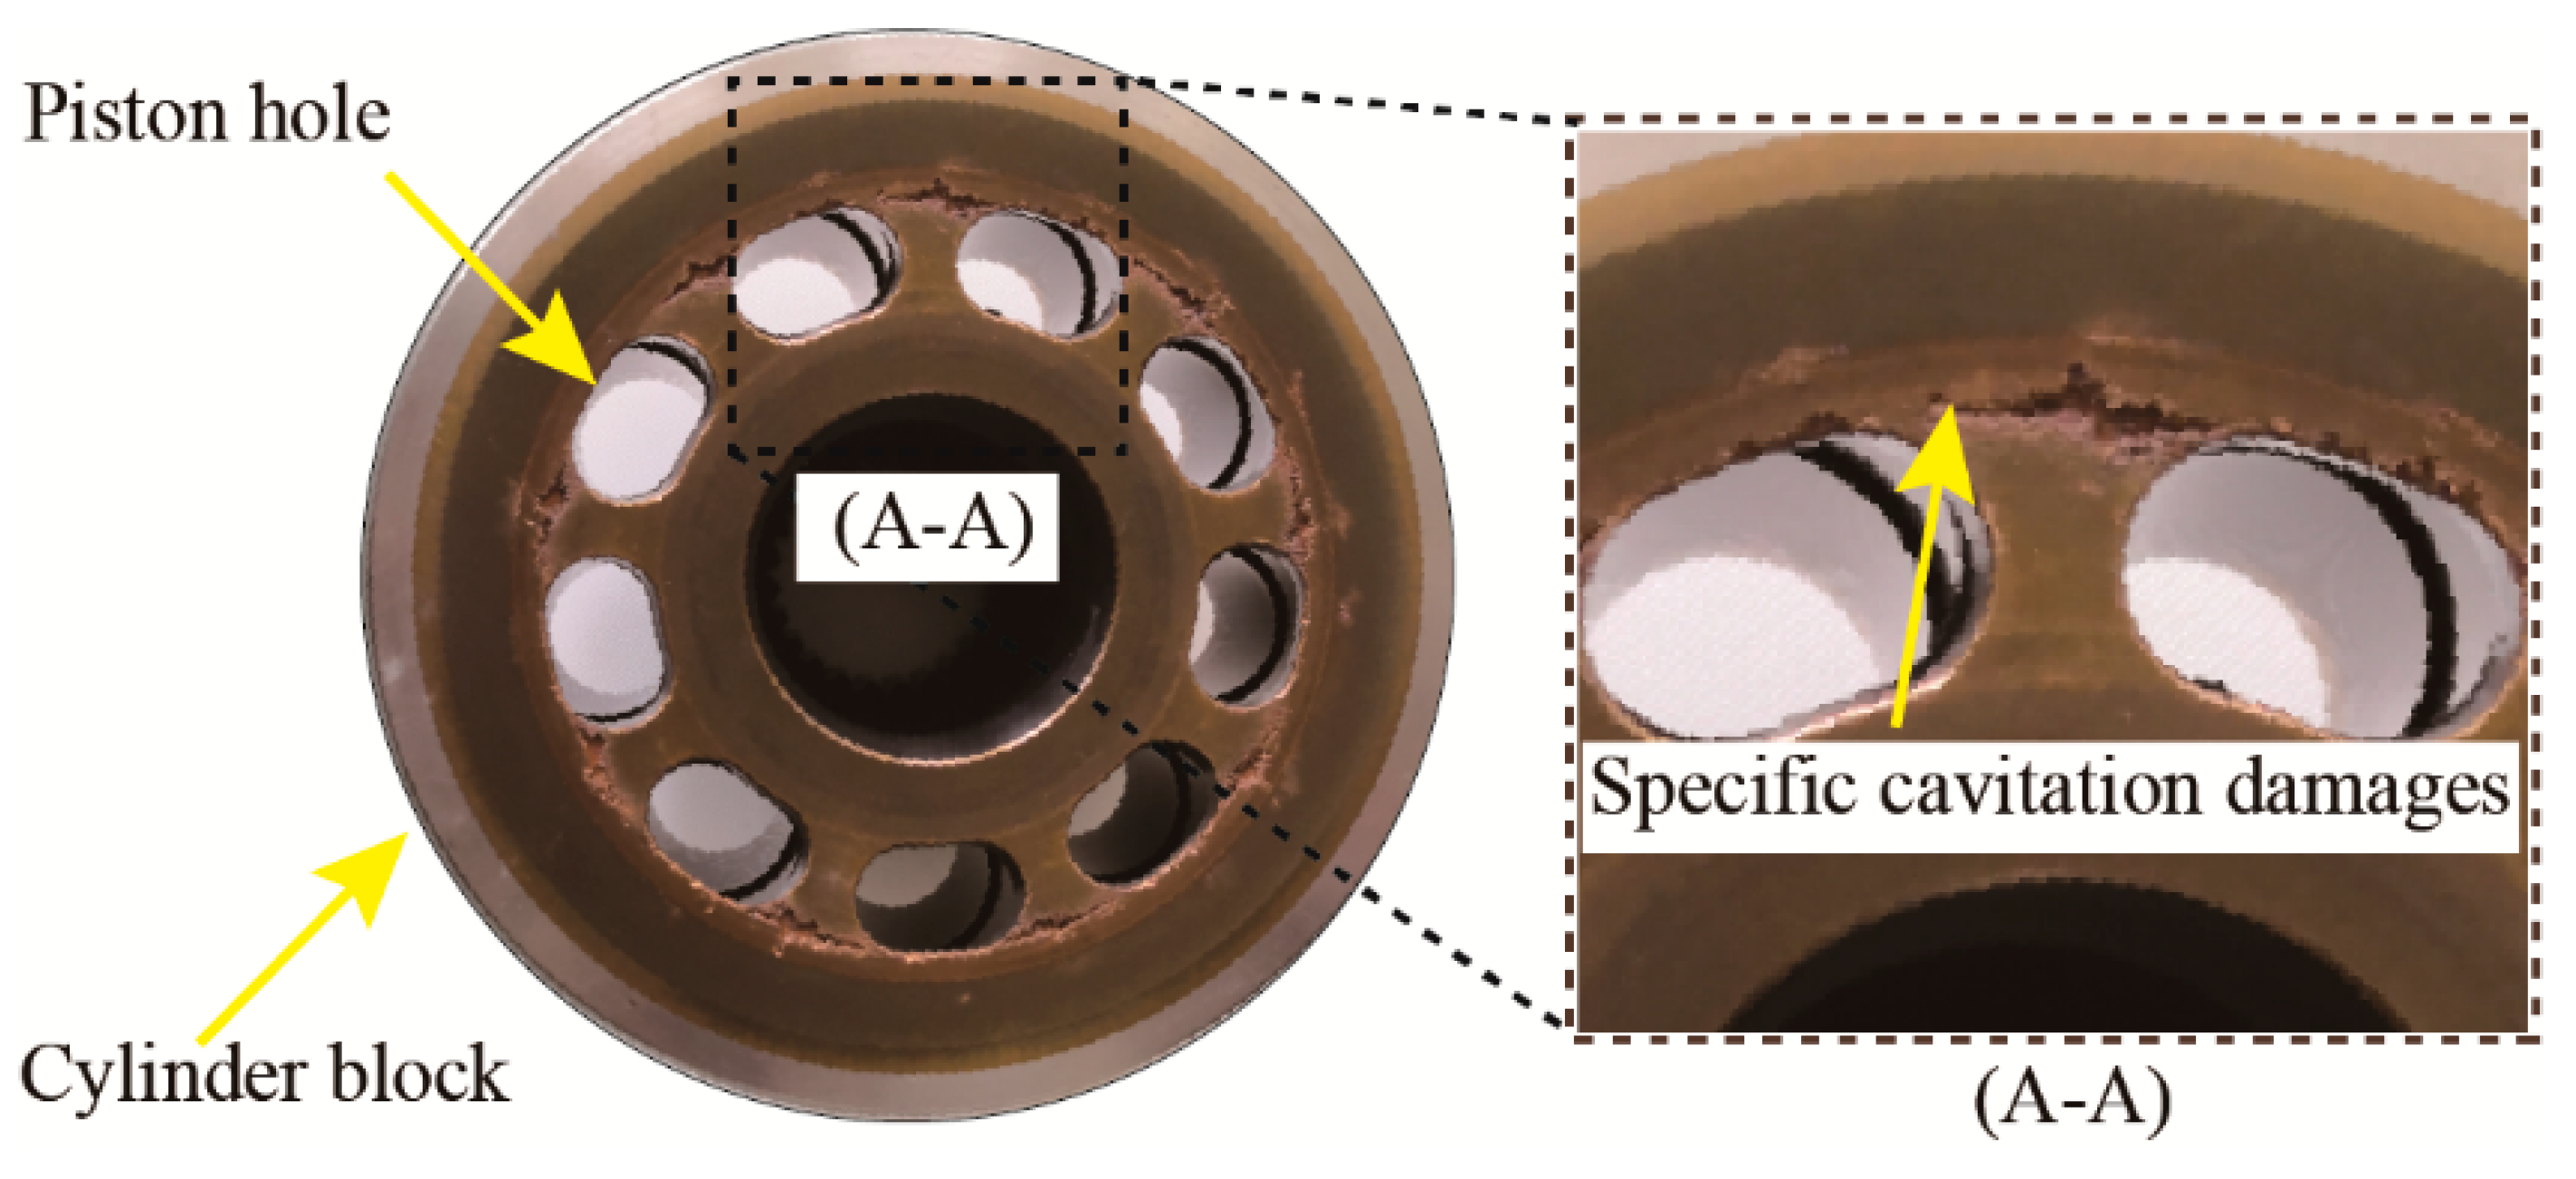
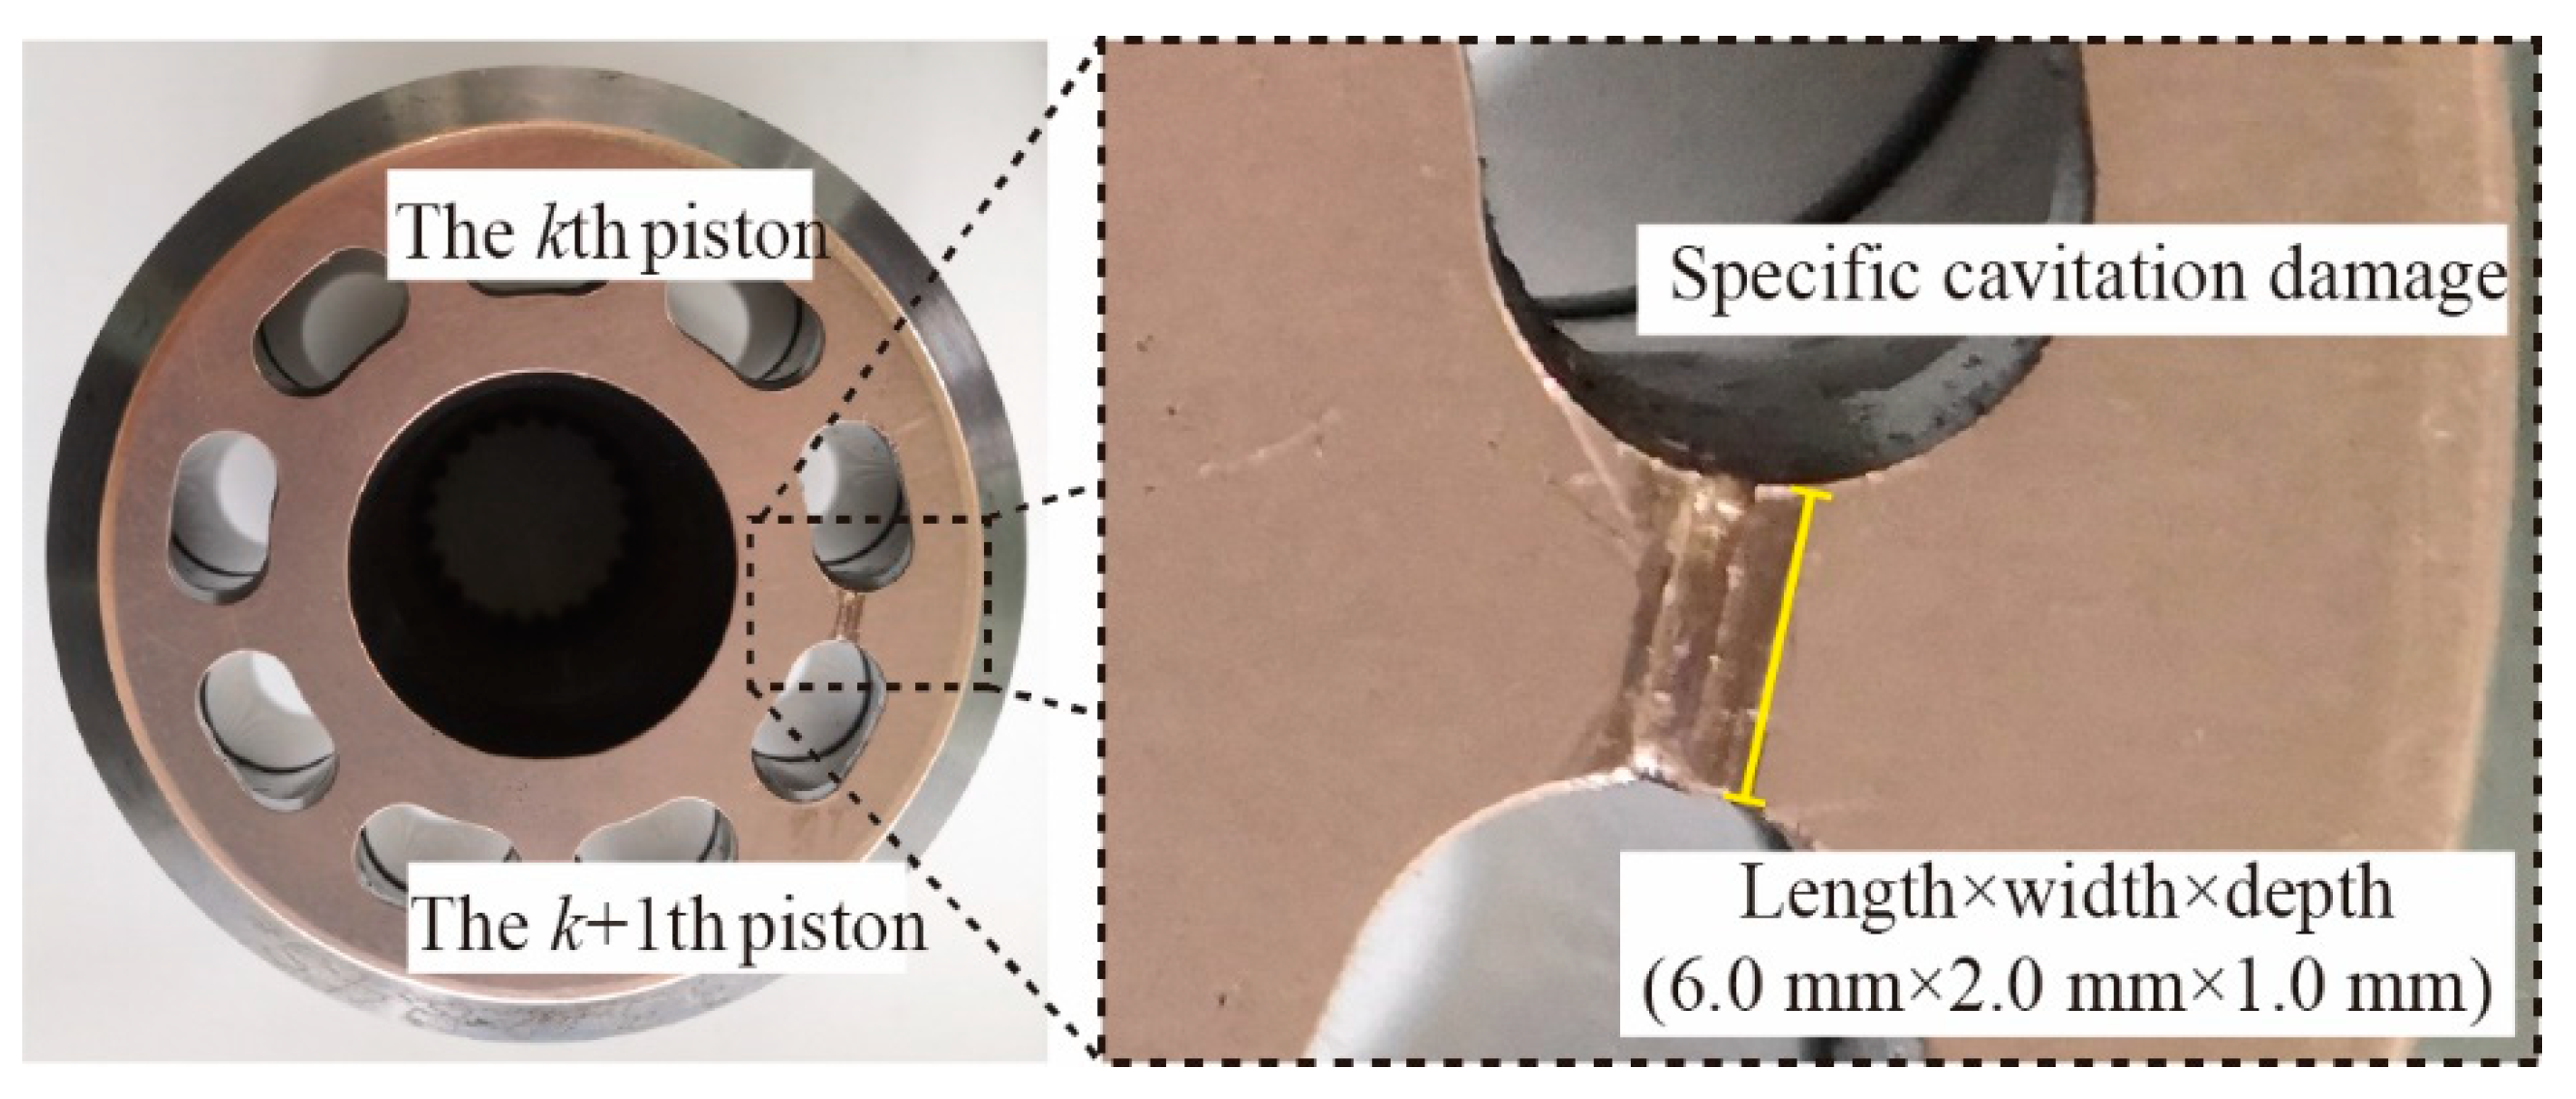
2.2. Input of the Specific Cavitation Damage
2.3. Model Properties
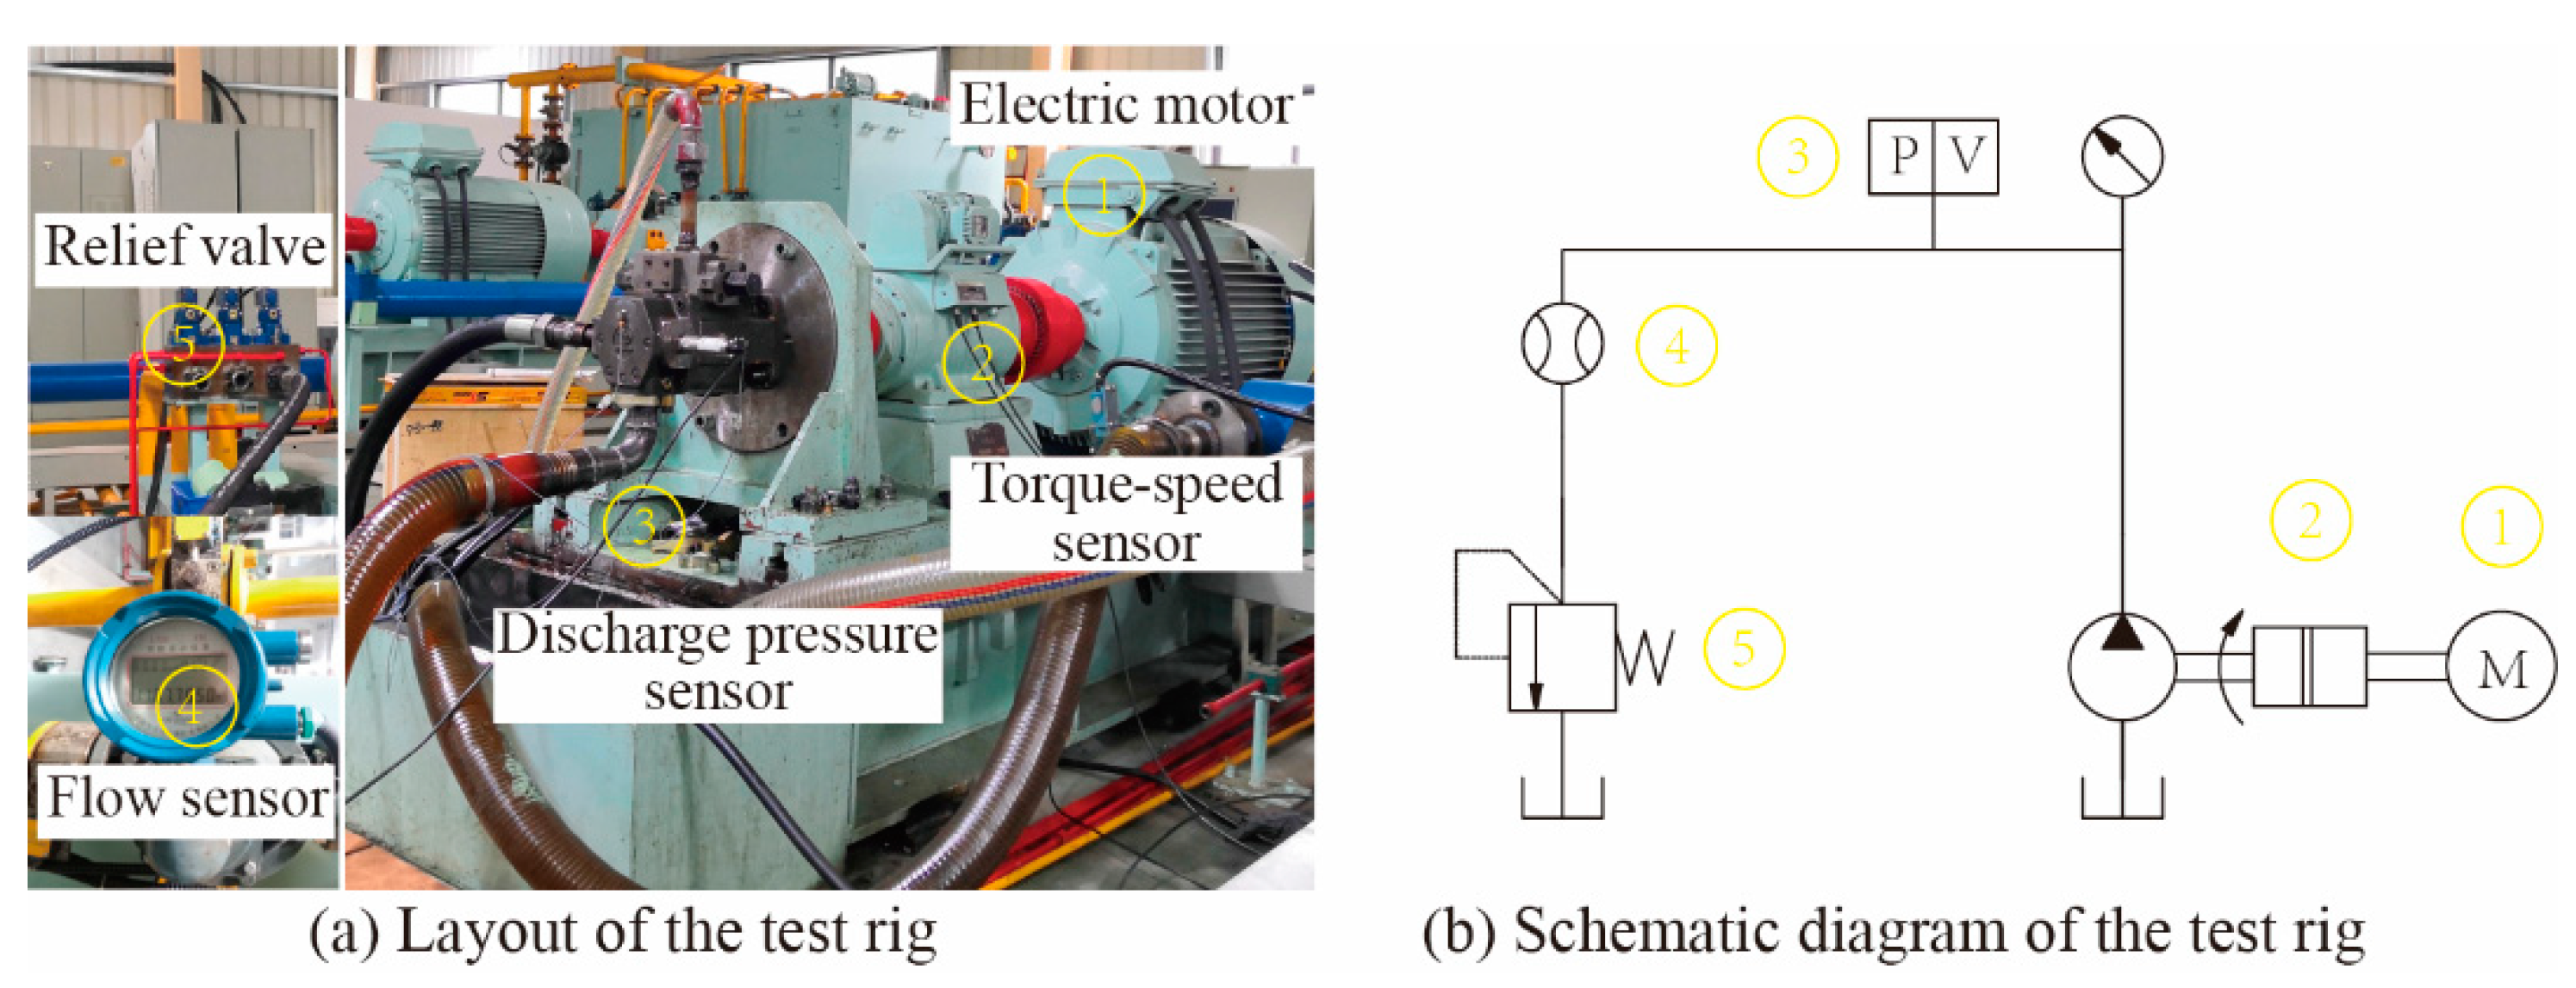
3. Experimental Investigation
3.1. Layout of the Test Rig
3.2. Testing Pump with Cavitation Damage
4. Results and Discussion
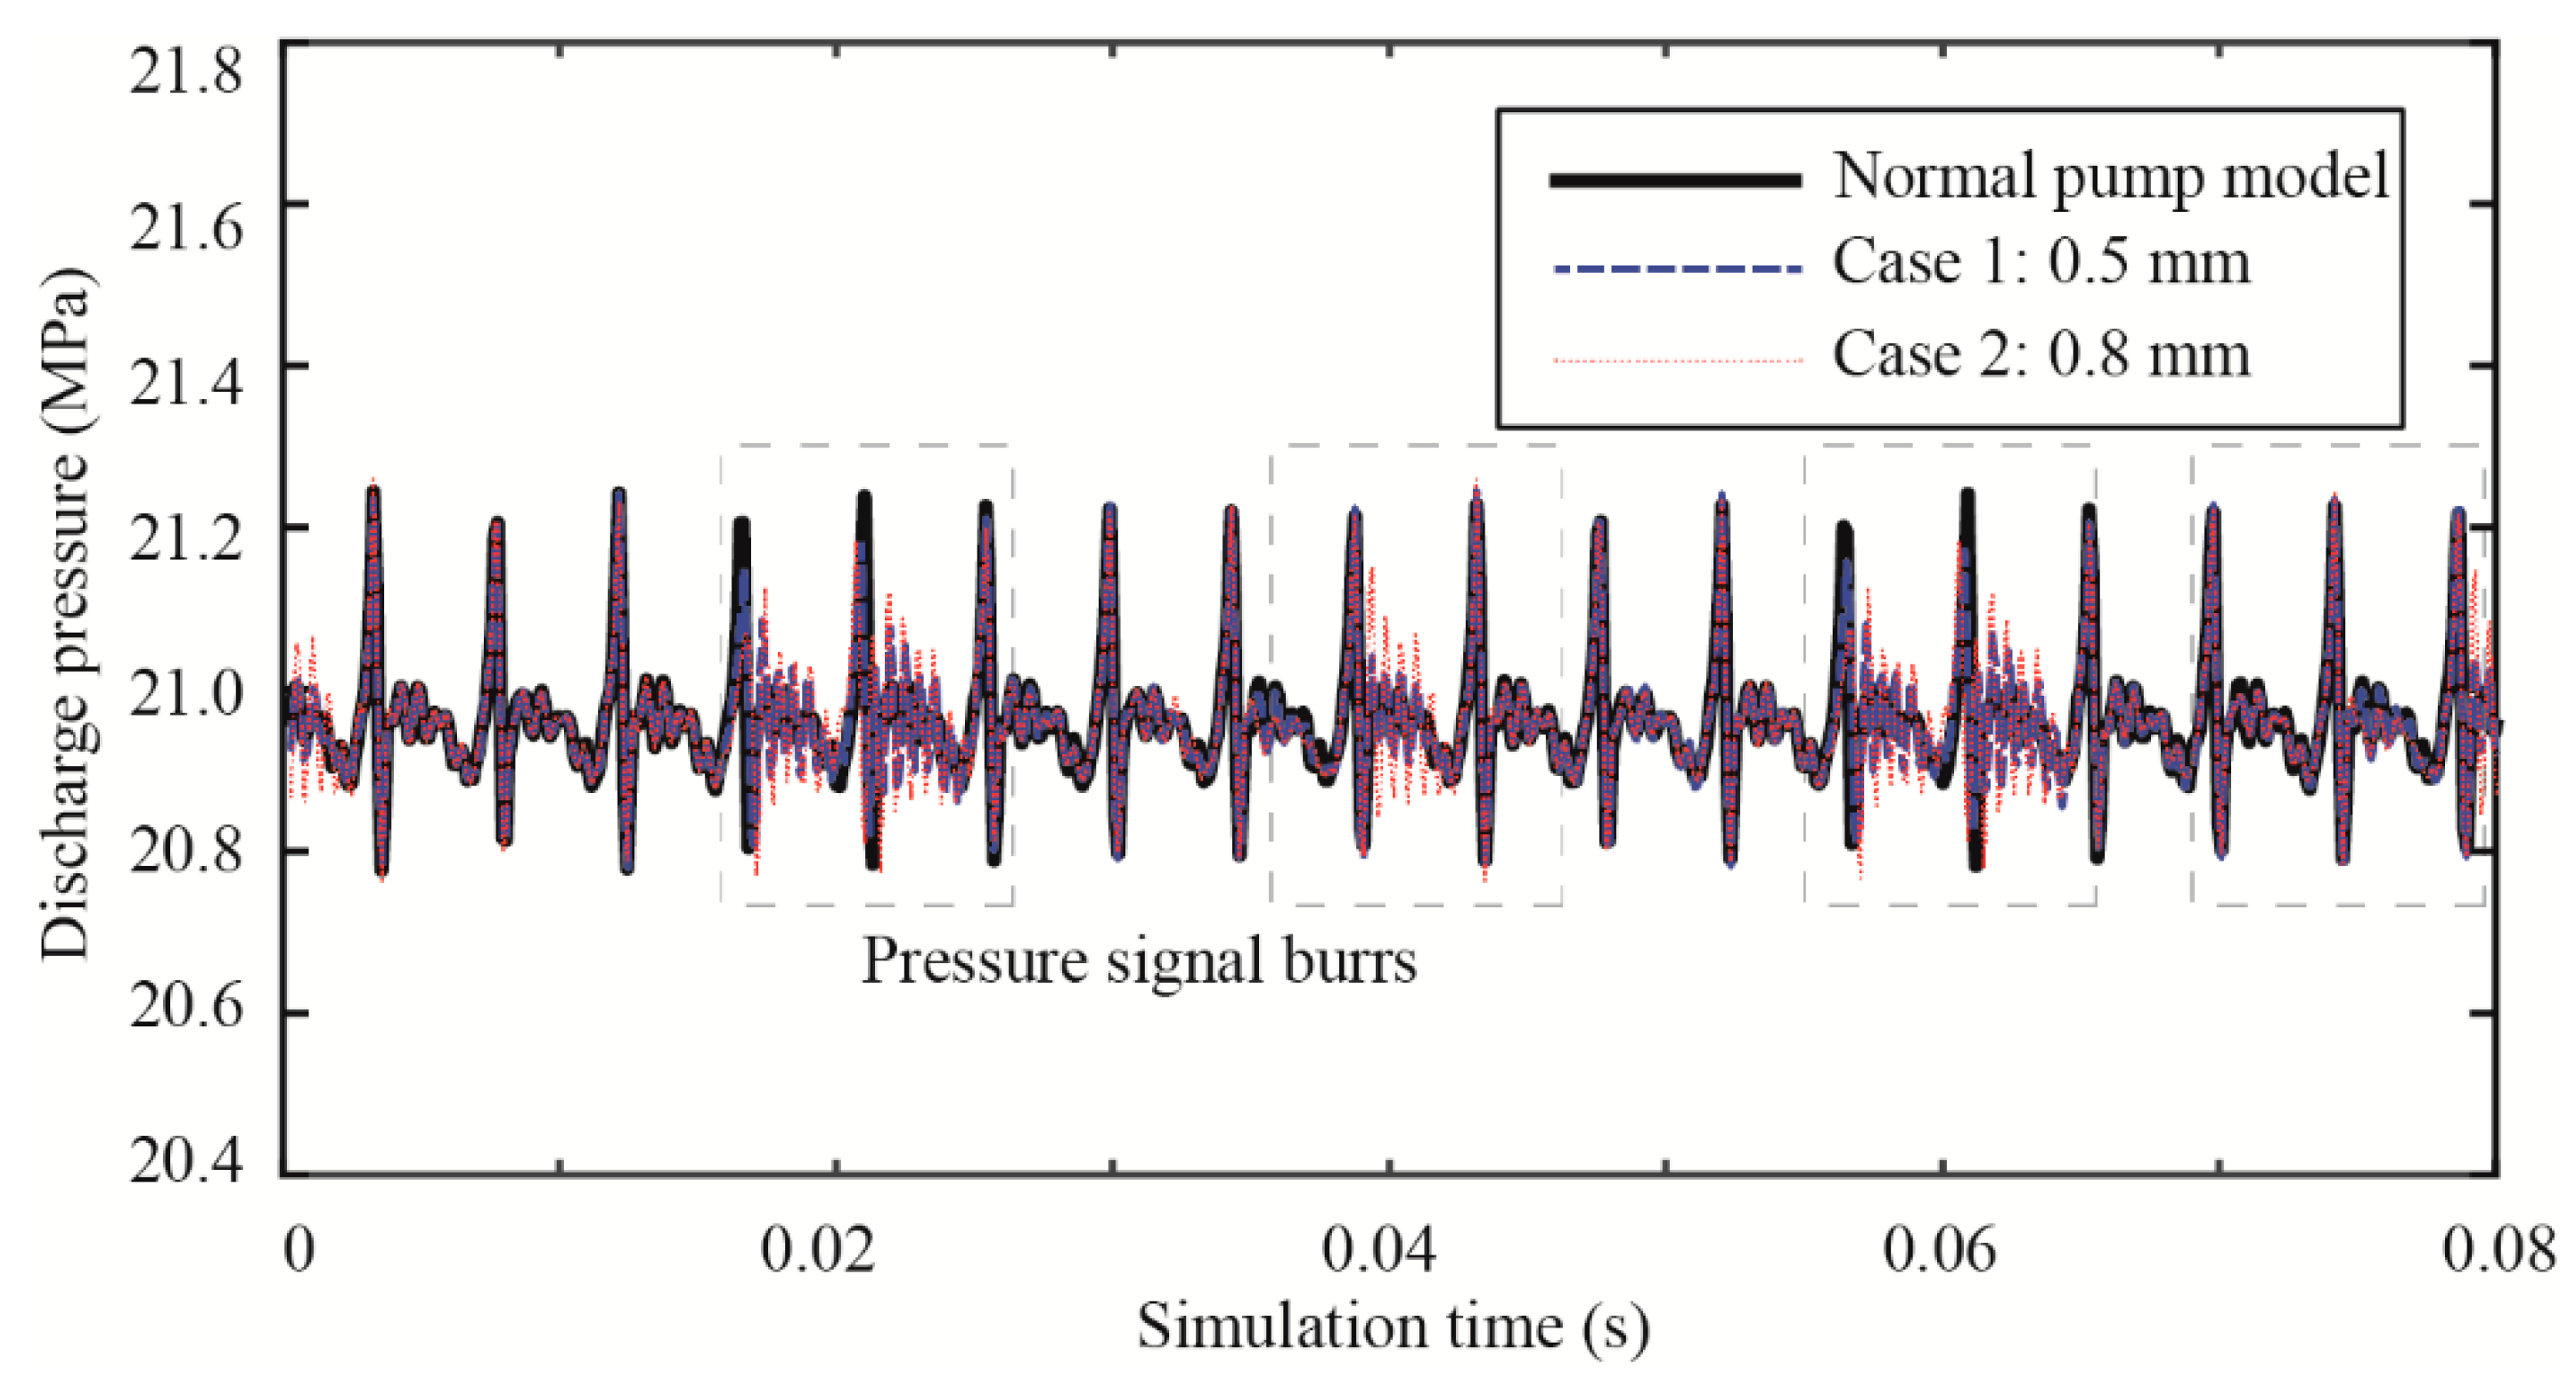
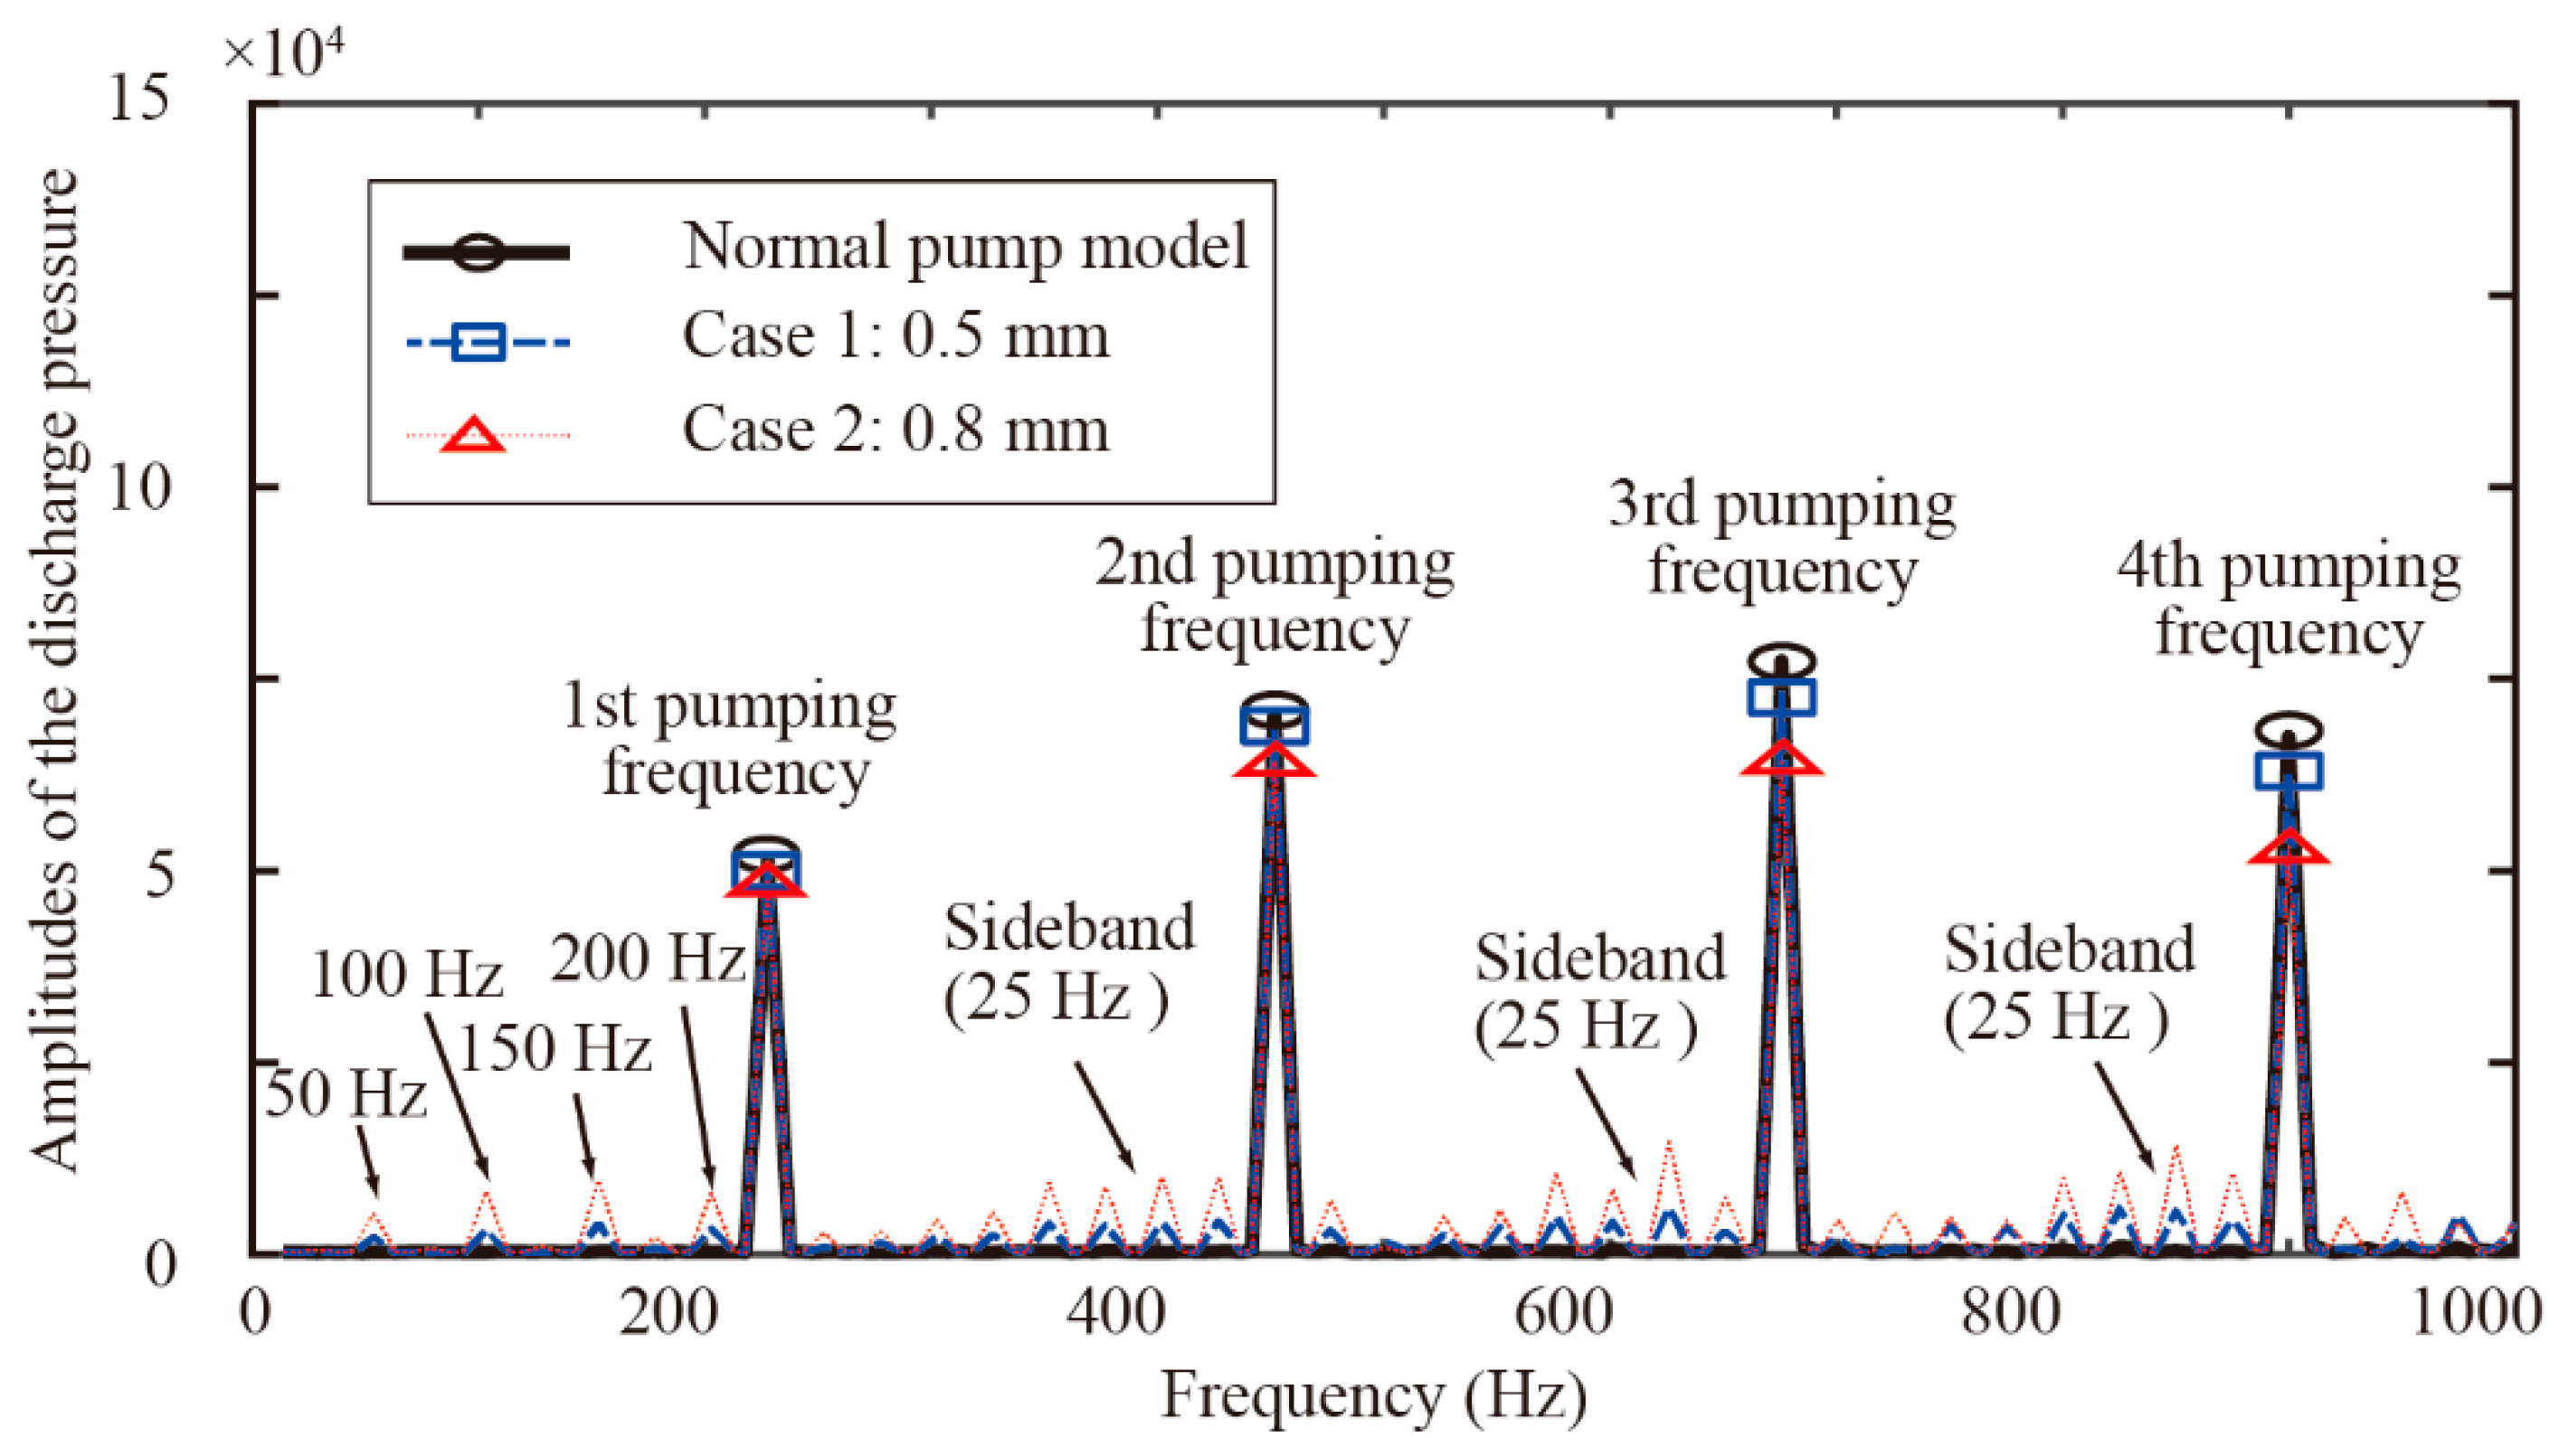
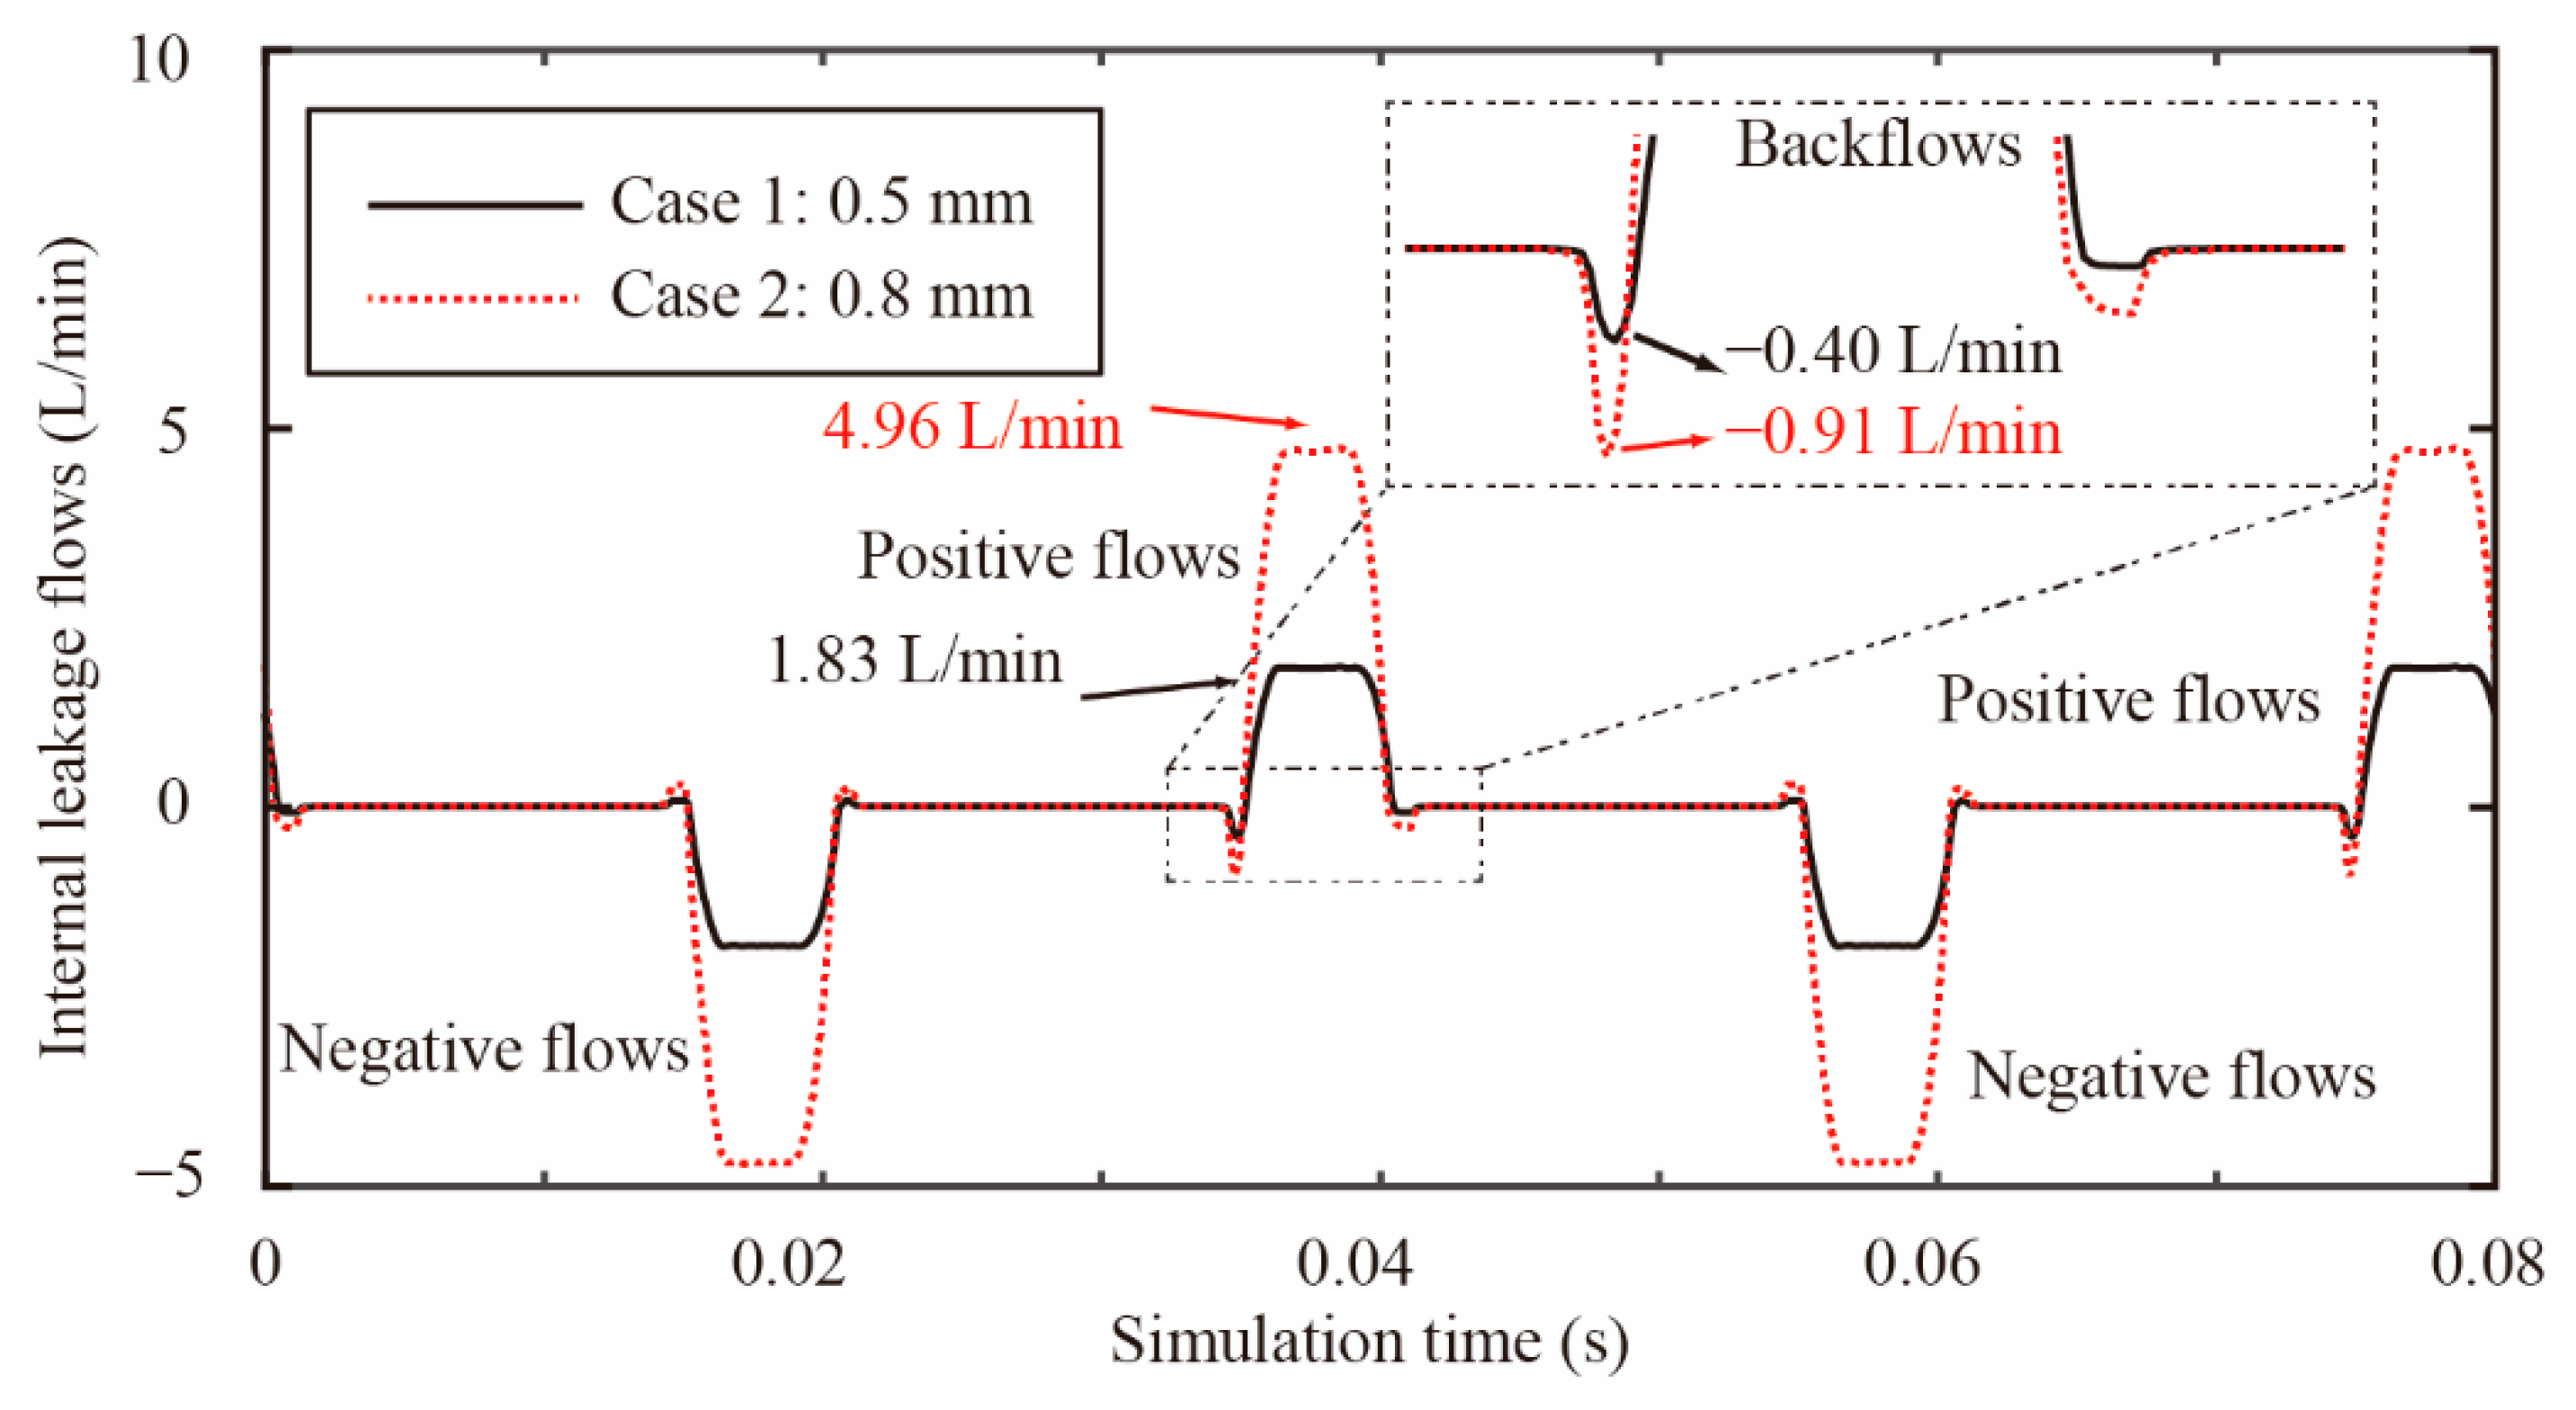
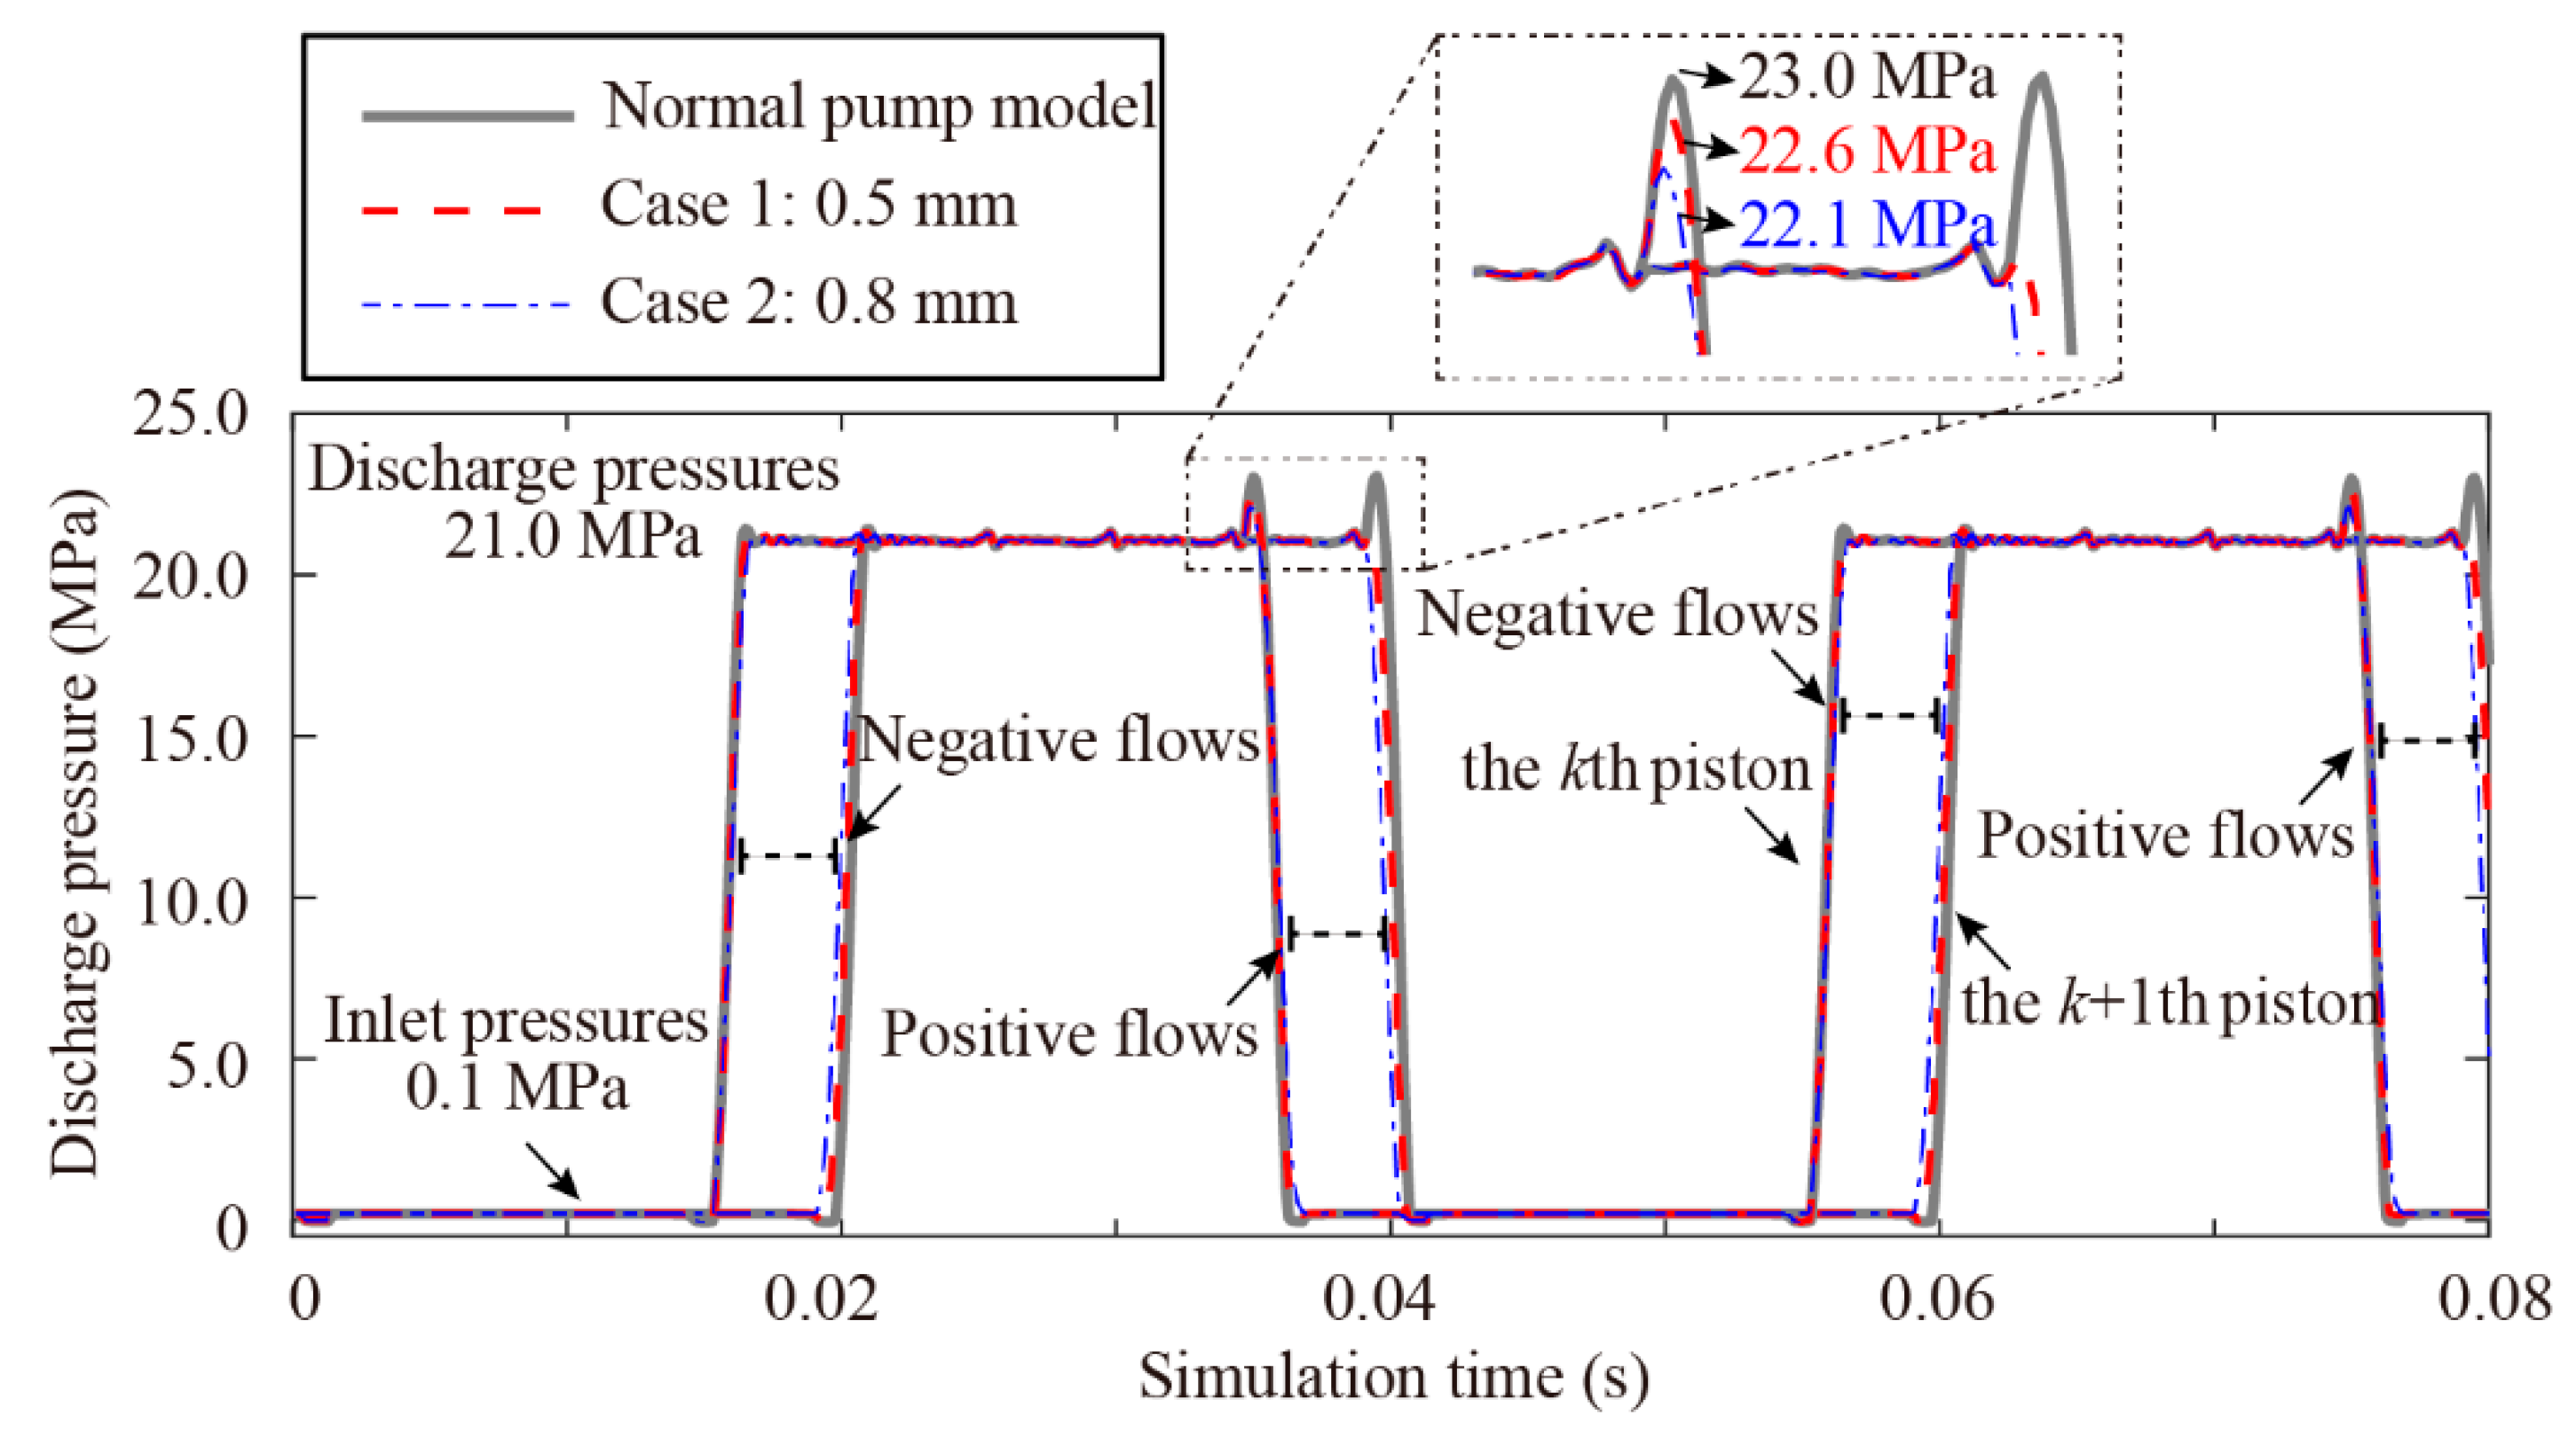
4.1. Simulations
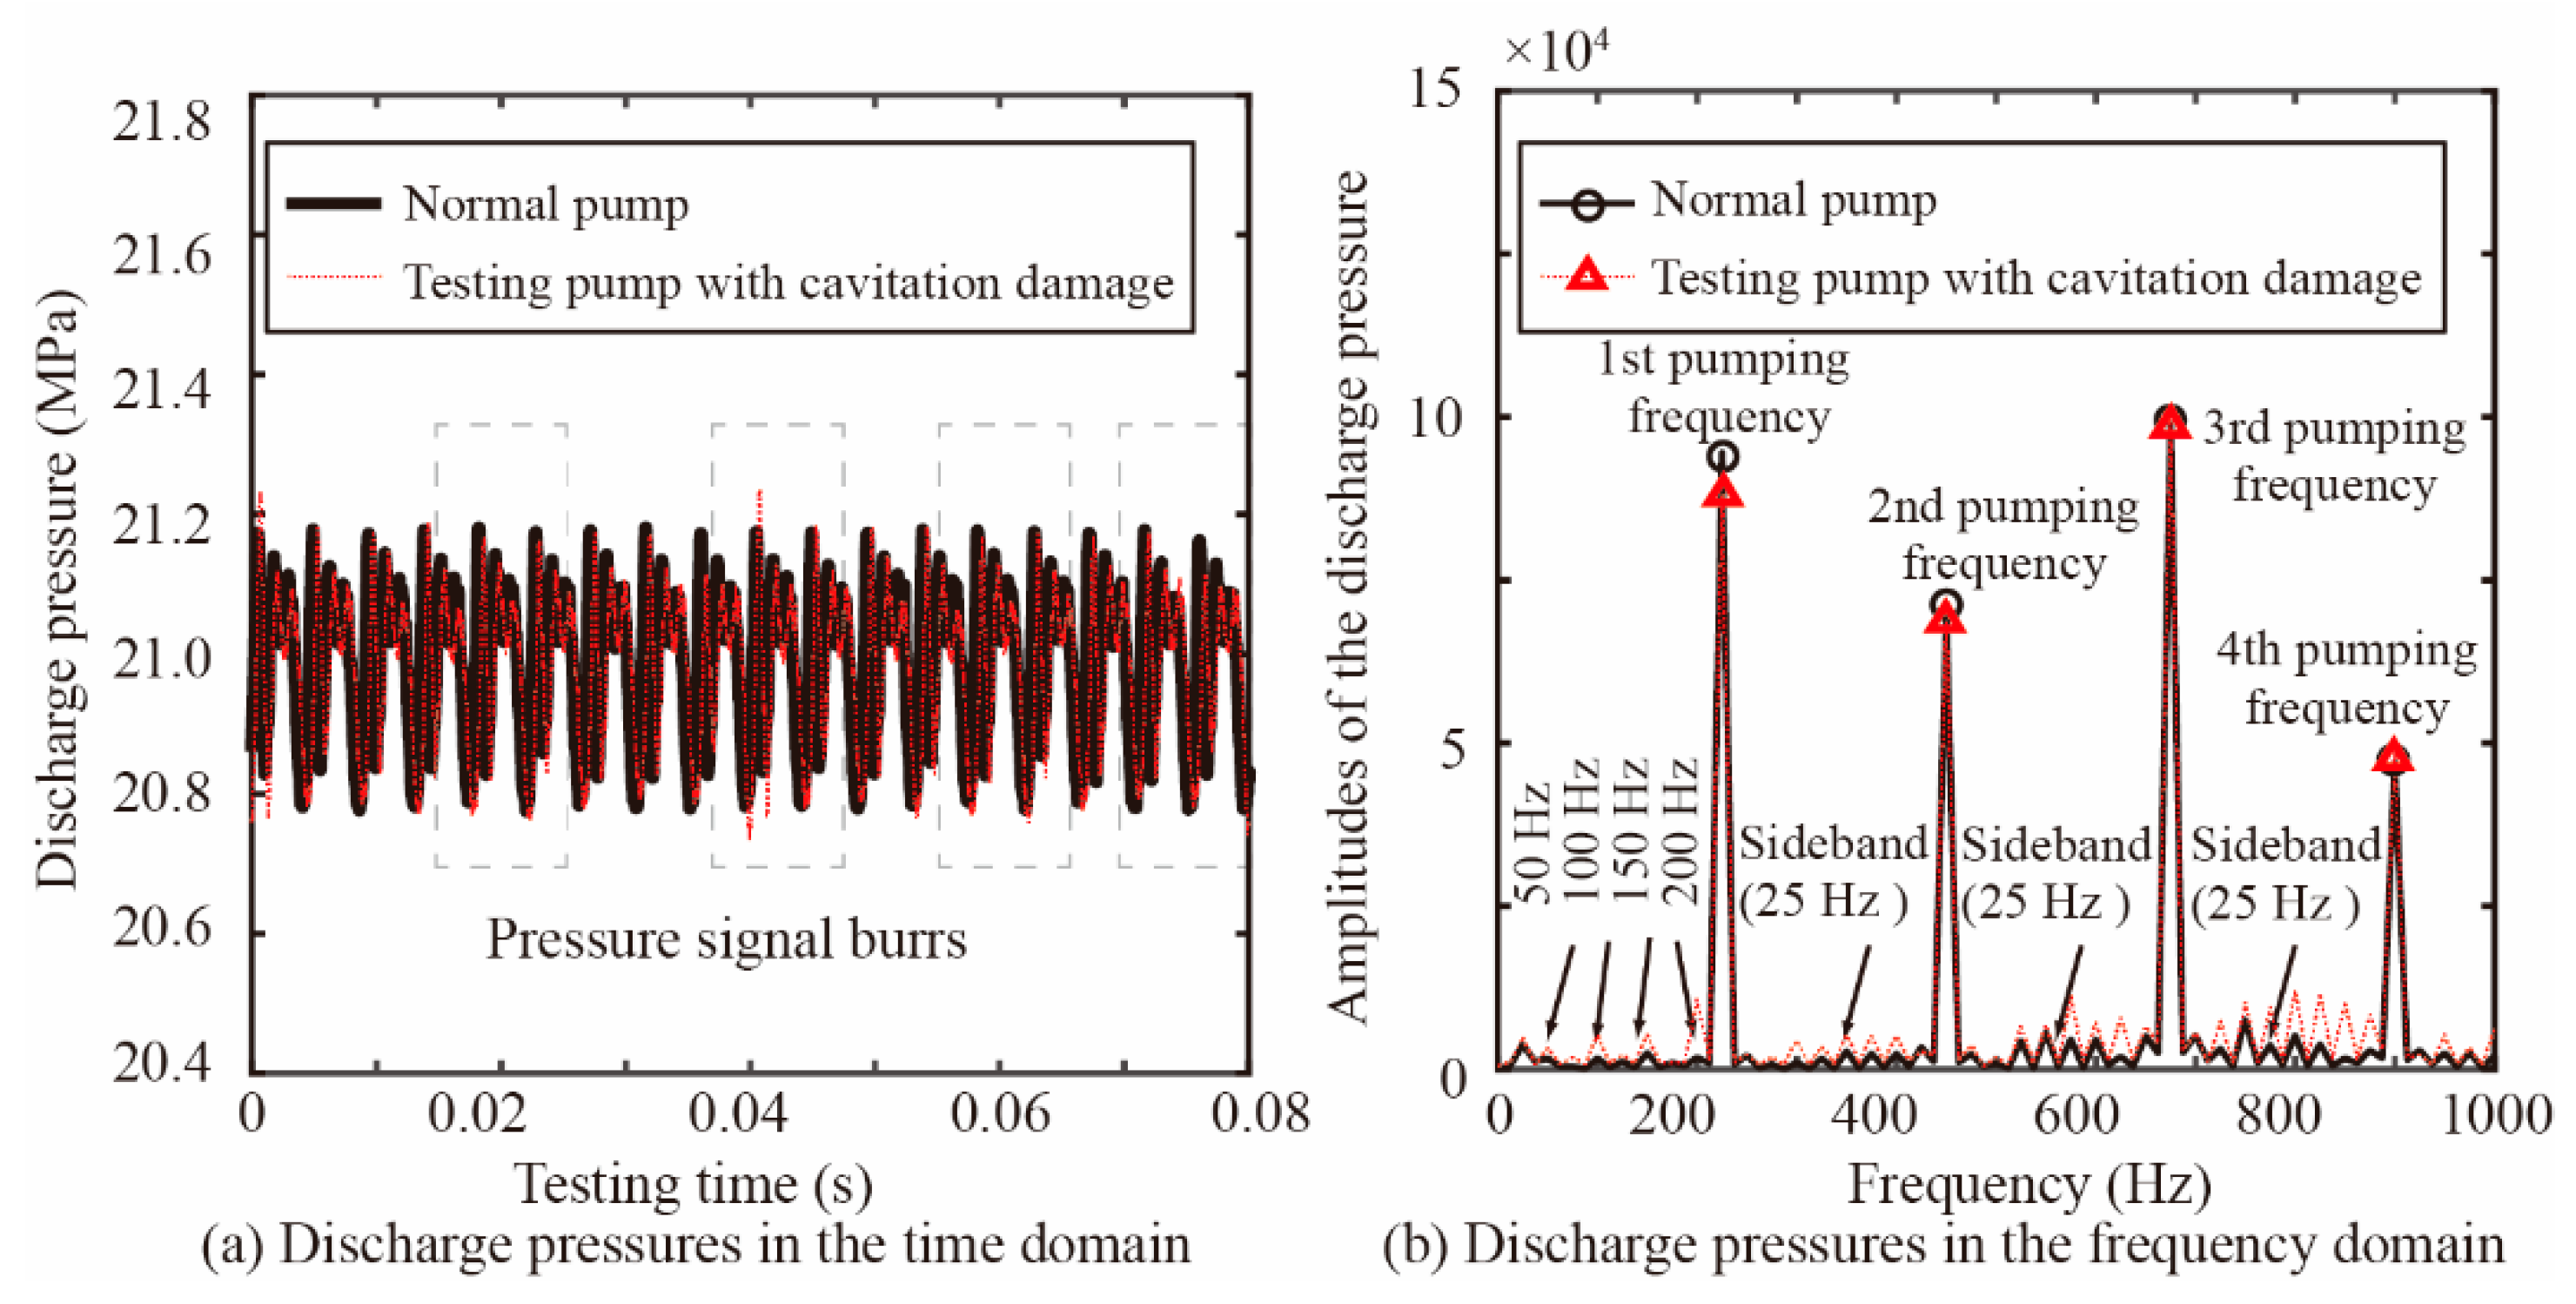
4.2. Cavitation Damage Detection
5. Conclusions
Author Contributions
Funding
Institutional Review Board Statement
Informed Consent Statement
Data Availability Statement
Acknowledgments
Conflicts of Interest
References
- Suh, S.; Kim, W. Nonlinear Position Control Using Differential Flatness Concept with Load Torque Observer for Electro Hydraulic Actuators with Sinusoidal Load Torque. Mathematics 2020, 8, 1484. [Google Scholar] [CrossRef]
- Xu, H.G.; Zhang, J.H.; Sun, G.M.; Huang, W.D.; Huang, X.C.; Lyu, F.; Xu, B.; Su, Q. The direct measurement of the cylinder block dynamic characteristics based on a non-contact method in an axial piston pump. Measurement 2021, 167, 108279. [Google Scholar] [CrossRef]
- Casoli, P.; Vacca, A.; Franzoni, G.; Berta, G.L. Modelling of fluid properties in hydraulic positive displacement machines. Simul. Model. Pract. Theory 2006, 14, 1059–1072. [Google Scholar] [CrossRef]
- He, Y.; Tang, H.; Ren, Y.; Kumar, A. A deep multi-signal fusion adversarial model based transfer learning and residual network for axial piston pump fault diagnosis. Measurement 2022, 192, 110889. [Google Scholar] [CrossRef]
- Chao, Q.; Zhang, J.; Xu, B.; Wang, Q. Multi-position measurement of oil film thickness within the slipper bearing in axial piston pumps. Measurement 2018, 122, 66–72. [Google Scholar] [CrossRef]
- Richardson, D.; Sadeghi, F.; Rateick, R.G.; Rowan, S. Experimental and Analytical Investigation of Floating Valve Plate Motion in an Axial Piston Pump. Tribol. Trans. 2017, 60, 537–547. [Google Scholar] [CrossRef]
- Zhang, C.C.; Zhu, C.H.; Meng, B.; Li, S. Challenges and Solutions for High-Speed Aviation Piston Pumps: A Review. Aerospace 2021, 8, 392. [Google Scholar] [CrossRef]
- Brijkishore; Khare, R.; Prasad, V. Prediction of cavitation and its mitigation techniques in hydraulic turbines-A review. Ocean Eng. 2021, 221, 108512. [Google Scholar] [CrossRef]
- Wang, X.; Zhou, S.; Shan, Z.; Yin, M. Investigation of Cavitation Bubble Dynamics Considering Pressure Fluctuation Induced by Slap Forces. Mathematics 2021, 9, 2064. [Google Scholar] [CrossRef]
- Yun, L.; Yan, Z.; Jianping, C.; Rongsheng, Z.; Dezhong, W. A cavitation performance prediction method for pumps: Part2-sensitivity and accuracy. Nucl. Eng. Technol. 2021, 53, 3612–3624. [Google Scholar] [CrossRef]
- Osterland, S.; Muller, L.; Weber, J. Influence of Air Dissolved in Hydraulic Oil on Cavitation Erosion. Int. J. Fluid Power 2021, 22, 373–392. [Google Scholar] [CrossRef]
- Chao, Q.; Zhang, J.H.; Xu, B.; Huang, H.P.; Zhai, J. Centrifugal effects on cavitation in the cylinder chambers for high-speed axial piston pumps. Meccanica 2019, 54, 815–829. [Google Scholar] [CrossRef]
- Chao, Q.; Xu, Z.; Tao, J.F.; Liu, C.L.; Zhai, J. Cavitation in a high-speed aviation axial piston pump over a wide range of fluid temperatures. Proc. Inst. Mech. Eng. Part A J. Power Energy 2021, 236, 727–737. [Google Scholar] [CrossRef]
- Sun, Z.G.; Li, Y.D.; Liang, N.; Zhong, H.M. Study on Restraining Cavitation of Axial Piston Pump Based on Structure of Cylinder Block and Valve Plate Triangular Throttling Groove. Shock Vib. 2022, 1, 6918936. [Google Scholar]
- Zhao, B.; Guo, W.W.; Quan, L. Cavitation of a Submerged Jet at the Spherical Valve Plate/Cylinder Block Interface for Axial Piston Pump. Chin. J. Mech. Eng. 2020, 33, 67. [Google Scholar] [CrossRef]
- Sachdeva, A.; Borkar, K.; Bhansali, A.; Salutagi, S. Critical Inlet Pressure Prediction for Inline Piston Pumps Using Multiphase Computational Fluid Dynamics Modelling. SAE Int. J. Aerosp. 2021, 14, 117–126. [Google Scholar] [CrossRef]
- Manhartsgruber, B. Non-linear dynamics of a hydraulic piston pump model with long suction line and cavitation. In Proceedings of the International Workshop on Power Transmission and Motion Control, Bath, UK, 15 August 2003. [Google Scholar]
- Shi, Y.X.; Lin, T.R.; Meng, G.Y.; Huang, J.X. A Study on the Suppression of Cavitation Flow Inside an Axial Piston Pump. In Proceedings of the Prognostics and System Health Management Conference, Chengdu, China, 19 January 2017. [Google Scholar]
- Ye, S.G.; Zhang, J.H.; Xu, B.; Song, W.; Chen, L.; Shi, H.Y.; Zhu, S.Q. Experimental and numerical studies on erosion damage in damping holes on the valve plate of an axial piston pump. J. Mech. Sci. Technol. 2017, 31, 4285–4295. [Google Scholar] [CrossRef]
- Lu, L.; Fu, X.; Ryu, S.; Yin, Y.B.; Shen, Z.X. Comprehensive discussions on higher back pressure system performance with cavitation suppression using high back pressure. Proc. Inst. Mech. Eng. Part C J. Mech. Eng. Sci. 2018, 233, 2442–2455. [Google Scholar] [CrossRef]
- Manhartsgruber, B. A novel concept for boosting the suction line of piston pumps by piezo-actuated pipe walls. In Proceedings of the Bath/Asme Symposium on Fluid Power and Motion Control, Bath, UK, 12 September 2018. [Google Scholar]
- Fang, Y.; Zhang, J.H.; Xu, B.; Mao, Z.B.; Li, C.M.; Huang, C.S.; Lyu, F.; Guo, Z.M. Raising the Speed Limit of Axial Piston Pumps by Optimizing the Suction Duct. Chin. J. Mech. Eng. 2021, 34, 105–117. [Google Scholar] [CrossRef]
- Zhang, B.; Zhao, C.X.; Hong, H.C.; Cheng, G.Z.; Yang, H.Y.; Feng, S.B.; Zhai, J.; Xiao, W.H. Optimization of the outlet unloading structure to prevent gaseous cavitation in a high-pressure axial piston pump. Proc. Inst. Mech. Eng. Part C J. Mech. Eng. Sci. 2022, 236, 3459–3473. [Google Scholar] [CrossRef]
- Yin, F.L.; Nie, S.L.; Xiao, S.H.; Hou, W. Numerical and experimental study of cavitation performance in sea water hydraulic axial piston pump. Proc. Inst. Mech. Eng. Part I J. Syst. Control. Eng. 2016, 230, 716–735. [Google Scholar] [CrossRef]
- Jablonska, J.; Kozubkova, M.; Mahdal, M.; Marcalik, P.; Tuma, J.; Bojko, M.; Hruzik, L. Spectral analysis of gaseous cavitation in water through multiphase mathematical and acoustic methods. Phys. Fluids 2021, 33, 085128. [Google Scholar] [CrossRef]
- Dong, H.K.; Wang, Y.; Chen, J.H. First attempt to determine the critical inlet pressure for aircraft pumps with a numerical approach that considers vapor cavitation and air aeration. Proc. Inst. Mech. Eng. Part G J. Aerosp. Eng. 2020, 234, 1926–1938. [Google Scholar] [CrossRef]
- Chao, Q.; Tao, J.F.; Lei, J.B.; Wei, X.L.; Liu, C.L.; Wang, Y.H.; Meng, L.H. Fast scaling approach based on cavitation conditions to estimate the speed limitation for axial piston pump design. Front. Mech. Eng. 2021, 16, 176–185. [Google Scholar] [CrossRef]
- Chao, Q.; Wei, X.; Lei, J.; Tao, J.; Liu, C. Improving accuracy of cavitation severity recognition in axial piston pumps by denoising time–frequency images. Meas. Sci. Technol. 2022, 33, 055116. [Google Scholar] [CrossRef]
- Chao, Q.; Tao, J.F.; Wei, X.L.; Wang, Y.H.; Meng, L.H.; Liu, C.L. Cavitation intensity recognition for high-speed axial piston pumps using 1-D convolutional neural networks with multi-channel inputs of vibration signals. Alex. Eng. J. 2020, 59, 4463–4473. [Google Scholar] [CrossRef]
- Siano, D.; Panza, M.A. Diagnostic method by using vibration analysis for pump fault detection. Energy Procedia 2018, 148, 10–17. [Google Scholar] [CrossRef]
- Zhai, J.; Zhou, H. Model and Simulation on Flow and Pressure Characteristics of Axial Piston Pump for Seawater Desalination. In Proceedings of the International Conference on Mechatronics and Applied Mechanics, Hong Kong, China, 27 December 2011. [Google Scholar]
- Guo, M.; Liu, C.; Liu, S.Q.; Ke, Z.F.; Wei, W.; Yan, Q.D.; Khoo, B.C. Detection and evaluation of cavitation in the stator of a torque converter using pressure measurement. Phys. Fluids 2022, 34, 045124. [Google Scholar] [CrossRef]
- Xia, S.; Zhang, J.; Ye, S.; Xu, B.; Xiang, J.; Tang, H. A mechanical fault detection strategy based on the doubly iterative empirical mode decomposition. Appl. Acoust. 2019, 155, 346–357. [Google Scholar] [CrossRef]


| Parameters | Values | Parameters | Values |
|---|---|---|---|
| γ | 5° | β | 14° |
| R | 36.75 mm | Z | 9 |
| ωs | 1500 r/min | rp | 8.50 mm |
| hc1 | 0.01 mm | x0 | 8.89 mm |
| Ple | 0.10 MPa | λ | 0.9 |
| rs | 7.70 mm | μ | 46 cP |
| hc2 | 0.02 mm | Rs | 9.10 mm |
| hc3 | 0.01 mm | ε | 0.01 mm |
| R2 | 23.50 mm | R1 | 20.00 mm |
| R4 | 34.75 mm | R3 | 31.50 mm |
| 𝜑2 | 154° | 𝜑1 | 26° |
| Vout | 48.60 mm3 | Bf | 1.7 × 10⁻² MPa |
| dscd | 0.5 mm/0.8 mm | lscd | 6.0 mm |
| No. | Components | Descriptions |
|---|---|---|
| 1 | Electric motor | ABB-IEL-280M75 |
| 2 | Torque-speed sensor | ZJ-5000/3000-120-02 |
| 3 | Discharge pressure sensor | HM90-0~35MPa-H3V2F1 |
| 4 | Flow sensor | LXB-1 |
| 5 | Relief valve | DBW30B-1-50B/350 |
Publisher’s Note: MDPI stays neutral with regard to jurisdictional claims in published maps and institutional affiliations. |
© 2022 by the authors. Licensee MDPI, Basel, Switzerland. This article is an open access article distributed under the terms and conditions of the Creative Commons Attribution (CC BY) license (https://creativecommons.org/licenses/by/4.0/).
Share and Cite
Xia, S.; Xia, Y.; Xiang, J. Modelling and Fault Detection for Specific Cavitation Damage Based on the Discharge Pressure of Axial Piston Pumps. Mathematics 2022, 10, 2461. https://doi.org/10.3390/math10142461
Xia S, Xia Y, Xiang J. Modelling and Fault Detection for Specific Cavitation Damage Based on the Discharge Pressure of Axial Piston Pumps. Mathematics. 2022; 10(14):2461. https://doi.org/10.3390/math10142461
Chicago/Turabian StyleXia, Shiqi, Yimin Xia, and Jiawei Xiang. 2022. "Modelling and Fault Detection for Specific Cavitation Damage Based on the Discharge Pressure of Axial Piston Pumps" Mathematics 10, no. 14: 2461. https://doi.org/10.3390/math10142461