1. Introduction
Aldehyde dehydrogenase 2 is an enzyme coded by the ALDH2 gene and is needed for alcohol detoxification. Aldehyde dehydrogenase 2 (ALDH2) proteins belong to the aldehyde dehydrogenase family. Aldehyde dehydrogenase is the second enzyme of the essential oxidative pathway of alcohol digestion. Two primary liver isozymes of aldehyde dehydrogenase, cytosolic and mitochondrial, can be differentiated by their subcellular localizations, kinetic properties, and electrophoretic mobilities. Almost all Caucasians have two primary isozymes, while around 50% of East Asians have the cytosolic isozyme but not the mitochondrial isozyme. An astoundingly higher recurrence of intense liquor intoxication among East Asians than among Caucasians can be associated with the absence of a catalytically active type of the mitochondrial isozyme. The expanding exposure to acetaldehyde in people with the catalytically inactive type may also experience more significant susceptibility to various forms of cancer. ALDH2 removes acetaldehyde, a toxic product from ethanol breakdown [
1]. ALDH2 converts acetaldehyde to acetate, which the body can easily digest. ALDH2 plays a crucial role in the pathogenesis of diabetes, cancer, neurodegenerative diseases, and cardiovascular diseases [
2]. ALDH2 deficient people have a more significant risk of alcohol-related cancers such as breast cancer, liver cancer, neck and head cancer, colorectal cancer, and esophageal cancer [
3].
Alcohol metabolism in humans includes two main enzymes, aldehyde dehydrogenase and alcohol dehydrogenase. First, the alcohol is oxidized to acetaldehyde by alcohol dehydrogenase (ADH), and then acetaldehyde is oxidized to non-toxic acetic acid by aldehyde dehydrogenase (ALDH) for evacuation. Amid various ALDH isoenzymes in humans, a mitochondrial enzyme, ALDH2, is the primarily effective enzyme to get rid of acetaldehyde [
4]. Acetaldehyde is converted to acetate for people with the variant ALDH2*1. ALDH2 deficiency is also called alcohol flushing syndrome, a genetic condition that obstructs alcohol metabolism [
5]. ALDH2 deficiency affects 8% of the world population, mainly in East Asia, affecting 36% of the population in East Asia. People carrying the mutant ALDH2*2 are more likely to have various types of cancer. People with ALDH2*2 variants turn red and might have other symptoms like dizziness, headache, heart palpitation, and hypertension after consuming alcohol [
2,
6]. ALDH2 dysfunction leads to various human diseases like diabetes, cancer [
7], stroke, neurodegenerative diseases, and cardiovascular diseases. ALDH2*2 variant encodes a lysine (K) for glutamate (E) substitution at position 487 (E487K), named the ALDH2*2 allele [
8].
Humans have 19 ALDH genes on distinct chromosomes, and among them, ALDH2 is important for ethanol metabolism. The ALDH2 gene is located at chromosome 12 in the locale of q24.2 [
9]. Humans are exposed to acetaldehyde regularly via various sources such as cigarettes, foods, the environment, and beverages, but the highest exposure is due to alcohol consumption [
10]. ALDH2 plays a crucial role in pathological and physiological processes. Utilization of extreme amounts of alcohol impacts worldwide DNA methylation [
11,
12]. DNA methylation gives biomarkers of alcohol consumption, so recognizing epigenetic biomarkers helps diagnose alcohol-related diseases [
13].
In this study, we chose fourteen different species (Homo Sapiens, Pongo abelii, Rattus norvegicus, Amblyraja radiata, Sus scrofa, Meleagris gallopavo, Xenopus tropicalis, Mus pahari, Arvicanthis niloticus, Cricetulus griseus, Danio rerio, Bos taurus, Grammomys surdaster, and Mus musculus) and analyzed the ALDH2 sequence from thirteen non-human species concerning the human ALDH2 sequence and found out the degree of changeability by which the sequences vary from each other. Besides the phylogenetic analysis of these sequences, we conducted a comprehensive study based on physicochemical properties, Shannon entropy, Hurst exponent, secondary structure, and fractal dimension.
The main contributions of this study are as follows:
A comprehensive analysis of ALDH2 gene sequences of various species, including Homo sapiens (human).
Fractal dimension leading to the discovery of the self-similarity within ALDH2 sequences.
Identification of the auto-correlation between sequences by the Hurst exponent.
Phylogenetic analysis of ALDH2 sequences of fourteen species.
The rest of the paper is organized as follows.
Section 2 will illustrate the dataset, feature representation, and methods used in this study.
Section 3 will describe the result and discussion based on various parameters. Finally,
Section 4 will summarize the work done in this paper.
2. Materials and Methods
This section will discuss the dataset used in this study and various features extracted from the ALDH2 sequences. We will also discuss the unsupervised machine learning methods used in this study.
2.1. Dataset
The ALDH2 protein sequences from fourteen species
Pongo abelii (sumatran orangutan),
Homo sapiens (human),
Rattus norvegicus (brown rat),
Amblyraja radiata (thorny skate),
Sus scrofa (domestic pig),
Meleagris gallopavo (wild turkey),
Xenopus tropicalis (western clawed frog),
Mus pahari (gairdner’s shrew-mouse),
Arvicanthis niloticus (african grass rat),
Cricetulus griseus (chinese hamster),
Danio rerio (zebrafish),
Bos taurus (aurochs),
Grammomys surdaster (african woodland thicket rat), and
Mus musculus (house mouse) were obtained from the NCBI (National Center for Biotechnology Information) database [
14]. The fourteen species with their respective length are given in
Table 1.
2.2. Feature Representation
This section will describe the various features used in this study. The features for all fourteen ALDH2 sequences were calculated using online web servers. We used the following three features to represent a protein sequence:
- (1)
Physicochemical properties;
- (2)
Statistical measures;
- (3)
Secondary structure prediction.
2.2.1. Physicochemical Properties
Several physicochemical properties such as extinction coefficients, theoretical pI, molecular weight, instability index, aliphatic index, amino acid composition, negatively and positively charged residues, grand average of hydropathicity (GRAVY), and the atomic composition of carbon, hydrogen, nitrogen, oxygen, and sulfur for all fourteen species were calculated using the online web server ProtParam [
15].
Instability index: The instability index estimates whether a protein is stable or unstable in a test tube. A protein with an instability index smaller than 40 is considered stable, and a value larger than 40 is considered unstable. It was estimated using the ProtParam server [
15]. There are 400 dipeptides, and a dipeptide instability weight value (DIWV) was assigned to each dipeptide by Guruprasad et al. [
16]. The instability index (II) for a protein sequence was calculated using the following equation:
where
N is the length of the protein sequence and
) is the instability weight value given to dipeptide
.
Extinction coefficients: The extinction coefficients demonstrate how much light a protein consumes at a specific wavelength. It is beneficial to evaluate this coefficient when purifying a protein and estimate it by using ProtParam [
15]. The molar extinction coefficient can be estimated from the protein sequence [
17]. From the molar extinction coefficient, we can estimate the extinction coefficient (
EC) of an essential protein in water using the equation:
where
,
, and
are the molar extinction coefficients of tyrosine, cystine, and tryptophan, respectively.
,
, and
are the number of tyrosine, tryptophan, and cystine residues per molecule, respectively.
Aliphatic index: The aliphatic index for a protein is described as the respective volume collected by aliphatic side chains (leucine, isoleucine, valine, and alanine). It may be considered as a positive factor for the expansion of the thermostability of spheroproteins [
15,
18]. The aliphatic index (
AI) of a protein sequence was calculated using the following equation:
where
,
,
, and
are the mole fraction of alanine, isoleucine, leucine, and valine, respectively.
a and
b are coefficients of the relative volume of valine and isoleucine/leucine side chains to the alanine side chains, respectively.
GRAVY: The value of GRAVY for a protein/peptide was estimated as the sum of hydropathy values [
19] of all amino acids, divided by the length of the protein/peptide sequence. It was estimated using the online web server ProtParam [
15].
Theoretical pI: The theoretical pI indicates the pH where the protein has a net zero charge, i.e., the negative and positive charges are the same. The ProtParam server [
15] estimates the theoretical pI and molecular weight by using the pI/Mw tool. The theoretical pI is affected by the buffer size of the protein.
2.2.2. Statistical Measures
We used three statistical measures, i.e., Shannon entropy, Hurst exponent, and fractal dimension, to respectively find randomness, correlation, and self-similarity in a protein sequence.
Shannon Entropy (SE): It estimates the degree of complexity in an ALDH2 sequence and is calculated using the following equation [
20]:
where
indicates the probability of amino acid
i in a protein sequence [
21].
Hurst exponent (HE): The Hurst exponent measures the smoothness and degree of similarity of a data set. It can be computed using rescaled range analysis (R/S analysis), whose value lies between 0 and 1 [
22,
23,
24]. If the value of HE lies between 0 and 0.5, then it indicates a negative autocorrelation, and if it lies between 0.5 and 1, it indicates a positive autocorrelation of a time series. If the value of HE is 0.5, then it indicates the randomness of a series, which means there is no correlation between the variable and its past values [
25]. The
HE of a sequence
is defined by the following equation:
where:
The HE is evaluated by plotting the values of (R/S) versus n in a log–log plot. The slant of the best fitting line approximates the HE. The HE specifies the amount of self-similarity of a primary sequence. The HE for long-range dependence is between 0.5 and 1. An expanding value of HE specifies a surge in the amount of long-range dependency and self-similarity.
Indicator matrix and fractal dimension: Each protein sequence is encoded into indicator matrices [
26,
27]. Let
be a protein sequence with length
N. The indicator function is defined as:
such that the indicator matrix will be:
Here,
is a matrix with 0 and 1, giving a binary image of the protein sequence as a 2D dot-plot. The binary image can conceptualize the distribution of zeros and ones within the same sequence. It can be done by allocating a white dot to 0 and a black dot to 1. The fractal dimension (FD) from an indicator matrix can be estimated as the average number of
of 1, randomly taken
from an
indicator matrix [
28]. Using
, FD is given by the following equation:
2.2.3. Secondary Structure Prediction
The online web-server CFSSP (Chou and Fasman Secondary Structure Prediction Server) was utilized to predict the secondary structure of ALDH2 sequences of all fourteen species [
29]. This server predicts the protein sequences’ beta-sheet, alpha-helix, and turns.
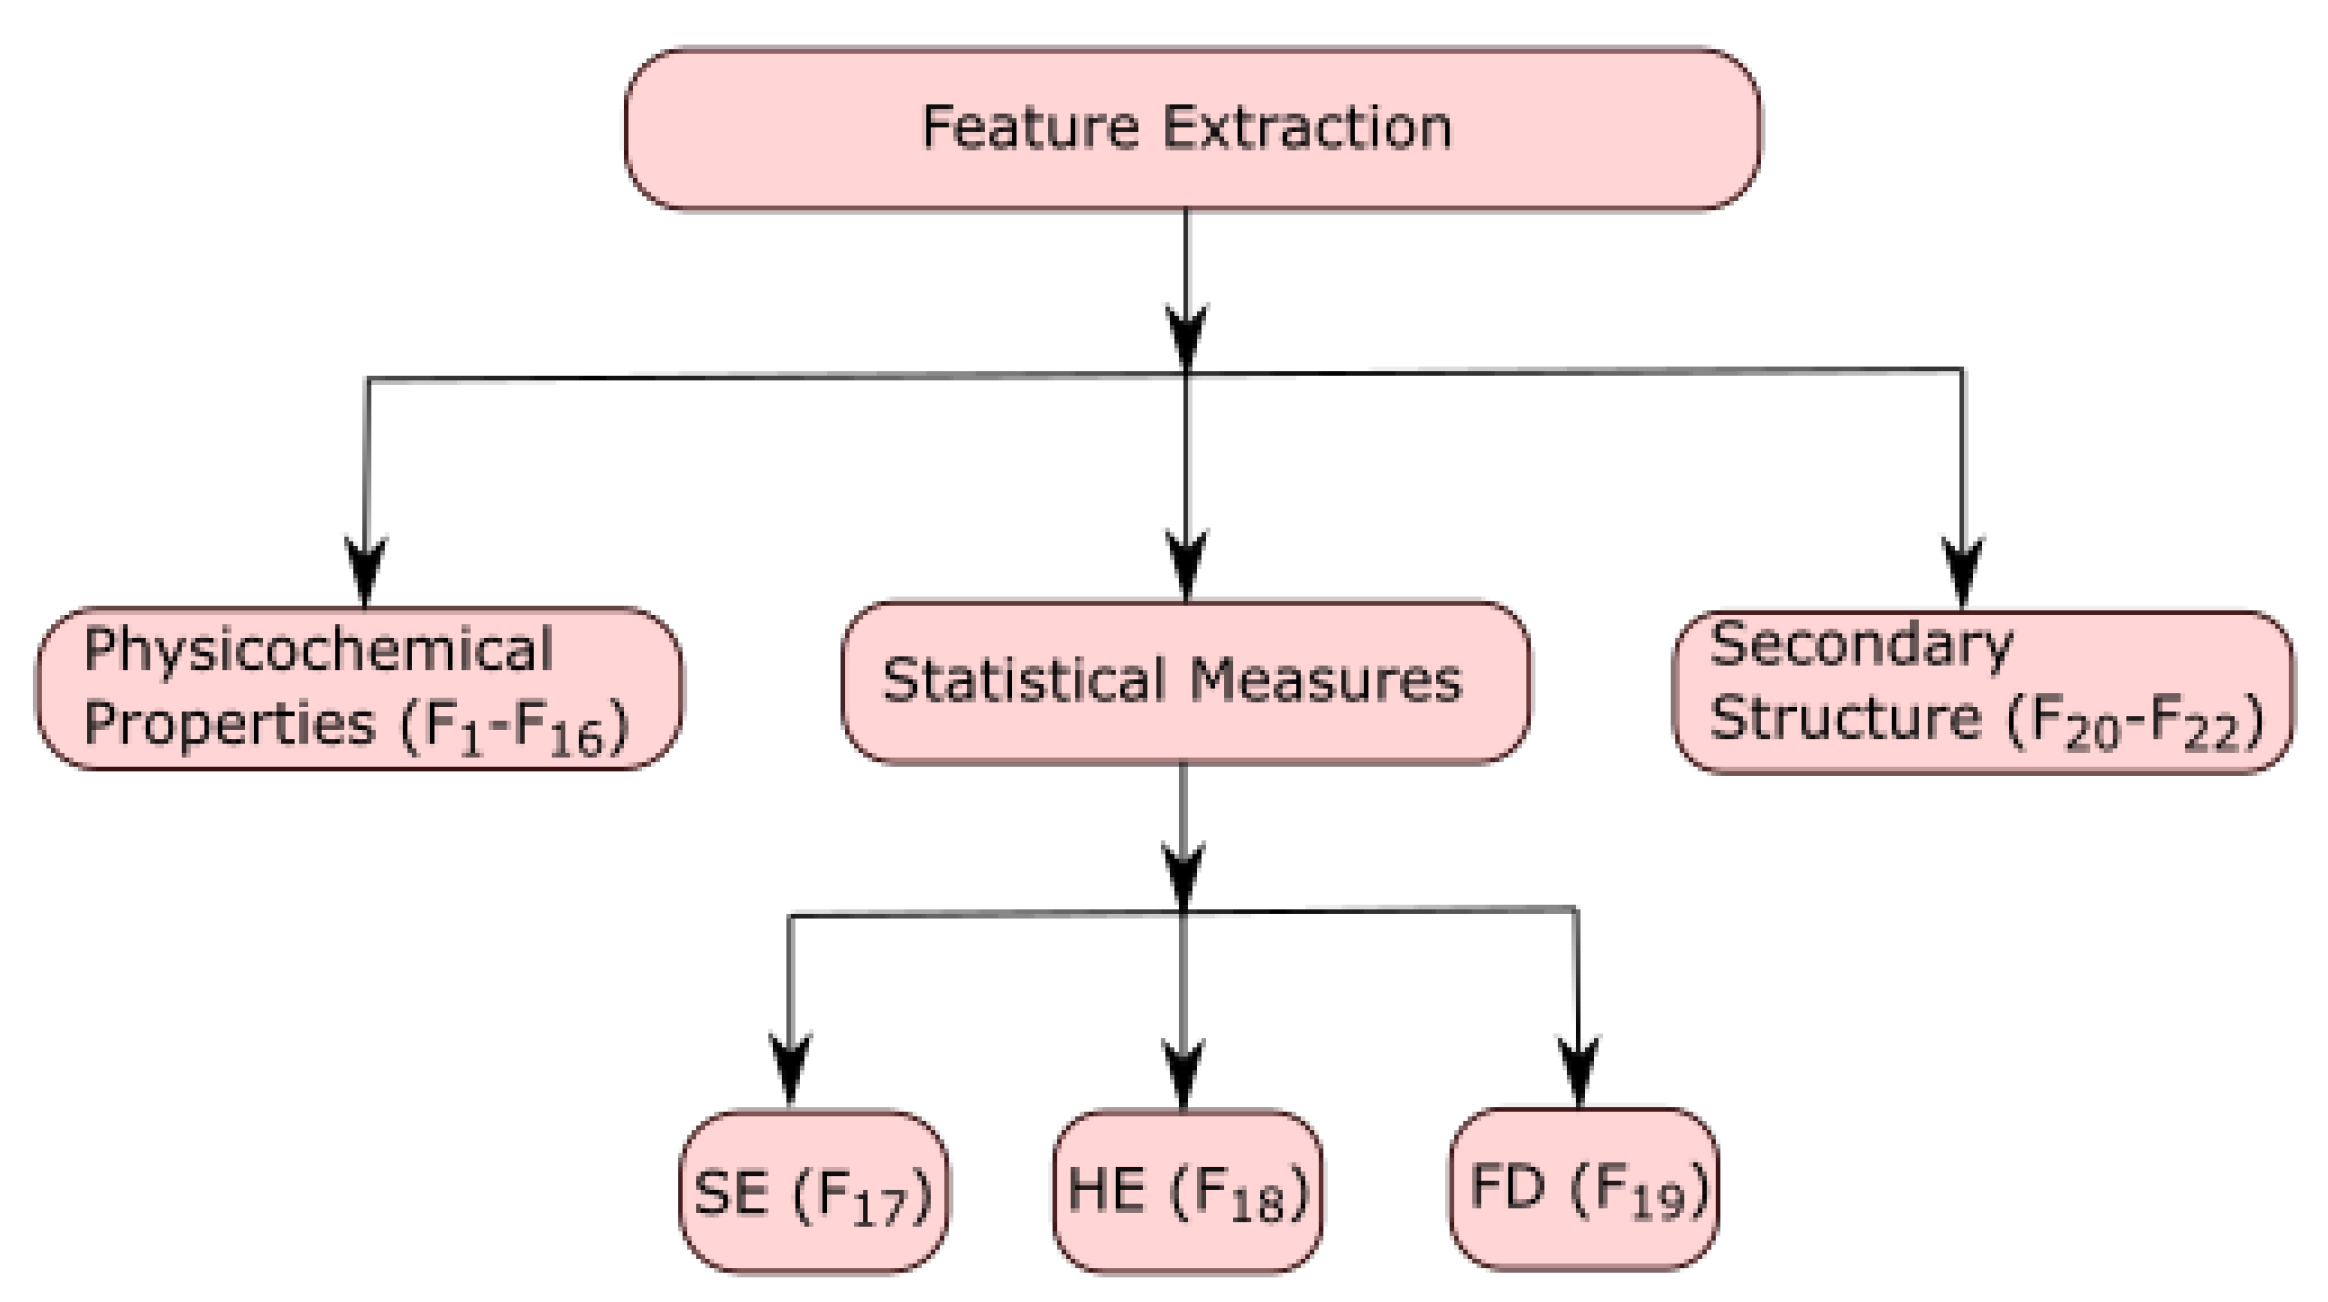
2.3. Feature Extraction
Every ALDH2 sequence was represented using 22 features. These features were denoted by
to
. The features from
to
were computed using physicochemical properties of all fourteen sequences, and these properties were computed using the online web server ProtParam [
15]. The features
,
, and
were calculated by using Shannon entropy, Hurst exponent, and fractal dimension, respectively. The features
to
were computed by the secondary structure of protein sequences by using the online web server CFSSP [
29]. The characterization of feature extraction is shown in
Figure 1.
2.4. Methods
Based on the physicochemical properties, Shannon entropy, fractal dimension, secondary structure, and Hurst exponent, the fourteen ALDH2 sequences of different species were clustered using hierarchical and K-means clustering. The employed feature representations are physicochemical properties, secondary structure, and statistical measures. These features have different importance in extracting the information from ALDH2 sequences. Thus, there is no standard method to apply to the extracted information from the sequences such that the generic information can be retrieved and that information can differentiate different species. Due to the diverse importance of extracted importance, the problem is applying unsupervised machine learning techniques for extracting informative patterns. The well-known unsupervised machine learning technique is clustering, and for clustering, K-means and hierarchical clustering are primarily used in practice. The motivation behind using K-means clustering is to group the specific species into its proper class. K-means clustering is used to find different clusters based on common characteristics of unlabeled data. Further analysis has been carried out by using phylogeny trees. The motivation behind using hierarchical clustering is to find the evolutionary relationships among these species.
K-means clustering: It is a well-known unsupervised machine learning algorithm that partitions the unlabeled data into different groups or clusters based on similar characteristics and common patterns. According to a distance measure such as Euclidean distance, the data points in a cluster should be similar and dissimilar to those in different clusters. K-means clustering is an iterative method that partitions the data points into K clusters (pre-defined) where each data point should lie in only one cluster [
20]. Let
,
, …,
represent
n data points.
,
, …,
denote
K clusters and
,
, …,
represent centroids of
K clusters.
The K-means algorithm steps are as follows:
- (1)
Decide the value of K, i.e., the desired number of clusters (in this study, K = 4).
- (2)
Randomly select K data points as centroids (, , , ).
- (3)
Repeat the following steps until there is no change to the centroids.
- (4)
Find the Euclidean distance between all centroids and data points.
, ) for and .
- (5)
Assign every data point to the nearest centroid (cluster), i.e.,
and
j is given by:
- (6)
For each cluster, compute the centroid by averaging all data points belonging to that cluster.
Hierarchical clustering: Hierarchical clustering is a technique that partitions the objects into homogeneous groups based on the similarity between objects [
30]. Unlike K-means clustering, hierarchical clustering does not depend on K (the number of clusters). In this paper, we used agglomerative hierarchical clustering, which starts by taking each object as a separate cluster and repeatedly follows the two steps below until there is a single cluster:
- (1)
Find the two closest clusters based on similarity measured by the Euclidean distance matrix.
- (2)
Combine the two closest clusters to form a new cluster.
The hierarchical clustering output is shown as a dendrogram.
3. Results
All fourteen species were clustered based on the physicochemical properties, secondary structure, Shannon entropy, fractal dimension, and Hurst exponent. All fourteen species were clustered using the K-means algorithm.
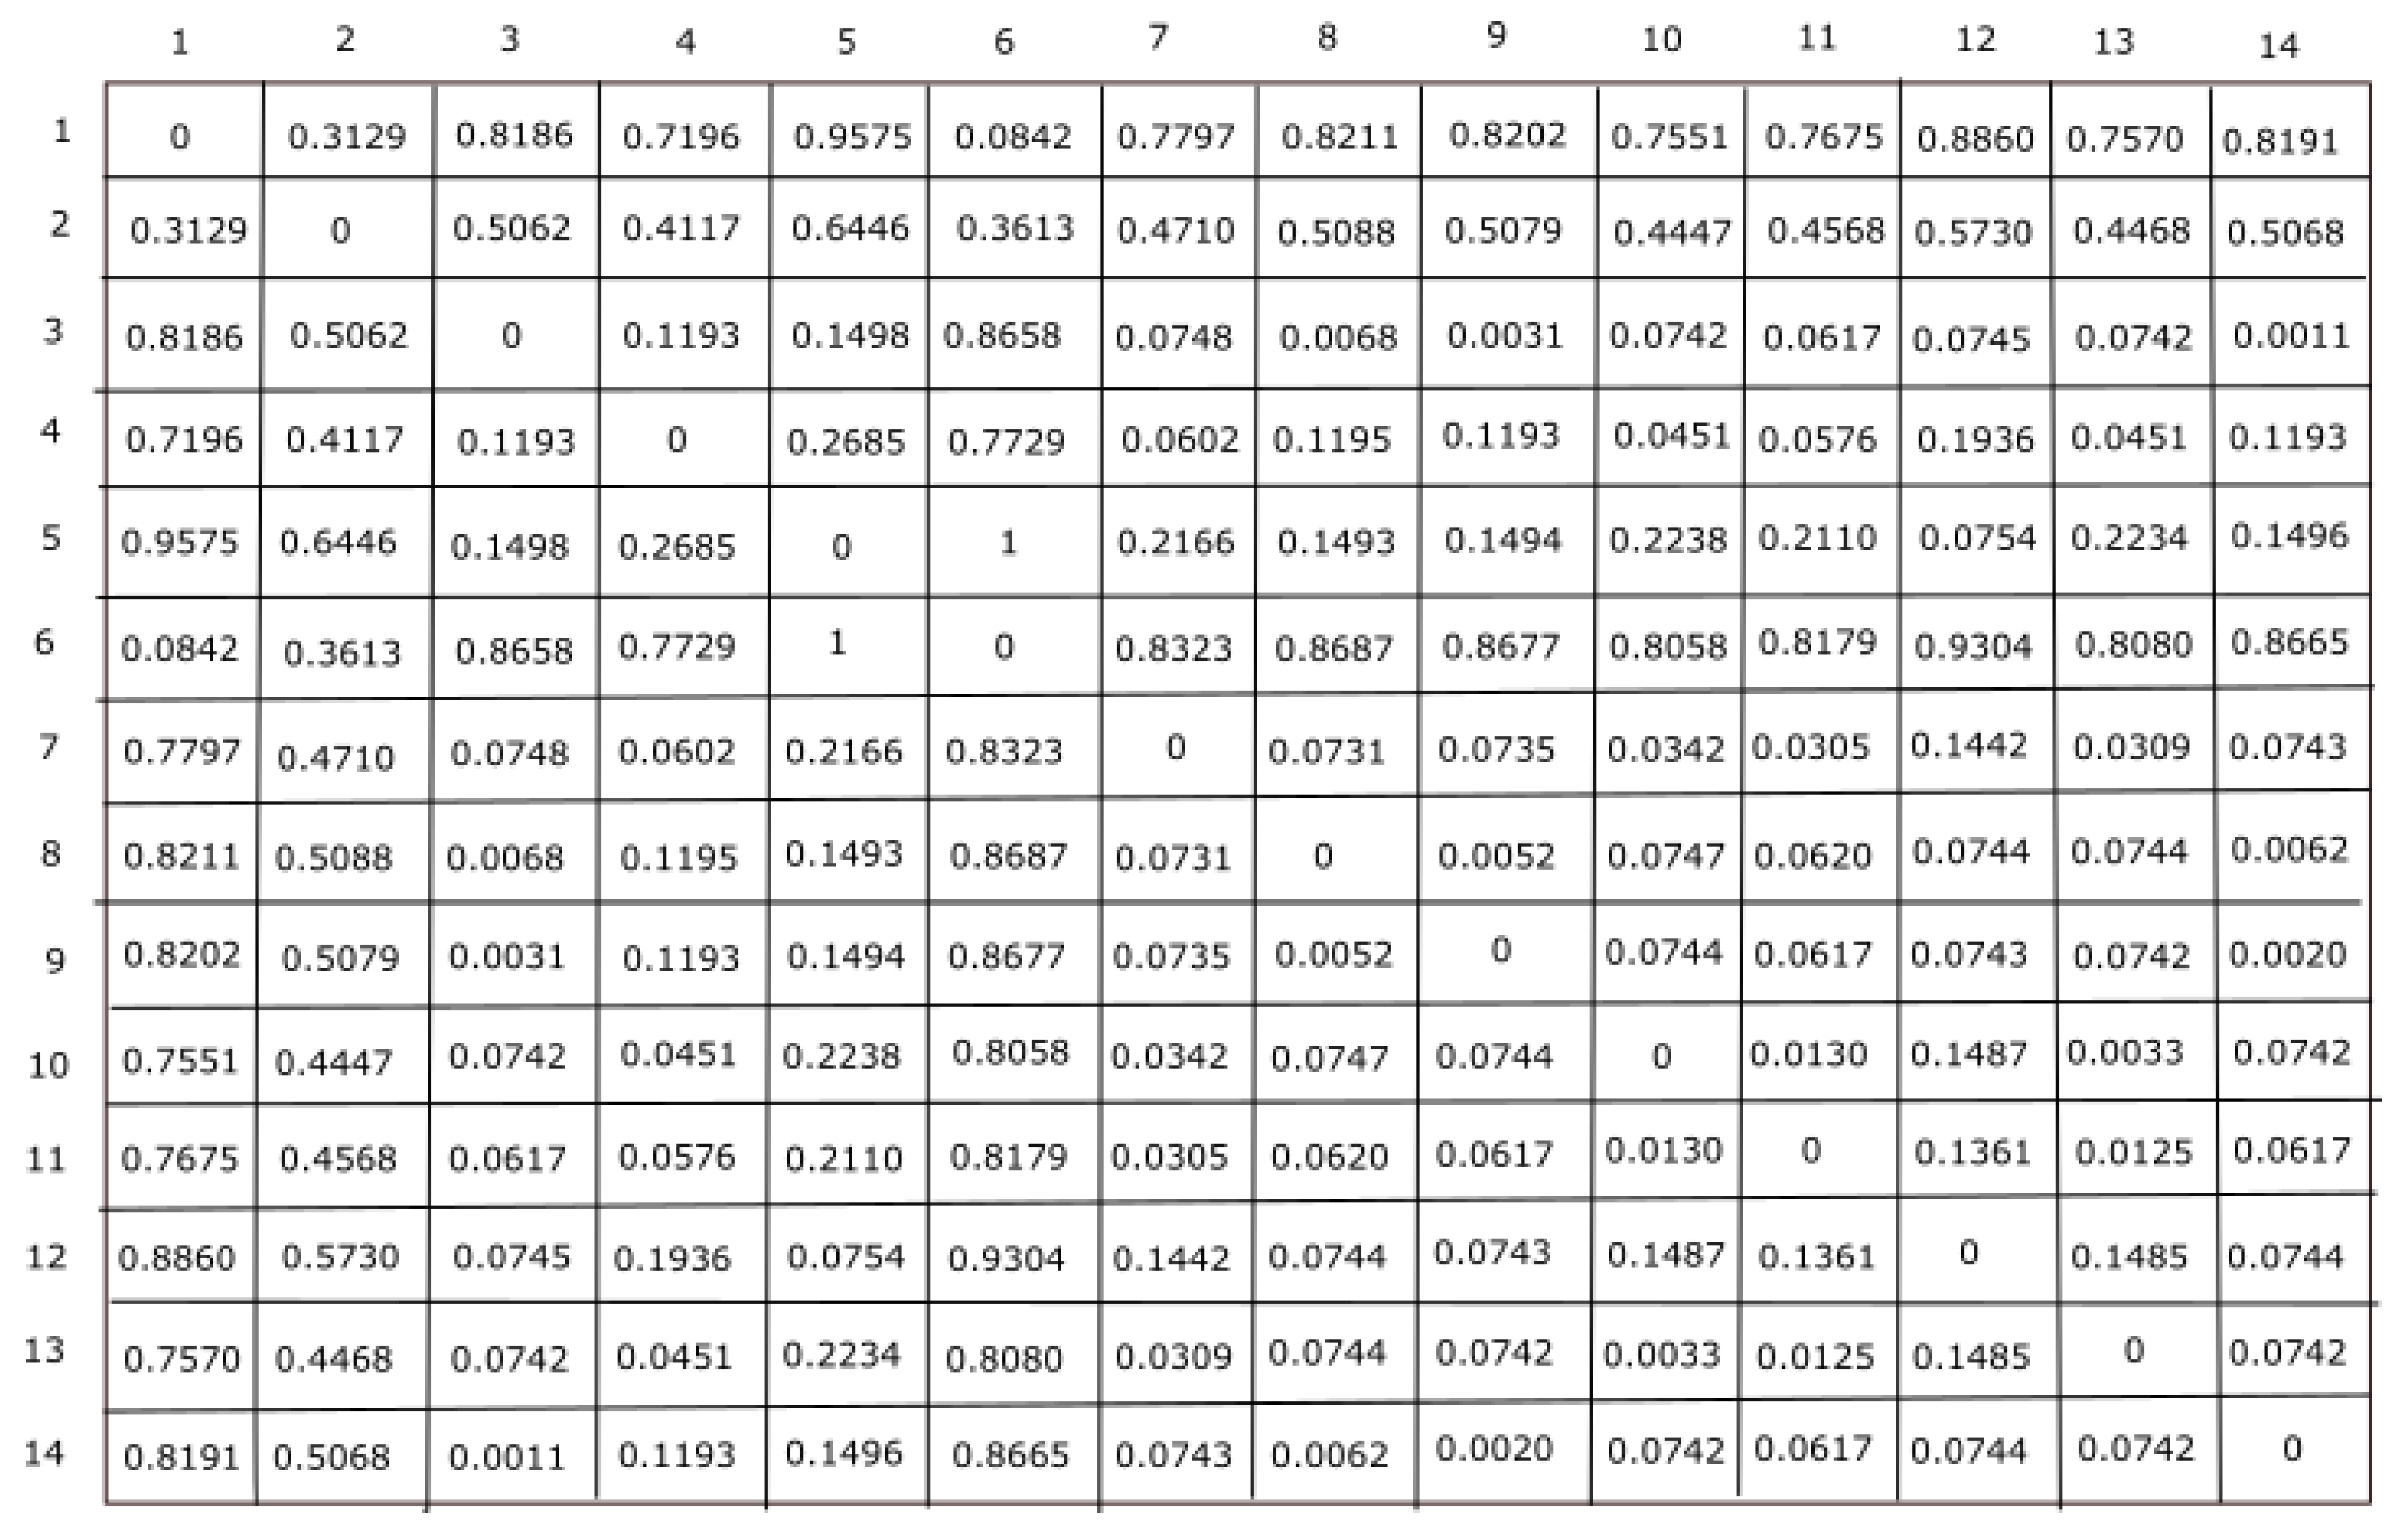
In this work, three feature representation techniques were considered for extracting information from each sequence. Here, physicochemical properties derived 16 different features, statistical techniques measured 3 different features, and secondary structure techniques computed 3 different features. Hence, each sequence is represented by a 22-dimensional feature vector. The values of these features are different. Thus, to preserve these features’ dominance property, each feature will have an equal contribution to finding the information from ALDH2 sequences. Thus, to make these features useful, a Z-score data normalization technique was employed to scale them in [0, 1] intervals. Now, these normalized features are differently employed for clustering analysis of ALDH2 sequences. In this work, Euclidean distance calculation has been employed for clustering analysis to find the similarity between two clusters. Hence, the raw score with the largest magnitude has been preserved using Z-score normalization, while the dissimilarity between the clusters was performed using Euclidean distance. For each species, a distance matrix was calculated using the Euclidean distance:
Here,
and
represent the
jth feature for the species
and
, respectively. The distance matrix for all fourteen species is given in
Figure 2.
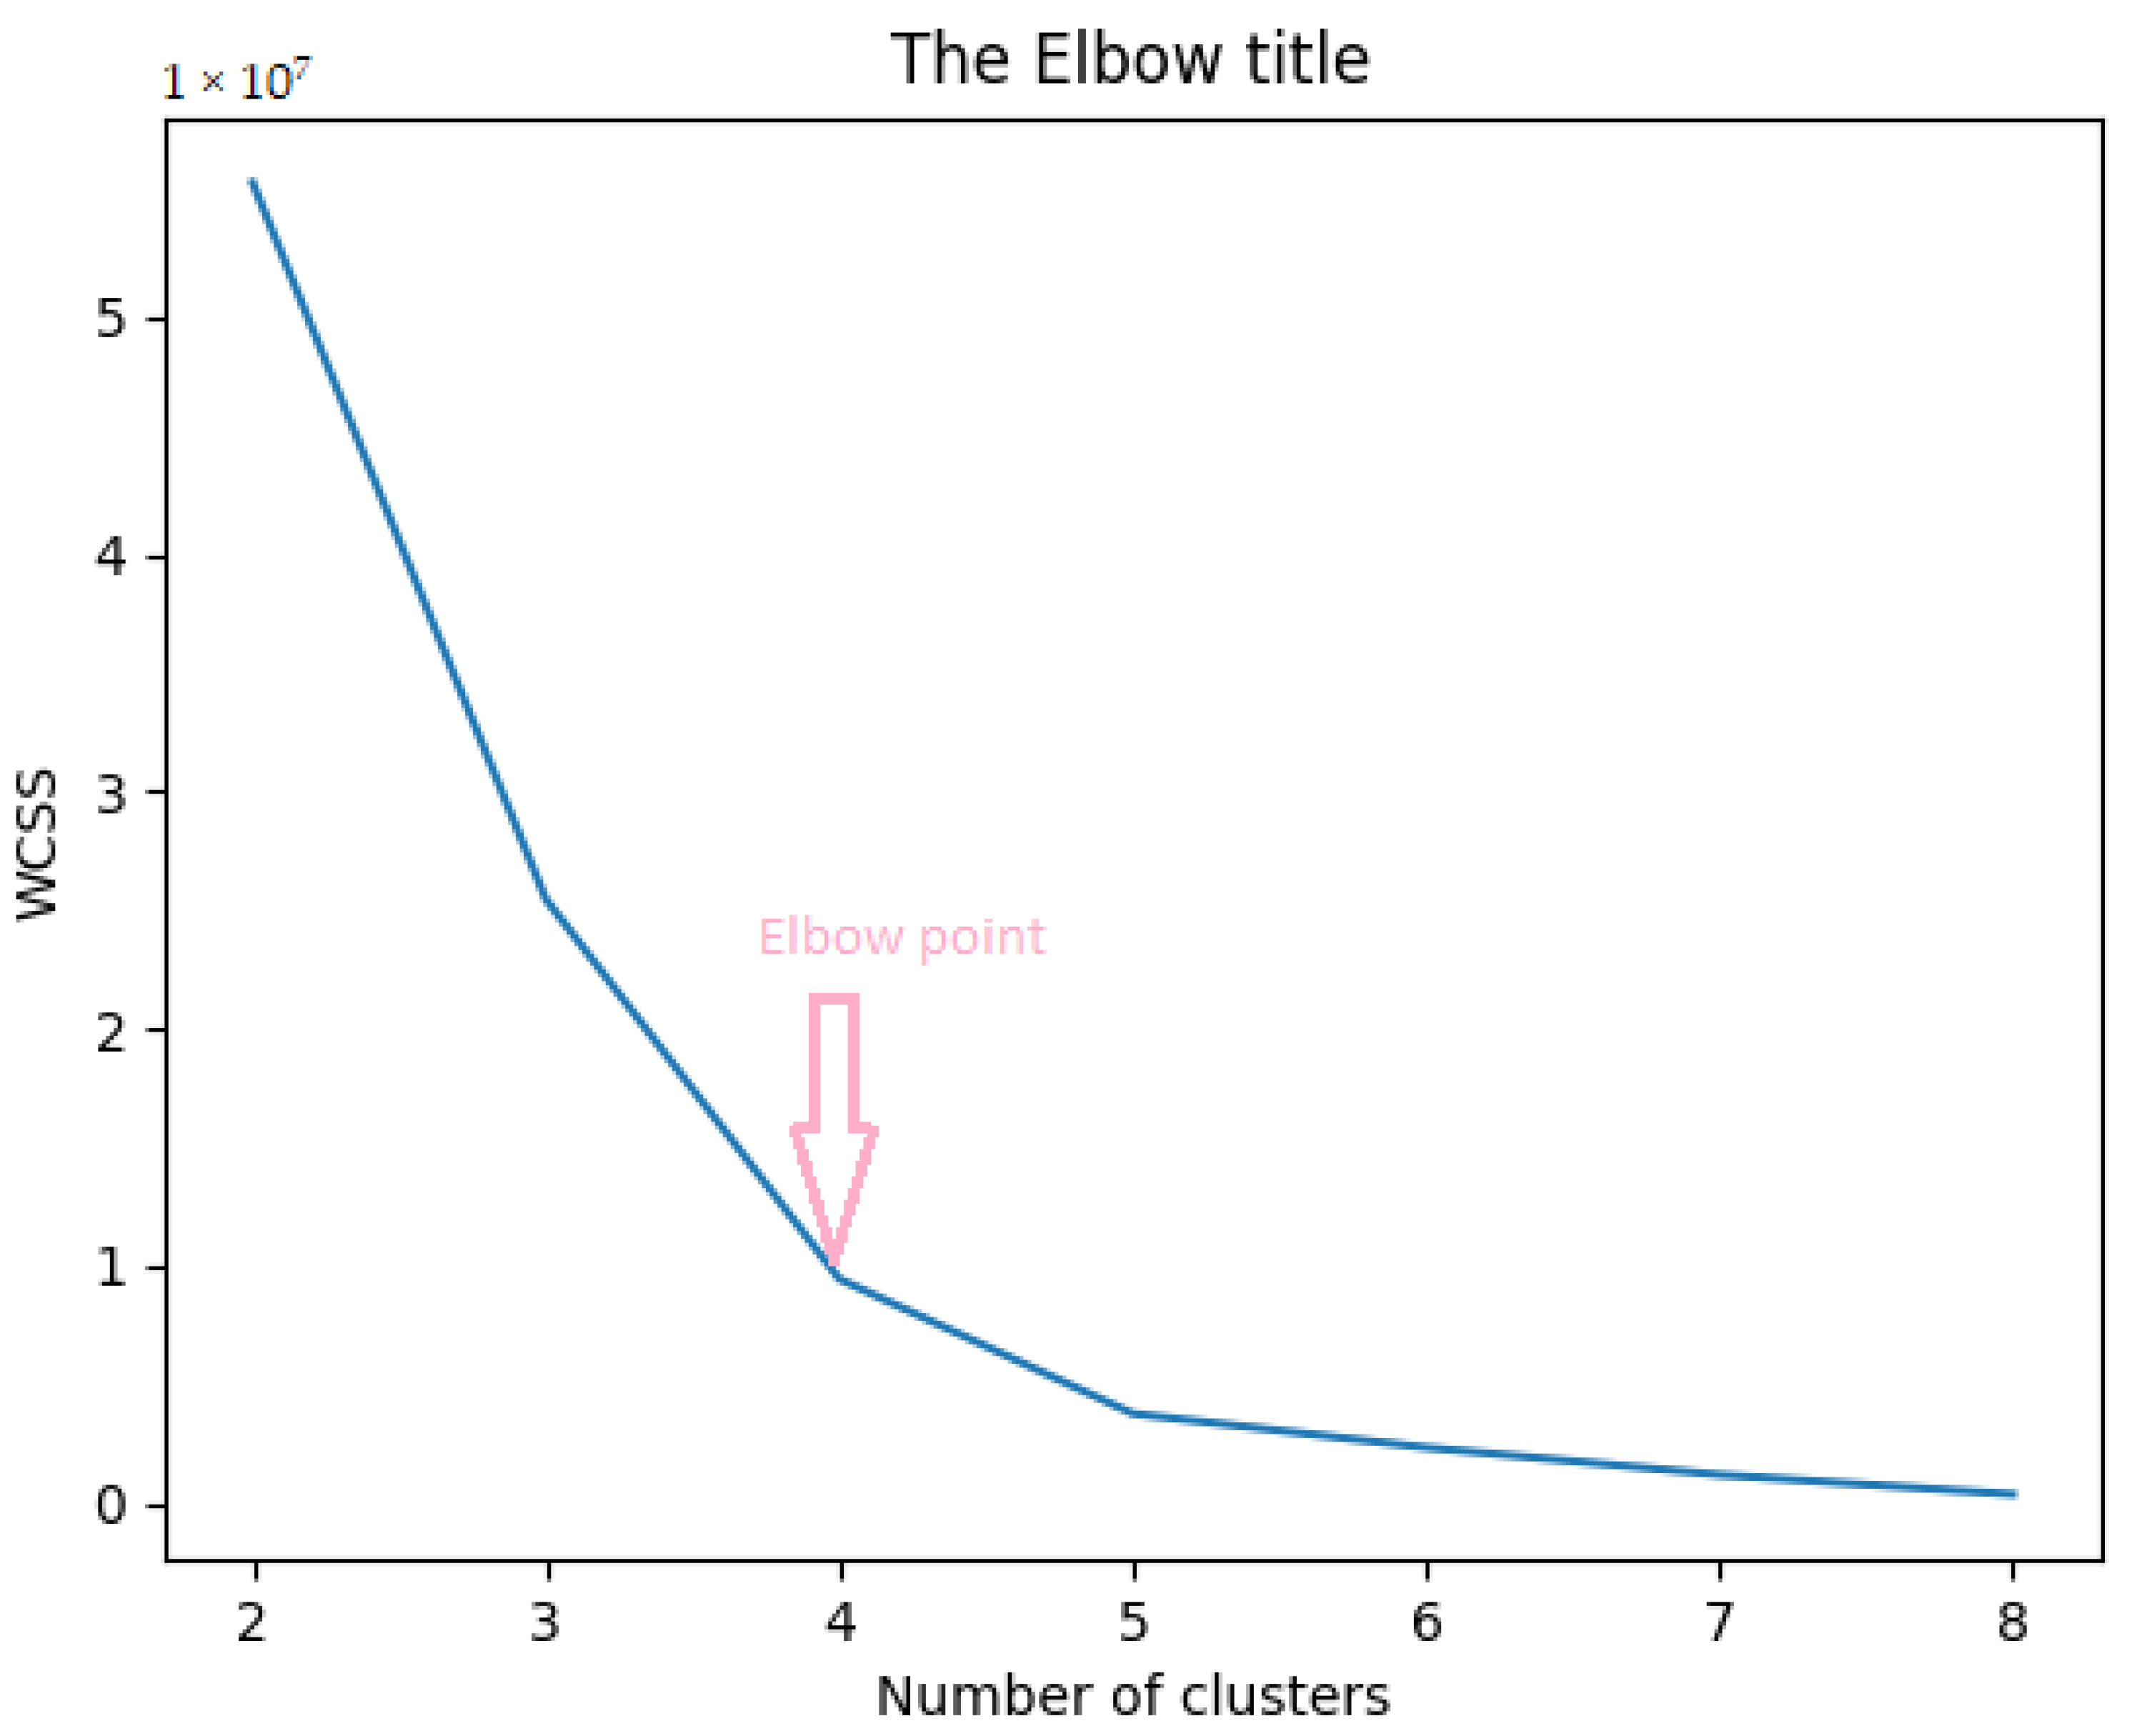
After finding the distance matrix, we applied K-means clustering. The first step is to find the value of
K. We used the elbow method to find the optimal value of
K (numbers of clusters) [
31]. For every value of
K starting from 2, we computed WCSS (Within-Clusters Sum of Squares), i.e., the sum of squared distance among every sample and its nearest centroid of a cluster. As the value of
K increases, the sum of squared distance decreases. To find the optimal value of
K, we chose the value of
K at the elbow point where WCSS starts decreasing linearly. Thus from
Figure 3, we selected the value of
K as 4. The following equation calculates
:
where
represents samples in a cluster and
,
, …,
denote clusters.
K is the total number of clusters.
,
, …,
represent the centroids for the respective clusters.
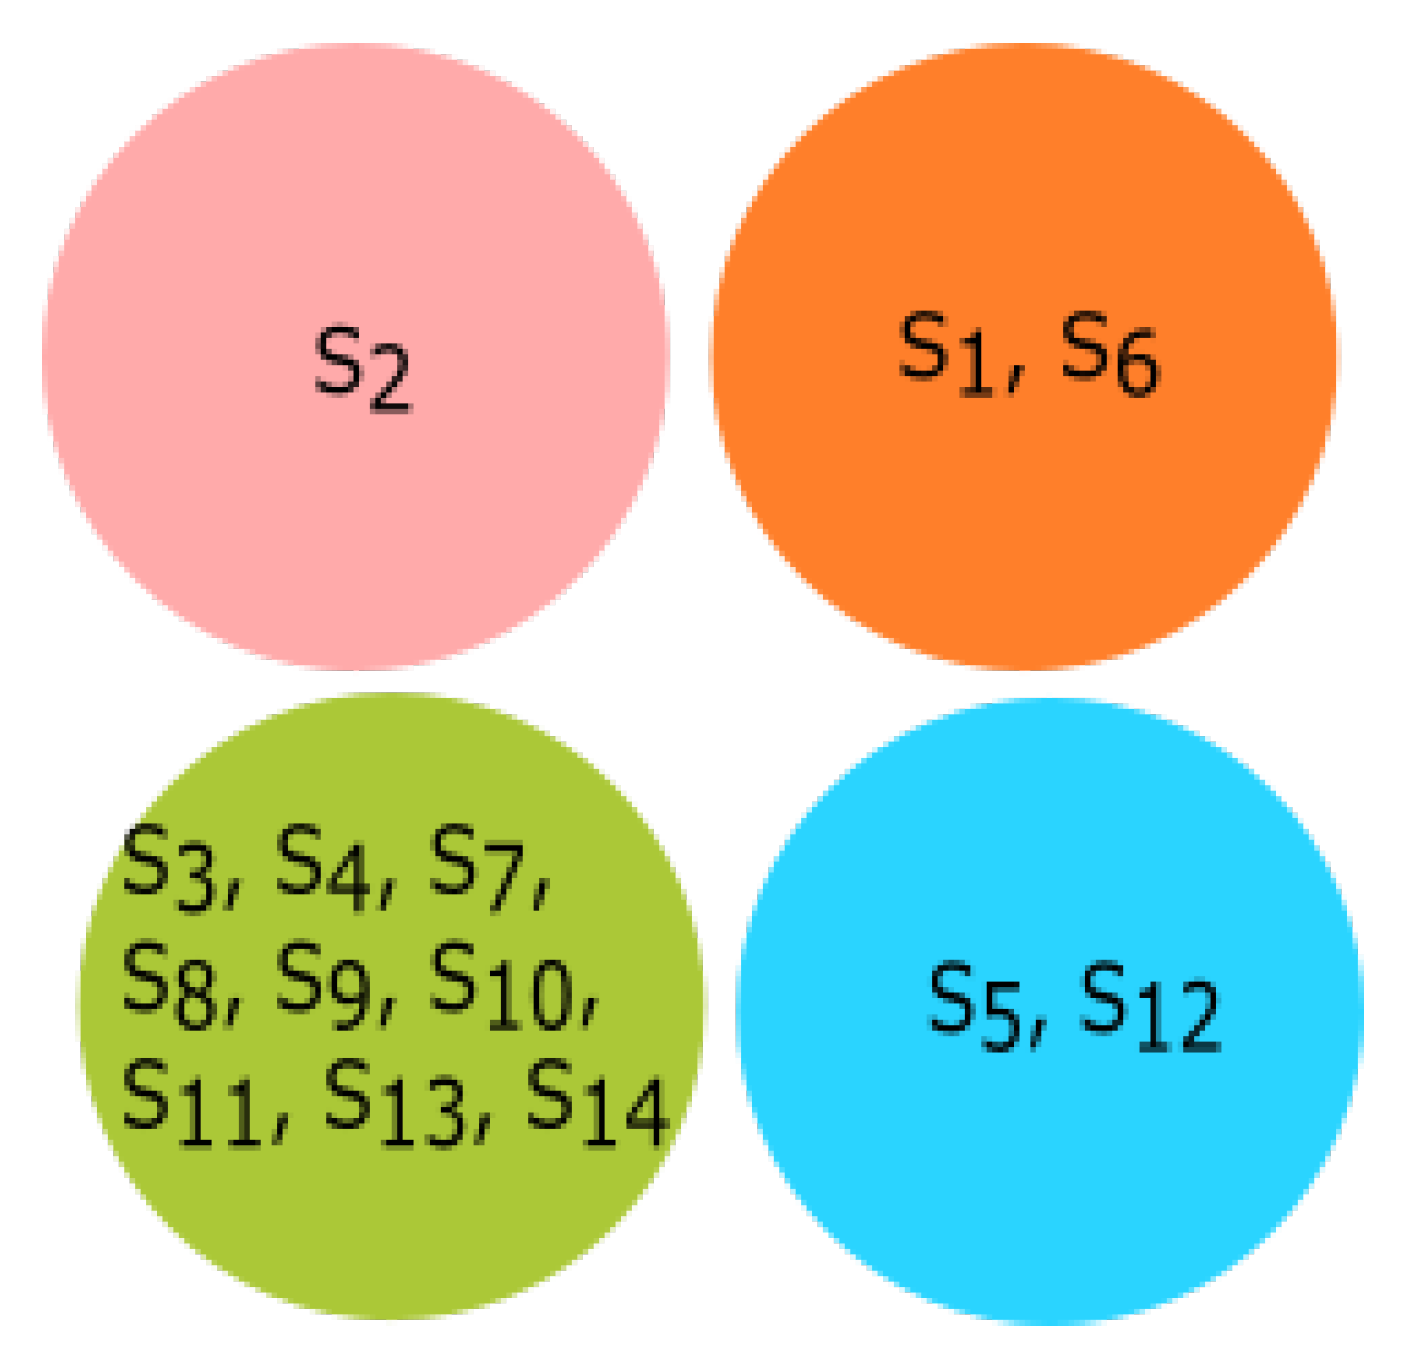
3.1. Experiment Based on Physicochemical Properties
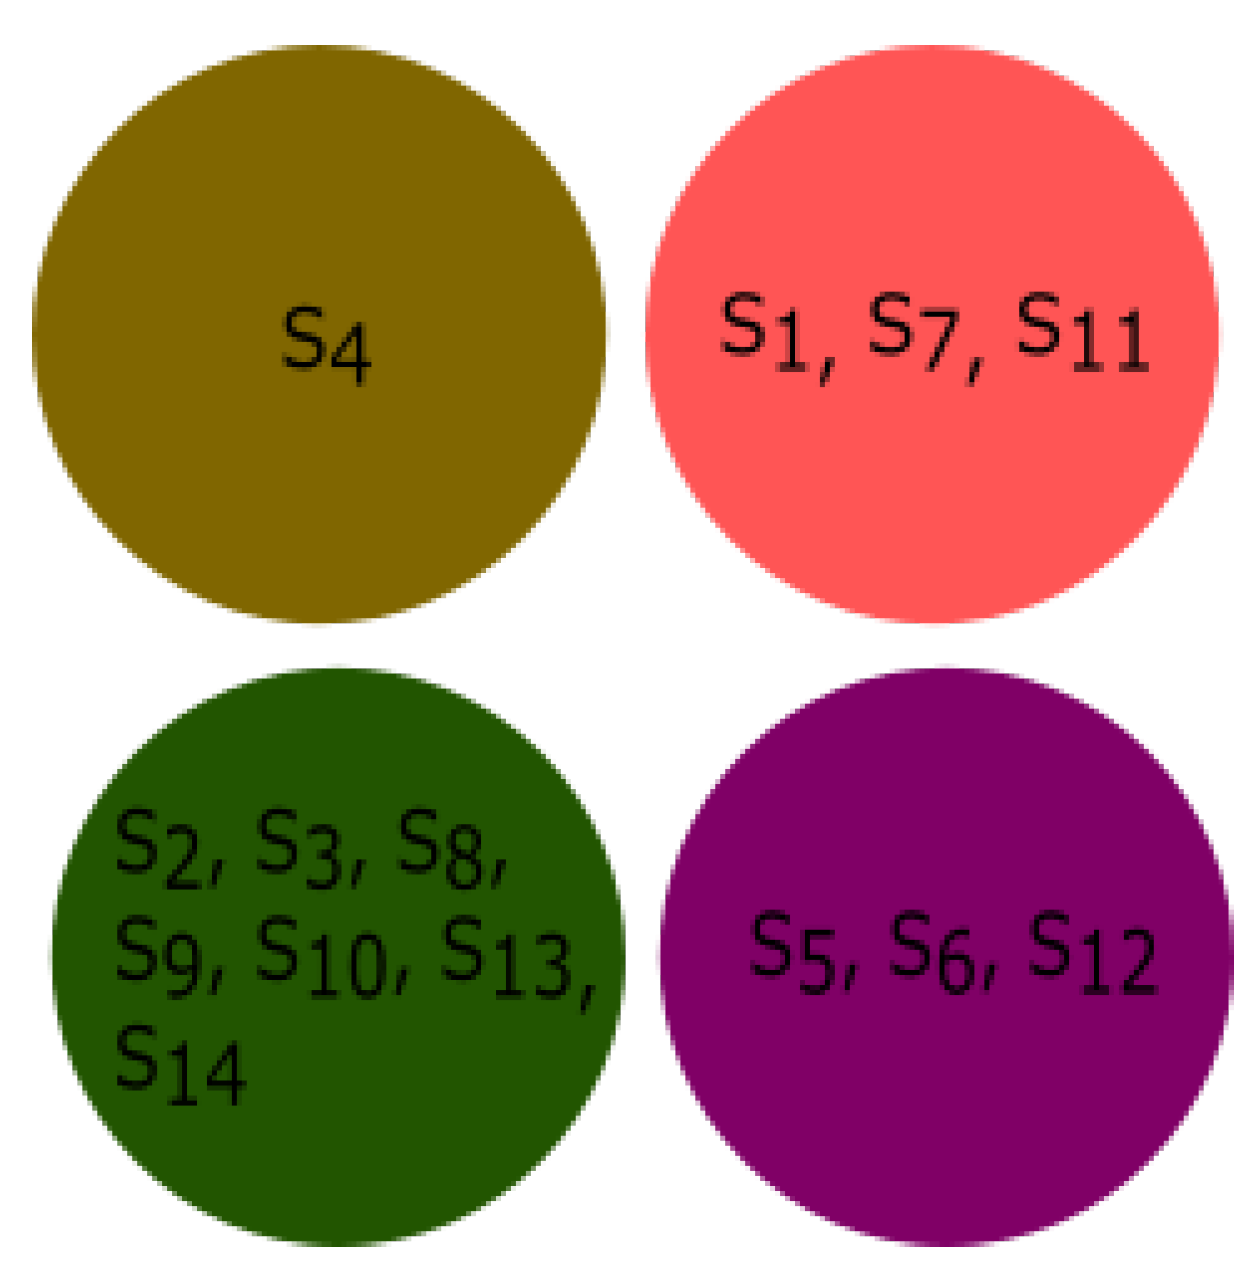
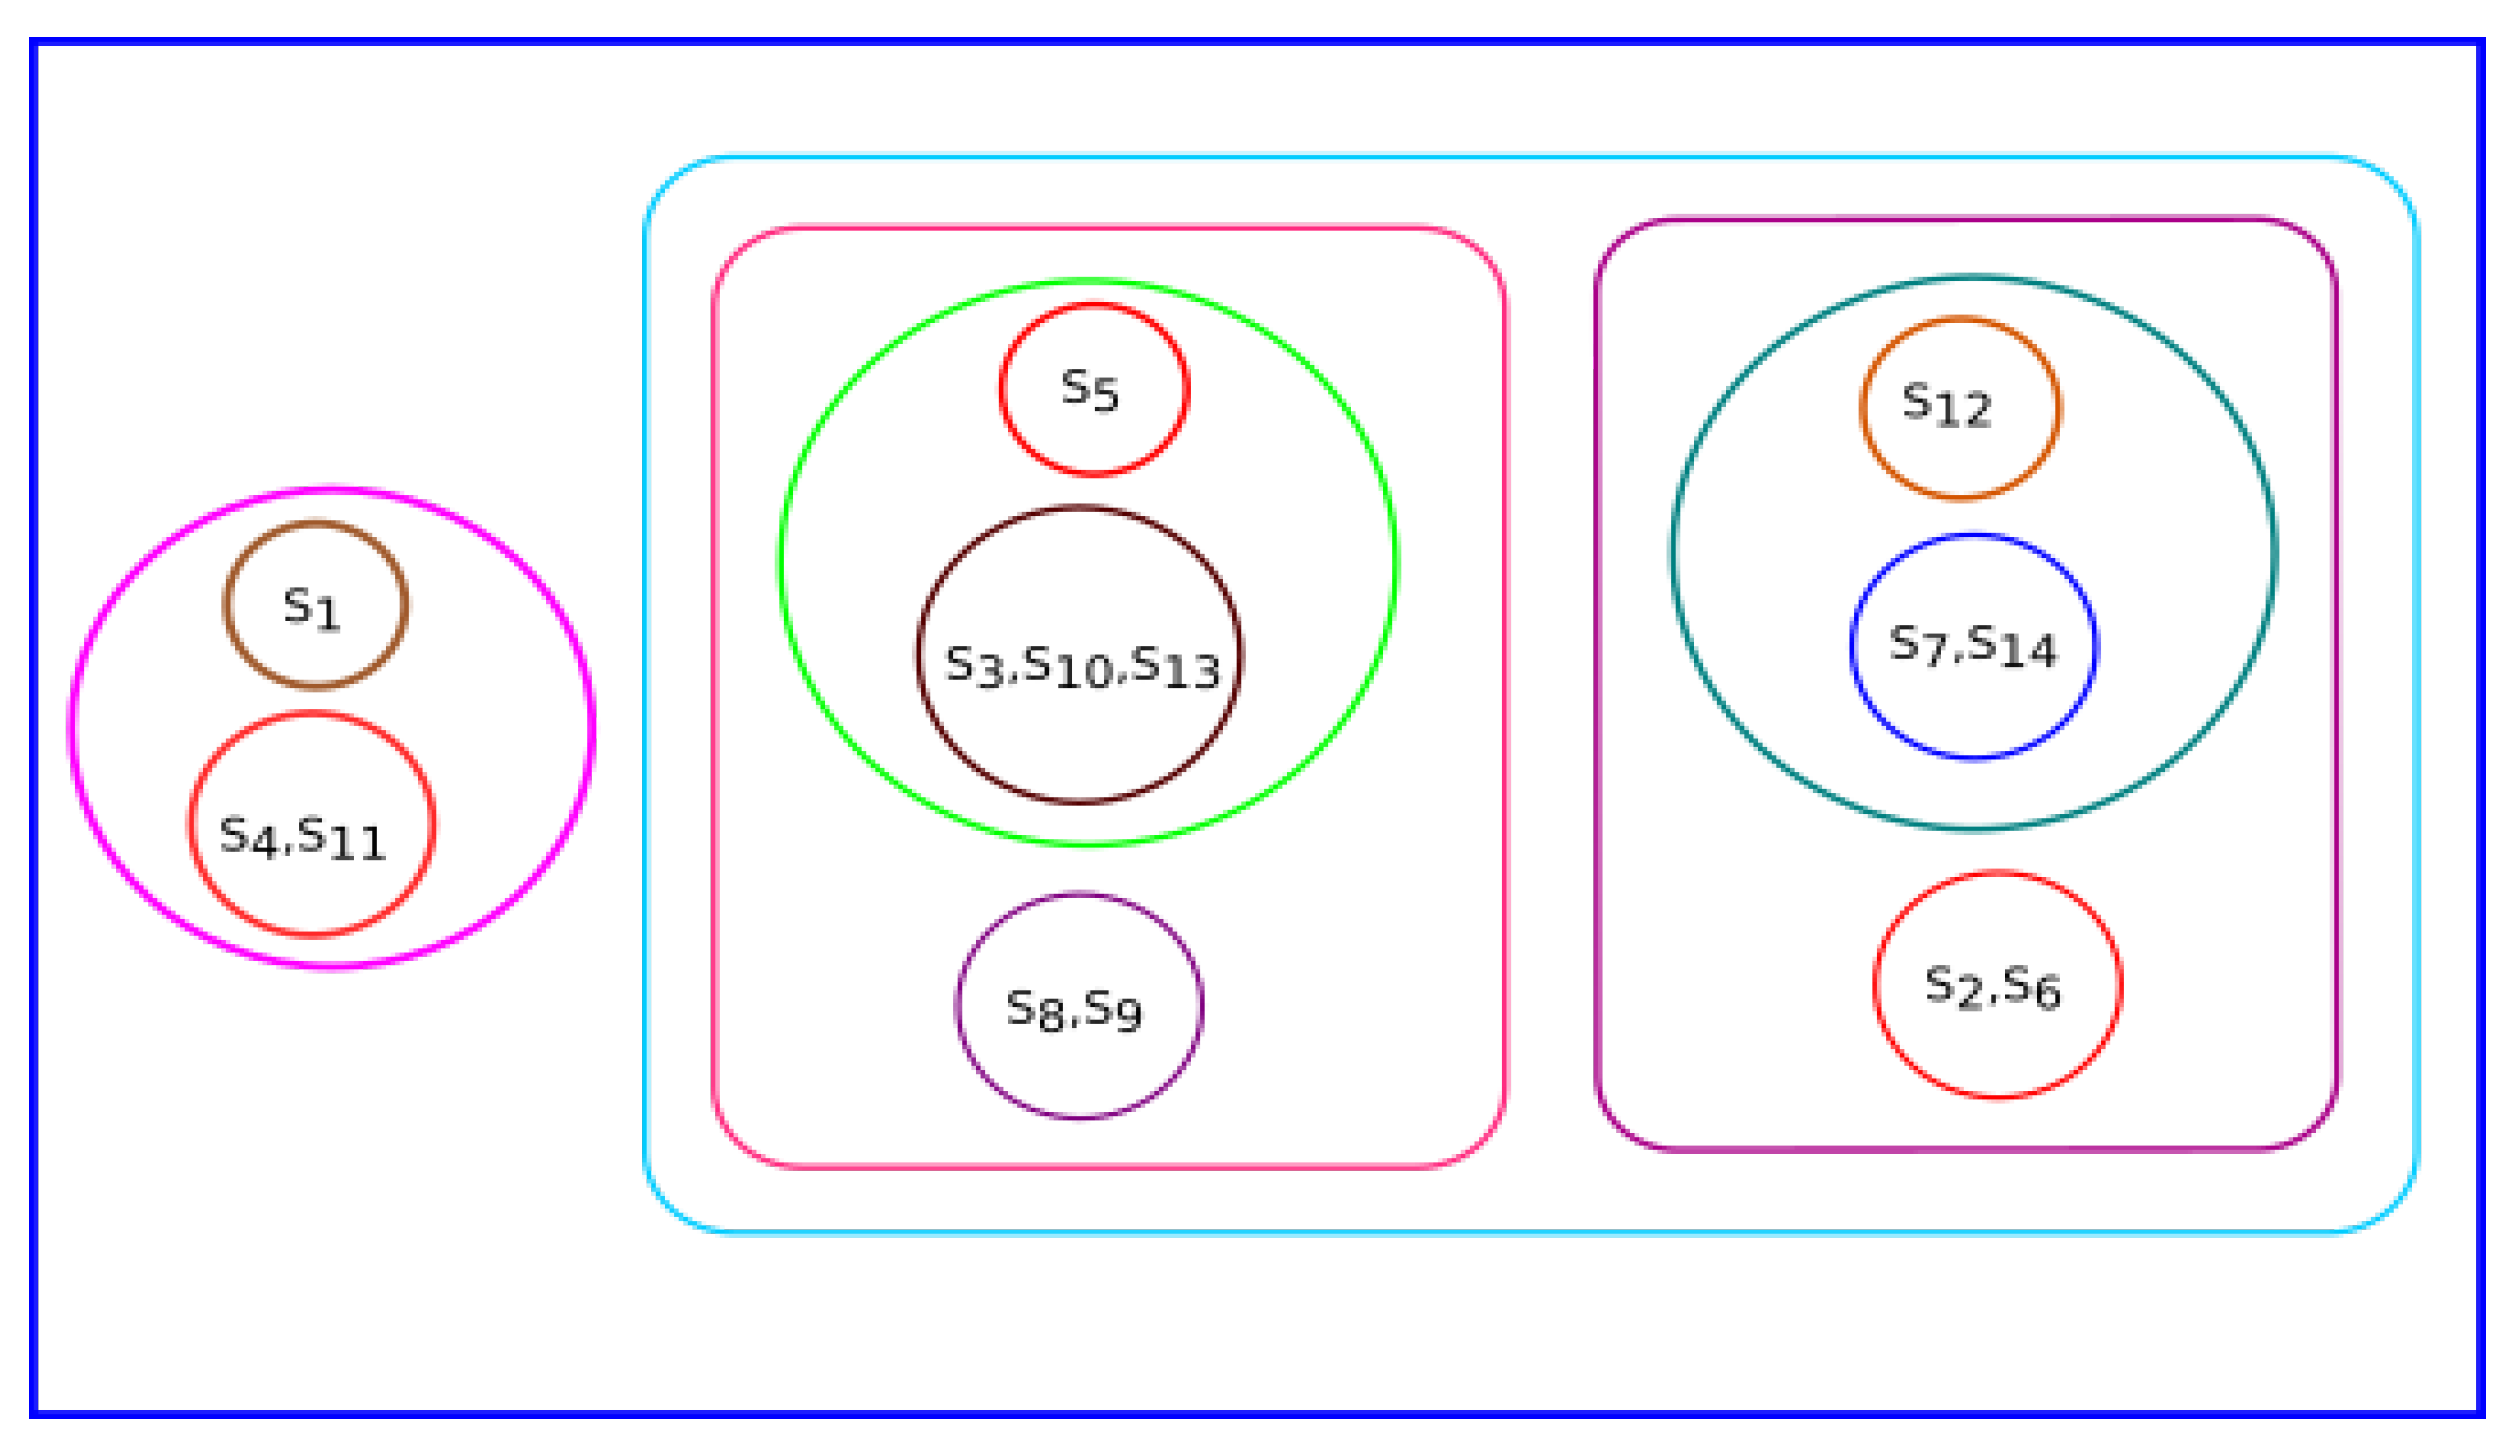
Homogeneity was derived based on physicochemical properties using K-means clustering and hierarchical clustering among all fourteen species. The results of K-means clustering and phylogenetic trees are shown in
Figure 4 and
Figure 5, respectively. The fourteen species were clustered into four clusters using the K-means algorithm based on physicochemical properties. The clusters of species {
Pongo abelii, Meleagris gallopavo}, {
Sus scrofa, Bos taurus} and {
Rattus norvegicus, Amblyraja radiata, Xenopus tropicalis, Mus pahari, Arvicanthis niloticus, Cricetulus griseus, Danio rerio, Grammomys surdaster, Mus musculus} indicate that these species are closely related. From the clusters based on physicochemical properties, we observed that
Homo sapiens was not clustered with any other species.
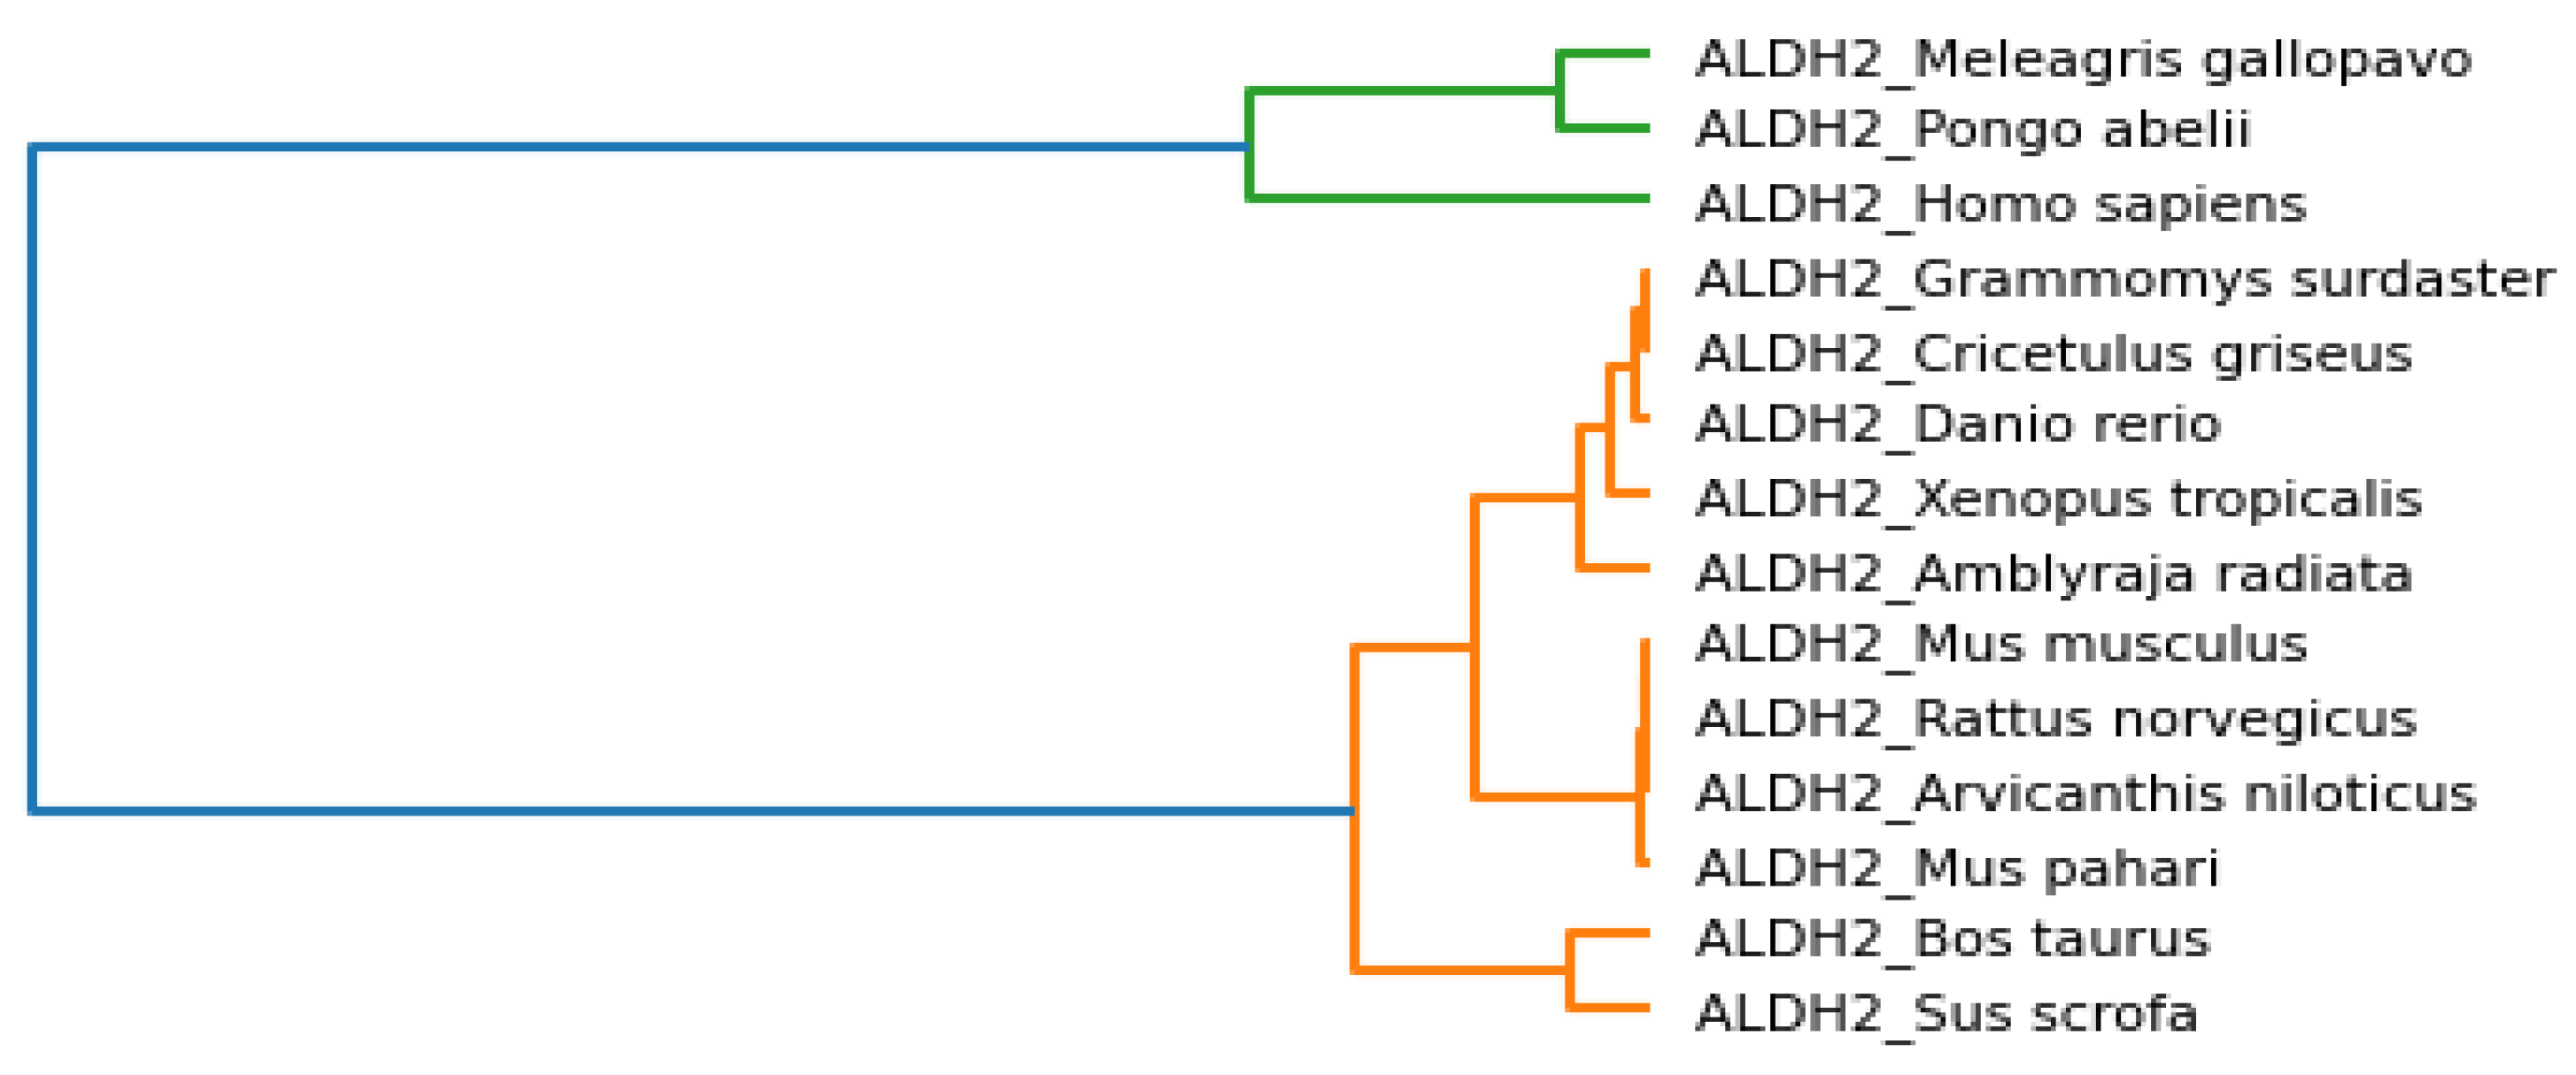
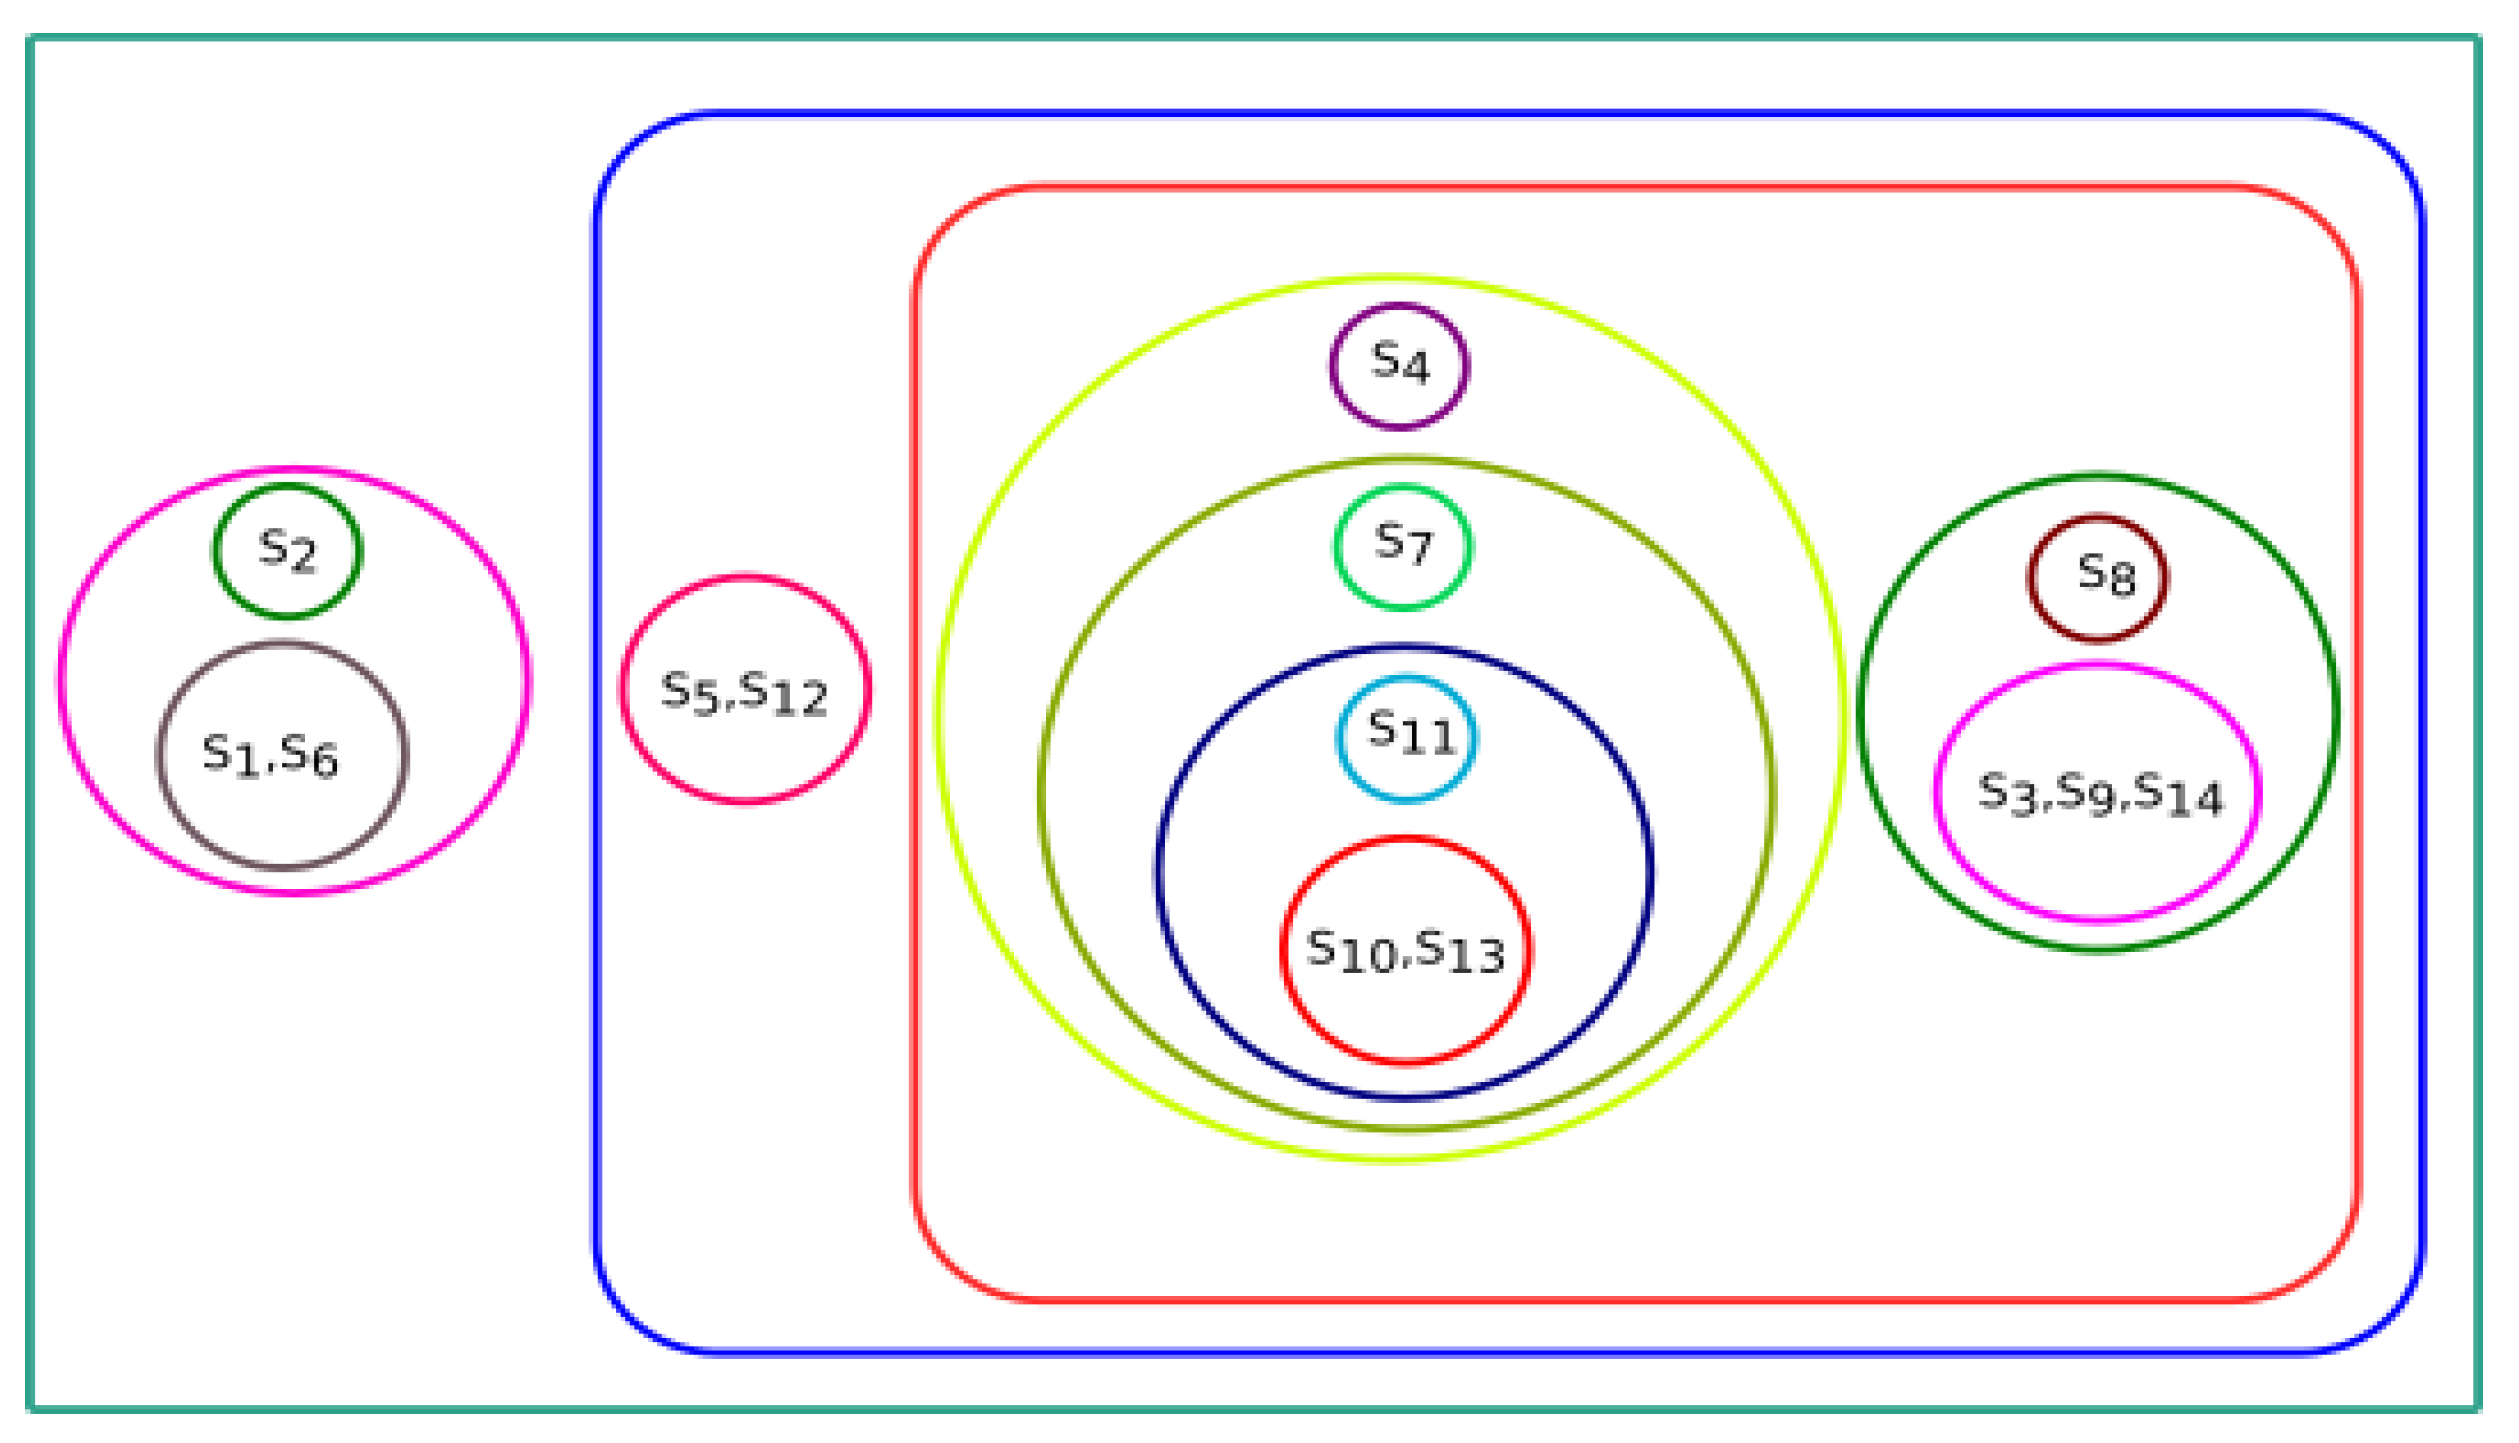
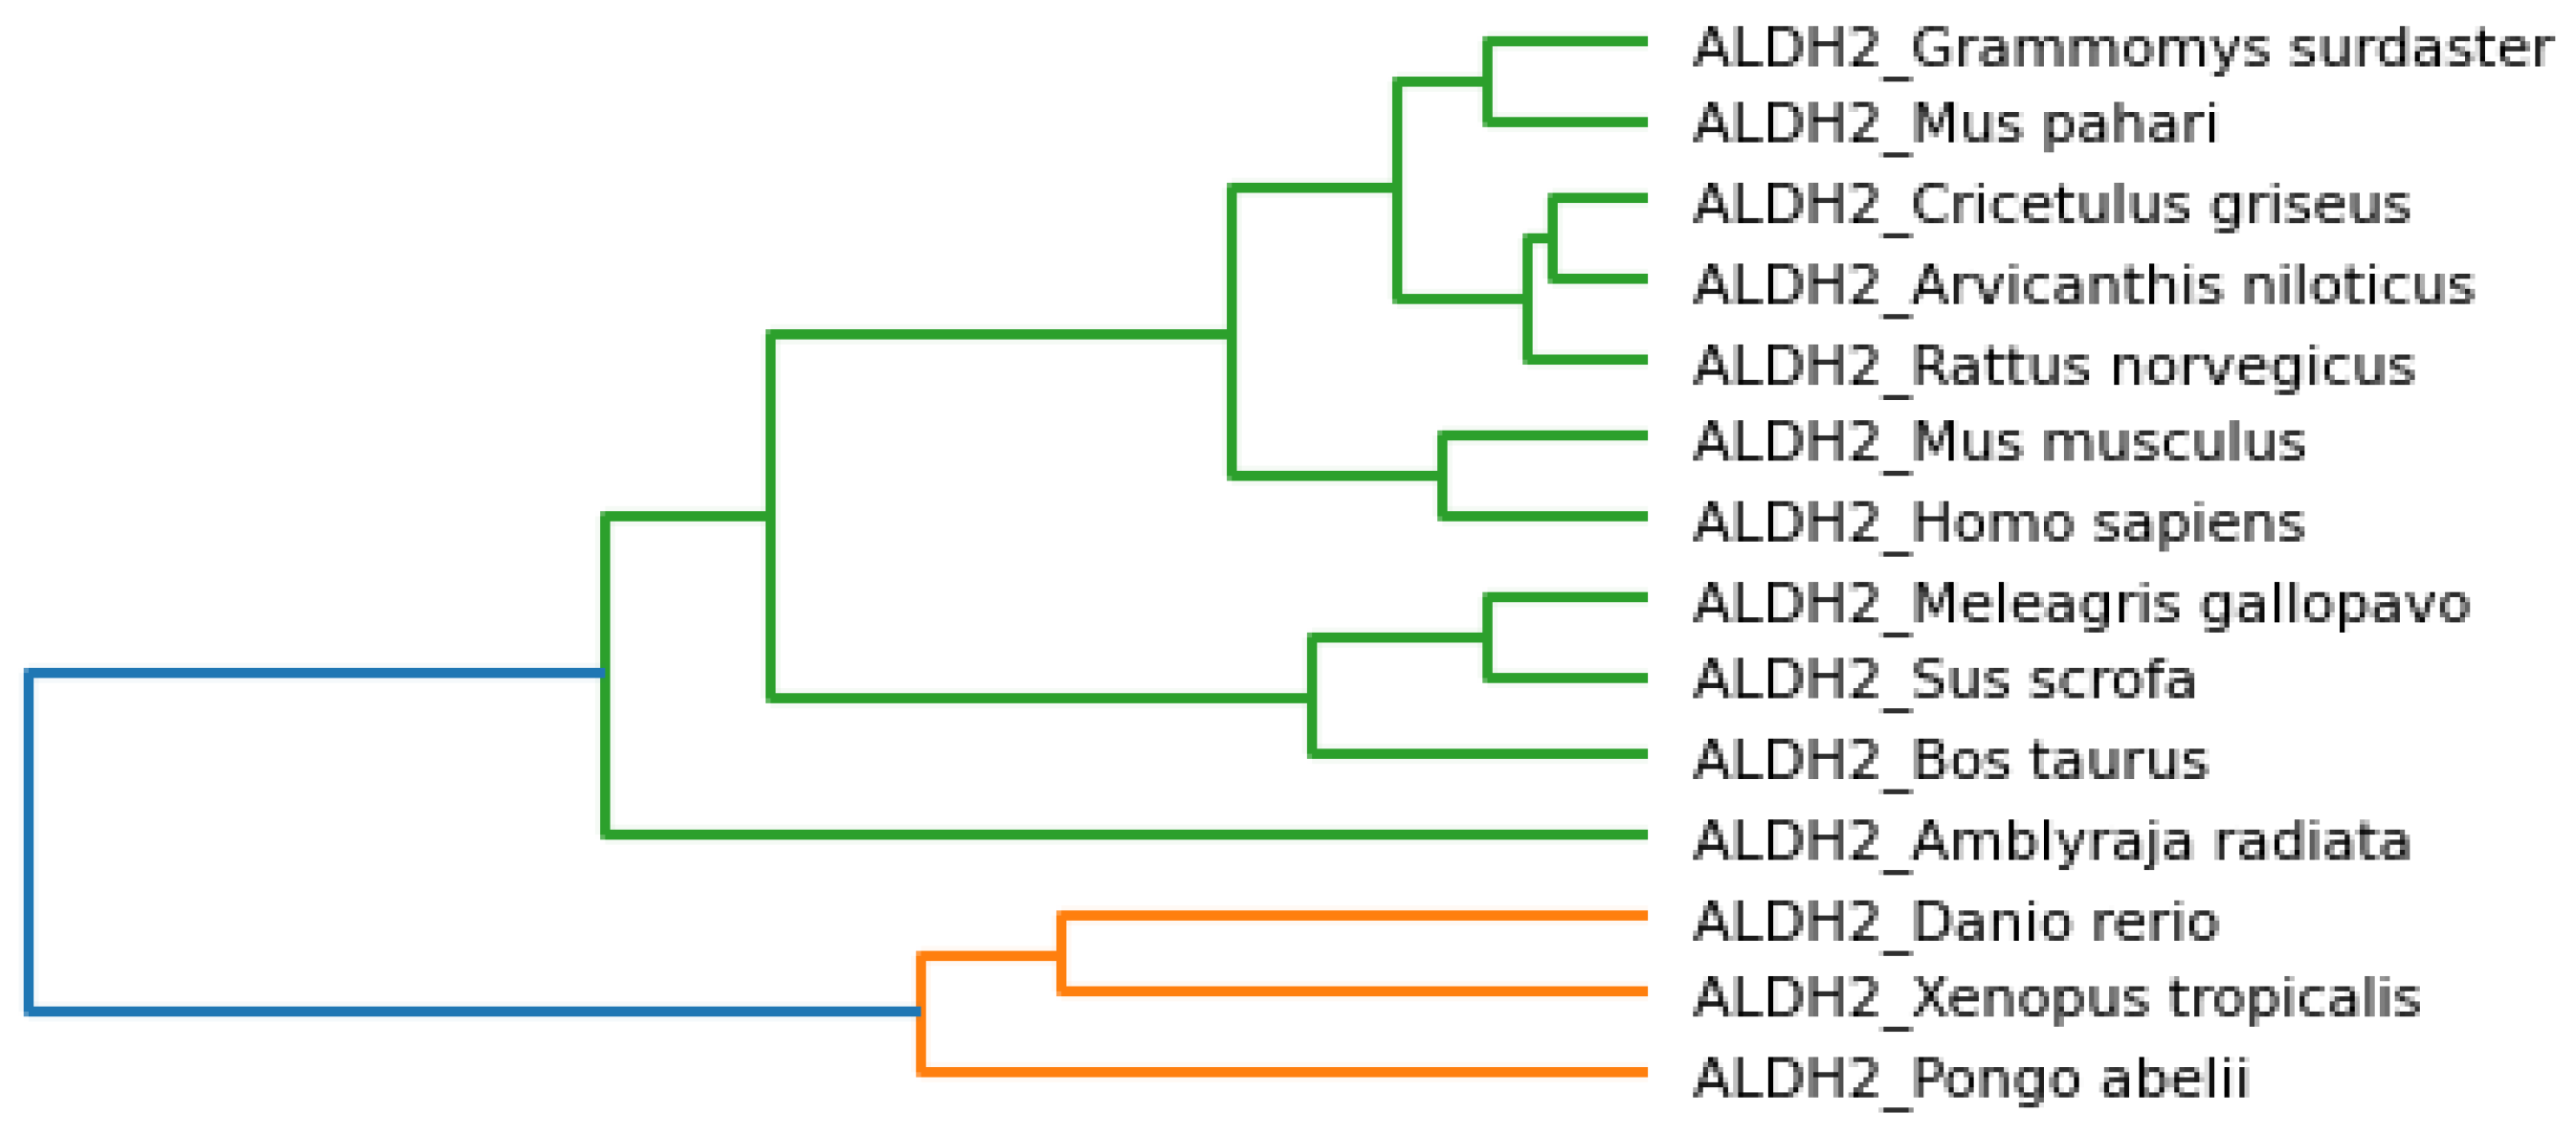
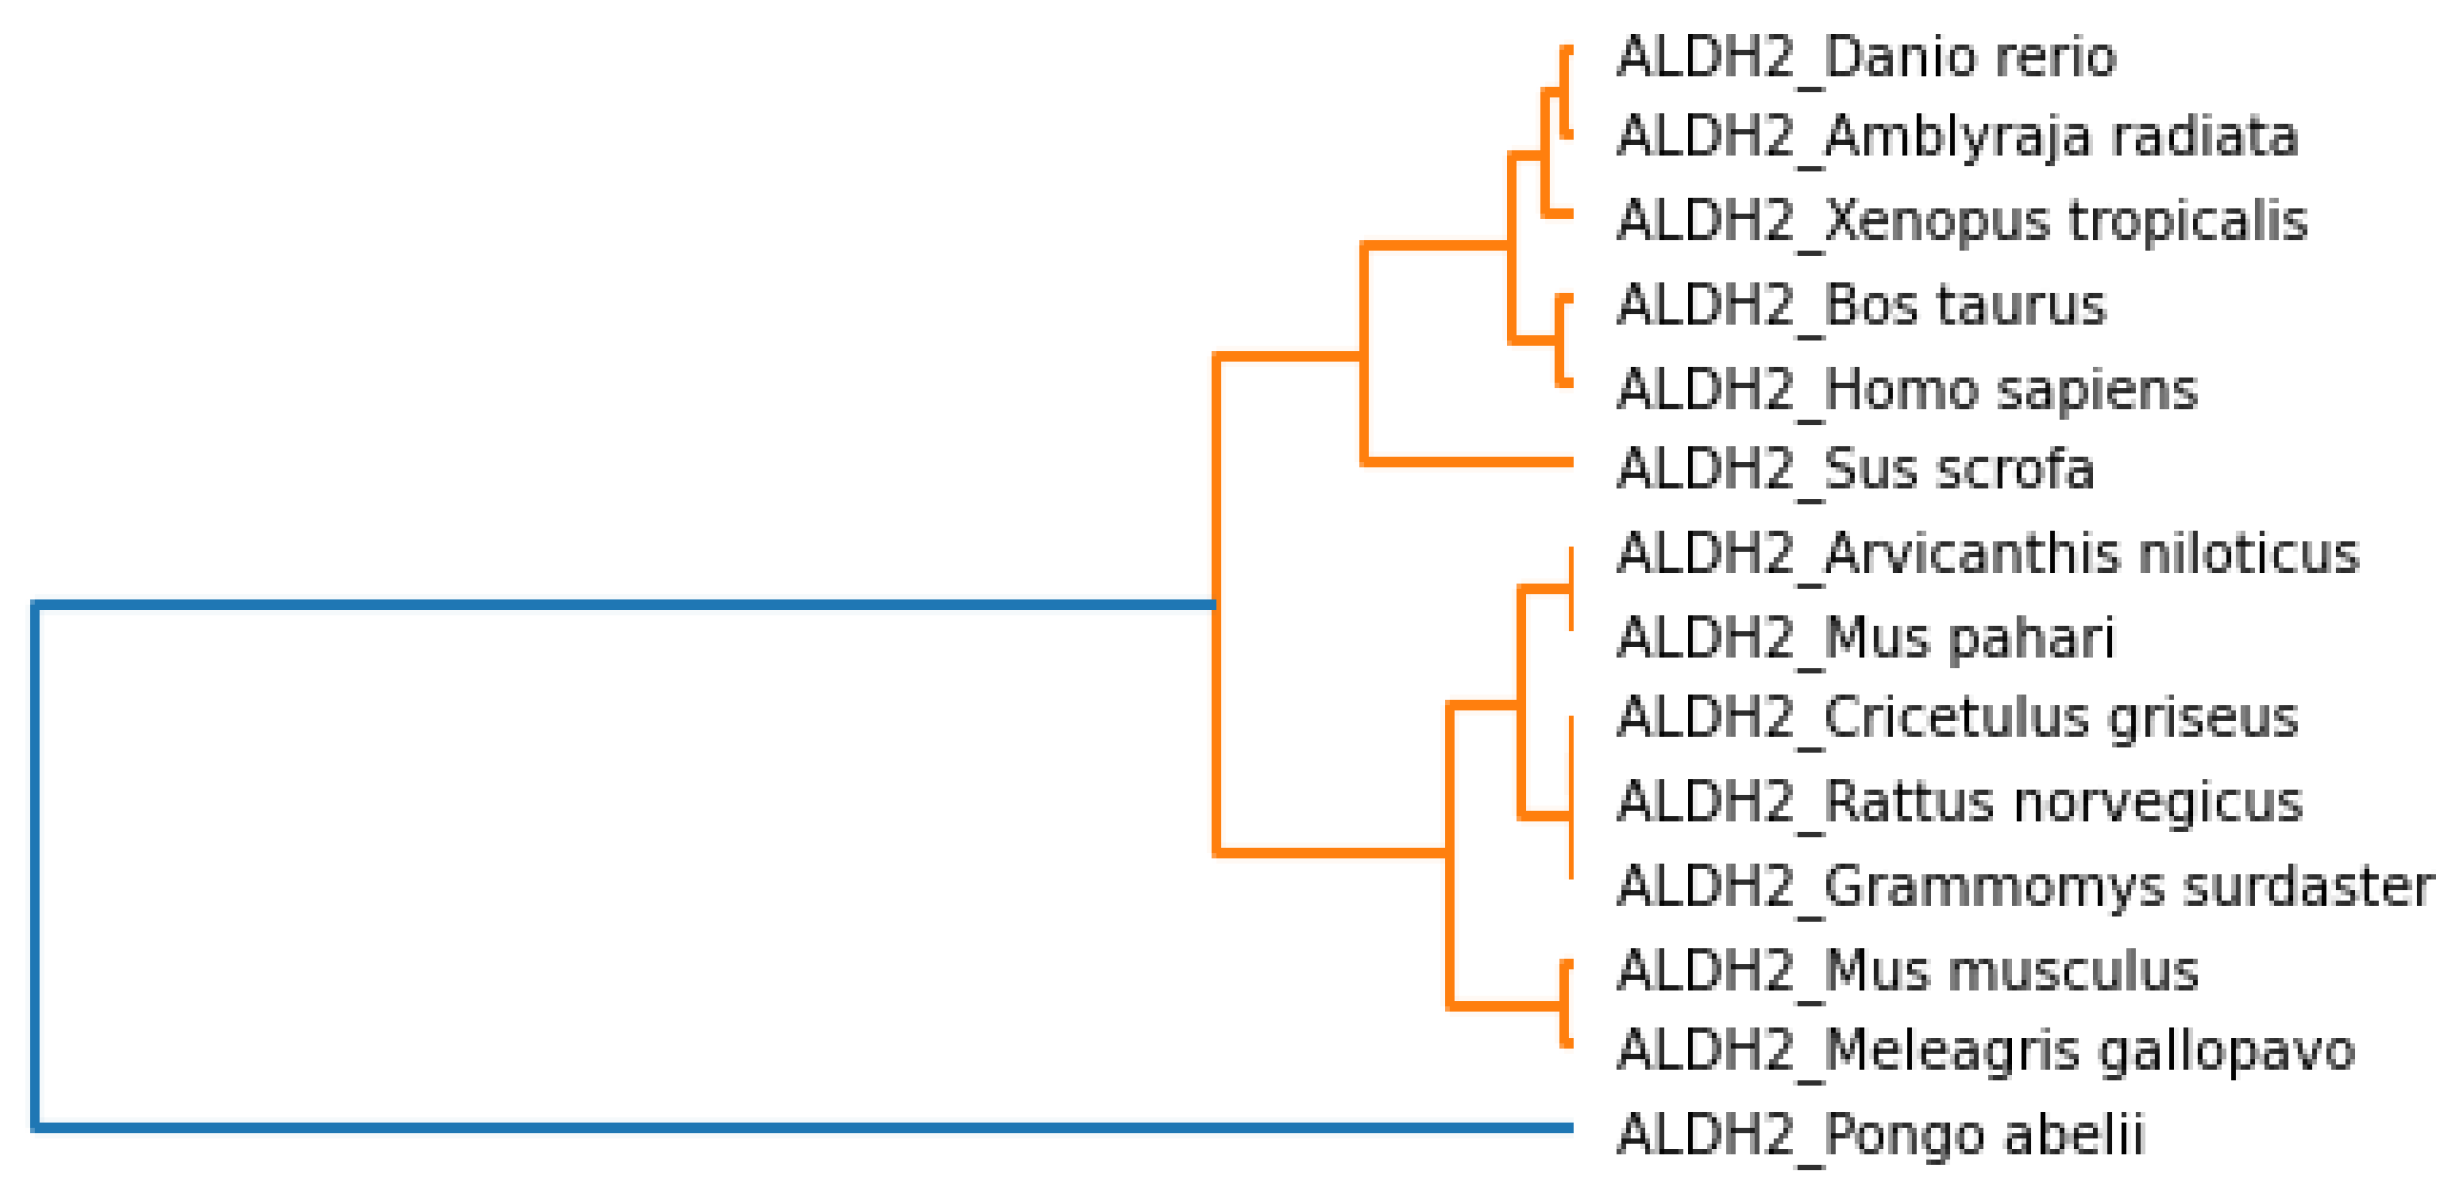
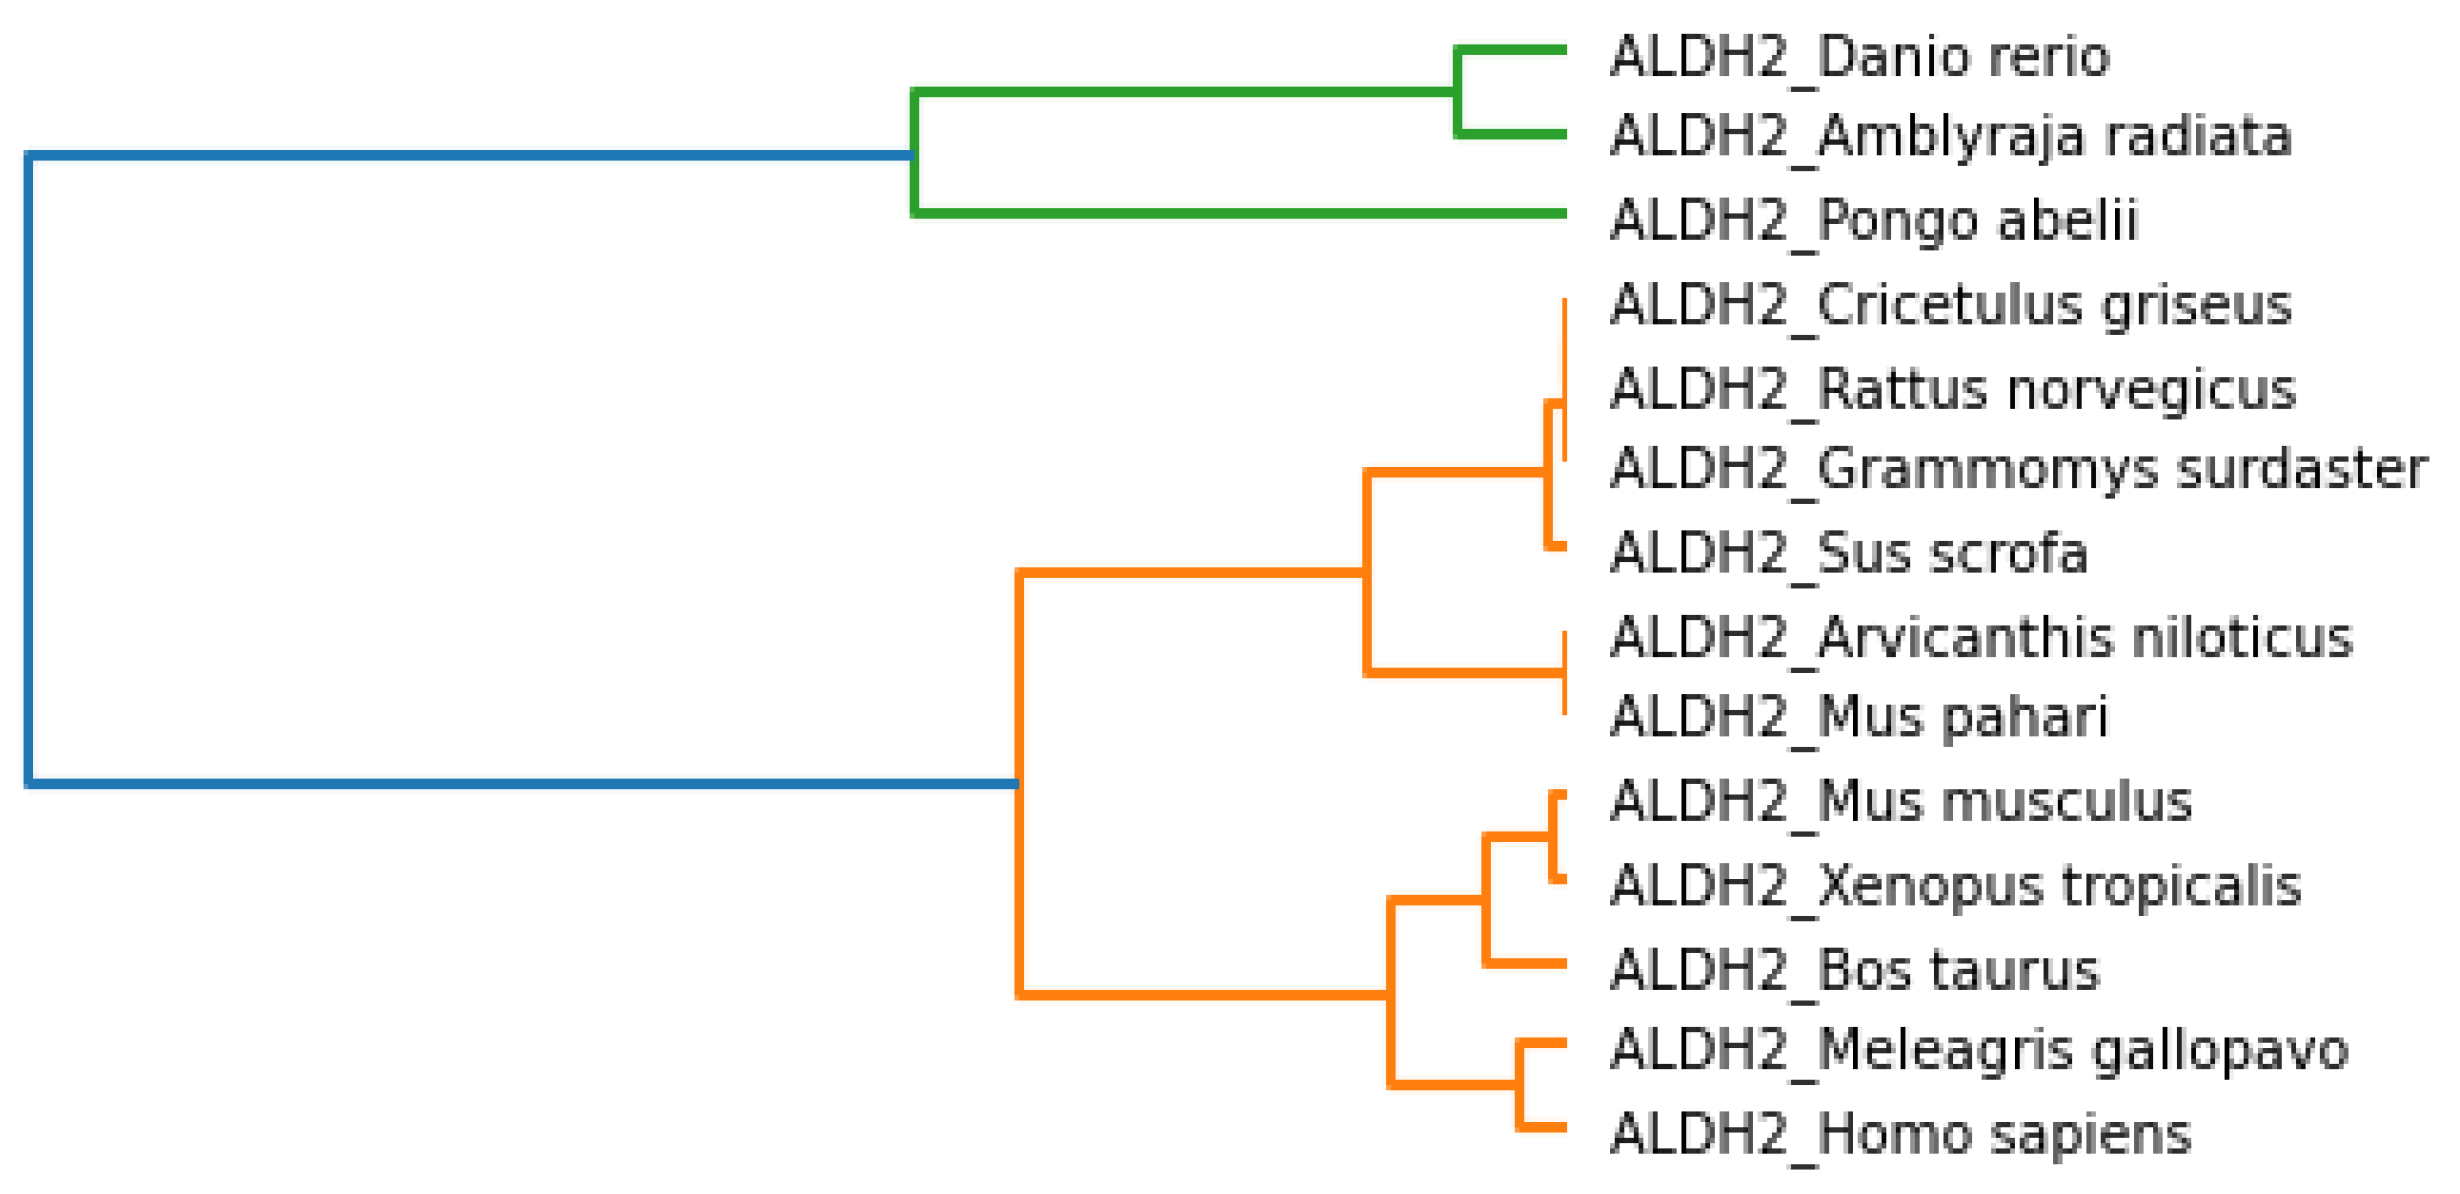
Phylogenetic trees represent evolutionary relations between species, and the associated clusters are shown in
Figure 6. We observed that
Danio rerio, Grammomys surdaster, Cricetulus griseus, Xenopus tropicalis, and
Amblyraja radiata are closer based on the analysis of physicochemical properties.
Mus musculus, Rattus norvegicus, Arvicanthis niloticus, and
Mus pahari were grouped. It was a similar case for
Meleagris gallopavo and
Pongo abelii. Similarly,
Bos taurus and
Sus scrofa were placed nearby.
Homo sapiens was placed separately but bore similarities to
Pongo abelii and
Meleagris gallopavo.
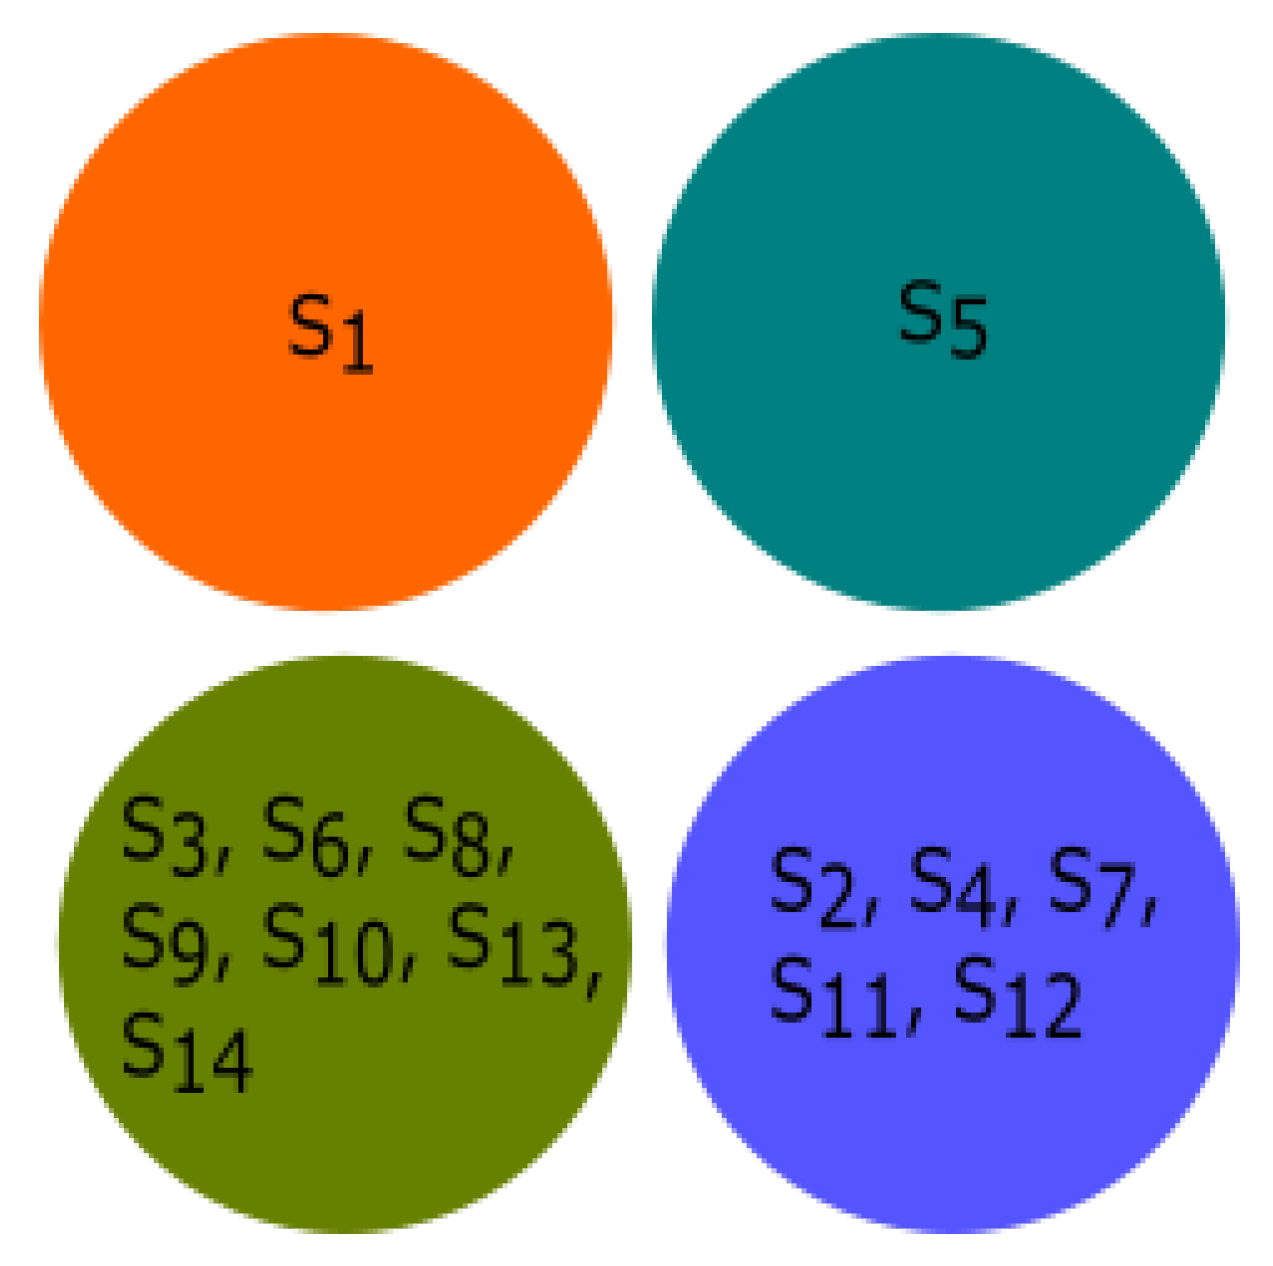
3.2. Experiment Based on Secondary Structure
Secondary structures for all fourteen species were predicted using the online web server CFSSP (Chou and Fasman Secondary Structure Prediction Server) [
29]. All of the fourteen species were clustered using K-means clustering based on their secondary structure, and clusters are shown in
Figure 7. The groups of species {
Pongo abelii, Xenopus tropicalis, Danio rerio}, {
Sus scrofa, Meleagris gallopavo, Bos taurus}, and {
Homo sapiens, Rattus norvegicus, Mus pahari, Arvicanthis niloticus, Cricetulus griseus, Grammomys surdaster, Mus musculus} are closely related. From
Figure 7, we observed that
Amblyraja radiata was not clustered with any other species. However, it was clustered with
Rattus norvegicus, Xenopus tropicalis, Mus pahari, Arvicanthis niloticus, Cricetulus griseus, Danio rerio, Grammomys surdaster, and
Mus musculus as per the physicochemical properties of ALDH2 sequences.
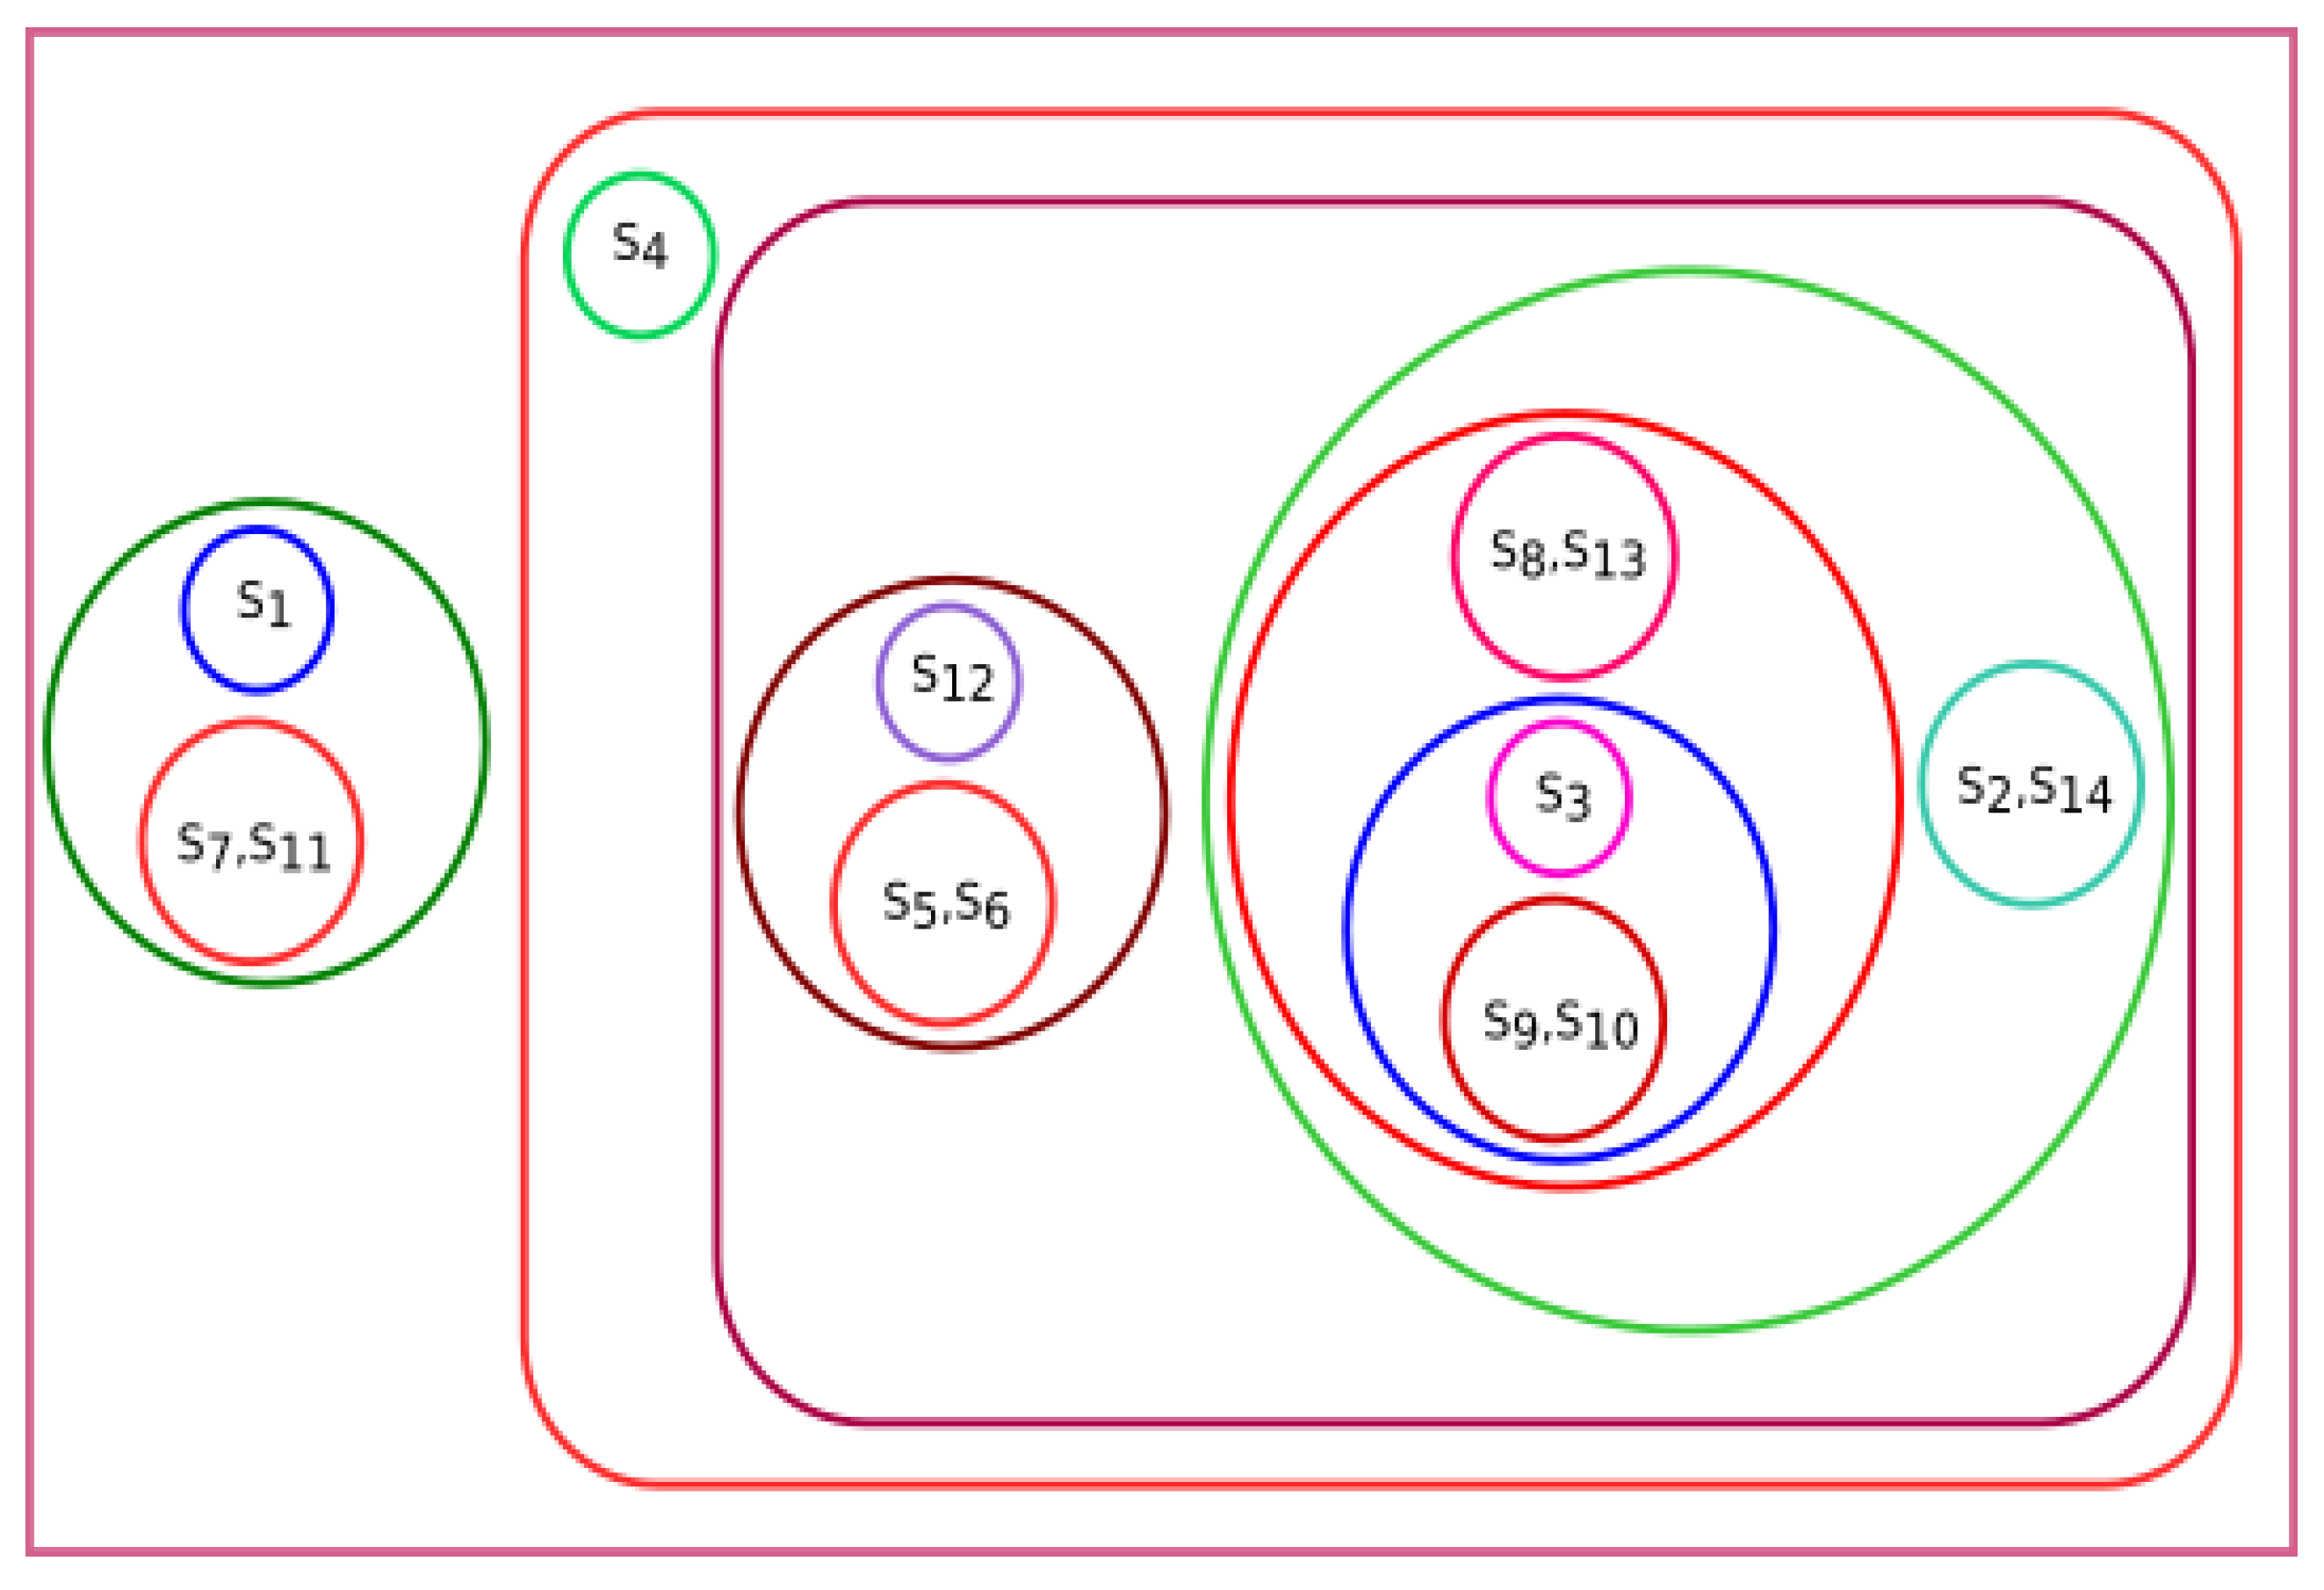
The phylogenetic tree based on the secondary structure and associated clusters are shown in
Figure 8 and
Figure 9, respectively. We observed that
Mus pahari, Grammomys surdaster, Cricetulus griseus, Arvicanthis niloticus, and
Rattus norvegicus were closer according to the secondary structure analysis.
Homo sapiens and
Mus musculus grouped along with the above species. Again, the cases for
Meleagris gallopavo, Sus scrofa and
Bos taurus were similar. Similarly,
Danio rerio, Xenopus tropicalis and
Pongo abelii were close. However,
Amblyraja radiata was placed separately because it did not show similarity based on the secondary structure.
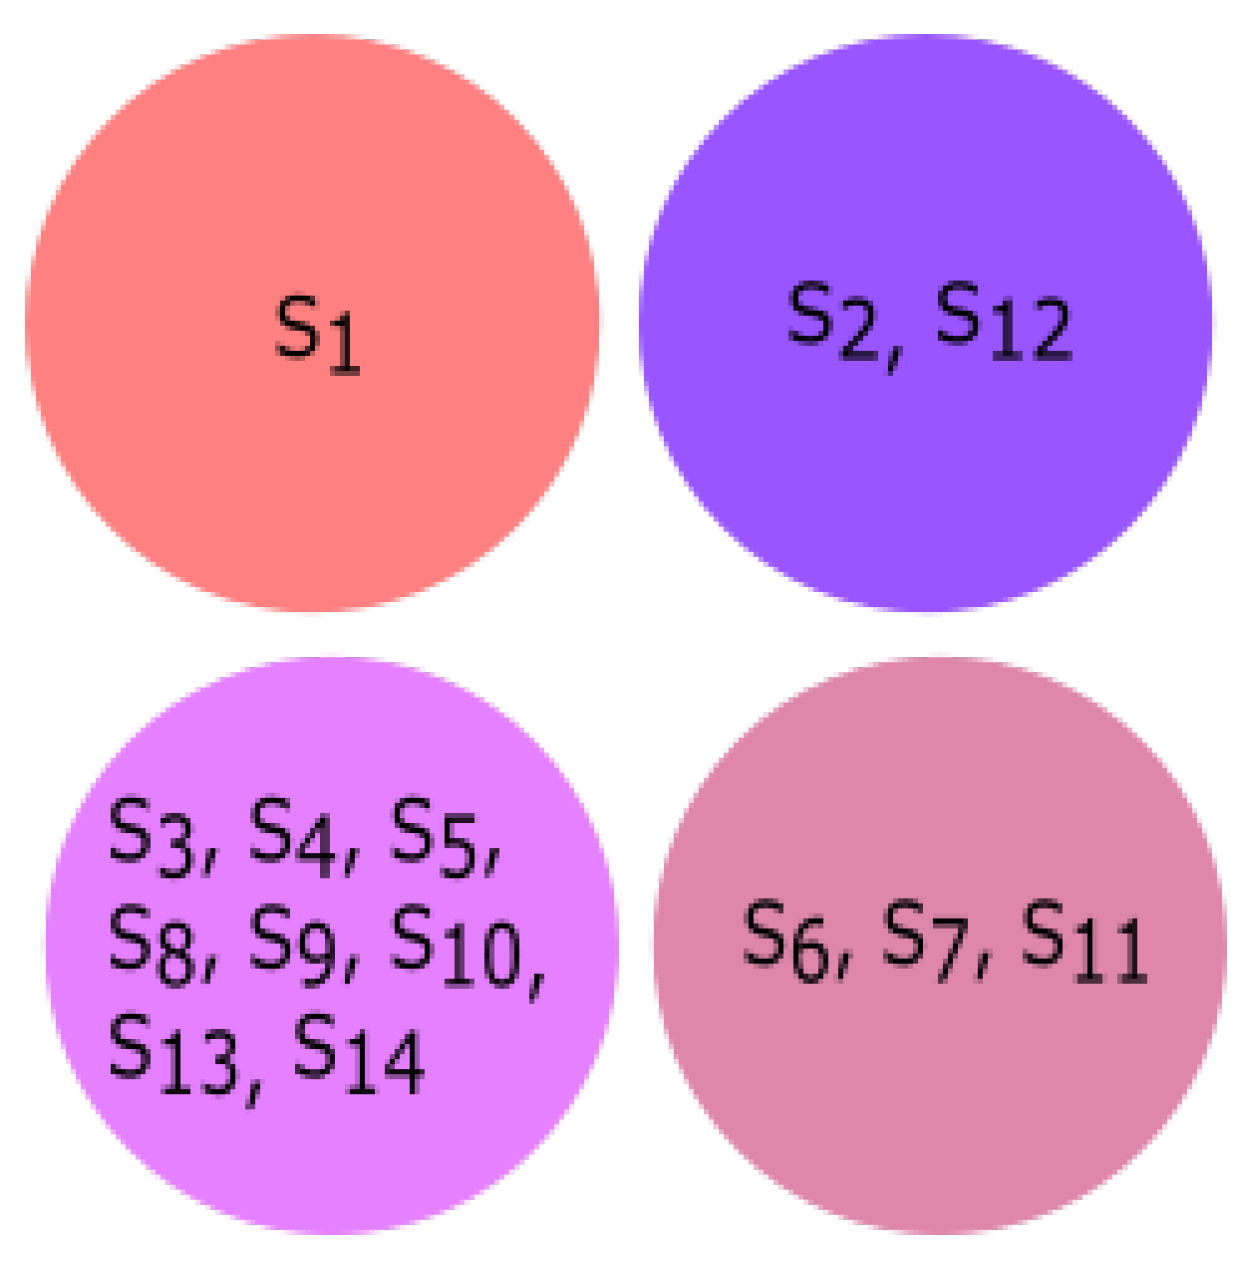
3.3. Experiment Based on Hurst Exponent
All fourteen species were clustered based on the Hurst exponent using the K-means algorithm. The clusters of species {
Homo sapiens, Amblyraja radiata, Bos taurus, Danio rerio, Xenopus tropicalis} and {
Rattus norvegicus, Meleagris gallopavo, Mus pahari, Arvicanthis niloticus, Cricetulus griseus, Grammomys surdaster, Mus musculus} are closely related according to the Hurst exponent. The species
Pongo abelii formed a singleton cluster when the Hurst exponent was taken into consideration even though it was clustered with
Xenopus tropicalis and
Danio rerio as per the secondary structure and clustered with
Meleagris gallopavo as per the physicochemical properties.
Sus scrofa formed a singleton cluster. Still, it was grouped with
Bos taurus as per the physicochemical properties and with
Meleagris gallopavo and
Bos taurus as per the secondary structure of ALDH2 sequences. The results of K-means clustering are shown in
Figure 10.
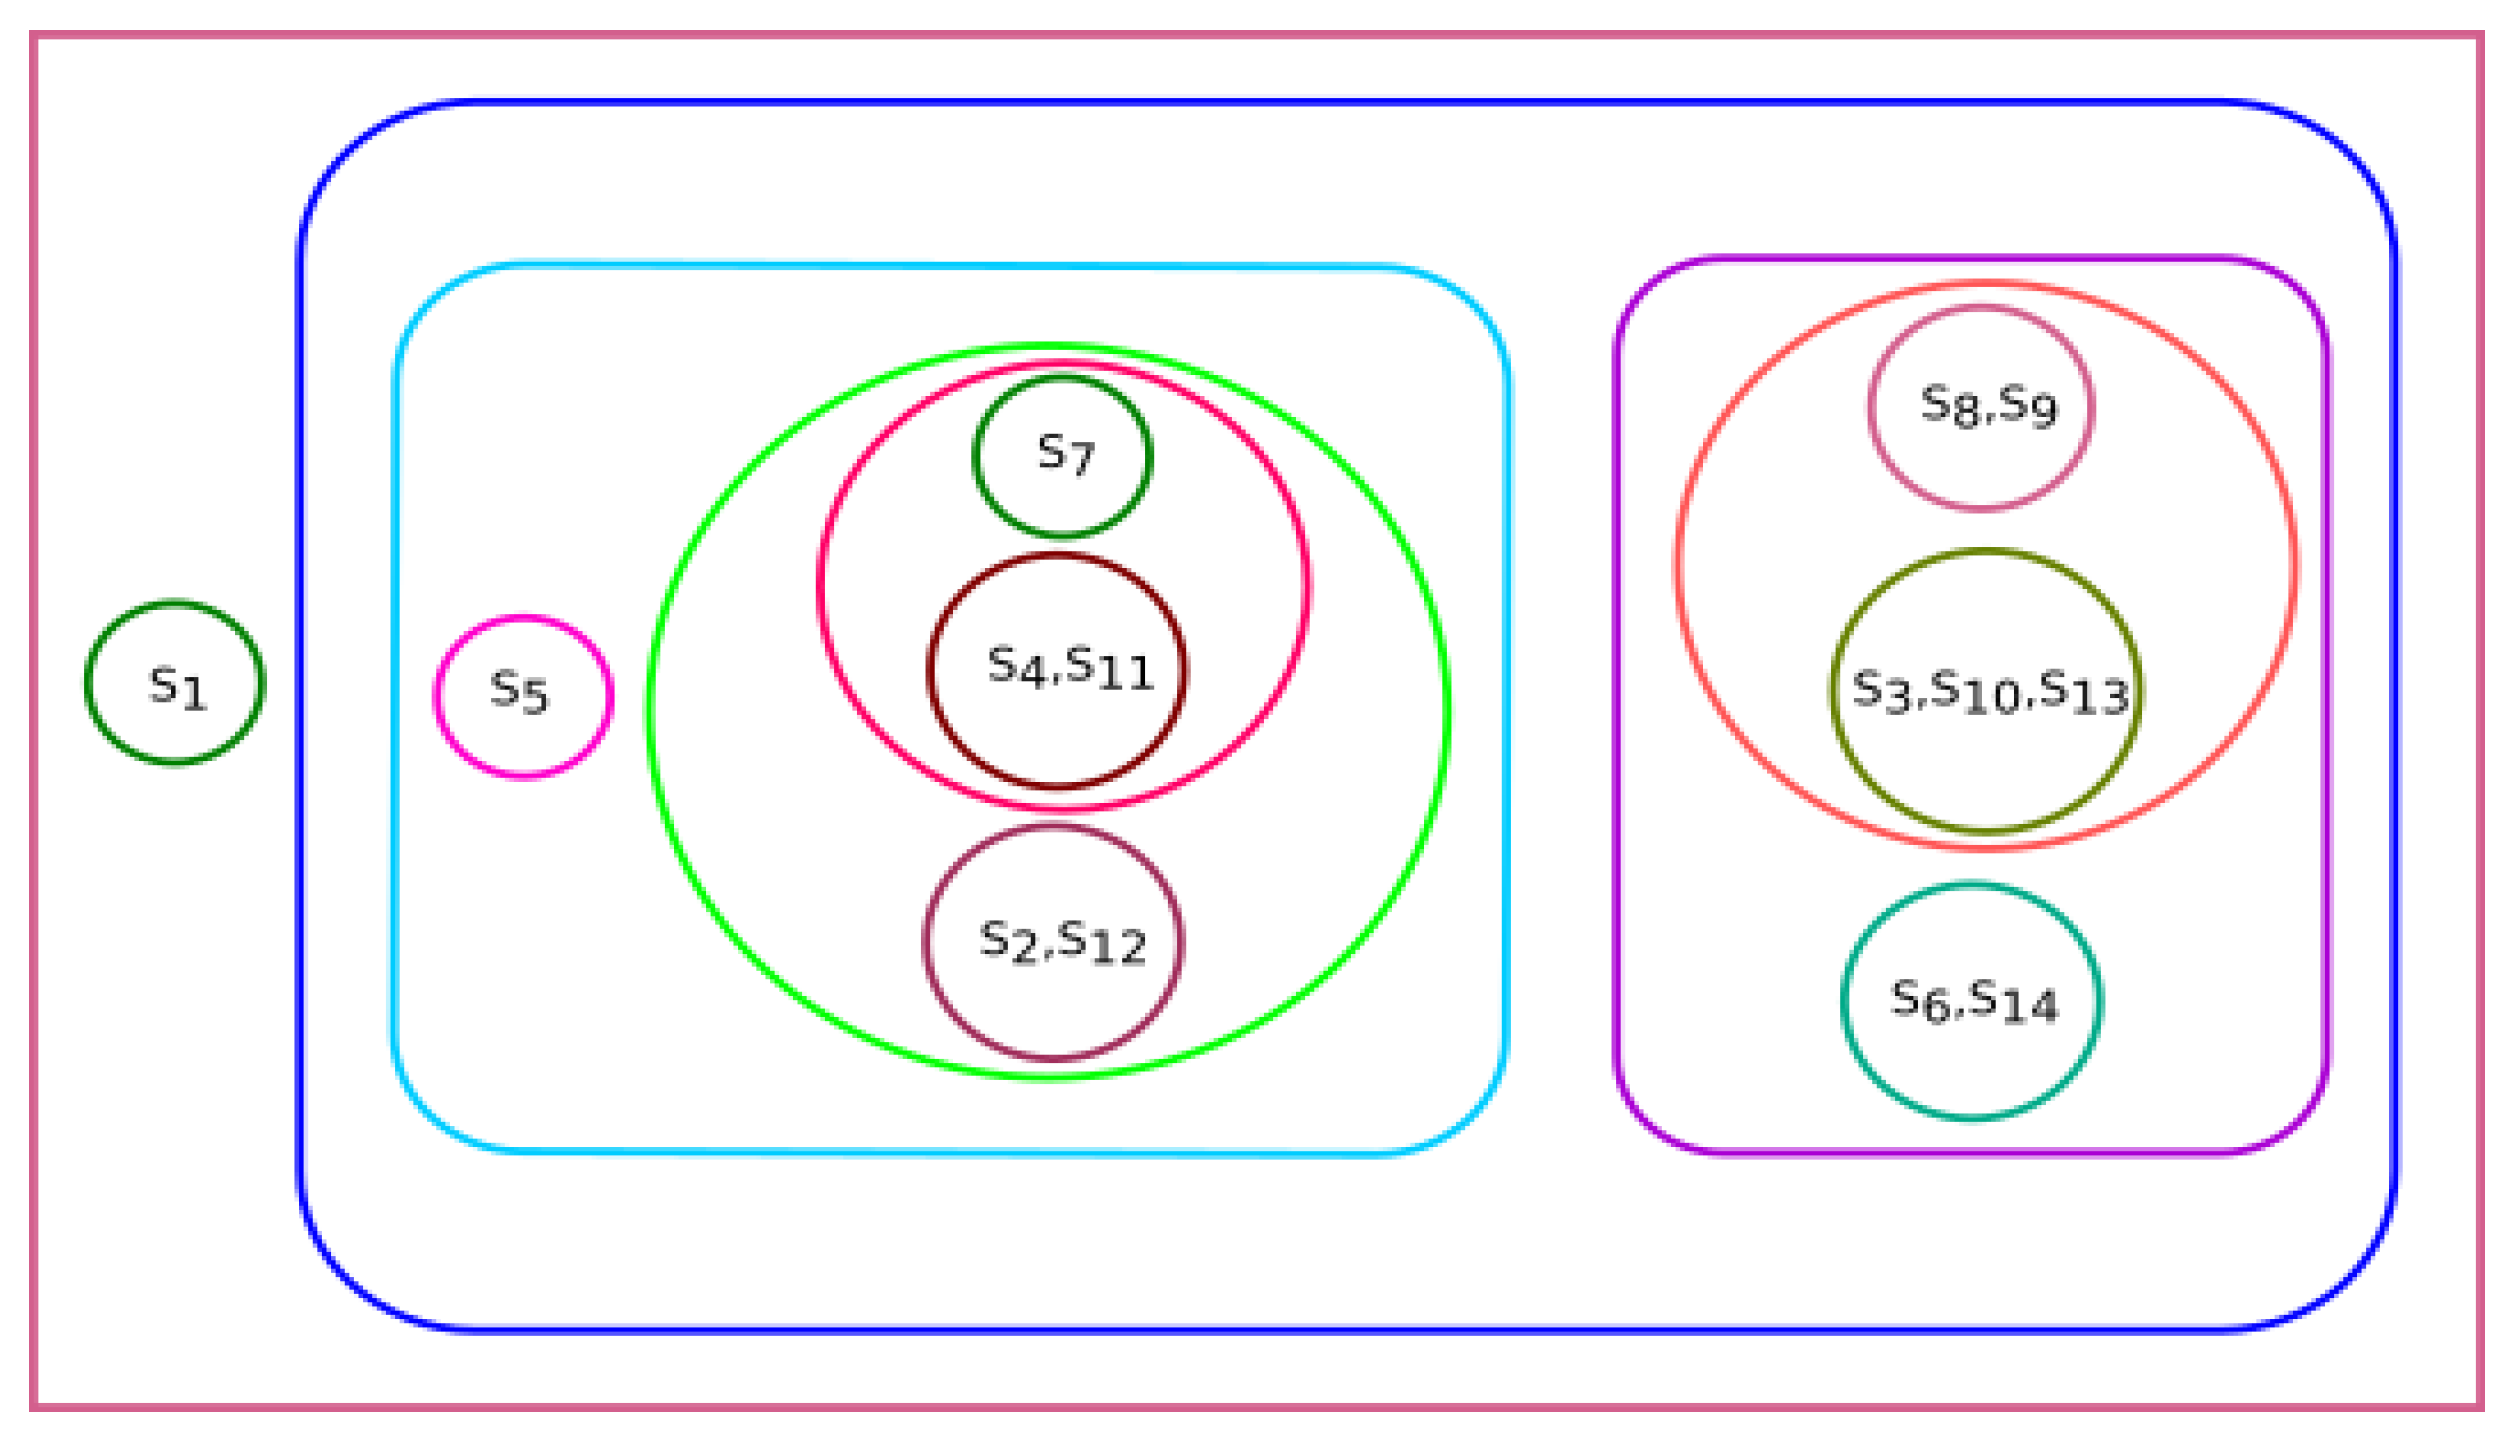
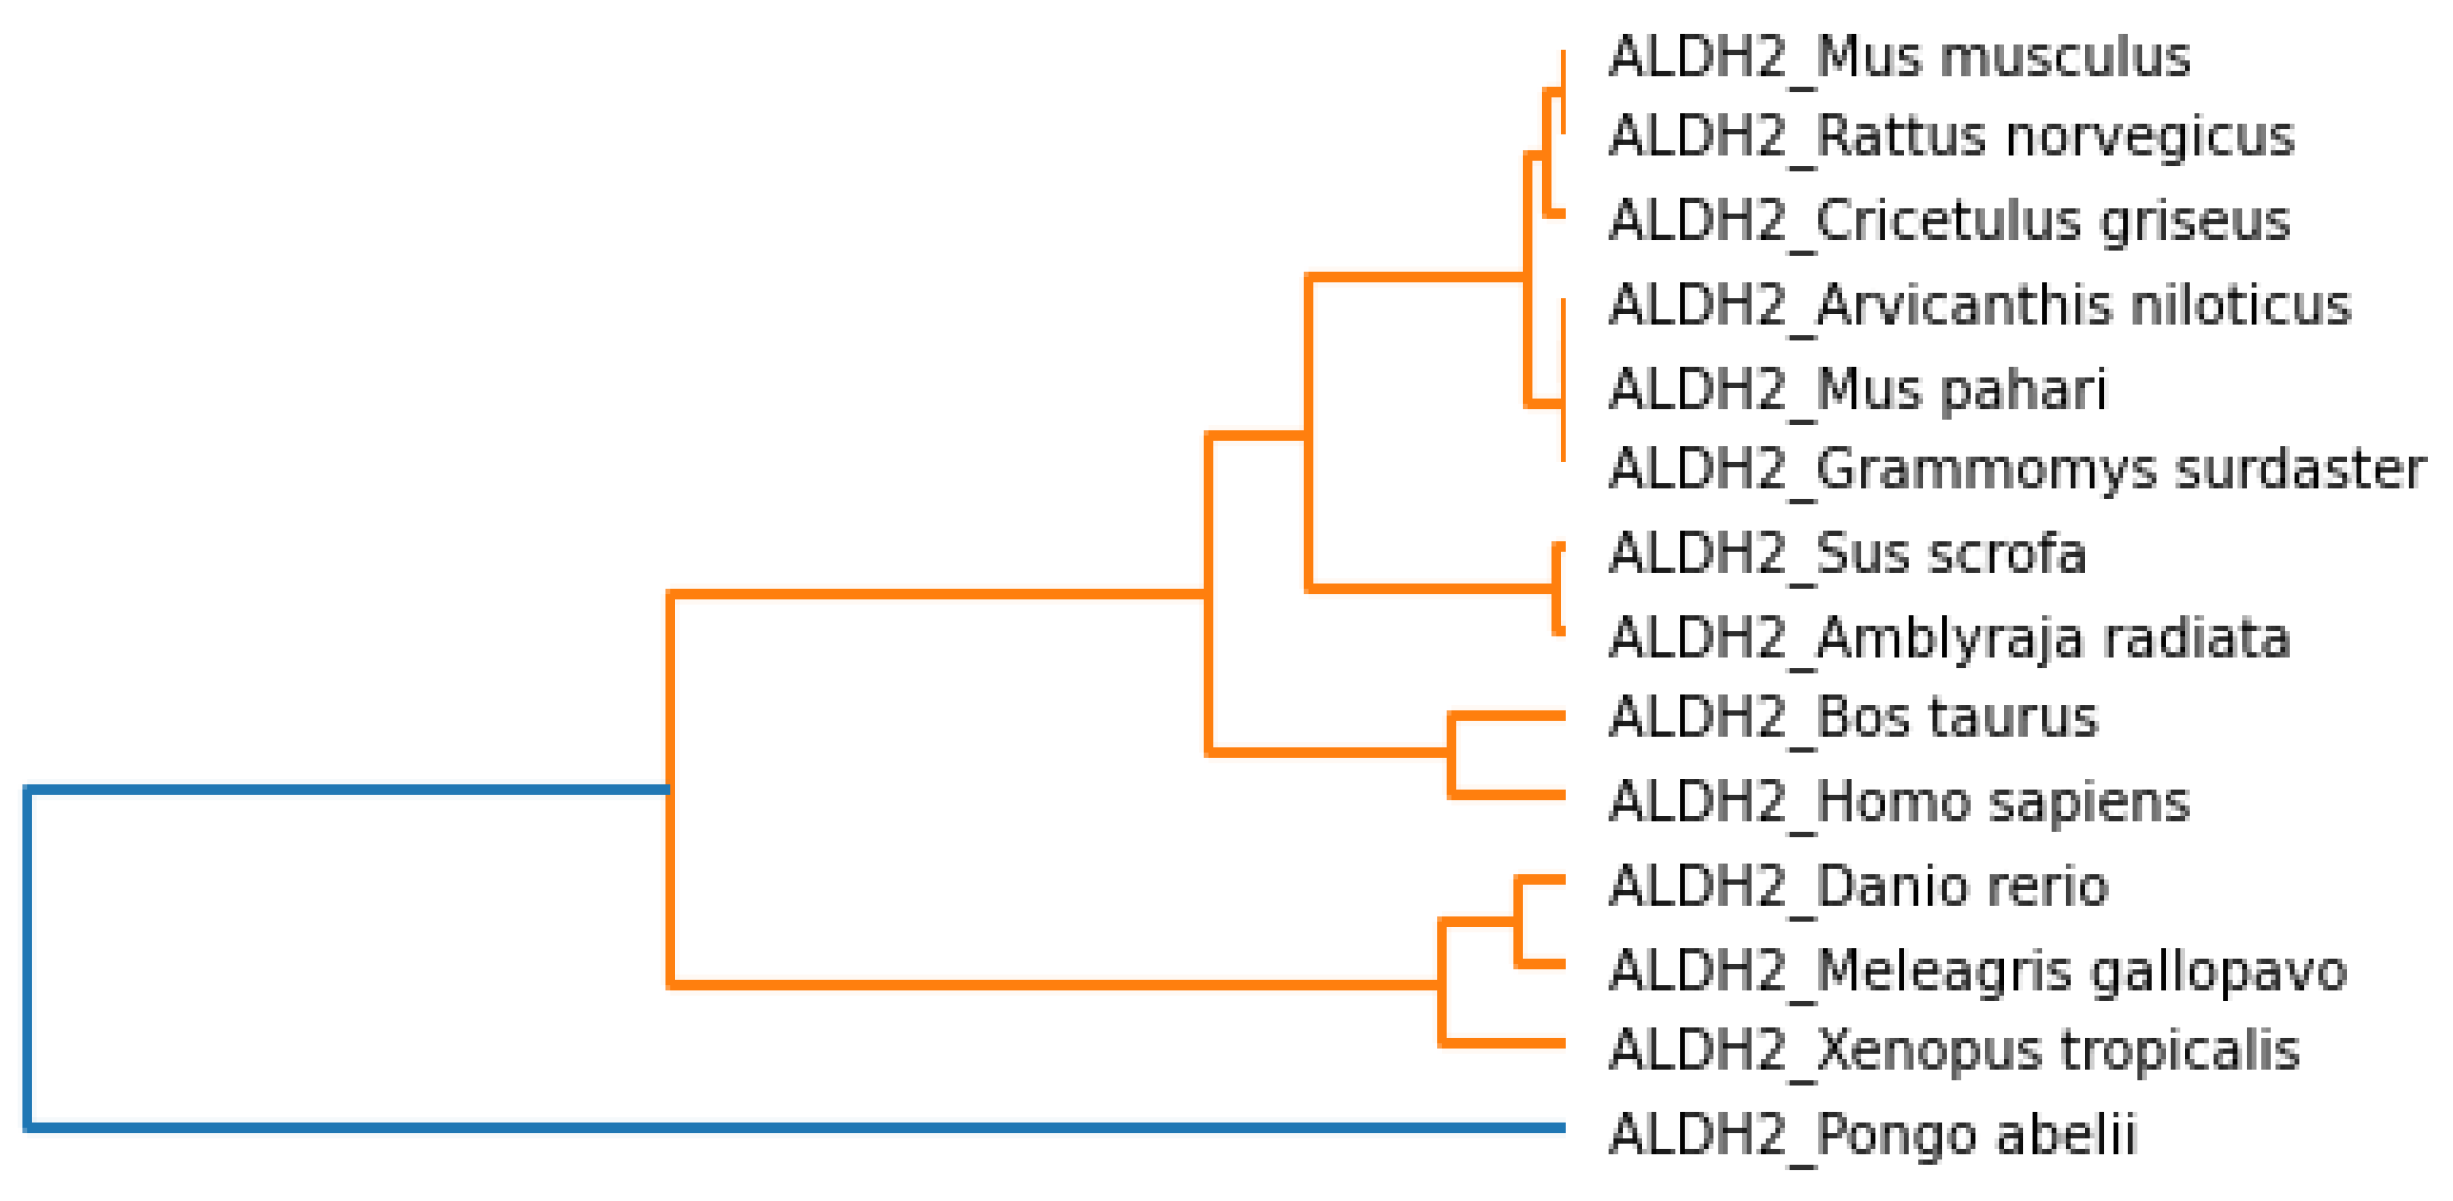
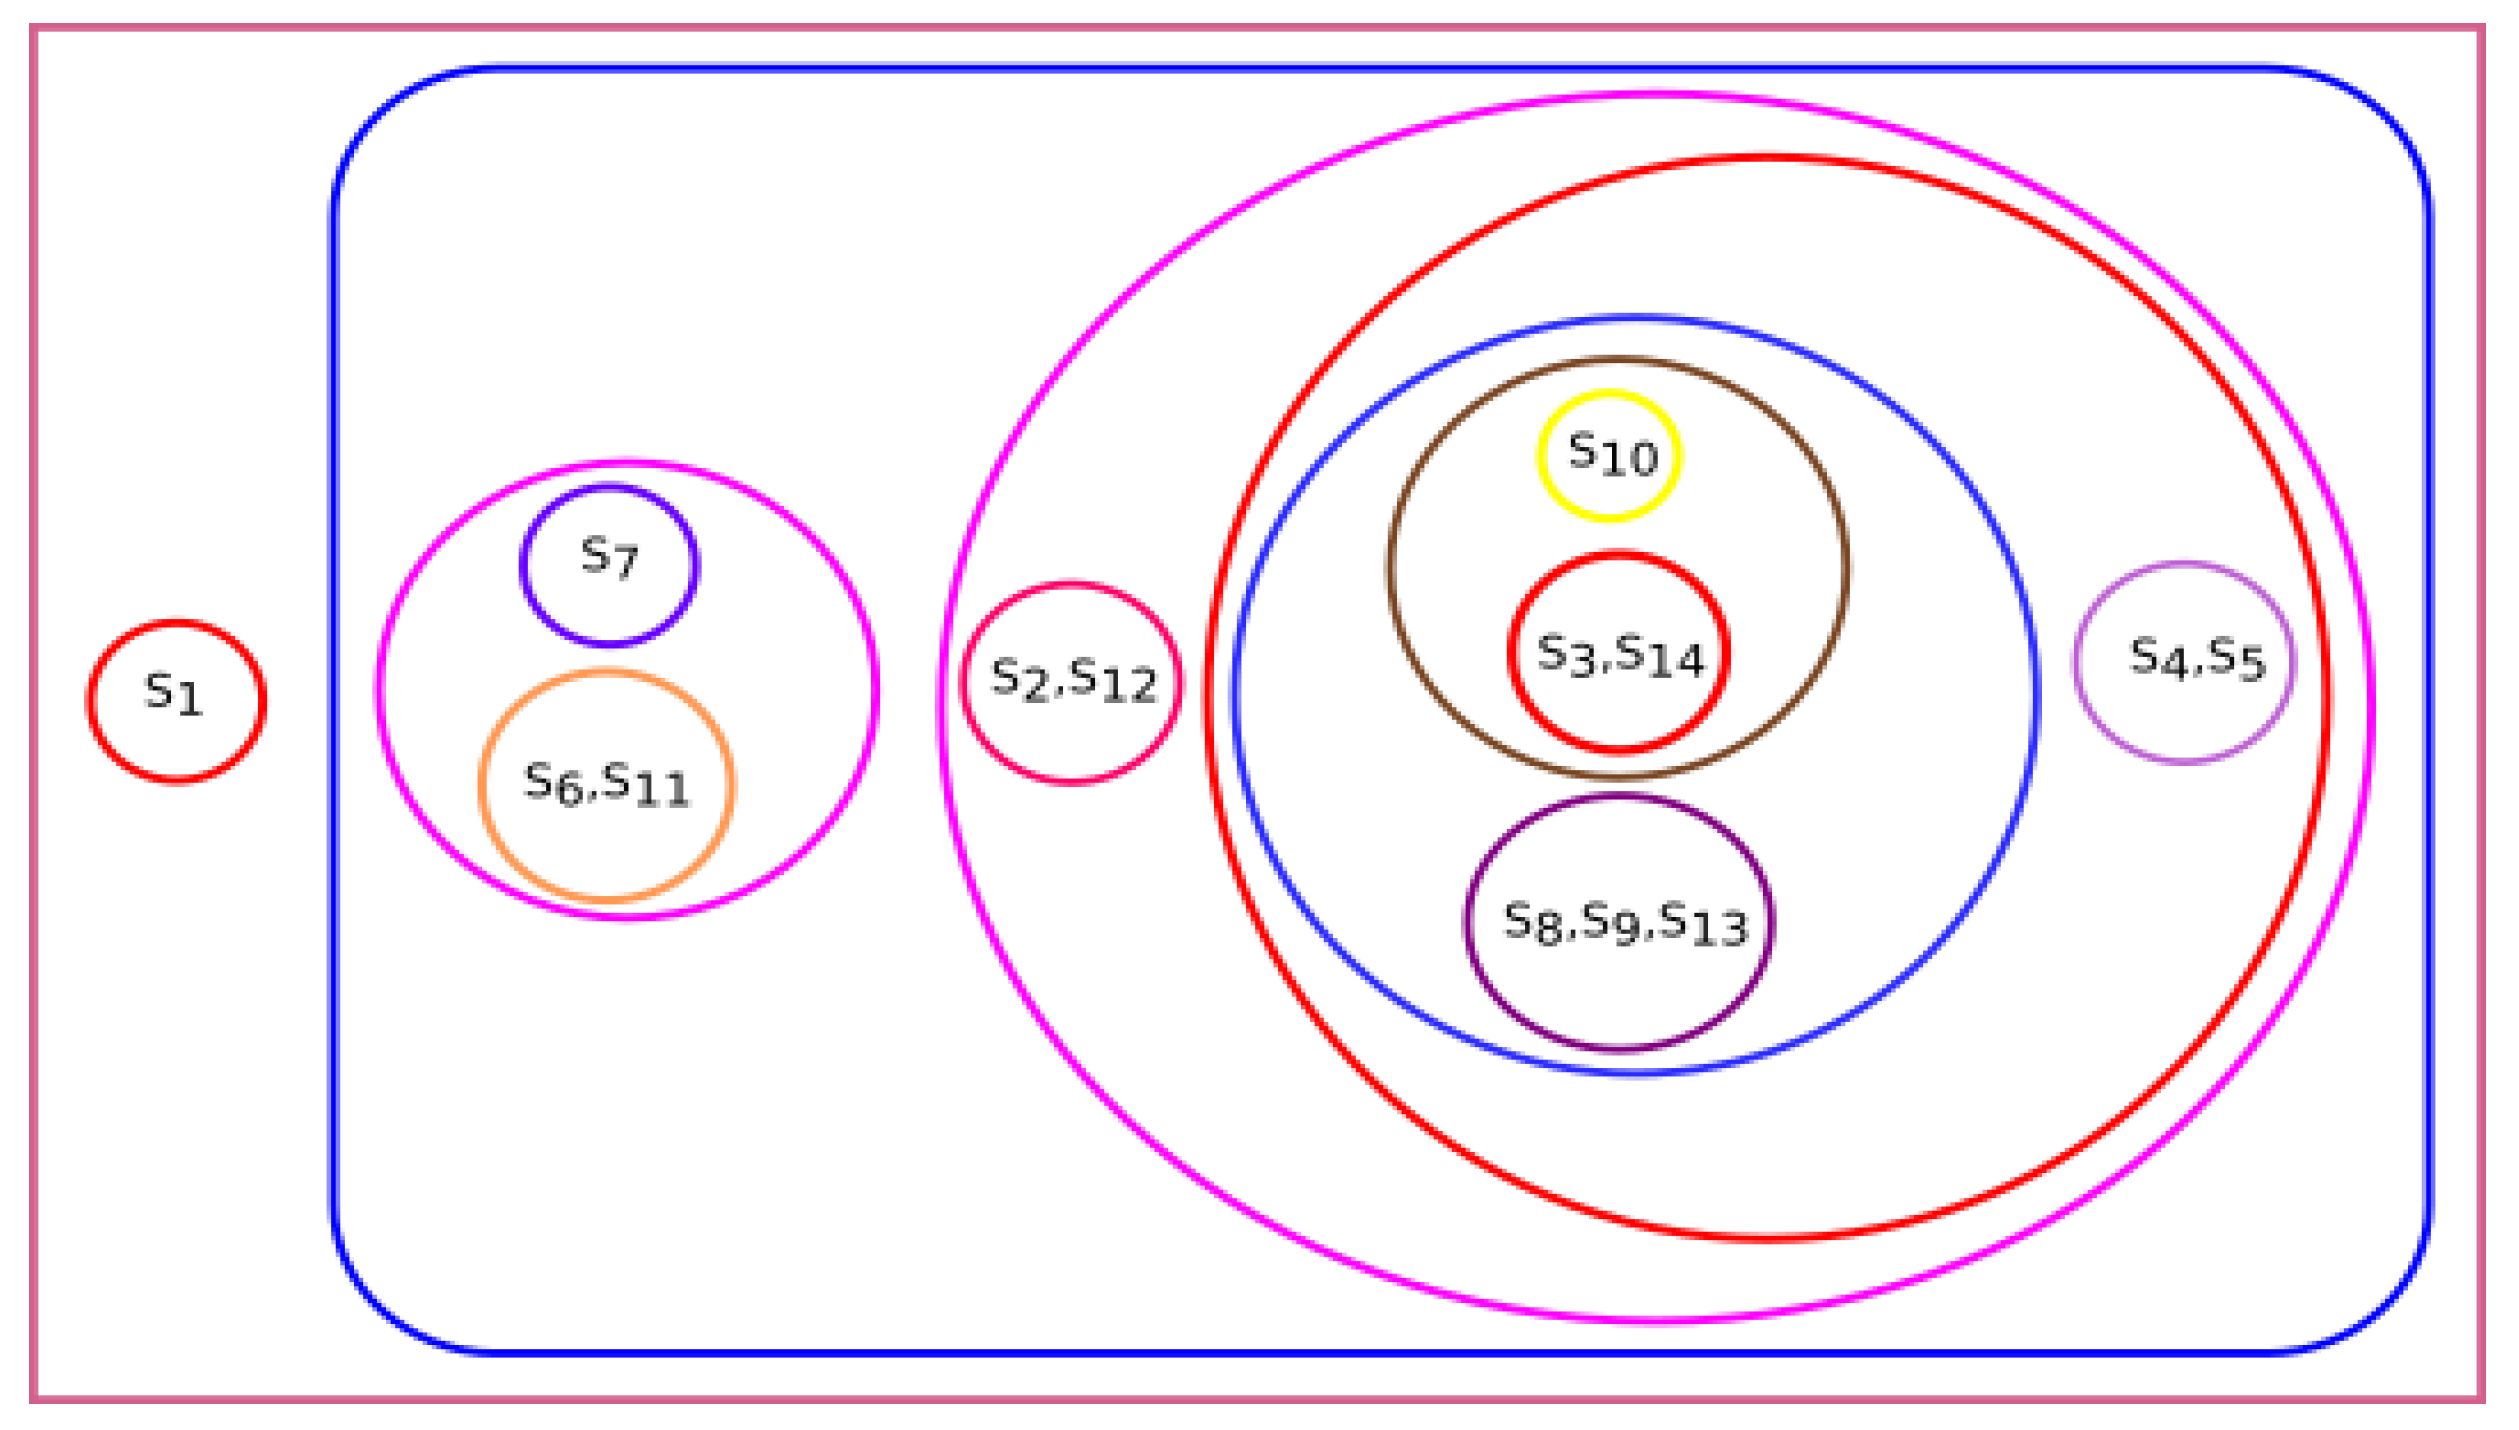
The phylogenetic tree based on the Hurst exponent and associated clusters are shown in
Figure 11 and
Figure 12, respectively. From
Figure 11, we observed that
Danio rerio, Amblyraja radiata, Xenopus tropicalis, Bos taurus and
Homo sapiens were close. Similarly, the species
Arvicanthis niloticus, Mus pahari, Cricetulus griseus, Rattus norvegicus, Grammomys surdaster were related to
Mus musculus and
Meleagris gallopavo.
Pongo abelii was not grouped with other species.
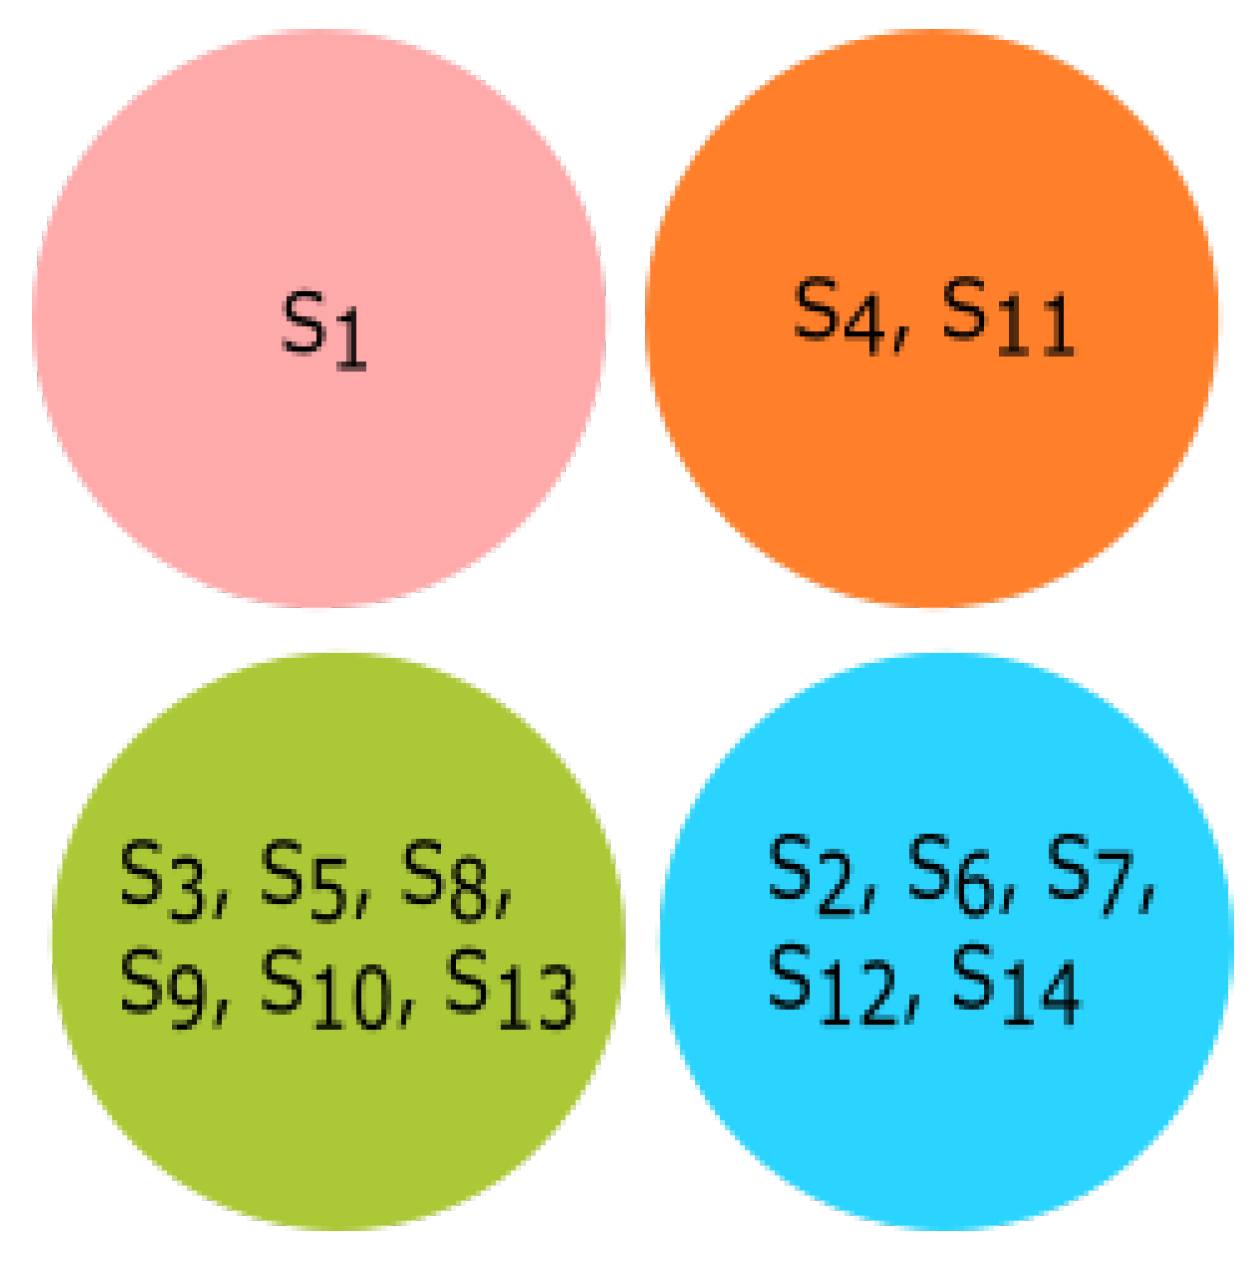
3.4. Experiment Based on Fractal Dimension
All species were clustered based on the fractal dimension using K-means clustering. The results of the four clusters are shown in
Figure 13. The clusters of species {
Bos taurus, Homo sapiens}, {
Amblyraja radiata, Mus pahari, Sus scrofa, Arvicanthis niloticus, Cricetulus griseus, Rattus norvegicus, Grammomys surdaster, Mus musculus}, and {
Meleagris gallopavo, Xenopus tropicalis, Danio rerio} were placed together according to fractal dimension.
Pongo abelii formed a singleton cluster and not grouped with other species.
The phylogenetic tree based on fractal dimension and associated clusters are shown in
Figure 14 and
Figure 15, respectively. We found that
Mus musculus, Rattus norvegicus, Cricetulus griseus, Arvicanthis niloticus, Mus pahari, and
Grammomys surdaster were closely related to
Sus scrofa and
Amblyraja radiata and grouped. Similarly,
Danio rerio, Meleagris gallopavo, and
Xenopus tropicalis were placed together. Due to the fractal dimension similarity between
Bos taurus and
Homo sapiens, they were grouped. The species
Pongo abelii was placed separately.
3.5. Experiment Based on Shannon Entropy
All fourteen species were grouped based on their Shannon entropy. K-means clustering was used to cluster these species; the results are shown in
Figure 16. The groups of species {
Amblyraja radiata, Danio rerio}, {
Rattus norvegicus, Sus scrofa, Mus pahari, Arvicanthis niloticus, Cricetulus griseus, Grammomys surdaster}, and {
Homo sapiens, Meleagris gallopavo, Xenopus tropicalis, Bos taurus, Mus musculus} were closely related. We found that
Pongo abelii was clustered uniquely when Shannon entropy was considered. It did not form any cluster with other species per the Hurst exponent and fractal dimension of ALDH2 protein sequences.
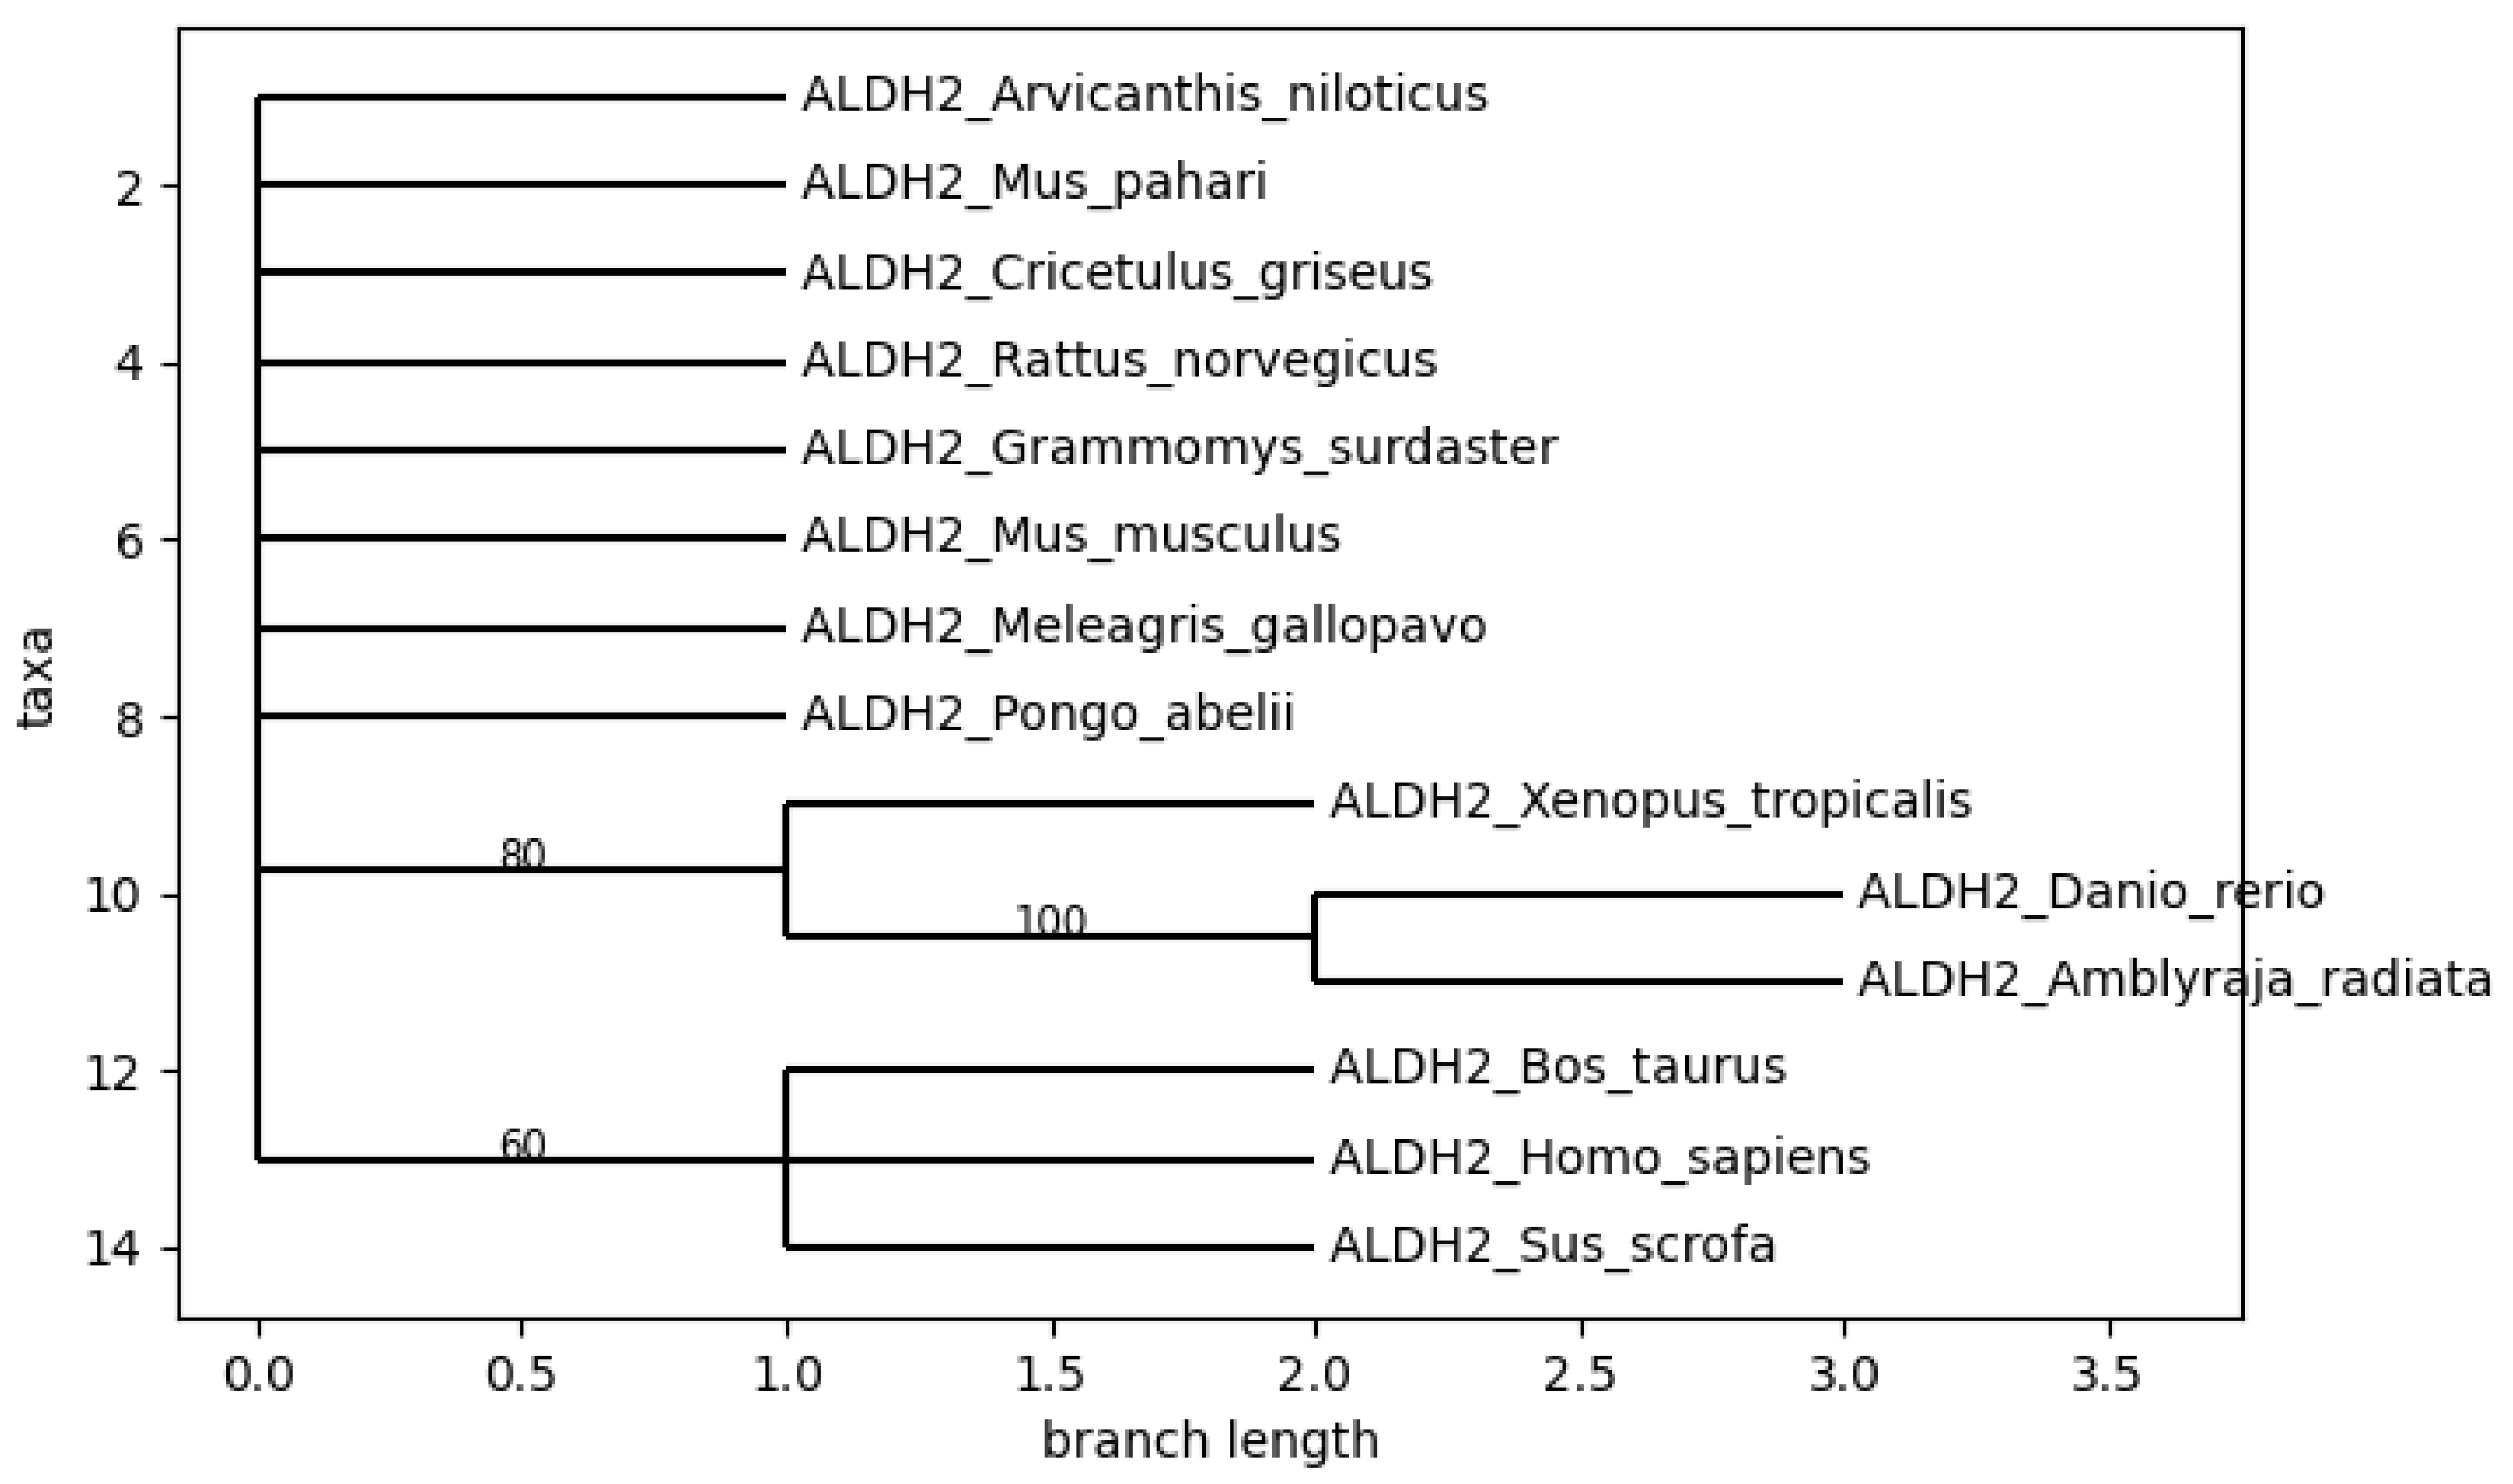
The phylogenetic tree based on Shannon entropy and its associated clusters are shown in
Figure 17 and
Figure 18, respectively. In this scenario,
Cricetulus griseus, Rattus norvegicus, and
Grammomys surdaster are grouped under a single clade, and these species are closely related to
Sus scrofa, Mus pahari, and
Arvicanthis niloticus. Similarly,
Mus musculus and
Xenopus tropicalis are closely related to
Bos taurus, Homo sapiens, and
Meleagris gallopavo. The species
Pongo abelii formed a singleton cluster.
4. Discussion
This paper comprehensively analyzed ALDH2 sequences of fourteen species, including Homo sapiens (human). The other species are Pongo abelii, Rattus norvegicus, Amblyraja radiata, Sus scrofa, Meleagris gallopavo, Xenopus tropicalis, Mus pahari, Arvicanthis niloticus, Cricetulus griseus, Danio rerio, Bos taurus, Grammomys surdaster, and Mus musculus.
ALDH2 is an enzyme needed for alcohol detoxification. ALDH2 removes acetaldehyde, a toxic product from ethanol breakdown [
1]. According to recent research, the ALDH2 gene’s genetic polymorphism may be highly connected with the risk of developing human cancers such as esophageal, colorectal, and liver cancer [
32]. Alcohol-related cancers are much more likely to occur in people with ALDH2 deficiencies. Alcohol flushing syndrome, a hereditary disorder that affects alcohol metabolism, is another name for ALDH2 deficiency. ALDH2 deficiency affects 8% of the global population, with 36% of the population in East Asia being affected. People who have the mutant ALDH2*2 gene are more prone to develop different cancers [
33]. A study by Zhang et al. [
34] found out the role of ALDH2 and its underlying processes in the progression and occurrence of cancer. A biomarker for cancer stem cells called ALDH2 has been linked to cancer cells’ growth, metastasis, and medication resistance. People with ALDH2 deficiency are linked with the chances of cerebral stroke and cardiovascular diseases [
35]. Targeting ALDH2 may be a potential strategy to prevent stroke trauma and cancer. The proposed method carries out a feature generation process based on several quantitative metrics that best depict the evolutionary relationships among the species.
From the analysis of ALDH2 sequences of various species, from
Figure 4,
Figure 7,
Figure 10,
Figure 13, and
Figure 16, we observed that the species
Rattus norvegicus, Mus pahari, Arvicanthis niloticus, Cricetulus griseus, and
Grammomys surdaster always belonged to the same cluster when K-means clustering was applied based on physicochemical properties, Shannon entropy, Hurst exponent, fractal dimension, and secondary structure. From
Figure 10,
Figure 13 and
Figure 16, we found that some species formed singleton clusters; for example,
Pongo abelii was not grouped with other species in the case of statistical measures, i.e., Shannon entropy, Hurst exponent, and fractal dimension. From
Figure 7 and
Figure 10, we observed that
Amblyraja radiata and
Sus scrofa species formed a singleton cluster when clustering was done based on secondary structure and Hurst exponent, respectively. As shown in
Figure 4, we found that
Homo sapiens also formed a singleton cluster when all fourteen species were clustered based on physicochemical properties. A more detailed analysis of the fourteen sequences is shown in
Table 2.
In
Section 3, we observed that all fourteen species were clustered based on various parameters, i.e., physicochemical properties, secondary structure, Hurst exponent, fractal dimension, and Shannon entropy. To conclude the final analysis, a consensus tree has been built from multiple phylogeny trees generated by hierarchical clustering. Phylogeny trees based on all parameters were combined to make a consensus tree.
Figure 19 shows the majority consensus tree. The consensus tree shows that the
Homo sapiens species is more closely related to the
Bos taurus and
Sus scrofa species.
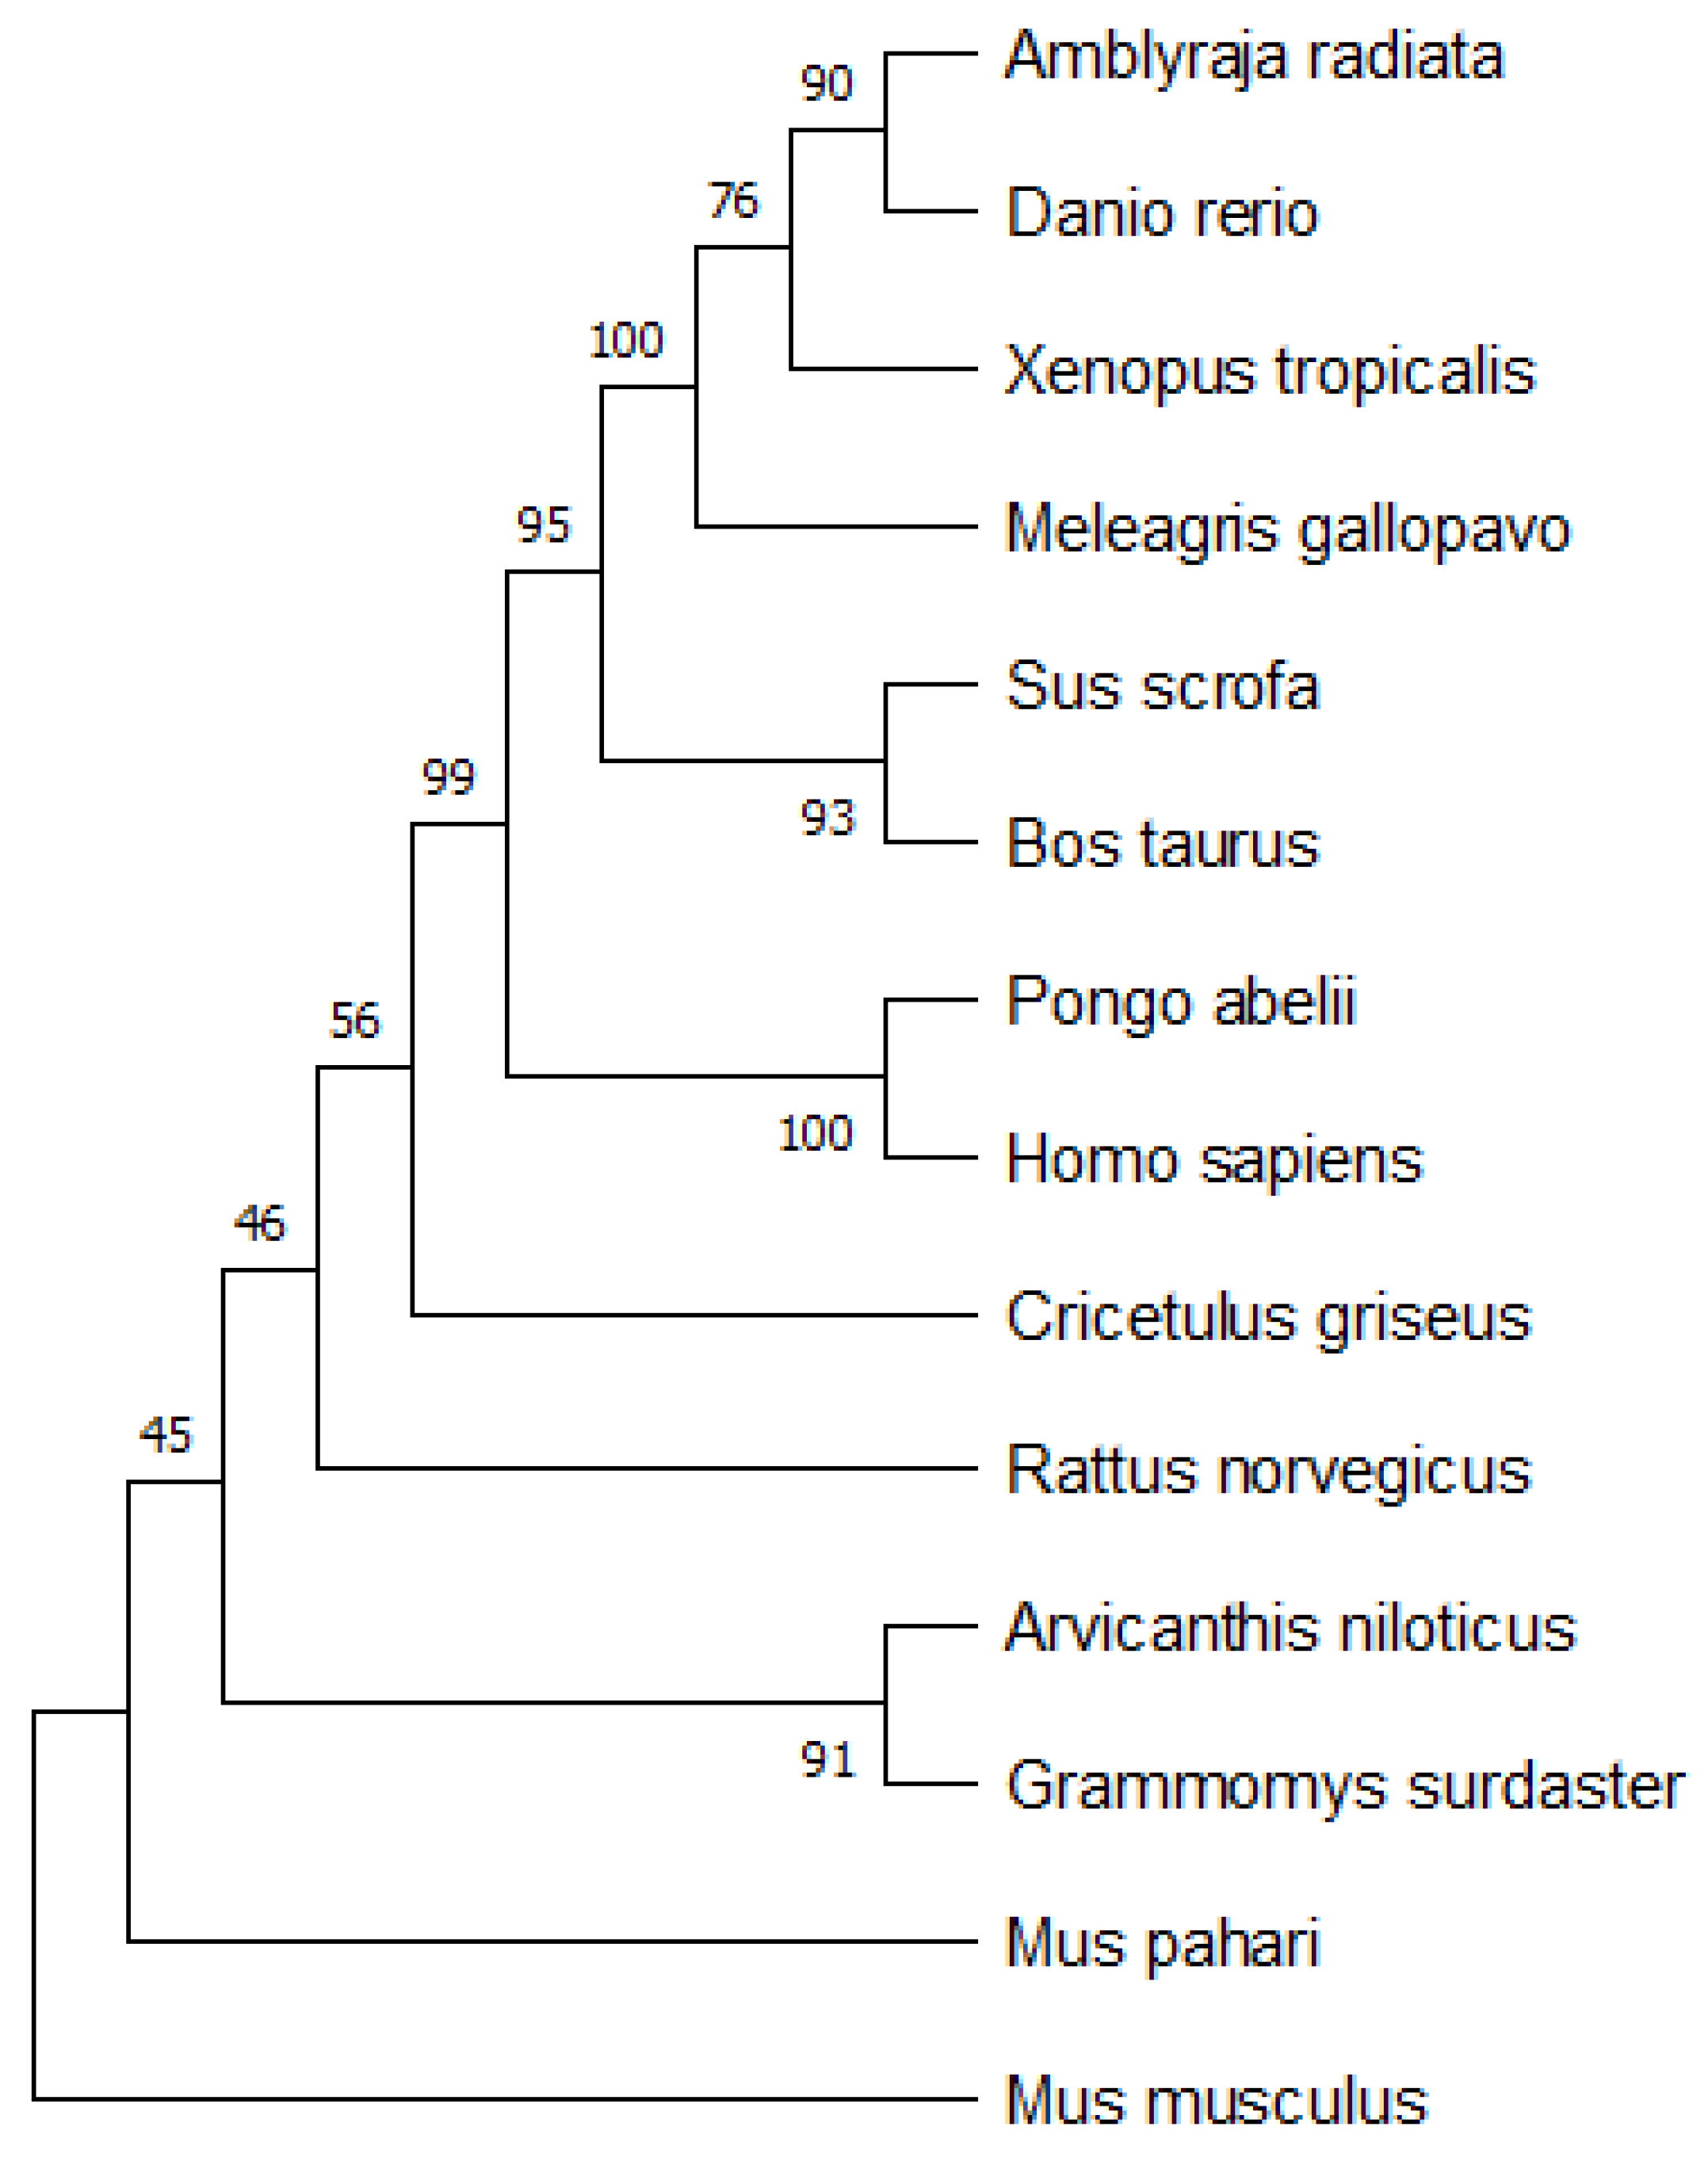
A simple neighbor-joining tree with 1000-times bootstrap analysis was built for the phylogenetic analysis of the primary sequences. The bootstrap tree is shown in
Figure 20. The tree was built using MEGA 11 (Molecular Evolutionary Genetics Analysis) software [
36]. The consensus tree was compared with the bootstrap tree to find the evolutionary analysis of the proposed model. From
Figure 20, we could observe that
Homo sapiens is more closely related to the
Pongo abelii, Bos taurus, and
Sus scrofa species. Our results from
Figure 19 show that
Homo sapiens is closely related to
Bos taurus and
Sus scrofa, which can be verified from the standard results of the bootstrap analysis of the primary sequences. The hierarchical clustering phylogenetic tree results based on physicochemical properties shared similarities with standard bootstrap analysis. As shown in
Figure 6,
Bos taurus and
Sus scrofa are closely related to each other and then also grouped with
Pongo abelii and
Homo sapiens.
The statistical parameters were used for feature extraction and for the classification point of view; they are also used in other papers [
20,
24,
25] for biological evolutionary analysis of the species. In the near future, other available ALDH2 genes can be studied and will strengthen the observations reported here. Our results show that
Homo sapiens is more closely related to the
Bos taurus and
Sus scrofa species, which can be seen from the consensus tree. Experimentally it has been concluded that the testing for discovering medicines may be done on these species before testing in humans to alleviate the impacts of ALDH2 deficiency. It was observed that they share evolutionary closeness.
5. Conclusions
This research aimed to develop an efficient alignment-free tool in protein sequence comparison and phylogenetic study. A comprehensive analysis of ALDH2 sequences of fourteen species, including Homo sapiens (human), was carried out. The proposed method performs a feature generation process based on the various quantitative metrics (physicochemical properties, secondary structure, Hurst exponent, Shannon entropy, and fractal dimension) properties of amino acids that best describe the evolutionary relationship among the species in these protein families. The results show that some species always belong to the same cluster even if we consider secondary structure, physicochemical properties, Shannon entropy, fractal dimension, or Hurst exponent. These species are Mus pahari, Rattus norvegicus, Arvicanthis niloticus, Cricetulus griseus, and Grammomys surdaster. Homo sapiens shows similarity to Amblyraja radiata, Xenopus tropicalis, Danio rerio, and Bos taurus when all species are clustered with the Hurst exponent using the K-means algorithm. If we consider Shannon entropy, then Homo sapiens shows similarity to Meleagris gallopavo, Mus musculus, Bos taurus, and Xenopus tropicalis. Homo sapiens is clustered with Bos taurus in the case of fractal dimension, but if we consider secondary structure, then Homo sapiens forms a cluster with Rattus norvegicus, Mus pahari, Arvicanthis niloticus, Cricetulus griseus, Grammomys surdaster, and Mus musculus. Using all phylogenetic trees generated by various features, i.e., physicochemical properties, secondary structure, and statistical measures, a consensus tree was built to summarize the results. Homo sapiens is more closely related to the Bos taurus and Sus scrofa species as supported by the consensus tree. Experimentally it has been concluded that the Bos taurus and Sus scrofa species are the best options for testing for discovering medicines before they are applied to humans to alleviate the impacts of ALDH2 deficiency. The physicochemical properties clusters share similarities with bootstrap standard results.


 ,
, 


