1. Introduction
Curriculum design is a significant component of a successful educational program at any level. Curriculum developers face many challenges in developing research-informed curriculum such as feasibility of the educational program [
1], establishing new qualifications for the future [
2], promoting interdisciplinary curricula [
3], closing the gap between intended and attained curriculum [
4], ensuring the ‘fitness to practice’ [
5], and ensuring the prerequisites are met before taking the next level courses [
6,
7]. Curriculum design “requires legal frameworks and professional regulatory requirements” [
8] (p. 1). Identifying minimal prerequisites for a program is essential [
9], and sequencing the courses that appear in the learning process often requires careful attention to designing the curriculum, which is reported to be highly correlated with the time students need to complete a degree [
10]. Certain courses may require prior knowledge or skills necessary to complete them successfully, and as such, they should be taken in later stages after passing prerequisite courses within the program. Prerequisites are defined as core competencies that students must demonstrate before taking a course that requires these competencies in order to understand the course material. Prior knowledge has long been considered the most important factor influencing mathematics learning and student achievement. Therefore, determining appropriate prerequisite requirements for mathematics courses is critical for increasing the likelihood of success and students’ overall well-being [
11]. However, assigning too many prerequisites could lead to a delay in graduation, and it may place a barrier for students in other majors to taking advanced mathematics courses as electives. O’Shea and Pollatsek, and McLoughlin [
12,
13] (p. 12) argue that “a well thought out mathematics program with pre-requisite properly set offers the student more, not less chance to succeed and creates access rather than denies it”.
Thus, the purpose of this study is to develop and implement a new method of determining the prerequisite grades necessary to pass the given course. In this study, we refer to a minimal passing grade in a prerequisite course required to enroll in the given course as a threshold.
2. Approaches to Establishing Prerequisites
Two approaches are commonly used to identify prerequisites: qualitative methods analyze necessary skills and competences [
14,
15], and statistical methods compare an experimental group to a control group [
16,
17,
18,
19]. Another less common approach using data mining techniques was suggested by Bayer et al. [
20]. Most often, prerequisites set in course syllabi are based on theoretical models from the literature or expert opinion, including from experienced instructors for the course [
21,
22,
23]. During the curriculum revision period, the stakeholders seldom refer to the empirical data to test the appropriateness of the prerequisites. One possible reason for this could be insufficiency of empirical data [
24], as small data may fail to remove instructional effects. However, with a large number of participants, the other possible factors can be minimized. For example, Vuong, Nixon, and Towle [
25] analyzed prerequisites within a curriculum of 888 schools in the US involving 20,577 students using a binomial test to look for possible correlations and to compare the performance of the control and experimental groups.
There are two issues that curriculum and program developers have to address in order to define prerequisites for any given course: (1) what courses should be required as prerequisites, and (2) what is the minimum grade in a prerequisite course to allow enrollment in the given course. The first issue can usually be addressed based on the expert assessment, as discussed above. The second issue could be addressed using a detailed empirical analysis of existing student data. However, to the best of the authors’ knowledge, there seems to be almost no empirical studies that suggest methods to generate predictive models that determine a minimal threshold grade in a prerequisite course for passing a given course. Most studies focus on establishing correlations between the grades in the prerequisite and following courses. For example, in a study on baccalaureate nursing programs [
26], the grades of prerequisite science courses were found to correlate with grades in major courses, such as pharmacology (r = 0.60,
p < 0.01, N = 37) and pathophysiology (r = 0.77,
p < 0.01, N = 37). Karimi and Manteufel [
27] demonstrated that student grades in the first thermodynamics course taught by nine instructors during the period of 1994–2012 had significant correlations with the grades in the second thermodynamics course. However, the literature search did not produce studies that focus on establishing optimal or minimal grades in a prerequisite course as a predictor of success in the post-requisite course. This is crucial in minimizing Type I and Type II errors. In this context, Type I errors (false positive) increase when the minimal passing grade is set too high, therefore preventing potentially good students taking the preceding course. On the other hand, Type II errors (false negative) increase when the passing grade is too low, which leads to the increase in failures in the upcoming course. Therefore, minimizing both errors is more likely to increase students’ successful completion of the program of study [
11].
This study suggests the method of defining the optimal threshold to minimize these errors by adapting the Receiver Operating Characteristic (ROC) curve methodology.
4. Description of ROC Curve Analysis Method
The ROC curve is a method used to evaluate the performance of predictive models in statistics [
28,
29] that dates back to the 1950s, when it was used to evaluate the performance of signal recognition models [
30]. One of the kinds of predictive models are the so-called binary classification tests, which are designed to classify the elements of a given set into two groups depending on whether the test shows positive or negative results for the given element. Common examples of binary classifiers include disease diagnostic tests in medicine and face verification algorithms in artificial intelligence. In most binary classifiers, there is a parameter that can be adjusted to vary predictive accuracy. However, moving the parameter to the extreme values is more likely to increase false predictions, making it a subtle task to find the optimal parameter value that increases true prediction rates. The ROC curve methodology is one of the classical approaches in determining this optimal parameter for binary classifiers, and the area under the ROC curve is one of the classical metrics used to evaluate the classifier performance.
In this study, we suggest adapting the ROC curve method to educational settings. Let Course A be a prerequisite for Course B in a specific educational sequence. Assume that there is a correlation between the grades in both courses and that the minimal passing grade for Course A is 50%. The question that needs to be addressed by the curriculum developers is does this grade represent sufficient mastery in Course A for a student to be successful in Course B? In other words, what should be the optimal threshold grade in Course A that could be used as a requirement for enrollment in Course B? Let
c be a threshold parameter that varies from 0 to 100. For a given value of
c, we call a test result positive if a student in Course A has a grade less than
c and negative otherwise. In other words, for a student with a positive test result, the model predicts the most likely failure of Course B, e.g., that student will receive a grade of less than 50%. If the test result is negative, then the model predicts that the student will most likely pass Course B. Reality may differ from predicted results, and this leads to four different subsets of students depending on the value of
c:
These four subsets can be summarized in a confusion matrix,
Table 1, where
denotes the cardinality of a set.
The sensitivity of the binary classifier is defined as the probability of detection, also known as the true positive rate. The true negative rate, called specificity, is the proportion of real negatives that are correctly predicted to all real negatives. In other words,
where
is the probability function. Here, for an event
from a sample space
, the probability of the event
is defined to be
and
, which is the conditional probability. Obviously, a good model should have both sensitivity and specificity close to 1, but in general, this is not possible and trying to maximize the sensitivity often yields a decrease in the specificity and vice versa. The ROC curve, which is the plot of ‘sensitivity’ versus ‘1
specificity’ at various parameter values
c (in our case,
), can be examined to evaluate the performance of a model without specifying the threshold settings; it is easy to see that
A classifier is said to have a better diagnostic performance if the area under the ROC curve is closer to 1.
Besides a performance measure, the ROC curve provides an easy and practical way of determining possible thresholds for a chosen model in decision-making. Youden index
and index
are two commonly used rule-of-thumb indices used in practice [
31,
32,
33,
34].
Youden index
is defined as the maximum vertical distance from the ROC curve to the positive diagonal line
, and
is set equal to
at the maximum. Therefore, if we denote the ROC curve with
, to compute the Youden index, we need to estimate
As
and
, maximizing the above means to maximize
, which is our index
. In other words, the Youden index is a problem to find
In other words, it minimizes the sum of the so-called Type I and Type II errors, where in this context, we define
On the other hand, the
index is defined to be the shortest Euclidean distance from the ROC curve to the point with coordinates
. Thus, if we denote the ROC curve with
index estimates
which amounts to minimizing
, that is,
In other words, the
index attempts to minimize the sum of the squares of the so-called Type I and Type II errors. Although the two indices define the topologically equivalent metrics, with the former being the supremum distance while the latter is the Euclidean distance, they are clearly not identical. For generalizations of these indices and other types of developed indices, we refer to [
34]. For convenience, in our model, we use the Youden index. Since both sensitivity and specificity are probabilities, they range between 0 and 1, and the range of Youden index
was from 0 to 1 also. Moreover, at the extremes when
or
, we have both sensitivity and specificity that are equal to 1 or both that are equal to 0. In the former case, the binary classifier reaches 100% accuracy with complete separation of the two groups, and in the latter, it has 0% accuracy with complete overlap of the two groups. Hence, the estimate of
also gives a performance evaluation of the classifier according to how close it is to 1.
Following the standard statistical notations, we let
and
denote the point estimators of
and
, respectively. We now describe the procedure for the estimation of confidence interval (CI) for the Youden index once the estimate
for the optimal threshold parameter
is obtained. We note that as
involves the sum of two quantities, namely sensitivity and specificity, and since each is nonlinear, rational variable, one expects that the formula to estimate CI for
is not straightforward. For a given α value,
CI can be approximated by
where
is the standard
level
-score for a two-tailed test. To this end, we need to compute the number of individuals in each group, namely
and
, once the threshold point is determined. For the given sample, this gives us
Using the method in [
31] to estimate for the standard error, we arrive at
We note that taking pre-image of
CI for
under the map (1) gives the
CI for the optimal threshold
:
Various parametric and nonparametric methods were developed to estimate CIs for the Youden index [
35,
36,
37,
38]. The parametric approach of [
38] uses the delta method under the assumption that the distributions considered are either normal or gamma. As evidenced in [
38], the comparison with the other three bootstrapping approaches show that their CI estimations perform better in terms of convergence and length of the intervals. Since their formula for CI is very technical, we use the above original Youden’s estimate (2) for practical purposes. However, interested readers are welcome to adopt more recently developed formulas.
5. Testing the ROC Curve Method
The ROC curves analysis was tested on the data set of Calculus 1 and Calculus 2 grades collected over six consecutive semesters at a private university in Kazakhstan. At this university, students entering college with the intent to major in one of STEM disciplines are required to take Calculus I. Typically, this course covers the topics of limits, derivatives, and integration of a function with one variable. This course is a prerequisite for the next mathematics course, Calculus 2, that covers the topics of series and multiple integrals. Both courses include theoretical and practical components. The course passing grade for all courses is set as 50% per recommendation by the Kazakhstan Ministry of Education and Science. The study sample included 164 undergraduate students majoring in mathematics. The average age of students was 17.9 years old. Females comprised 54% of the sample. During this period, the department of mathematics had about 20 full-time faculty members. The Pearson correlations between Calculus I grades (M = 62.05, SD = 20.66) and Calculus II grades (M = 56.99, SD = 26.98) were found to be significant with .
Each course was taught by 5–7 instructors who followed the same standardized curriculum and used the same textbook. The course grade was composed of a formative assessment (60%) and the comprehensive final examination (40%). The instructors had freedom to decide on the format of formative assessment tasks; however, the final examination was the same for all students. This examination was administered in written format and included problem-solving questions. Each instructor graded the work of their own students.
It is customary in this undergraduate program to discourage students from enrolling in Calculus 2 without successful completion of Calculus 1. By the successful completion of the Calculus courses, the authors refer to receiving at least a grade of 50 out of 100. However, during the study period, this recommendation was not followed, and any mathematics major could enroll in Calculus 2 regardless of their Calculus 1 grade. We applied the ROC curve analysis to data from these two courses in order to determine a minimal prerequisite grade from Calculus 1 that could have been required for enrollment in Calculus 2. This analysis also minimized the sum of and errors as described in the previous section.
To illustrate the importance of the optimal threshold in the current context, consider three different scenarios. In the first case, assume that there is no prerequisite for Calculus 2. In other words, the prediction is that regardless of their Calculus 1 grade, all 164 students will pass Calculus 2. This amounts to
error of 1 and
error of 0, summing to 1. In this case from descriptive statistics, we would have 55 failures in Calculus 2, which is 33.5% of the sample. To avoid too many failures in Calculus 2—that is, to reduce
error—we may go to the other extreme where we require 100 out of 100 from Calculus 1 to enroll in Calculus 2. In this case, we have a
error of 0 but a
error of 1, summing to 1 again. The reason for the high
error is that many successful students would not be allowed to take Calculus 2 due to unreasonably high prerequisite grade requirements. In the third scenario, let us assume that students have to pass Calculus 1—that is, they need to receive 50 out of 100 to enroll in Calculus 2. Then, all students who failed Calculus 1 would need to retake and pass it in order to continue in Calculus 2 course. In this case, we see from
Table 2 that 33 students would not be allowed to enroll Calculus 2. However, we still have 27 failures, which amounts to a
error of 28/55 = 0.51. We also note that, out of 33 students not allowed to enroll in Calculus 2, 5 would pass it, leading to 5/104 = 0.05
error. This sum gives about 55% of error. This hints that the last scenario is much better at reducing the error. However, whether this is the best possible option that minimizes the error is the content of the optimization problem.
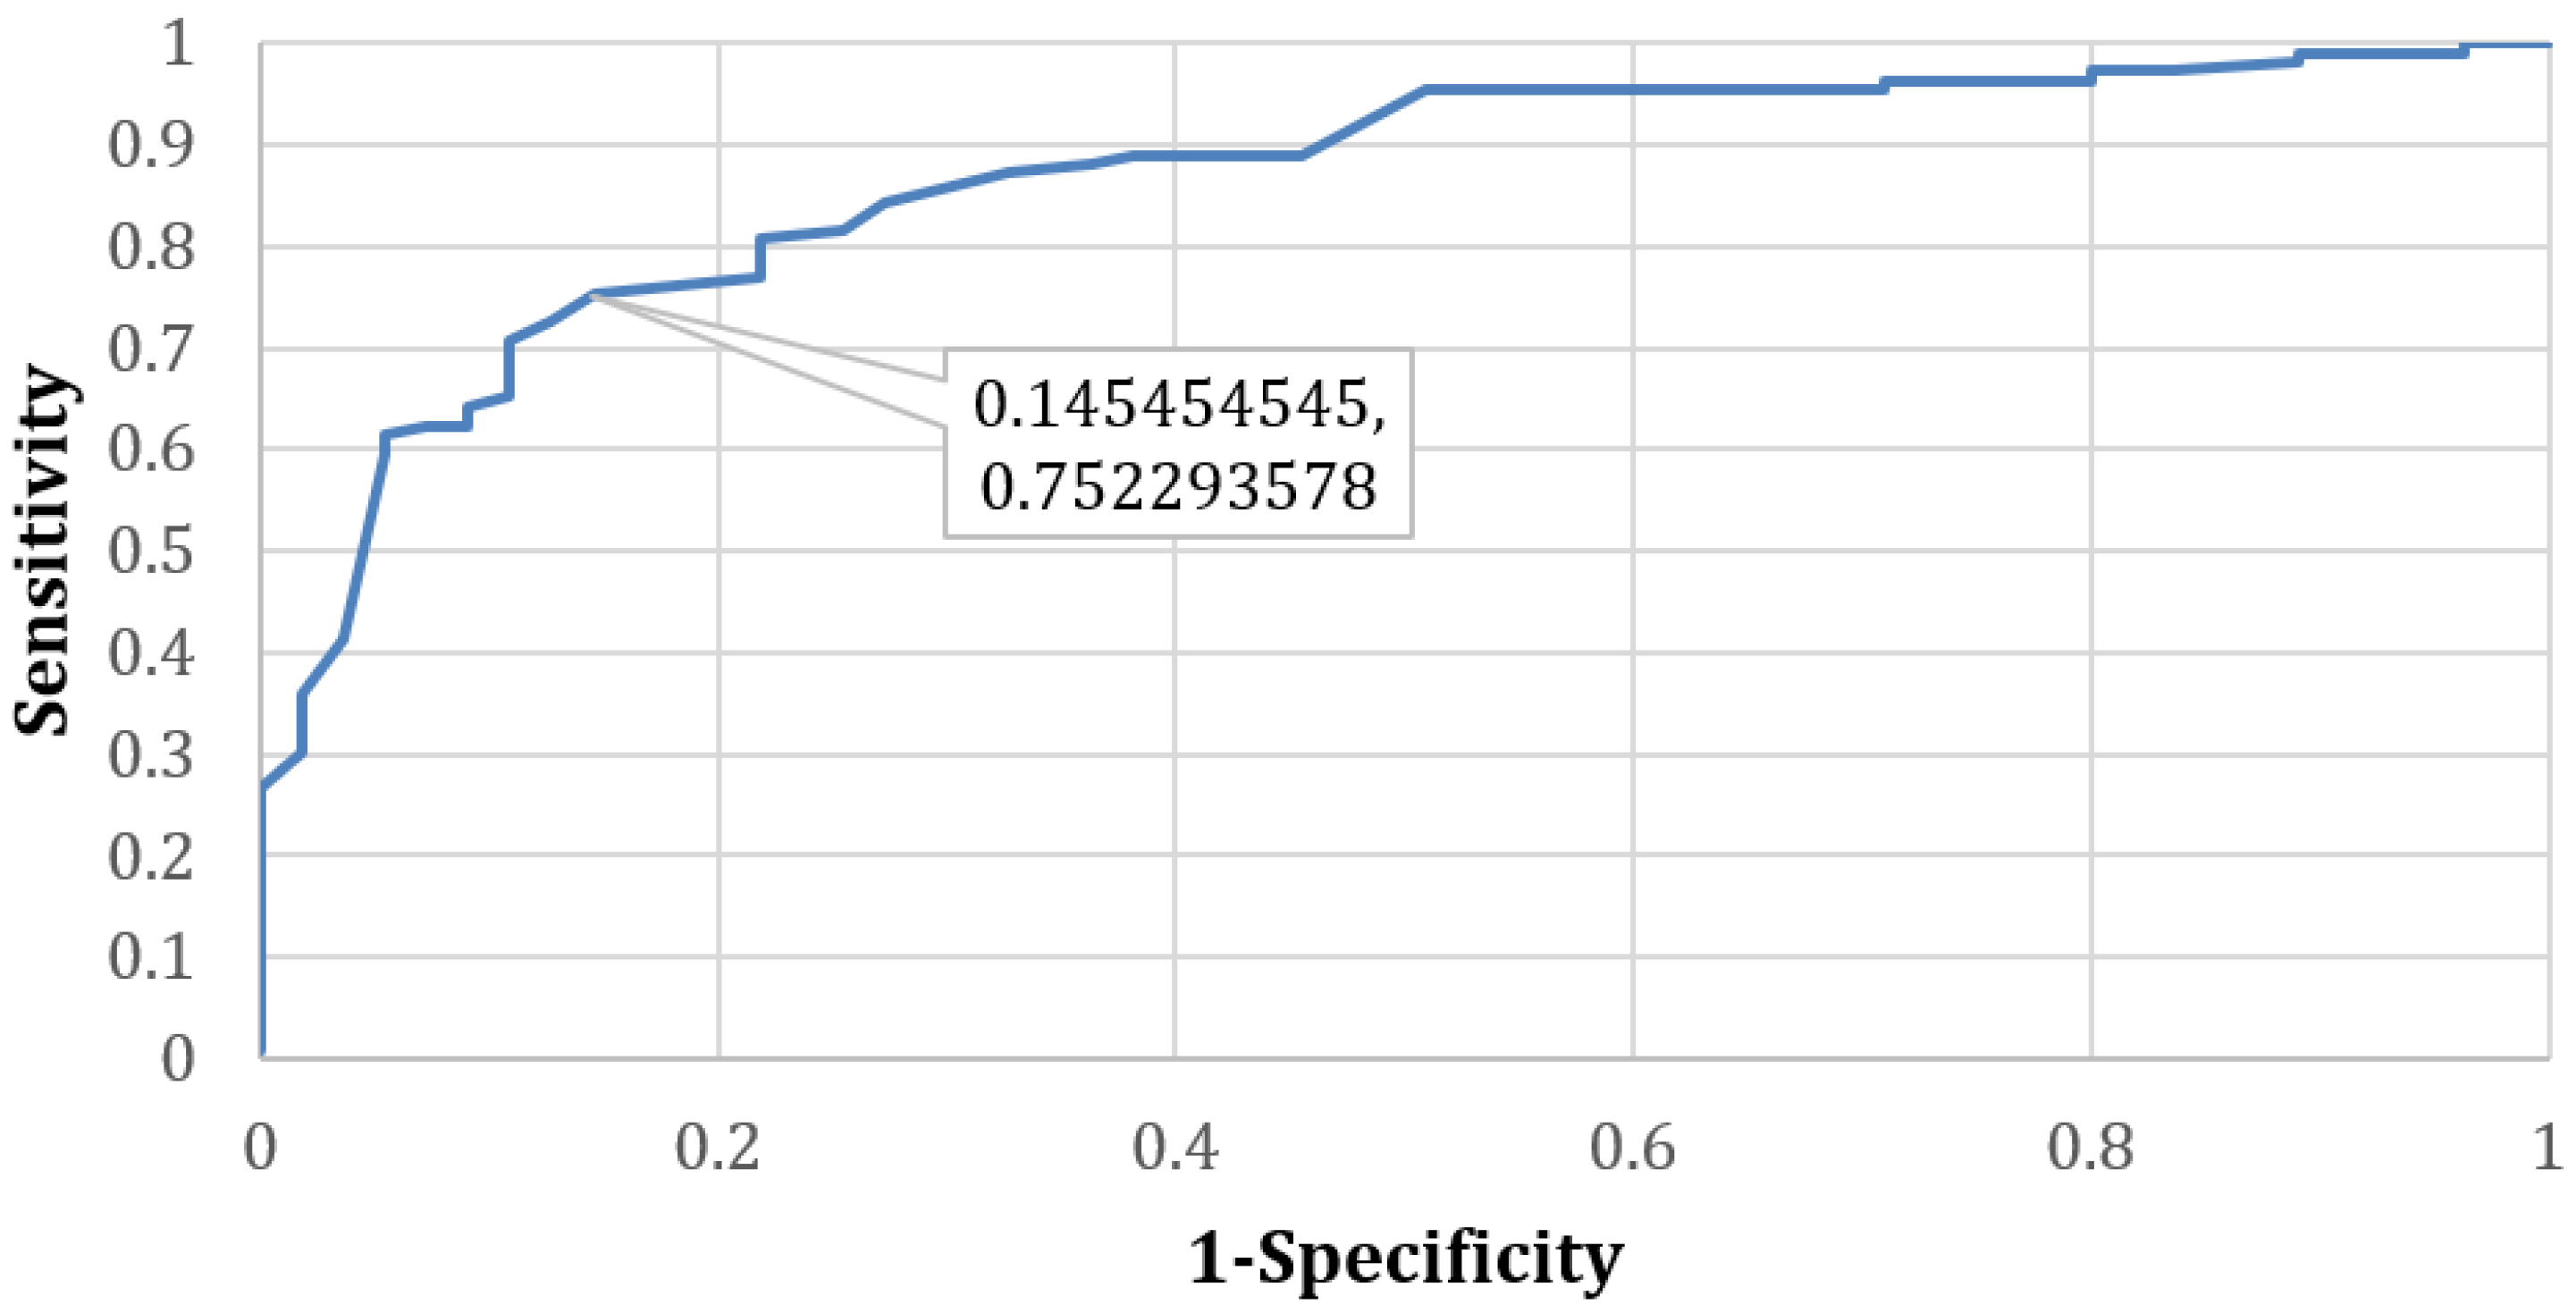
Since the ROC curve method is used for binary classification models, we converted Calculus 2 grades to an ordinal variable as Pass/Fail, while Calculus 1 grades were kept as interval variables (integers) from 0 to 100. As before,
c is the threshold parameter in [0, 100]. A positive test result means that a given student has a Calculus 1 grade of less than
c, predicting that the student will fail Calculus 2. The negative result means that if the student has a Calculus 1 grade of at least
c, the student will pass the Calculus 2. By calculating Sensitivity and
Specificity as a function of
c and plotting the values, we obtain the ROC curve (
Figure 2).
The calculation results show that the area under the ROC curve is 0.8653 and the Youden index
is equal to 0.6068 at the optimal threshold parameter
(see
Table 3 for a small part of the calculations). The former shows that this is a good binary classifier. The latter suggests that the students should be allowed to enroll in Calculus 2 provided that their Calculus 1 grade is at least 61. Otherwise, they should retake Calculus 1 to obtain a grade of at least 61.
We recall from the previous section that Youden index
is the maximum value for
. Thus, in terms of the ROC curve, it amounts to maximizing the difference between the coordinates. The point with coordinates (0.1454, 0.7522) highlighted in
Figure 1 is the coordinates where we achieve this maximum, namely 0.6068, as shown in
Table 3.
To have more flexibility, it may be wise to compute a confidence interval for . To this end, we first compute 95% CI for Youden index using (2) in the previous section and obtain (0.4852, 0.7284).
Reading from our Excel worksheet for the c values, we have that the 95% CI for the optimal threshold is (53, 75). This suggests that, in practice, the curriculum developers have some flexibility in deciding prerequisite grade requirement for Calculus 2.
Table 2 compares the classifier performance for the threshold grade predicted by the ROC curve and the one that is currently used at the university. We see that our model correctly identified 48 out of 55 failures and 80 out of 109 successful completions of Calculus 2. Therefore, the model sensitivity is 48/55 = 0.87 and specificity is 80/109 = 0.73, leading to the Youden index of 0.6. On the other hand, the traditional approach predicted 27 out of 55 failures and 104 out of 109 successful completions of the Calculus 2 course, giving the Youden index of 27/55 + 104/109 − 1 = 0.45. Thus, based on the Youden index, the proposed model is more accurate than the traditional approach to predict successful completion of Calculus 2 based on performance in Calculus 1. In comparing our proposed model to the traditional practice (
Table 2); it is important to note that, while traditional practice has better specificity with 0.95—that is, when the threshold is set to be 50, which is accurately identifying successful completions of Calculus 2—our model is better than the latter in identifying possible failures with performance (sensitivity) of 0.87, while for the threshold of 50 the sensitivity is 0.49.
6. Discussion and Conclusions
In order to address the first research question, we adapted the ROC curve analysis method to determining minimal grade prerequisites for the educational program courses leading to passing grades in the next course in sequence. Students who entered the course with a more integrated previous knowledge foundation and the ability to function on higher levels of procedural prior knowledge were more likely to succeed. These findings highlight the significance of identifying students’ prior knowledge base at the start of the learning process. Therefore, establishing a level of mastery in the preceding course as a prerequisite in the consecutive courses is very essential.
Effectiveness, simplicity, and availability of technology, as well as usefulness, are the crucial features for this technology to be adopted. Moreover, for the sake of convenience, Youden’s technique has been followed [
31].
The proposed method determines the optimal minimal grade (threshold) that should be required in the prerequisite course to enroll in the next level course. As mentioned before, this is crucial for the student’s academic well-being. One possible limitation of the proposed method could be instructor bias making the grade less objective [
27,
39]. Different instructors may have different grading cultures, leading to grade inconsistencies. As such, the proposed technique is best used where the grading consistency is achieved between the instructors of the same course. In the case of Kazakhstan, the Ministry of Education and Science provides clear guidance on the meaning of each grade. Moreover, many universities in Kazakhstan are considering implementing grade curving to partially reduce instructor bias and grade inflation. With such regulations, we think the method can be implemented successfully. The method is best applied especially if the programs use standardized common examinations.
In addressing our second research question, we implemented the ROC curve methodology to estimate the optimal threshold grade for Calculus 1 as a prerequisite to enroll in Calculus 2. The performance of a binary classifier can be evaluated according to the area under the ROC curve. More specifically, it is regarded as acceptable if the area falls between 0.70 and 0.80, excellent if it varies between 0.80 and 0.90, and outstanding if it is above 0.9 [
40]. According to this assessment, the performance of our model is excellent with the area under the ROC curve equal to 0.87. This shows that Calculus 1 performance is a good predictor for the successful completion of Calculus 2. The study also demonstrated that the ROC curve methodology outperforms the currently used practice at the university in predicting successful completion of Calculus 2.
Our proposed method is a data-driven approach as opposed to expert opinion-based approaches [
21,
22] that could be subjective. This study provides significant implications for curriculum design, especially in mathematics education. Indeed, for a specific course, the curriculum developers can refer to the expert opinion to select prerequisite courses, then they can implement our proposed ROC curve methodology to set up the optimal threshold grades.
For future research, more advanced multivariate statistical or machine learning-based approaches can be used to improve the accuracy of the prerequisite requirements for several courses at once.
Finally, we note that the proposed method is not necessarily restricted to mathematics courses, and it can be implemented in any educational program that involves sequencing courses with some level of standardized assessments evaluation criteria. Either expert opinion should be referred or the Pearson correlation between two courses should be established before attempting the proposed strategy.


