
An Alternative Approach for Identifying Nonlinear Dynamics of the Cascade Logistic-Cubic System


Abstract
:1. Introduction
2. 0-1 Test for Chaos
2.1. Traditional 0-1 Test for Chaos
2.2. Description of Issue Addressed
3. Description of the Synthetic Data
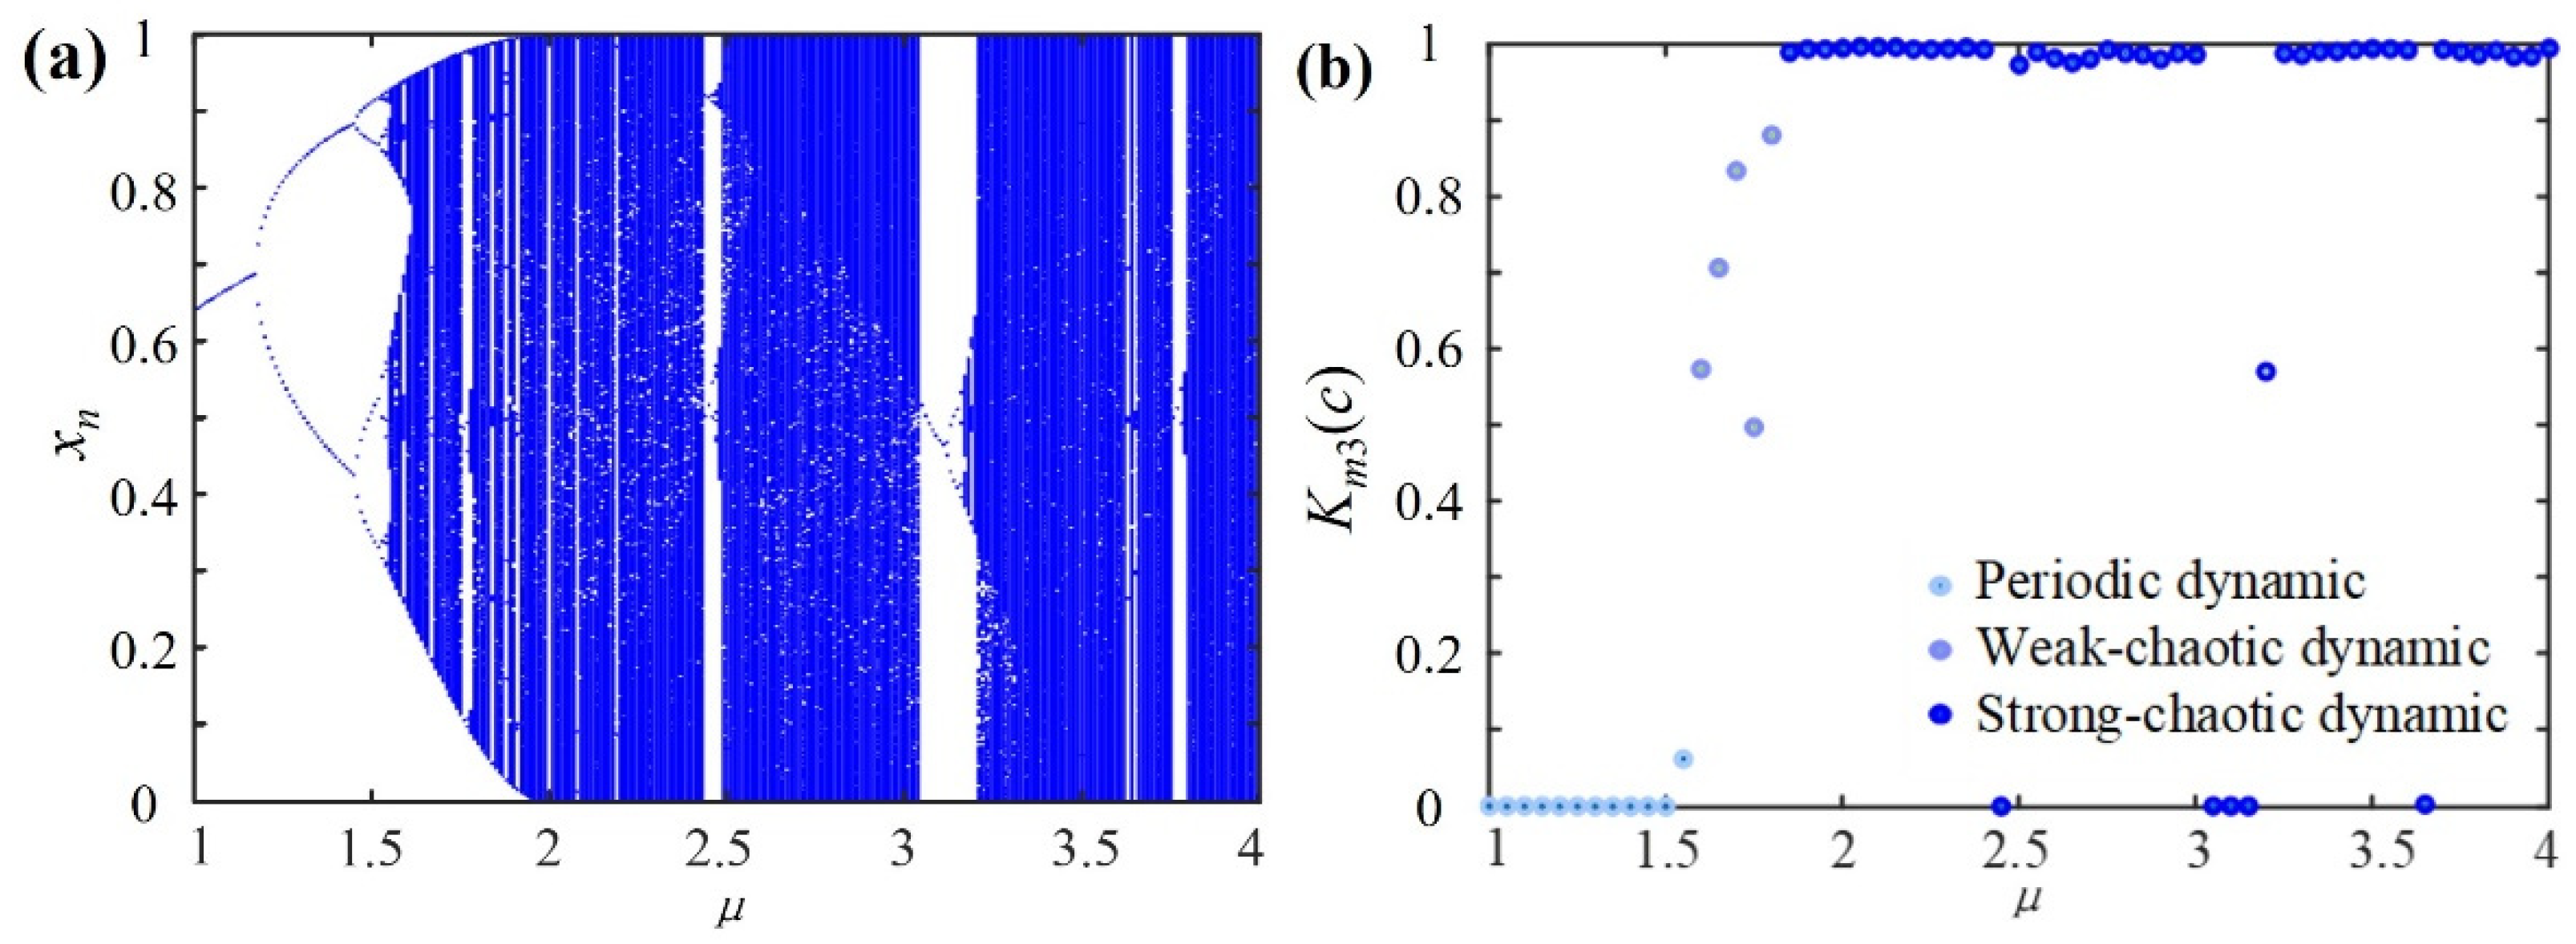
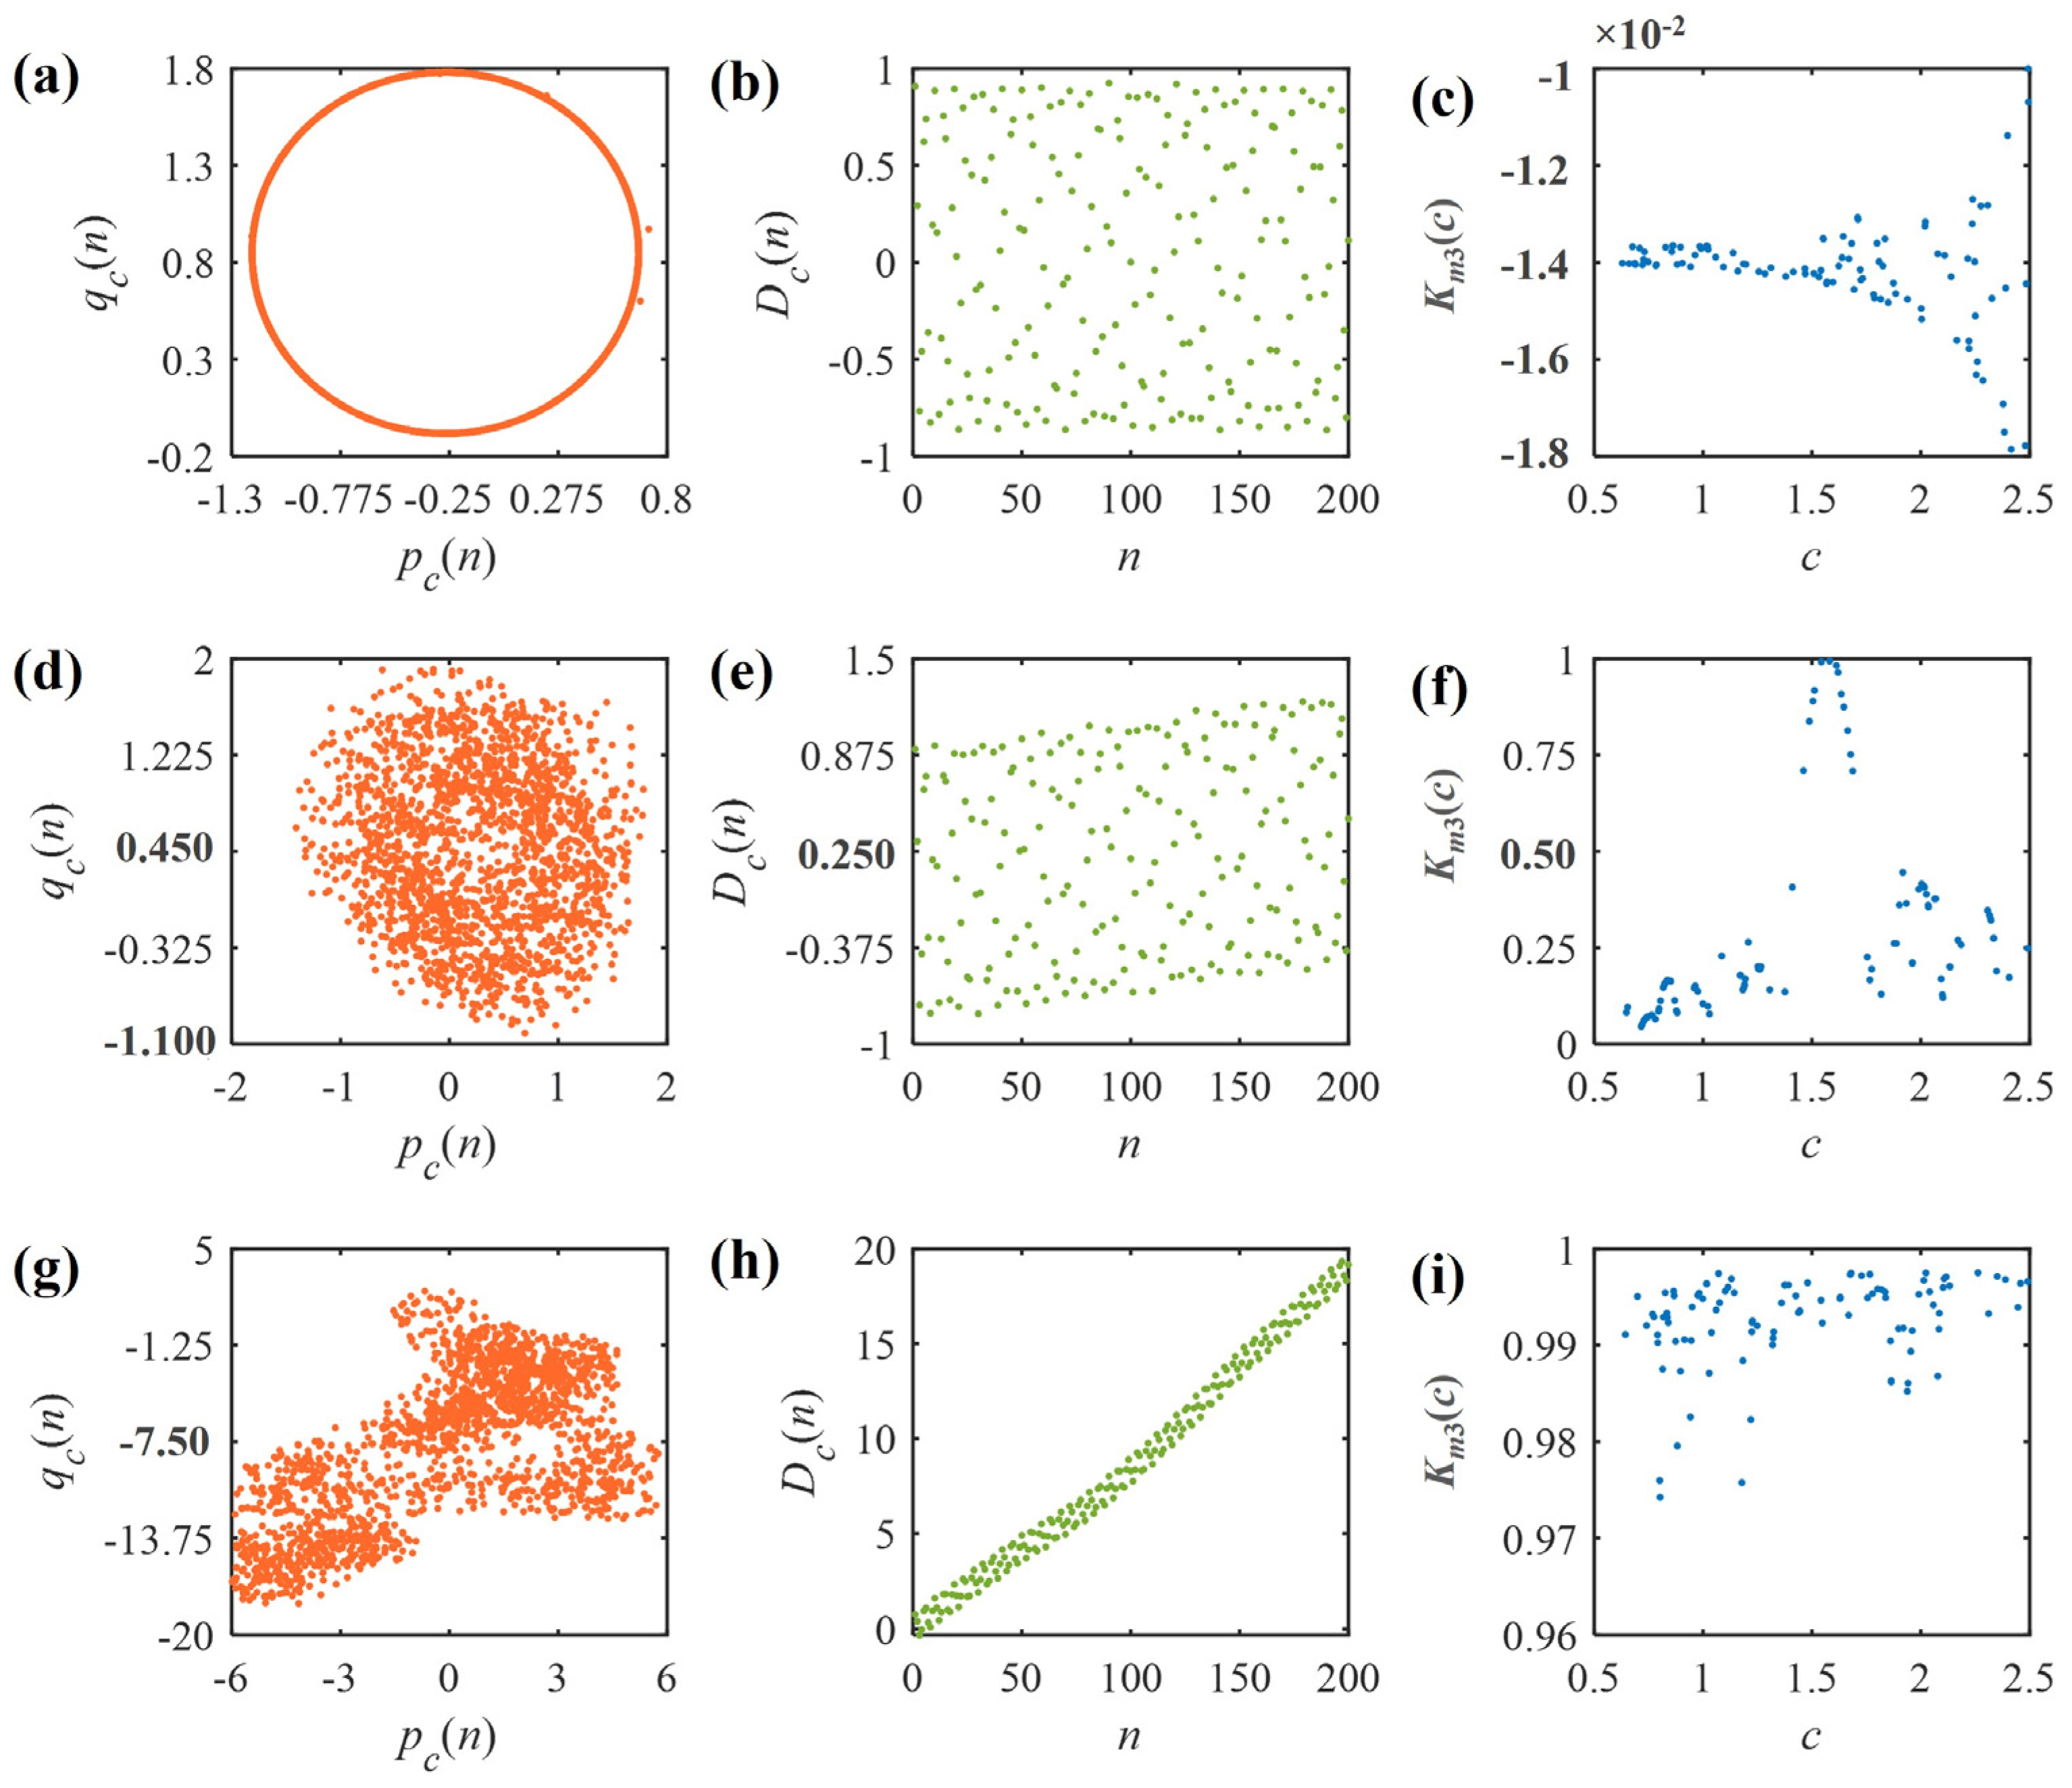
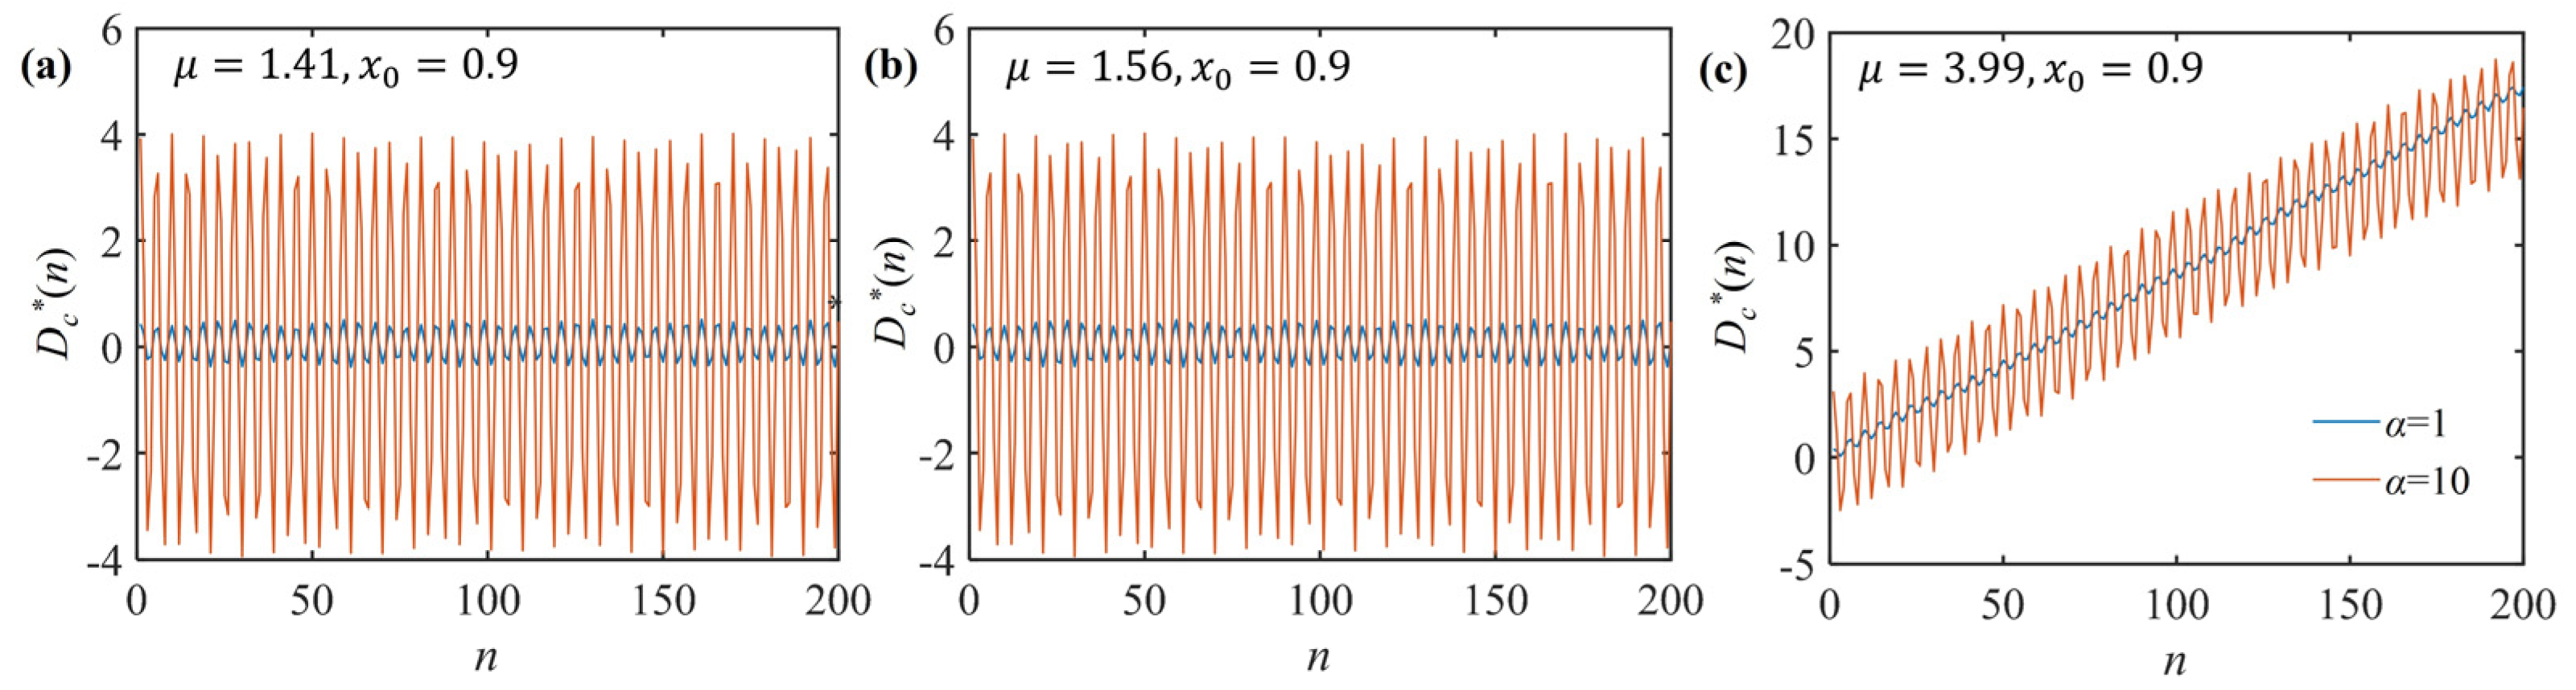
3.1. Dynamic Behaviors of Cascade System
3.2. Generation of Noisy Time Series Data
4. Results and Discussion
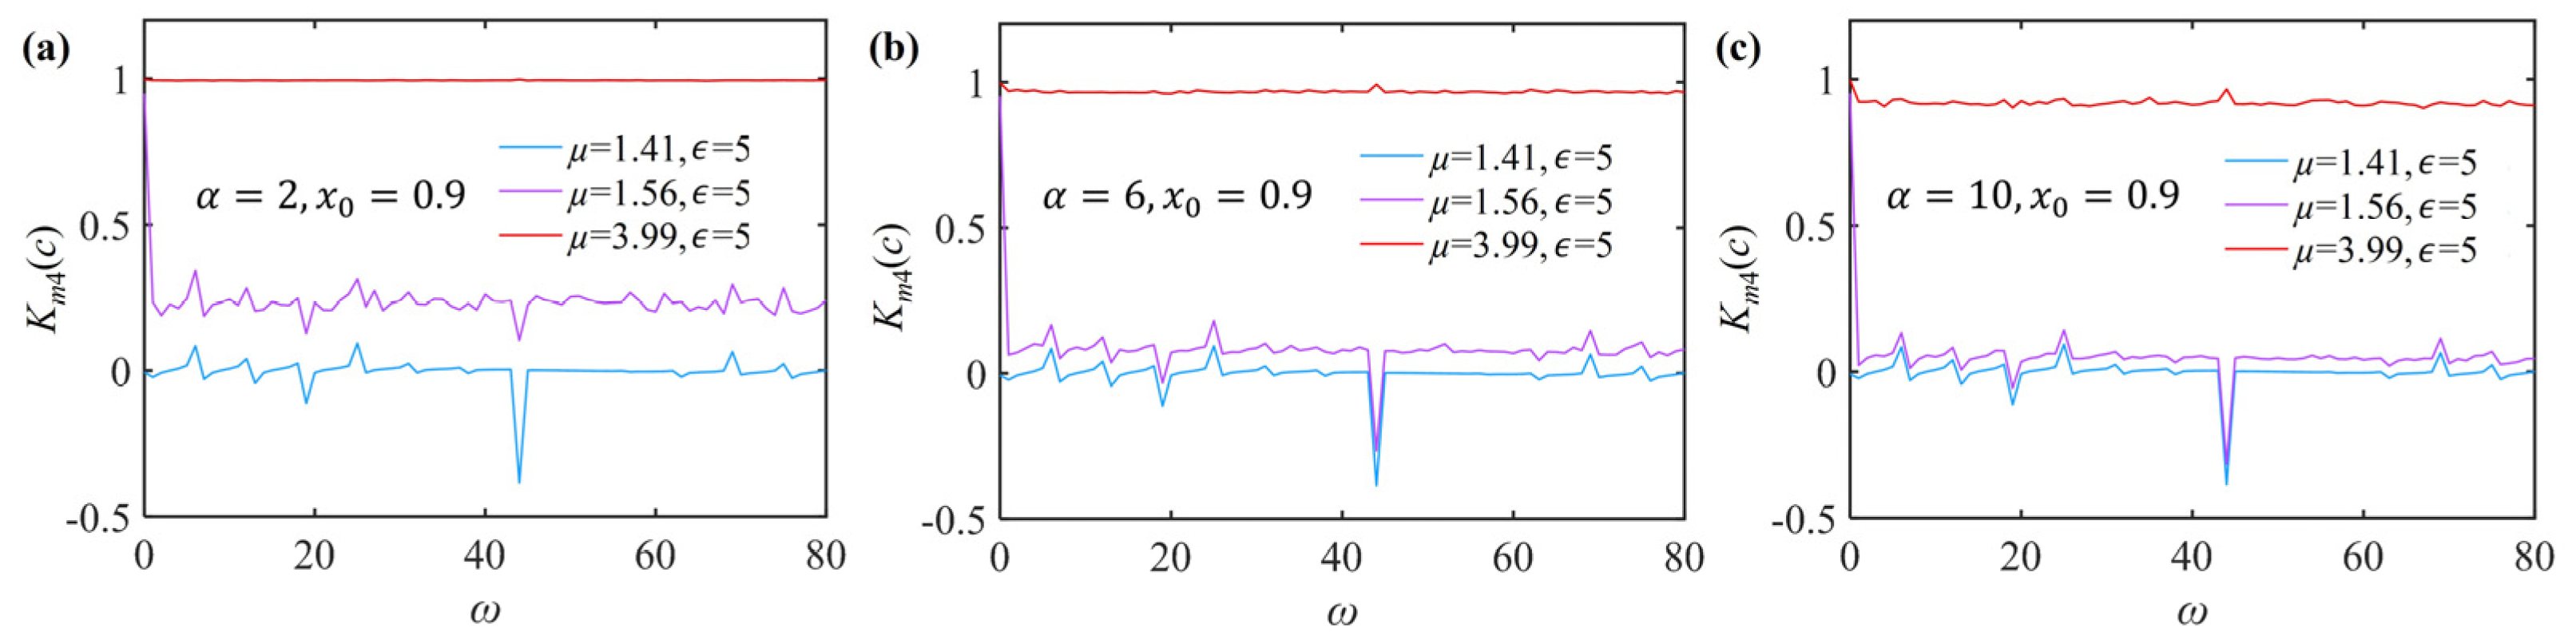
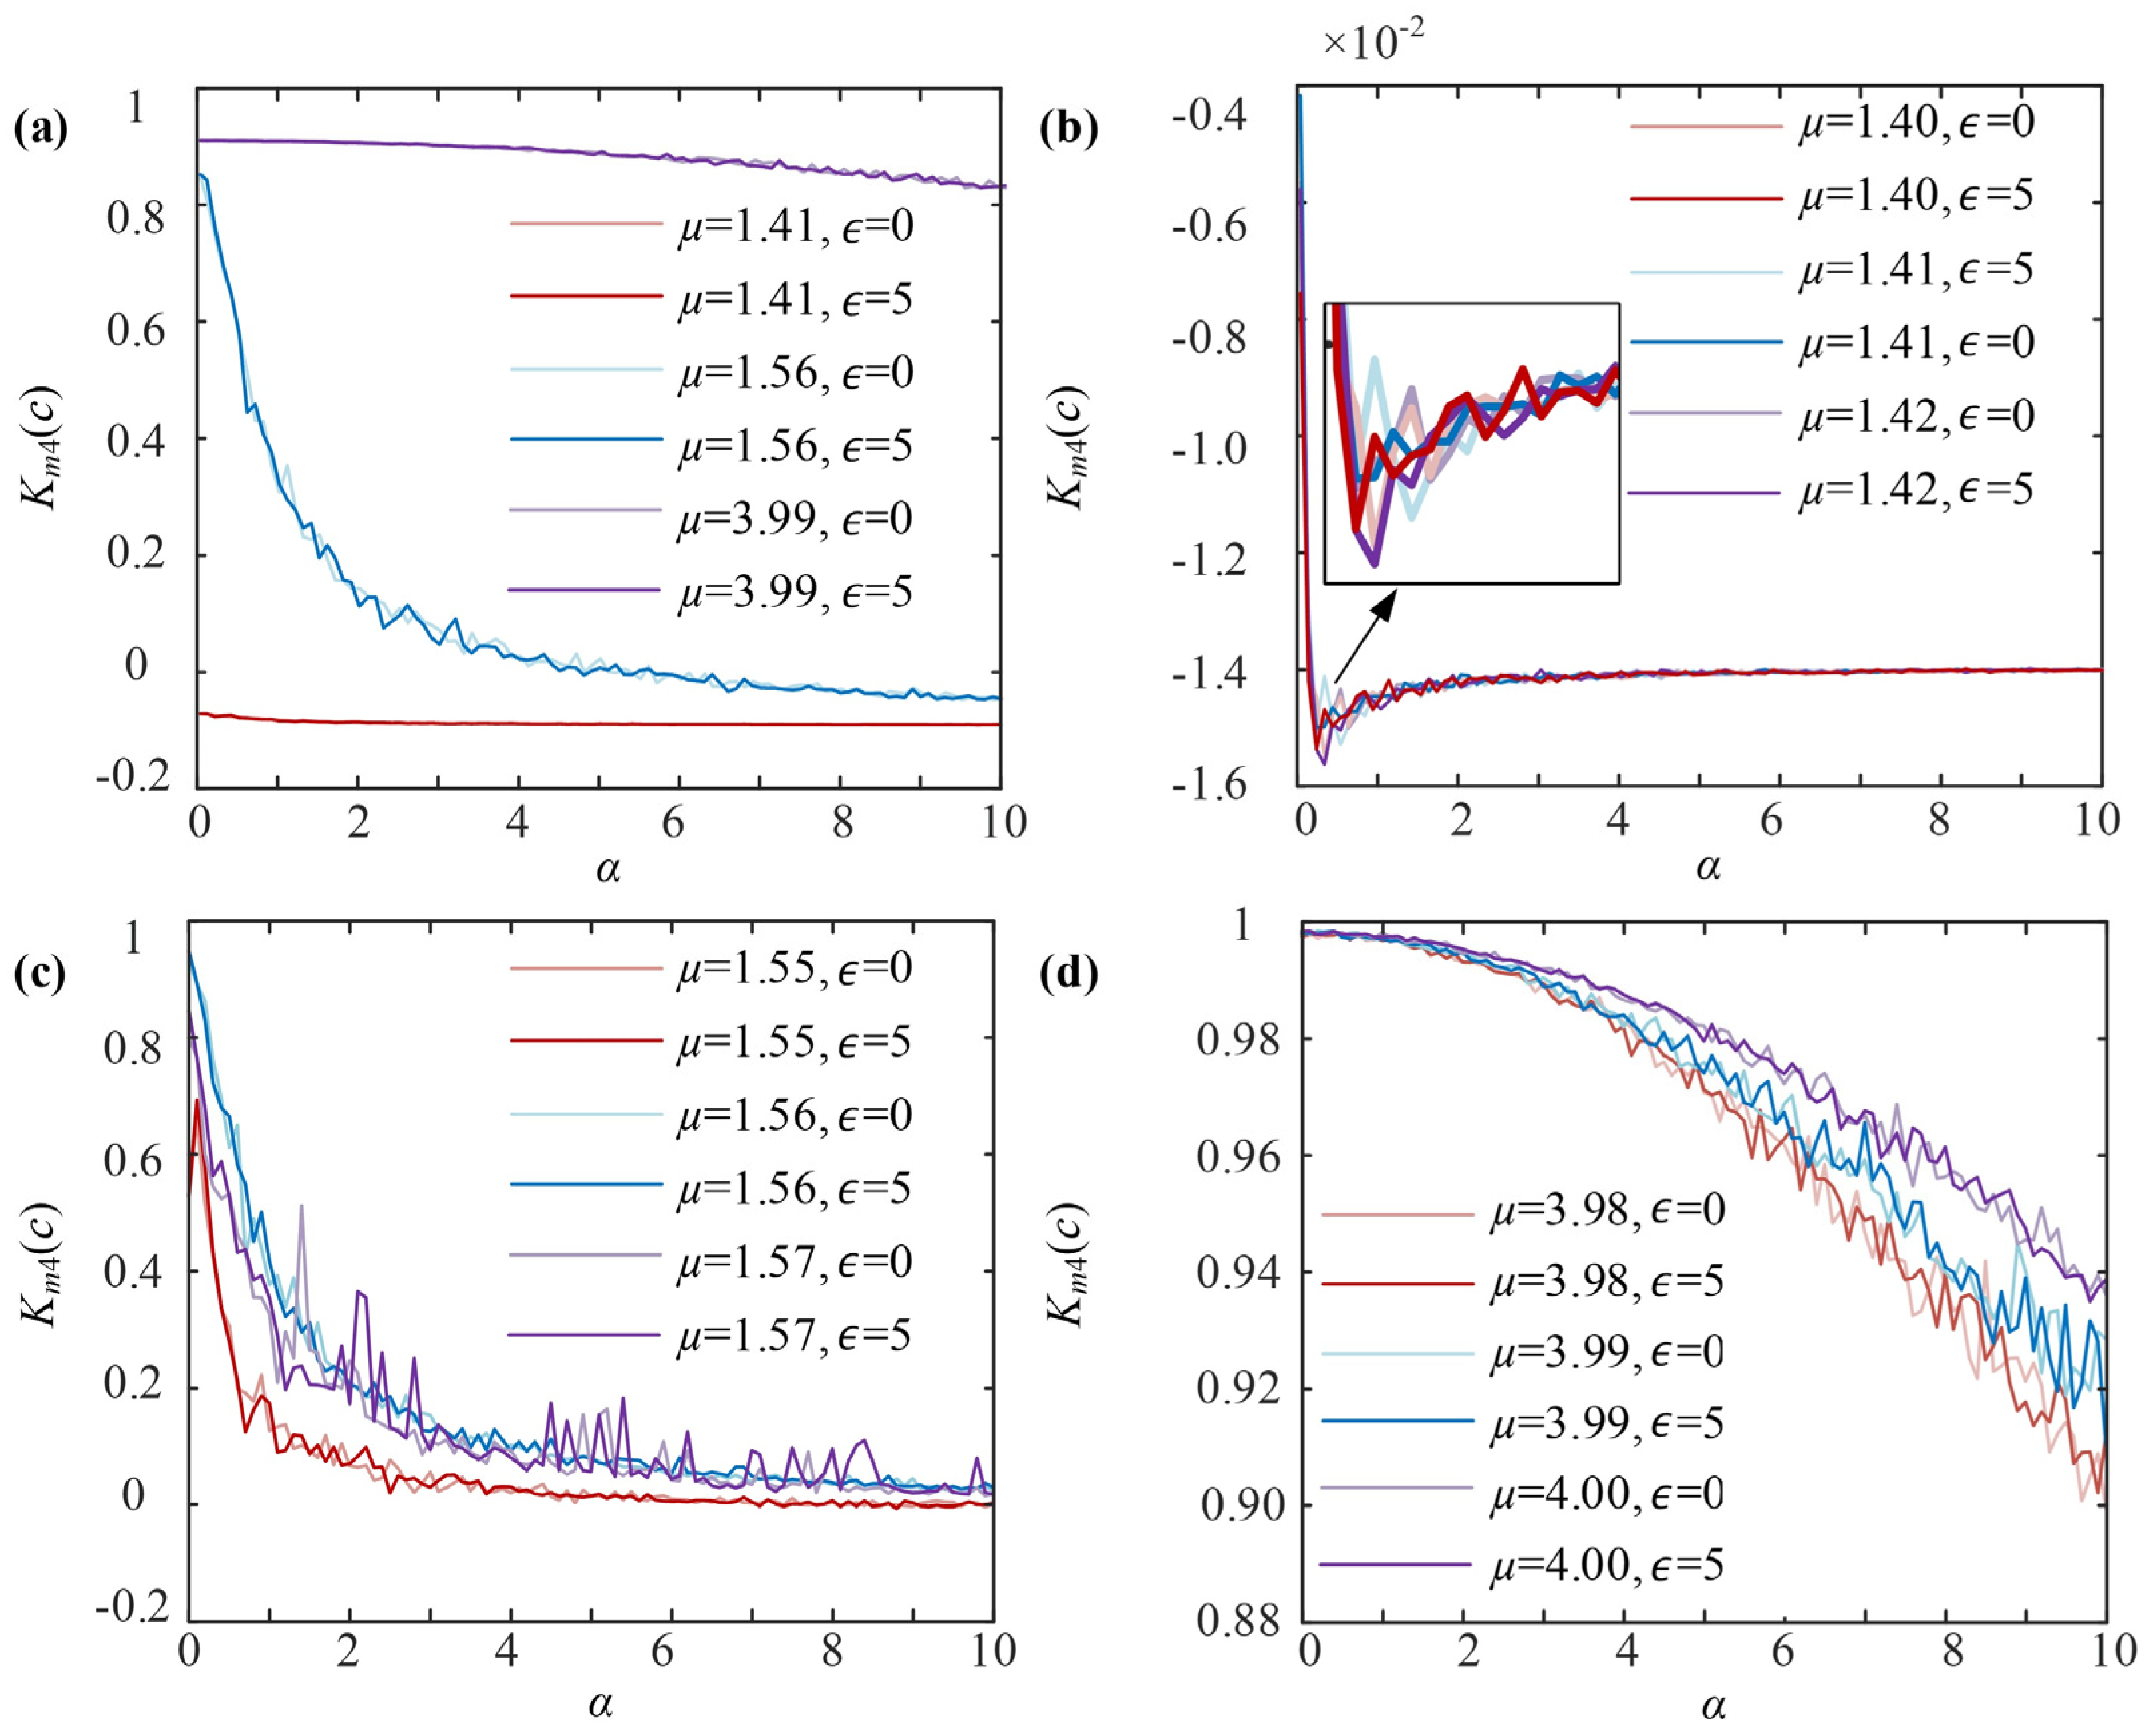
4.1. Effect of the Frequency on
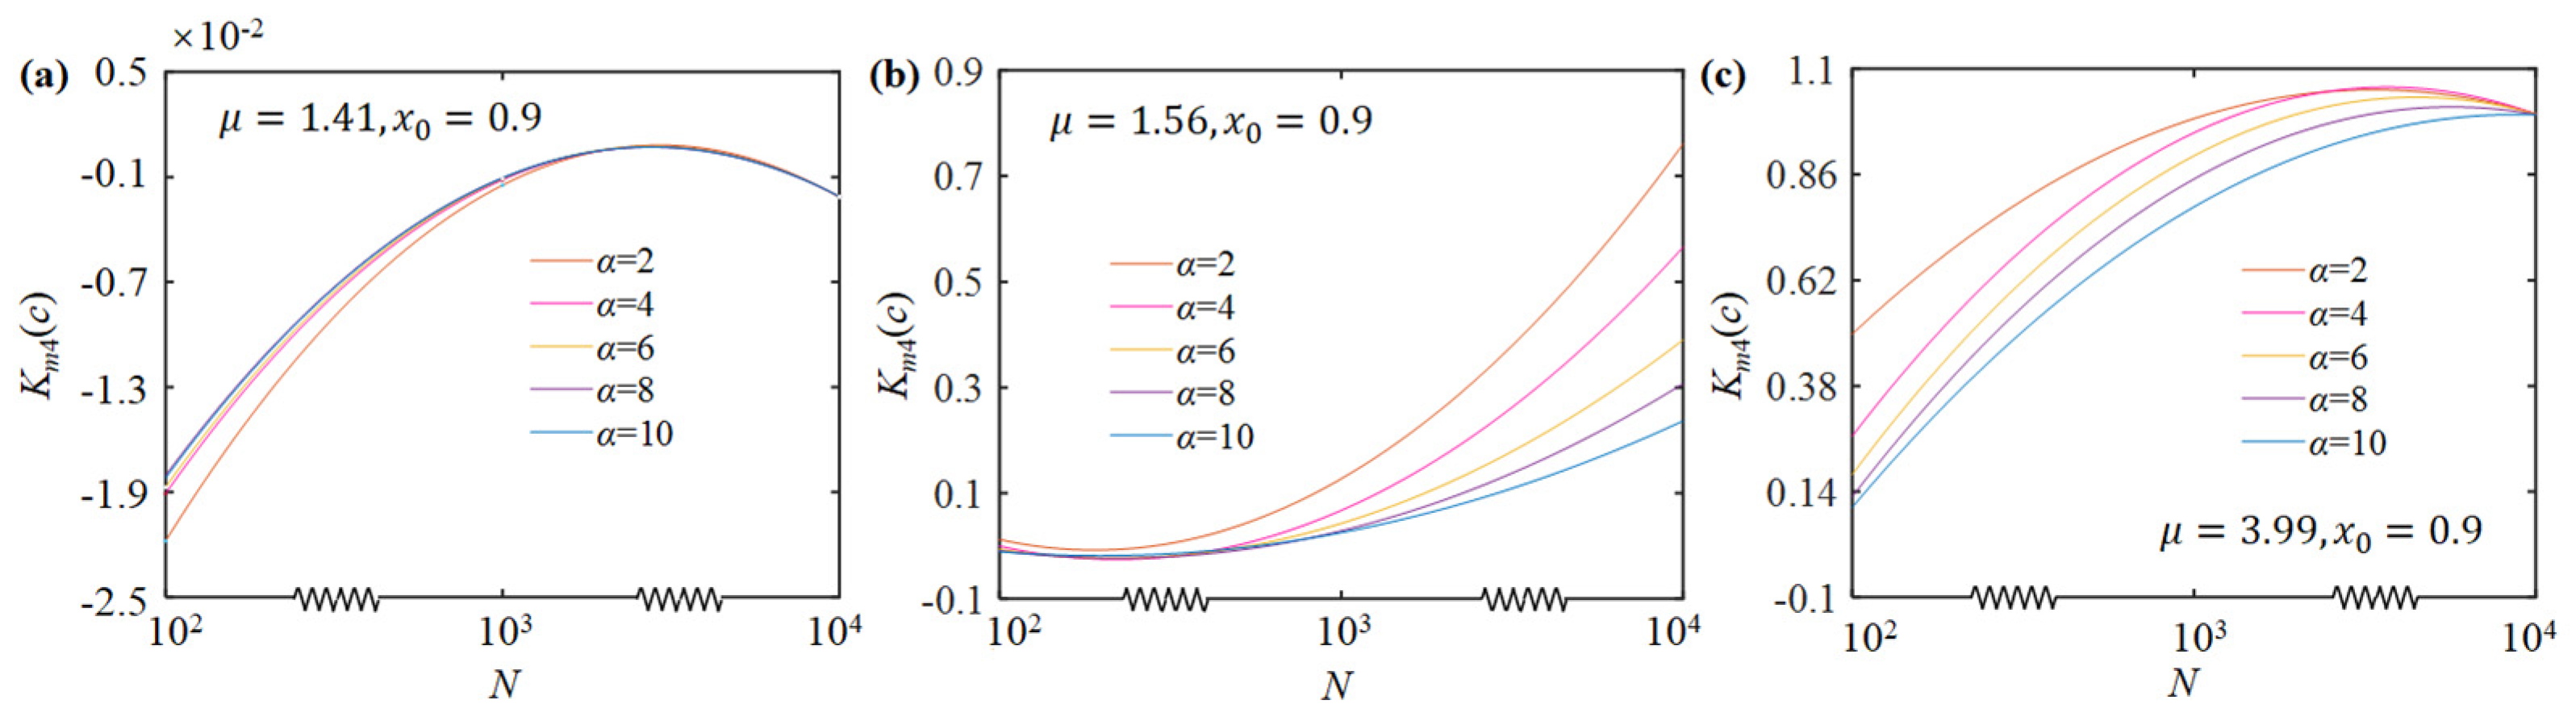
4.2. Effect of the Amplitude on
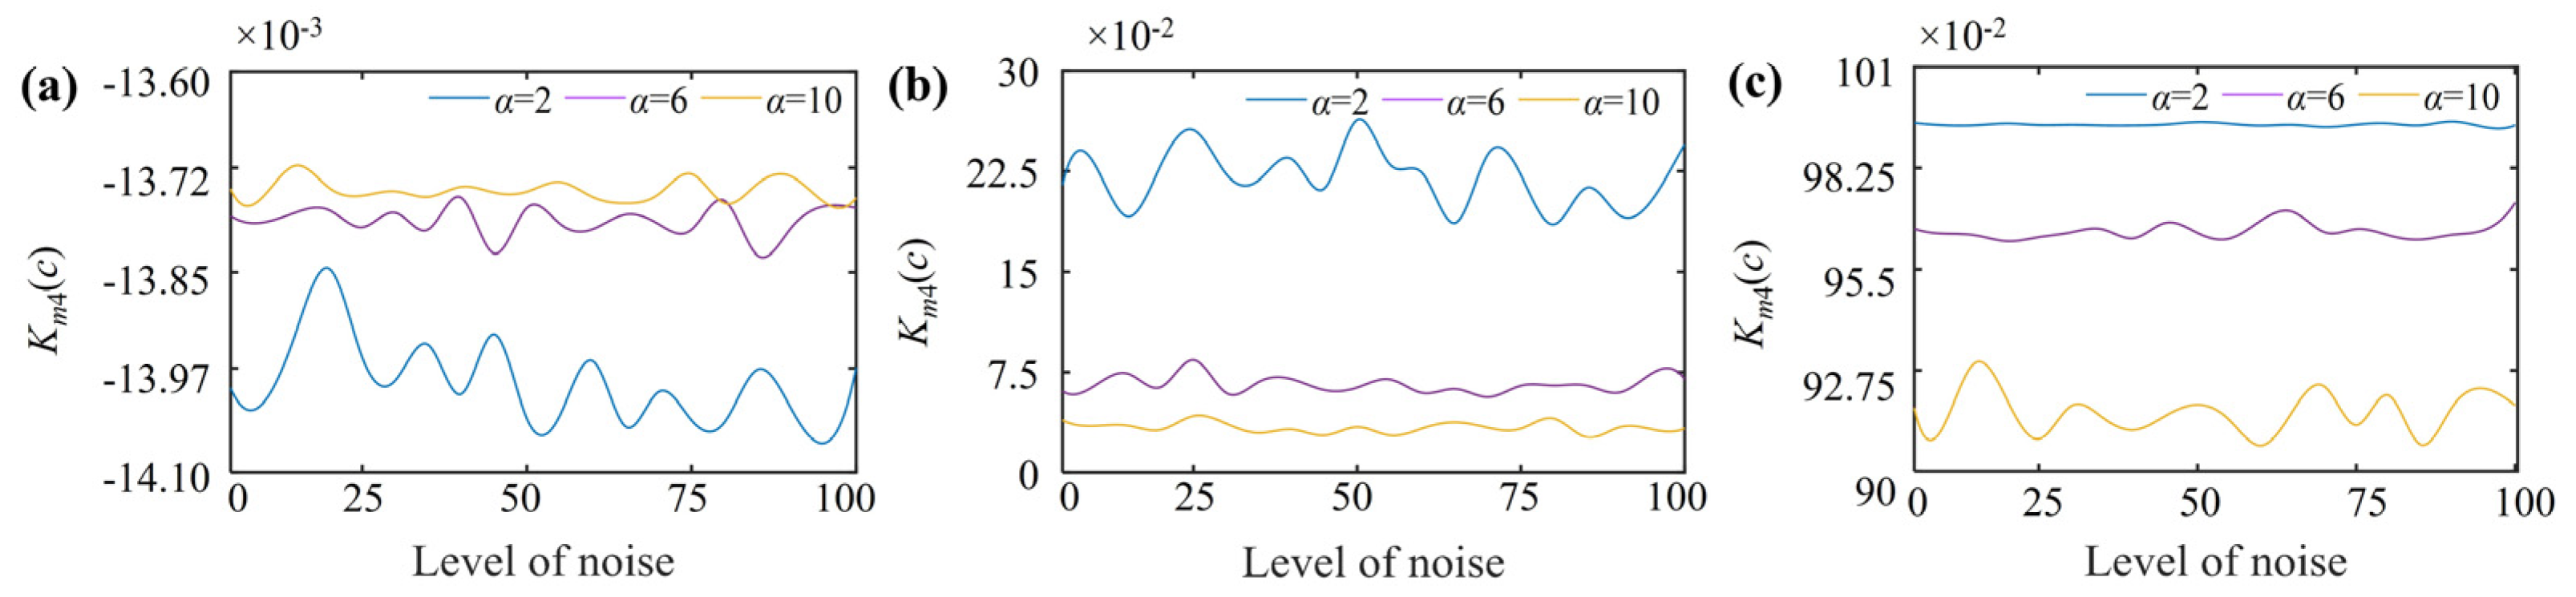
4.3. Effect of the Amplitude on
5. Conclusions
Author Contributions
Funding
Institutional Review Board Statement
Informed Consent Statement
Data Availability Statement
Acknowledgments
Conflicts of Interest
References
- André, H.E.; Susanne, S. On complex dynamics in a Purkinje and a ventricular cardiac cell model. Commun. Nonlinear Sci. Numer. Simul. 2021, 93, 1055511. [Google Scholar]
- Absos, A.; Harekrishna, D. An eco-epidemic predator-prey model with Allee effect in prey. Int. J. Bifurc. Chaos 2020, 13, 2050194. [Google Scholar]
- Li, M.; Wang, Y.; Geng, J.; Hong, W. Chaos cloud quantum bat hybrid optimization algorithm. Nonlinear Dyn. 2021, 103, 1167–1193. [Google Scholar] [CrossRef]
- Wang, X.; Zhang, M. An image encryption algorithm based on new chaos and diffusion values of a truth table. Inf. Sci. 2021, 579, 128–149. [Google Scholar] [CrossRef]
- Blake, M.; Davison, R.A. Chaos and pole-skipping in rotating black holes. J. High Energy Phys. 2022, 2022, 13. [Google Scholar] [CrossRef]
- Choi, C.; Mezei, M.; Sárosi, G. Pole skipping away from maximal chaos. J. High Energy Phys. 2021, 2021, 207. [Google Scholar] [CrossRef]
- Bedrossian, J.; Blumenthal, A.; Punshon-Smith, S. Almost-sure enhanced dissipation and uniform-in-diffusivity exponential mixing for advection-diffusion by stochastic Navier-Stokes. Probab. Theory Relat. Fields 2021, 179, 777–834. [Google Scholar] [CrossRef]
- Gu, D.; Liu, Z.; Li, J.; Xie, Z.; Tao, C.; Wang, Y. Intensification of chaotic mixing in a stirred tank with a punched rigid-flexible impeller and a chaotic motor. Chem. Eng. Processing Process Intensif. 2017, 122, 1–9. [Google Scholar] [CrossRef]
- Ouannas, A.; Khennaoui, A.A.; Momani, S.; Grassi, G.; Pham, V.T.; Khazali, R.; Vo Hoang, D. A quadratic fractional map without equilibria: Bifurcation, 0-1 test, complexity, entropy, and control. Electronics 2020, 9, 748. [Google Scholar] [CrossRef]
- Gottwald, G.A.; Melbourne, I. A new test for chaos in deterministic systems. Proc. R. Soc. Lond. Ser. A Math. Phys. Eng. Sci. 2004, 460, 603–611. [Google Scholar] [CrossRef] [Green Version]
- Rosa, L.A.S.; Prebianca, F.; Hoff, A.; Manchein, C.; Albuquerque, H.A. Characterizing the dynamics of the Watt governor system under harmonic perturbation and Gaussian noise. Int. J. Bifurc. Chaos 2020, 30, 2030031. [Google Scholar] [CrossRef]
- Srivastava, A.K.; Tiwari, M.; Singh, A. Composite test inclusive of Benford’s law, noise reduction and 0-1 test for effective detection of chaos in rotor-stator rub. Nonlinear Dyn. 2021, 106, 989–1010. [Google Scholar] [CrossRef]
- Toker, D.; Sommer, F.T.; D’Esposito, M. A simple method for detecting chaos in nature. Commun. Biol. 2020, 3, 11. [Google Scholar] [CrossRef] [PubMed] [Green Version]
- He, Z.; Abbes, A.; Jahanshahi, H.; Alotaibi, D.N.; Wang, Y. Fractional-order discrete-time SIR epidemic model with vaccination: Chaos and complexity. Mathematics 2022, 10, 165. [Google Scholar] [CrossRef]
- Wang, L.; Mao, X.; Wang, A.; Wang, Y.; Gao, Z.; Li, S.; Yan, L. Scheme of coherent optical chaos communication. Opt. Lett. 2020, 45, 4762–4765. [Google Scholar] [CrossRef]
- Abdullah, H.A.; Abdullah, N.H.; Mahmoud Al-Jawher, A.W. A hybrid chaotic map for communication security applications. Int. J. Commun. Syst. 2020, 33, e4236. [Google Scholar] [CrossRef]
- Gottwald, G.A.; Melbourne, I. On the implementation of the 0-1 test for chaos. SIAM J. Appl. Dyn. Syst. 2009, 8, 129–145. [Google Scholar] [CrossRef]
- Armand Eyebe Fouda, J.S.; Bertrand, B.; Sabat, S.L.; Yves Effa, J. A modified 0-1 test for chaos detection in oversampled time series observations. Int. J. Bifurc. Chaos 2014, 24, 1450063–1450064. [Google Scholar] [CrossRef]
- Muthu, J.S.; Paul, A.J.; Murali, P. An efficient analysis of the behavior of one-dimensional chaotic maps using 0-1 test and three state test. In Proceedings of the 2020 IEEE Recent Advances in Intelligent Computational Systems (RAICS), Trivandrum, India, 3–5 December 2020; pp. 125–130. [Google Scholar]
- Xiao, Q.; Liao, Y.; Xu, W.; Chen, J.; Wang, H. Impact of damping amplitude on chaos detection reliability of the improved 0-1 test for oversampled and noisy observations. Nonlinear Dyn. 2022, 108, 4385–4398. [Google Scholar] [CrossRef]
- Chen, Z.; Liang, D.; Deng, X.; Zhang, Y. Performance analysis and improvement of logistic chaotic mapping. J. Electron. Inf. Technol. 2016, 38, 1547–1551. [Google Scholar]
- Zhuang, Z.; Jing, W.; Liu, J.; Yang, D.; Chen, S. A new digital image encryption algorithm based on improved Logistic mapping and Josephus circle. J. Comput. Commun. 2018, 6, 14–28. [Google Scholar] [CrossRef] [Green Version]
- Guo, Y.; Jing, S.; Zhou, Y.; Xu, X.; Wei, L. An image encryption algorithm based on Logistic-Fibonacci cascade chaos and 3D bit scrambling. IEEE Access 2020, 8, 9896–9912. [Google Scholar] [CrossRef]
- Cheng, S.; Sun, J.; Xu, C. A color image encryption scheme based on a hybrid cascaded chaotic system. Int. J. Bifurc. Chaos 2021, 31, 2150125–2150136. [Google Scholar] [CrossRef]
- Jin, J.; Lin, R.; Zhang, Q.; Hou, G.; Di, Z.; Jia, C. Real-time speech audio domain encryption system based on chaotic cascade. Comput. Eng. 2009, 35, 137–139. [Google Scholar]
- Yu, Y.; Wang, Y.; Wang, C. An iterative cascade chaotic spread spectrum sequence and its performance analysis. Appl. Electron. Tech. 2016, 42, 95–98. [Google Scholar]
- Zhao, L.; Bao, L.; Ding, H. ST linear coupling cascade chaotic spread spectrum code and its performance analysis. Telecommun. Eng. 2021, 61, 218–223. [Google Scholar]
- Zhang, L.; Yang, K.; Li, M.; Xiao, Q.; Wang, H. Enhancement of solid-liquid mixing state quality in a stirred tank by cascade chaotic rotating speed of main shaft. Powder Technol. 2022, 397, 117020–117026. [Google Scholar] [CrossRef]
- Gottwald, G.A.; Melbourne, I. Testing for chaos in deterministic systems with noise. Phys. D Nonlinear Phenom. 2005, 212, 100–110. [Google Scholar] [CrossRef] [Green Version]
- Schreiber, T.; Kantz, H. Noise in chaotic data: Diagnosis and treatment. Chaos Interdiscip. J. Nonlinear Sci. 1995, 5, 133–142. [Google Scholar] [CrossRef] [Green Version]


| Version of | Version of | Estimation Method | Employed Approach |
|---|---|---|---|
| Regression | |||
| Correlation | |||
| Type of Mapping | Control Parameters | Chaotic Interval | Interval of Onto Mapping |
|---|---|---|---|
| Logistic | |||
| Improved Cubic | |||
| L-C |
| System Status | Control Parameter | Ratio of Difference Value and Initial AGR | |
|---|---|---|---|
| Level of the Added Noise | |||
| Weak-chaotic dynamic | 99.68% | 99.04% | |
| 96.54% | 96.87% | ||
| 97.23% | 97.14% | ||
| Strong-chaotic dynamic | 8.96% | 9.85% | |
| 8.49% | 7.80% | ||
| 6.15% | 5.91%% | ||
Publisher’s Note: MDPI stays neutral with regard to jurisdictional claims in published maps and institutional affiliations. |
© 2022 by the authors. Licensee MDPI, Basel, Switzerland. This article is an open access article distributed under the terms and conditions of the Creative Commons Attribution (CC BY) license (https://creativecommons.org/licenses/by/4.0/).
Share and Cite
Liao, Y.; Yang, K.; Wang, H.; Xiao, Q. An Alternative Approach for Identifying Nonlinear Dynamics of the Cascade Logistic-Cubic System. Mathematics 2022, 10, 2080. https://doi.org/10.3390/math10122080
Liao Y, Yang K, Wang H, Xiao Q. An Alternative Approach for Identifying Nonlinear Dynamics of the Cascade Logistic-Cubic System. Mathematics. 2022; 10(12):2080. https://doi.org/10.3390/math10122080
Chicago/Turabian StyleLiao, Yanan, Kai Yang, Hua Wang, and Qingtai Xiao. 2022. "An Alternative Approach for Identifying Nonlinear Dynamics of the Cascade Logistic-Cubic System" Mathematics 10, no. 12: 2080. https://doi.org/10.3390/math10122080