Article

Trading Stocks Based on Financial News Using Attention Mechanism

1
Engineering and Technology Department, Liverpool John Moores University, Liverpool L3 5UX, UK
2
Computer Science and Engineering Department, Thapar Institute of Engineering and Technology, Patiala 147004, India
3
Computer Science and Engineering Department, National Institute of Technology, Hamirpur 177005, India
4
Faculty of Computers and Information, South Valley University, Qena 83523, Egypt
5
Electrical Engineering Department, College of Engineering, King Khalid University, Abha 62529, Saudi Arabia
6
Electrical Engineering Department, Faculty of Engineering, Aswan University, Aswan 81528, Egypt
7
Institute for Neuro- and Bioinformatics, University of Lübeck, 23562 Lübeck, Germany
*
Author to whom correspondence should be addressed.
Mathematics 2022, 10(12), 2001; https://doi.org/10.3390/math10122001
Submission received: 6 April 2022 / Revised: 27 May 2022 / Accepted: 30 May 2022 / Published: 10 June 2022

Abstract

:
Sentiment analysis of news headlines is an important factor that investors consider when making investing decisions. We claim that the sentiment analysis of financial news headlines impacts stock market values. Hence financial news headline data are collected along with the stock market investment data for a period of time. Using Valence Aware Dictionary and Sentiment Reasoning (VADER) for sentiment analysis, the correlation between the stock market values and sentiments in news headlines is established. In our experiments, the data on stock market prices are collected from Yahoo Finance and Kaggle. Financial news headlines are collected from the Wall Street Journal, Washington Post, and Business-Standard website. To cope with such a massive volume of data and extract useful information, various embedding methods, such as Bag-of-words (BoW) and Term Frequency-Inverse Document Frequency (TF-IDF), are employed. These are then fed into machine learning models such as Naive Bayes and XGBoost as well as deep learning models such as Convolutional Neural Network (CNN) and Long Short-Term Memory (LSTM). Various natural language processing, andmachine and deep learning algorithms are considered in our study to achieve the desired outcomes and to attain superior accuracy than the current state-of-the-art. Our experimental study has shown that CNN (80.86%) and LSTM (84%) are the best performing models in relation to machine learning models, such as Support Vector Machine (SVM) (50.3%), Random Forest (67.93%), and Naive Bayes (59.79%). Moreover, two novel methods, BERT and RoBERTa, were applied with the expectation of better performance than all the other models, and they did exceptionally well by achieving an accuracy of 90% and 88%, respectively.

1. Introduction

The goal of any investor is to predict market behaviour in order to make the best decision possible when purchasing or selling stocks in order to profit. It is challenging since the market sentiments are unpredictable and impacted by various factors, including politics, the global economy, and investor expectations. However, investor opinion on the stock market is more visible due to herd-like behaviour, overreaction, and limited institutional engagement. Therefore, investors use sentiment research to see whether the stock market is influenced by emotions rather than logical decision-making. This study examines external information such as political and economic aspects from the standpoint of a fundamental analyst. Unstructured data, such as financial news articles or headlines, are used to extract the required information. Many writers have recommended examining the text and extracting information pertinent to the forecasting operation using text mining and machine learning approaches. Several related studies in machine learning, deep learning, and natural language processing (NLP) fields have been carried out, including extracting and analysing opinions from media headlines in relation to the stock market, as well as predicting the performance of a company’s specific stock based on its sentiments.
Researchers have long been fascinated by stock market predictions based on news headlines. Several studies have been conducted, including “how news headlines and articles influence stock price” and “what impact does foreign news have on important economic indicators.” The ability of an investor to keep up with the news on a daily basis is crucial. Three forms of news may or may not elicit a reaction from the financial market: Positive news, negative news, and neutral news. An individual must be capable of deciphering the data and determining whether his or her stock will rise or fall quickly.

1.1. Positive News

Encouraging or favourable financial news is likely to have a positive influence on the stock exchange, and it is apparent to see how stock values rise or fall when the news story is published. Positive news, such as joint venture partnerships, new deals, an outstanding financial performance, the discovery of large oil reserves, and significant sales statistics, should cause a stock to rise. The favourable business news affects stock prices in a slow but steady manner. Positive news, on the other hand, does not always lead to an increase in stock prices. Optimistic domestic news and depressing international news might cause the stock’s value to fall. The global and domestic markets are interlinked. A single day’s worth of negative news from overseas may send the stock market tumbling.

1.2. Negative News

The impact of bad news on stock prices is more significant than that of positive news. The emotion of a market is still a significant concern. A bleak climate or a terrible narrative is all it takes to send the stock price plummeting. It has the potential to stop the typical individual from investing in stocks. The impact of business news on the financial markets is instantaneous. It has the power to turn a bad day into a fantastic one or a fantastic day into a bad one. The next business news might be a boom-and-bust scenario. Stock prices will often respond positively to good news, but this is not always the case. If terrible news from across the world outshines good news, it might be a disastrous day for stocks since stock prices react more strongly to negative headlines than they do to good ones.

1.3. The Relationship between Sentiment and the Stock Market

In 2013, a false message on Twitter led the Dow Jones to plummet [1]. The three-minute plunge briefly wiped out USD 136.5 billion of the S and P 500’s value. A false tweet claimed that two bombs were detonated near the White House and that President Barack Obama was injured. The S and P 500 plummeted 14.6 points in three minutes after the tweet was broadcast to the market-between 1:09 and 1:12 p.m. The Dow 30 dropped more than 150 points before recovering quickly. However, due to the plethora of readily available information on the Internet, keeping up with financial news is challenging. Everyone spends time evaluating the opinions (positive, negative, and neutral) of each headline, article, and tweet. In order to automate the process, machine learning algorithms are used to determine if a news article or headline is positive, negative, or neutral. However, any machine learning technique that aspires to achieve sufficient accuracy must determine what linguistic form is acceptable for the prediction, comprehend speech patterns, expressions, phrases, etc., and combine them into a sentiment decision. This research aims to show and compare the performance of several machine learning and deep learning models using different word embedding methods to find the most effective and precise model.
The main contributions of this paper are as follows:
  • Valence Aware Dictionary for Sentiment Reasoning (VADER) [2] is used to compute the sentiment scores on financial headlines to analyse emotions related to stock prices.
  • The two most widely used word embedding approaches, Bag-of-words (BoW) and Term Frequency-Inverse Document Frequency (TF-IDF), are utilised to map dictionary words or phrases to real number vectors.
  • The machine learning models, XGBoost and Naive Bayes are developed to predict sentiment values.
  • Neural network models, Convolutional Neural Network (CNN) and Long Short-Term Memory (LSTM), are trained on sentiments data to predict the sentiment score.
  • Attention-based models, Bidirectional Encoder Representations from Transformers (BERT) [3] and its variant RoBERTa [4], were also trained with neural network on financial news sentiment data to achieve superior performance.
The remaining structure of this paper is as follows. Section 2 discusses the related work performed in the direction of sentiment analysis on stock prices. Section 3 describes dataset description, preparation, exploratory data analysis, and methodologies used. Section 4 covers the experimental results and discussions. The conclusion and future scope are drawn in Section 5.

2. Literature Review

2.1. Forecasting Stock Market through Emotions

Numerous fascinating investigations have been undertaken on this topic by researchers. Some of the analyses have shown positive findings, while others have yielded less than ideal results. One research [5] discovered an essential link between the stock price of Microsoft and its tweets. For interpreting public emotions in tweets, this research employed two independent textual concepts: Word2Vec and N-gram. Abbreviations, emojis, and useless information such as photos and URLs were used in tweets. In addition, tokenisation, stopwords elimination, and regex matching were used in the preprocessing. The features were then supplied to the classifier and, subsequently, constructed using Random Forest. However, due to its strong performance on massive datasets and definite meanings, the model trained with N-gram attained an accuracy of 70.5%. To categorise nonhuman annotated tweets, the model coupled with Word2Vec was selected. The assumption that favourable attitudes in tweets about a business mirror its stock price is bolstered by the findings above, indicating that further study will be promising. Similar studies are being carried out in various parts of the world.
The work in [6] investigated the people’s perceptions of the Brazilian stock market based on tweets generated by the general public. The dataset used in this study consists of 4516 Portuguese tweets on the BOVESPA primary index [7]. Each tweet was tagged according to Plutchik’s Psych evolutionary Theory of Basic Emotions [8], even though the sample was imbalanced since most of the tweets were unlabelled. The first phase, known as preprocessing, sifts the crucial words from the tweet by converting them to lowercase and removes unnecessary and unlabelled tweets before calculating TF-IDF feature vectors. To reduce the dimensionality of TF-IDF vectors and provide a visual interpretation of the tweets, Principal Component Analysis (PCA) and t-Distributed Stochastic Neighbour Embedding (t-SNE) [9] were utilised. The K-means method, Local Discriminant Analysis (LDA), and Non-negative Matrix Factorisation (NMF) were used to reveal close relationships and important patterns among clusters, extracted themes, and feelings in tweets. The method was unable to discover the differentiating characteristics of each emotion because the used dataset was imbalanced. In the absence of emotions, however, the categorisation systems worked effectively. According to empirical data, the targeted sentiment classification might predict sentiments in tweets on the BOVESPA in Portuguese. Random Forest and SVM displayed the findings for neutral opinions because the number of tagged neutral tweets is more significant than the number of other emotive tweets. For SVM (neutral), precision, recall, and F1-score are 61%, 48%, and 54%. In the same way, the accuracy rate for Random Forest is (neutral): precision 59%, recall 40%, and F1-score 48%.
The work of [10] explored sentiment analysis to discover people’s predominant emotions while sharing their thoughts on Twitter about the COVID-19 epidemic. Sentiment analysis on tweets connected to COVID-19 was utilised in similar research [11] to foresee the market movements or predict investor responses through assessing emotions underlying tweets sent by users on equities. This study was carried out to increase prediction skills and foresee recessions. In addition, the study found that analysing Internet searches for consumer sentiment on the economy may accurately forecast financial activity and demand [12,13]. Moreover, the study discovered that the entrance and spread of Coronavirus in a country increased economic anxiety and stress—the sample set of data represented the whole population of the United States. The research focuses on the pharmaceutical business because of its importance in the US financial industry. According to researchers, increasing news coverage of the spread of infectious disease outbreaks has a beneficial impact on the buying and selling of pharmaceutical company stock. Pharmaceutical businesses, in general, react to the demand for vaccines and medications to prevent communicable illnesses by spending significant amounts on R&D. Government appropriations are recognised for allowing large-scale manufacture of medications, sanitisers, and protective masks. Reddit, a US-based aggregator, provided data for social news and discussions. Yahoo Finance was used to obtain financial data and information. TextBlob was well-suited for sentiment analysis when it comes to text processing. Its function evaluates two main characteristics: polarity and subjectivity. The former is between −1 and 1, whereas the latter is between 0 and 1. This study rated news headlines as positive, negative, or neutral using TextBlob. The Naive Bayes algorithm was used to categorise the data after tokenisation, tagging, abbreviation processing, and N-gram word combinations.
Another research [14] focused on using bigrams, a step up from the basic model that was thought to take up a higher amount of semantic information. Due to data density issues, the trigrams were not valuable. Instead, NLP techniques such as stemming and tokenisation were used to preprocess the obtained textual data. In other words, the study focused on using news information to estimate stock price movement or the exact value of a future item. The direction of asset volatility could be predicted more accurately using data from news sources than the price movement’s position. Two machine learning models, LDA and Naive Bayes, were used to represent information from news streams and forecast the direction of the stock price. The predicting accuracy for volatility was 56%, while the closing price of the assets did not reach 49%. As a result, the report indicated that asset price changes are less probable than unpredictability measures.
In [15], a BERT model on Chinese stock views is suggested to enhance sentiment categorisation. BERT is used to analyse views at the sentence level. The dataset contains a total of 9204 opinions or emotions. Different models were employed to achieve a more successful classification model, including BERT + Linear (92.50%), BERT + LSTM (91.97%), and BERT + CNN (91.97%), with BERT + Linear being chosen for sentiment analysis. Another study [16] aims to extract both emotions and BoW information from annual reports of US-based businesses. Diction 7.0 [17] and a dictionary by Loughran and McDonald [18] were at the core of the discussion. The efficacy of a multilayer perceptron neural network was compared to that of four commonly used text classification methods: Naive Bayes, decision tree, K-NN classifier, and SVM. On lower-dimensional data, SVM and K-NN performed well. For BoW with more significant features, Naive Bayes, decision trees, and neural network (NN) performed better. NN (101%) was the most popular, followed by SVM (97%), decision tree (82%), K-NN (72%), and Naive Bayes (85%). In [19], Linear Regression, SVM, Naive Bayes, and Random Forest were considered for predicting stock market values, with SVM performing the best. Tweets were gathered over a period of time and may include irrelevant information. In order to clean this irrelevant information, preprocessing techniques, such as tokenisation, stopwords and regex, were implemented.

2.2. The Stock Market Predictive Analytics

Predictive analytics makes use of cutting-edge Artificial Intelligence (AI) technologies to scan, clean, organise, transform, and analyse data from a range of sources in order to help long-term investors make the best decisions. It is useful for predicting future hazards, making strategic decisions, and enhancing financial capacities. A wide range of stock market statistics can be employed with predictive analytics. To achieve the greatest outcomes, it employs a variety of computational models. Predictive analytics provides traders and analysts with more than regular company reports by learning from extensive historical data [20]. Traders and research analysts may be able to receive more accurate stock price movements if new technology is deployed. The authors in [21] proposed a deep learning strategy for forecasting future stock movement. Two Recurrent Neural Networks (RNNs) (i.e., LSTM and Gated Recurrent Unit (GRU)) were configured and compared to the Blending Ensemble model, with the latter outperforming the former. The stock data comes from the S and P 500 index, while news data comes from fortune.com, cnbc.com, reuters.com, and 
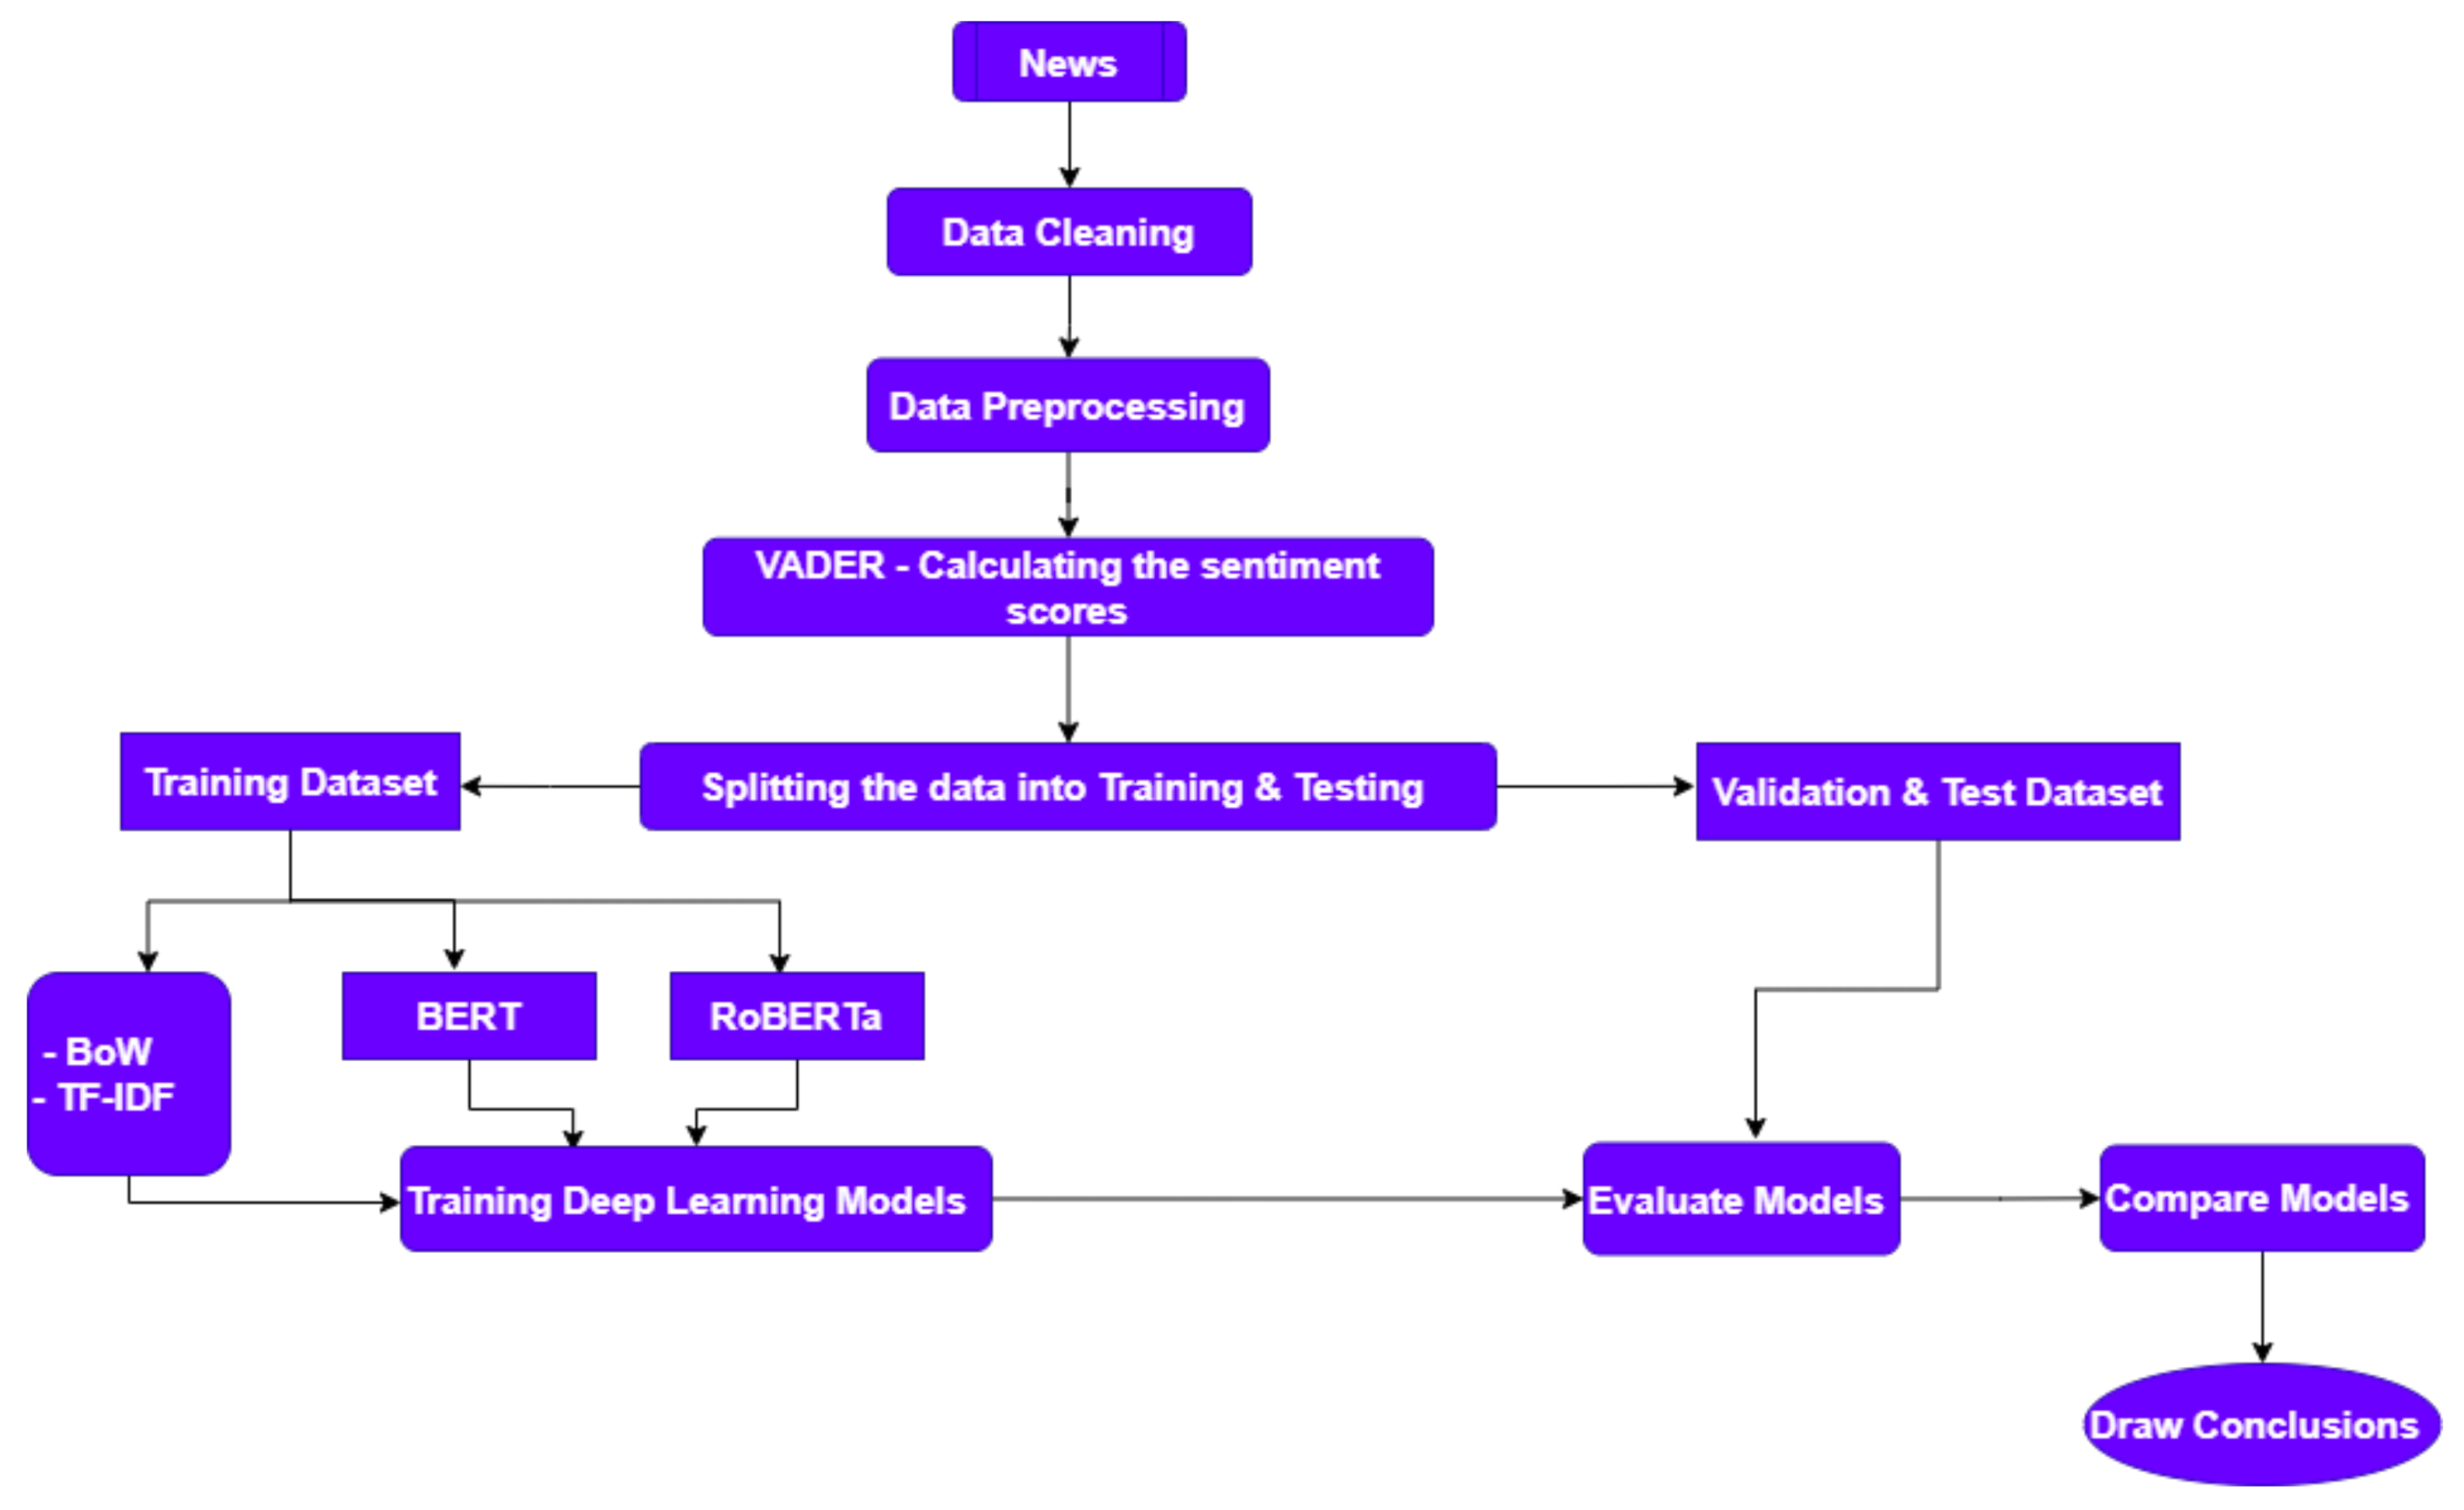
wsj.com. The news data accounted for headlines since stories or articles might add extra noise. As a result, the model has the potential to underperform. The adjusted closing price was utilised as it is considered to reflect the true worth of the asset and is commonly employed in a detailed analysis of previous gains. The study found a blended ensemble deep learning model outperformed the top-performing model using the same dataset. It decreased the mean squared error (MSE) by 57.55%, raised the F1-Score by 44.78%, boosted recall by 50%, precision rate by 40%, and movement direction accuracy (MDA) by 33.34%. VADER is used to construct sentiment scores during data preprocessing. The purpose of this study was to prove that traders, fund managers, and other short-term investors can make better investment decisions utilising ensemble deep learning technology than they can using traditional approaches.
Another study [22] proposed a deep learning strategy that combines CNN and RNN for day trading directional movement prediction using financial news and technical indicators as inputs. According to this study, CNN outperforms RNN in detecting semantics from text and content connotations. However, RNN remains one step ahead in detecting contextual information and constructing complex features for stock market forecasting. Another deep learning-based method for event-driven stock market prediction is proposed in [23]. The proposed prediction model termed EB-CNN (event embedding input and CNN prediction model) outperformed other models and achieved an index prediction of 64.21%. The Word2Vec model was chosen to get ready for word embedding. An integration of BoW and SVM models gives an accuracy of 56.38%. The obtained results in [24] indicated that CNN outperforms RNN in collecting lexical bits from content, while RNN outperforms CNN in perceiving relative information. To predict the stock price of Chevron Corporation, two models were tested. The first is a hybrid model termed SI-RCNN, which combines a CNN for news and an LSTM for technical indicators. The second is named I-RNN, which has only an LSTM network for technical indicators. These methodologies show that financial data plays an integral part in balancing outcomes and guiding traders in selecting whether to buy or sell a share. The SI-RCNN model could make a reasonable profit of 13.94%, and its accuracy is 56.84%, which is higher than that of the I-RNN model, which is 52.52%.
The work in [25] confirmed the link between business news and stock prices. According to the results, the SVM forecasted stock movements with an accuracy of up to 73%. A trading simulation was created during this study to analyse profitability through simulating real-world conditions. The initial investment was estimated to be 100 million VND, and each transaction was assessed as 0.25% of the trading money. The system executed four transactions in two weeks to develop the prediction model, earning 105,314,500 VND, a profit of over 5 million VND. BoW was employed for tokenisation. To boost the relevance of words that were randomly assigned positive and negative classifications, delta TF-IDF was constructed instead of the traditional TF-IDF approach. Data on stock prices were gathered from cophieu68.com. In addition, websites such as vietstock.cn, hsx.vn, and hsn.vn were used to collect a total of 1884 news articles.
The work of [26] examined the predictive impact of considering the environmental, social, and governance (ESG) events from financial news on stock fluctuation. ESG2Risk, a unique deep learning system, was proposed to estimate future stock market volatility. The language-based algorithm effectively extracted information from ESG events to forecast market volatility. The model sentiments and test embeddings were examined for two weeks, and the findings revealed that ESG2Risk outperforms the Senti approach by a significant margin. According to the findings, ESG events significantly impacted future returns and were crucial for investors to consider when investing. The study also revealed that incorporating ESG events into investing strategies might benefit outcomes. This work [27] examined data from various web sources, including Twitter, Yahoo Finance, and news articles. Sentiment analysis is used on messages, tweets, and news by implementing Naive Bayes in the combination of BoW and part-of-speech (POS) tagging. Then, aggregating sentiments for the predictor to provide trading signals for buying and selling to anticipate price fluctuations. Finally, after accounting for 833 virtual transactions, the model outperformed the S and P 500 index, yielding a positive return on investment of 0.49% per trade or 0.24% when the market was changed.

2.3. International News in Forecasting Stock Prices

News is critical for analysing stock prices because it offers qualitative information that impacts market expectations. The uniqueness in economic news influences stock returns. The news article or story must include something distinctive to change the price up or down. Financial statistics and textual content featuring originality significantly impact stock values. As a result of the Internet, the quantity of data has been publicly accessible, and many investors have felt overwhelmed when following the news. As a result, the importance of automated document categorisation of the most crucial information is growing [28]. Automated news report grouping is a kind of text analysis that converts unstructured data into a machine-readable format or a language that the computer can understand and then utilises different machine learning approaches to categorise texts by emotions, subjects, and aims [29]. A similar research work [30] conducted a similar analysis, but with a different experiment, using news articles to forecast short-term stock price fluctuations. This study categorised price movement and each news segment as up, down, or unchanged, referring to stock movements in the timespan surrounding the story’s publication. The findings revealed a strong link between stock price and news stories from 20 min before to 20 min after publicly available financial news. Announcing a news report and the results in price movements is a typical catalyst for investment speculation. Since news is a persuasive source of information for forecasting, they impact the market by raising and dropping prices.
In [31], the Multiple Kernel Learning (MKL) approach was used to combine information from a single stock and sub-industry-specific news articles to forecast impending price movement. For evaluation, SVM with different kernels and KNN were used for stock-specific datasets and sub-industry-specific datasets. In order to extract features, the BoW method was utilised. Finally, TF-IDF was used to characterise the transformation of each document into a vector.
The authors of [32] suggested a mechanism for converting newspaper coverage into Paragraph Vector [33], and used LSTM to analyse the temporal impact of prior incidences on many stocks’ opening pricing. The research used data from 50 businesses listed on the Tokyo Stock Exchange (TYO/TSE) to anticipate asset values using distributed representations of news stories. According to empirical findings, the distributed models of word-based material outperformed the mathematical-data-only technique and the BoW methodology. LSTM effectively captured the time-series impact of input data and forecast stock prices for firms in the same industry. The news dataset came from the Nikkei newspaper from 2001 to 2008, while the top 10 company dataset came from Nikkei 225, which was connected to news items during the same period. The work in [34] aimed to investigate the relationship between news and stock movement. Both BoW and TF-IDF were employed to identify emotion and text representation (see Table 1 for various ways of text representation considered in the literature). Then, three alternative classification models—Random Forest, SVM, and Naive Bayes—were used to explain the text polarity. According to the findings, the stock trend could be predicted using financial news items and historical stock prices. Table 2 summarises the different machine/deep learning methods employed in different research works in the literature.
In this work [41], deep neural networks were considered to extract rich lexical characters from news text to work on sentiment signal characteristics. A Bidirectional-LSTM was used to encode text and get contextual information. The At-LSTM model employed financial news headlines to forecast the direction of the S and P 500 indexes, as well as the stock values of other companies. The planned model’s highest accuracy was 65.53%, with an average accuracy of 63.06% lower than the KGEB-CNN model (Knowledge Graph Event Embedding-CNN) [45]. Based on the experimental results, the model is valuable and feasible compared with the state-of-the-art models. Future work should forecast price swings over a longer time horizon and be related to the news. Skip-gram and BoW were used for word and phrase embedding. The authors of [43] examined the correlation between news stories and stock prices. It tried to determine whether news had anything to do with the KSE-100 index (Karachi Stock Exchange). This research used two methodologies: correlation and regression analysis. This analysis relied on sixteen years of data (1999–2014). Consequently, both the KSE and its index had a casual connection with words. In [44], the authors researched and analysed the impact of technical analysis, Internet news, and tweets on the stock price prediction. The link between the closing price and the time series of news articles and the closing price and Twitter views was investigated. Both linear regression and SVM were applied, but SVM attained better results than linear regression.
Table 3 summarises the various datasets considered in different research work along with more details.

3. Proposed Framework

The main point of this research is to explore and understand how stock market records react to emotions/sentiments assembled from financial news headlines. Due to the cause-and-effect relationship between news sentiments and stock market indices, this study falls under the category of Explanatory Research, sometimes known as Casual Research. Furthermore, this study is also known as Correlational Research and Descriptive Research since it aims to determine if there is a relationship between various indices and how positive, negative, and neutral emotions lead to buying, selling, and nothing, respectively. We begin by discussing the dataset description, dataset preparation, exploratory data analysis, and the employed techniques. Figure 1 illustrates the workflow of the proposed framework.

3.1. Dataset Description

Business Standard [46], Kaggle Dataset [47], Data.World [48], Yahoo Finance [49], NSE India [50], Github [51], and Google Word2Vec [52] are some of the sources for the data utilised in this research. Table 4 gives a brief description of each data source. Date, open, close, low, high, volume, adjusted volume/adjusted close, and name are the elements that make up global stock market indices, which are summarised in Table 5.
Information for some firms date back to the year 2000, while for others, it dates back to the year they were first listed on the stock exchange. Historical datasets were obtained via Kaggle, although they were only given for five years. Therefore, this research had two options: buy a 20-year history dataset for a high price [53], or receive historical data from Yahoo Finance [49]; the other alternative was to use a list of components gathered from several other sources. The Word2Vec model embeds words or phrases based on Google news data (about 100 billion words) when undertaking sentiment research on the stock market. It would be preferable to train word vectors, but this may take a long time and need swift resources. This pre-trained Google Word2Vec model fits in utilising 300-dimensional word vectors and comprises 3 million words and phrases.

3.2. Datasets Preparation

The dataset preparation is considered a very important step in the machine learning field. Numerous strategies were applied during the data preparation phase. Each step was designed to ensure that no information was missing throughout these steps or phases. The following sections discuss the various approaches to data preparation.

3.2.1. Elimination of Variables

The Full-Economic-News dataset assembled data from the Divider Road Diary and the Washington Post, consisting of various attributes. However, only a few of them give value to the models. Date, article ID, and title were included in the model from Full-Economic-News. In addition, a few variables were expected to contribute value but were found to have null values, so they were removed from the dataset. For instance, “positivity” and “positivity: confidence” have null values of 82.25% and 52.81%, respectively. Another reason for removing other variables, such as “relevance” and “relevance: confidence,” was that they contributed no additional information. They were not valuable in using VADER to calculate polarity such as “Negative,” “Neutral,” and “Positive,” as well as to calculate “Compound” scores to make trading decisions.

3.2.2. Transformation of Variables

The majority of the columns had already been verified; therefore, no adjustments were necessary. Furthermore, these label names had no inconsistencies observed. However, a few attributes within the dataset had to be transformed before they could be utilised in the analysis and model building.

3.2.3. Identification of Missing Values

Although there were missing values in some columns, they were eliminated since they did not help in building the model. No more significant missing values were detected that require treatment.

3.2.4. Derived Variables

The Full-Economic-News dataset, which was considered in this study, has 15 columns. The dataset was first transformed into a data frame, and then key columns, such as Date and Headline, were extracted. The remaining 13 columns were removed since they did not help in building the model.

3.3. Exploratory Data Analysis

Exploratory data analysis was perhaps the most crucial data analysis stage. The data were mined to extract useful information, and conclusions were drawn.

3.3.1. Univariate Analysis

The term uni means one. It is a method of analysis that assesses only one variable, so there is no need to worry about causes or relationships. Univariate analysis focuses on only one variable [54]. In this work, “Tech Stocks” and “Indian Banking Stocks” were fetched from “Global Headlines.” FAANG (Facebook, Amazon, Apple, Netflix, and Google) stocks were evaluated, and shares from other key prospective firms such as Microsoft, Cisco, and Oracle were also analysed [55]. Figure 2 and Figure 3 illustrate pie charts of technology businesses with USD billion-dollar and trillion-dollar valuations, respectively.
As of the beginning of 2021, Tesla has a market value of 834 billion USD. Its entry intp the S and P 500 has also provided the stock with a significant advantage in terms of performance [56].
Apple has a maximum capitalisation of 2 trillion USD, and Microsoft has a market capitalisation of 1.66 trillion USD, as indicated in Figure 3. This data demonstrates that technology equities are soaring. As seen in Figure 4, HDFC Bank has the most significant capitalisation (Indian INR 807,615.27), indicating the most renowned corporation in the banking industry. By assets, it is the biggest private sector bank. Payzapp and SmartBUY are two of the company’s digital offerings.

3.3.2. Bivariate Analysis

Bivariate analysis is a quantitative statistical method for determining the relationship between two variables [57]. Following the calculation of the compound score for each news headline through VADER, the proposed action for the negative compound score is Sell. In contrast, the suggested action for the positive compound score is Buy. Figure 5 and Figure 6 show data from the news headlines of Facebook.
According to positive or negative attitudes, green indicates when to buy, and red indicates when to sell (see Figure 6). Positive news about a stock indicates that the business will do well in the future and that it currently is the most suitable time to trade and hold the stock. In contrast, terrible news indicates that the company will do poorly in the future and that maybe this is not the right time to buy and retain the stock.
Another focus of this study is the financial business. Axis Bank, HDFC Bank, ICICI Bank, Kotak Mahindra Bank, SBI Bank, and IndusInd Bank were all investigated. Based on the news headlines, the compound score and positive or negative opinions for each of the listed banking stocks were calculated, enabling buying and selling. The IndusInd bank was studied throughout this investigation.
The research indicates when to buy or sell the IndusInd bank shares based on the compound score. The best compound score was close to 0.788, showing that IndusInd Bank’s stock will rise in the future, signalling that investors or traders should consider purchasing or holding the stock for a while. The lowest compound score, −0.77, indicates that now is not the best time to purchase since the price is falling, and it is impossible to predict how far it will go. If traders or investors hold the stock for an extended period, selling is another alternative. Figure 7 and Figure 8 show data from the news headlines of the IndusInd Bank, along with the purchasing and selling decisions. The mostly red color signifies sell stock which is in relation to the negative sentiments which is being referred by purple colour.

3.3.3. WordCloud for News Headlines

The Tag Cloud is another name for WordCloud. It is a cloud containing a tonne of words or phrases in various dimensions, each indicating a particular word’s occurrence or importance. It is a graphical representation of text information. Cloud words are often single words, with varied font sizes and colours indicating the significance of each phrase. WordClouds are fantastic tools for finding text data. As more critical words or phrases carry more weight [58].
The most common terms explored when constructing a WordCloud of “Global Headlines” data frame are shown in Figure 9. The top 10 most often used words include: Gain, US, Market, Fed, Stock, Inflation, Dollar, Rise, Economy, and Drop. Figure 9 depicts these terms as more important, i.e., the greater the word, the more often it appears and the more weight it has.

3.4. Methodology

This section discusses using a novel technique to analyse news emotions related to stock or asset prices.

3.4.1. VADER

To compute the sentiment scores, VADER [2] is employed. First, a lexical dictionary is created using this method. Then, a sentiment score is applied to each item in the lexicon. For instance, the word good indicates a positive sentiment value, whereas bad indicates a negative sentiment score. VADER is a python module that aids in the decoding and computing of emotions in streaming media such as text, audio, and video. However, only a few studies have shown that sentiment score computation can be performed with 99 % accuracy.

3.4.2. Word Embedding

Word embedding is an NLP approach in which dictionary words or phrases are mapped to real number vectors. Term and phrase embedding have been shown to improve NLP performance in areas such as sentiment analysis and syntactic parsing. We employed the most widely utilised word embedding strategies.
  • BoW: An algorithm called BoW counts the number of times a word occurs in a text. For search and document categorisation, these word counts may be used to compare records and assess their similarity [59]. Each vector is normalised before being given to algorithms, such that characteristics in the vector add up to one. As a result, each phrase’s recurrence is effectively changed to indicate the words’ possibility in the text. BoW, on the other hand, has its restrictions. First, the produced vectors are all 0, resulting in a sparse matrix. Second, there is no information in the text about the structure of the sentences or the organisation of the phrases.
  • TF-IDF: BoW is an entirely appropriate model to convert raw text to numbers. However, there is a better transformation if the goal is to find signature terms in a document. TF-IDF assesses relevance rather than frequency. The TF-IDF scores were used to substitute word counts across the dataset [60].
  • BERT: The BERT model was introduced by Google in 2018 [3]. BERT’s contribution to language modelling utilises bidirectional transformer training or learning contextual interactions between words or sub-words in a text. It differs from language models, which could only read text input sequentially—either left-to-right or right-to-left; BERT is different because it is designed to read in both directions at once. The findings of BERT reveal that bidirectionally trained language models have a better understanding of flow and context than single-direction language models.

3.4.3. Model Building

This section demonstrates how word embedding techniques were combined with machine learning and deep learning models.
The machine learning models, XGBoost and Naive Bayes, were developed to predict sentiment values. The plan was to use the sentiment data to construct a machine learning model to predict sentiments. Decision trees are the core of the XGBoost model. It builds weak classifier trees, sometimes known as small trees, and adds them to the model sequentially, concentrating on misclassified rows in prior trees. On the other hand, Naive Bayes is the simplest and fastest classification model for a large amount of data. For an unnamed label projection, it uses the Bayes probability theory. The cornerstone for Naive Bayes classification is the application of Naive Bayes with a strong concept between the variables. The term count matrices for each business are the inputs to the XGBoost and Naive Bayes models, with each row representing a news headline and each value representing the number of times a word appeared. The data was fed into the boosted trees model and the Naive Bayes algorithm, and then the accuracy of the sentiment prediction was tested.
Neural networks, such as CNN and LSTM, were also trained to predict sentiment values. However, since neural networks are highly sophisticated, it was attempted to compare their performance to machine learning models. A neural network typically takes all of the data as input and finds out the function of each neuron to increase prediction. For example, a CNN goes over every region, vector, and feature in the matrix, making it more data-friendly to recognise more dense characteristics. The primary motivation for using a CNN for classification is to extract features from a large-scale dataset. Because it uses word embedding and a one-dimensional layer, the textual information is considered sequential and one-dimensional.
RNNs tackle a distinct set of real-world issues from CNNs, including time-series prediction [61]. A time series is a sequence of data points that are arranged chronologically. For example, a neural network may be taught to detect images of cats. The sequence in which multiple training images are supplied into the model throughout this phase is unimportant. It is because image-1 and image-2 are separate entities. However, if the goal is to forecast future returns or prices based on financial data, the model must first comprehend the underlying trend. The share prices on Day 1 and Day 2 are not entirely independent, and the model must account for this relationship. That is what an RNN accomplishes [62]. By storing it in memory, an RNN may use previous data. There are two entities in RNN neurons, the memory and the present data. The bursting of gradient descent is one of the RNN’s significant problems when enhancing memory by increasing the number of neurons [63]. LSTMs, or Long Short-Term Memory models, were eventually developed to overcome this limitation. RNNs have an issue with exploding and vanishing gradients, which LSTMs fix [64]. An exploding gradient is the opposite of vanishing gradients. A compounded final value will be enormous if an activation function whose gradient or derivative is greater than 1. It causes the algorithm to overfit by making the model very sensitive to minor changes in the data. It is expected for machine learning models to suffer from underfitting and overfitting issues.

4. Experiments and Results

The conducted experiments and the obtained results of word embeddings, data modelling, and evaluation metrics are discussed in this section. The first part explains different word embedding methods applied to different news headlines. The second part focuses on model-building strategies such as XGBoost, Naive Bayes, CNN, and LSTM that are applied to embedded news headlines or titles, as well as evaluating and analysing various modelling techniques for conclusions. In other words, the conclusions are based on the characteristics of the applied models.

4.1. VADER-Calculating Sentiment Scores

To create sentiment evaluations on news headlines or titles, the system used the natural language toolkit (import NLTK) and the VADER lexicon. These sentiment scores are composite values that can be positive if the news is positive or negative if the story is negative. It is calculated by adding up all of the scores in the dictionary and converting them to a −1 to +1 scale.

4.2. Bag-of-Words Model on News Headlines

Whenever an NLP method is used, it works with numbers. The text can not be fed into the algorithm directly. As a result, the BoW model preprocesses the text by converting it into fixed-length vectors while preserving the count of frequently used phrases. Vectorisation is the name for this technique. In order for the vectorisation to work successfully, the data had to be preprocessed, which included transforming the text to lower case, removing any non-word characters, and removing all punctuation. The vocabulary was then determined, and the number of times each word or phrase occurred was counted. Finally, the tokeniser supplied four characteristics to ask about the document learning after fitting.
  • Term counts: A list of terms and their total.
  • Term docs: The total number of documents utilised to fit the tokeniser as an integer.
  • Term index: A list of terms with their own unique integers
  • Document count: A glossary of words and how many times each occurred in the glossary.
A total of 26,485 distinct tokens are available for “News Headlines.” Once the tokeniser has been applied to the training data, it begins encoding documents in the train and test datasets.

4.3. TF-IDF Model on News Headlines

Despite the fact that the previous BoW model measured the number of words in a text, it had several flaws:
  • The term order does not appear to be represented.
  • A term’s uniqueness is not recognised.
The TF-IDF technique was used to overcome these flaws. In a document, TF-IDF determines the crucial words. The TF-IDF’s Term Frequency (TF) component quantifies the number of times words occur in a text. It is similar to the BoW model. The second component, the Inverse Document Frequency (IDF), assesses the importance of words. The word’s significance decreases when it occurs in more publications. First, CountVectorizer from Sklearn was imported and then created as an object in this process. Each phrase was divided into tokens using CountVectorizer, which used “fit_transform” to count how many times each token appeared in a sentence. It developed a set of the vectoriser’s vocabulary. The parameter determines whether the vectoriser builds the matrix entirely from input data or a different source.
The t-SNE visualisation was used to indicate the terms’ relationship. The t-SNE plot displayed the most related terms to Capitalism. Buoy, Capital, and Reform, as seen in Figure 10, are all quite near to Capitalism, demonstrating resemblance. Another t-SNE plot, meanwhile, displays the most relative terms to investment. As seen in Figure 11, Divestment and Placement are pretty near to Investment, demonstrating resemblance.

4.4. BoW to XGBoost

The target variable was defined after the sentiment scores and the sentiment classes of each news headline were created. The target variable forecasted the sentiments of the news headlines. The predictor variable influenced the value of the target variable in the same manner. After the data cleaning and preprocessing were performed, the news headlines were provided to the CountVectorizer method. Training and testing sections of the dataset were segregated. The data was split into two groups, with 80% going to training and 20% to testing. These sets are then combined into the BoW vector. The vectors are then fed into the XGBoost classifier to train this model. On tuning the number of trees and max tree depth in XGBoost, four distinct n estimators and max depth values were used, and the most satisfactory result was reached with n estimators = 100, max depth = 6.
The efficiency of the classification model was accessed using the classification report, which is a collection of different evaluation metrics rather than a single one as presented in Table 6. The precision for negative sentiments is 0.85, a little less than 1, which indicates that 85% are correct precision and 15% of sentiments are incorrectly identified as negative, and for positive sentiments, correct preciseness is 73%. On the other hand, the recall for negative sentiments is 67%. It means that it has identified 67% as accurate recall and 33% as incorrect recall, and for positive emotions, it is 89%. Although the accuracy is 78%, we have also considered F1-Score and harmonic mean, which punishes too many false negatives for finding the most optimal model.

4.5. BoW to Naive Bayes

Naive Bayes is the next method used for classification. Bernoulli Naive Bayes, Multinomial Naive Bayes, and Gaussian Naive Bayes are the three types of Naive Bayes classifiers. Because news headlines include a wide range of positive and negative opinions, the Bernoulli Naive Bayes classifier is utilised in this study. When using a classifier based on the Bernoulli Naive Bayes algorithm, features are assumed to be binary, meaning that 0 represents negative emotions and 1 represents positive ones.
Table 7 shows the classification report for BoW to Naive Bayes. The precision for negative emotions is 83%, whereas its sensitivity is 74% since they are inversely related. This algorithm’s F1-score is quite close to the F1-score of the BoW with the XGBoost model.Overall accuracy is 79%, and this model is slightly better than the BoW with the XGBoost model.

4.6. TF-IDF to XGBoost and Naive Bayes

As described above, the BoW model has various flaws, and to solve these inadequacies, TF-IDF is employed for word embedding. Therefore, after the TF-IDF vectors are transformed, they are fed into the XGBoost classifier. Table 8 summarises the outcomes of its execution.
The best results were gained with n estimators = 200, max depth = 6. This model is not the best model when analysing and comparing the F1-score and accuracy with the previous techniques. The precision for negative sentiments is 85%, which indicates that 85% of the classified negative sentiments were correct, and 72% for correctly classified positive emotions, while the recall for both of the attitudes is 0.65 and 0.89; however, it is still not a good model to be well-thought-out.
For Naive Bayes, the same system was implemented, and the Bernoulli Naive Bayes classifier was utilised. The Bernoulli model’s absolute accuracy is 79%. The results are given in Table 9.
It depicts this classification algorithm’s precision, recall, F1-score, and accuracy. Overall, it is a good model as both F1-scores and accuracy are better than the previous methodologies.

4.7. BoW to LSTM

In this methodology, there are 6612 unique tokens. A maximum of 10,000 words may be utilised. Pad sequences truncate words that exceed the 50-word limit.
In Figure 12, the model has 97% accuracy on the training set and 75% accuracy on the validation set, indicating meaningful differences, and one can expect the model to perform with 75% accuracy on the new data.

4.8. TF-IDF to LSTM

In this case, the model has a validation accuracy of around 92%.
As shown in Table 10, for negative, the precision is 82%, and for positive, it is 85%. For negative, recall is 83%, and for positive, it is 84%. The negative F1-score is 83%, while the positive F1-score is 84%. The overall accuracy is 84%.

4.9. BoW and TF-IDF to CNN

Although the arrangement of words or phrases will bias the results, textual information may be obtained using an LSTM, which is a type of RNN. The sentiment analysis based on CNNs can extract essential text elements. Each input neuron is coupled to each output neuron in a traditional feedforward neural network, which is known as a fully connected layer. Convolutions across the input are used to determine the output. The accuracy of a CNN applied to both BoW and TF-IDF is almost identical, as shown in Table 11.

4.10. BERT and RoBERTa

The transformer encoder architecture underpins BERT. BERT and RoBERTa [4] use a transformer, an attention mechanism that discovers contextual semantic relationships between words or sub-words in a document.
Transformers tend to outperform LSTMs:
  • They can process many words simultaneously, resulting in reduced computation and promoting parallel processing, making them GPU (Graphical Processing Unit) friendly.
  • They have a greater understanding of the text’s context.
A transformer has two distinct mechanisms:
  • An encoder that reads the phrase given as input.
  • A decoder that estimates the results.
The transformer encoder, unlike directional models, reads the complete sequence of words at once instead of sequentially reading from left-to-right or right-to-left. Even though it is called bidirectional, a more precise description would be non-directional, enabling the BERT model to discover the lexical context in all of its surroundings.
TensorFlow and models for accessing BERT were installed to process the textual information. Because of the restricted computational resources, we opted for the model with the fewest number of parameters for analysis. The selection of the preprocessing model was based on the BERT and RoBERTa model, so we auto-selected the right processing model. This processing technique classifies the text into three elements—input mask, input type ids, and input word ids. After applying BERT and RoBERTa, their outputs were fed into the neural network, and their output probabilities were computed. BERT and RoBERTa did their task of word embedding, and a neural network handled the remainder of the activity.
Figure 13 and Figure 14 illustrate the training and validation accuracy and loss for BERT to neural network. Our model does not appear to be overfitting. Similar results appeared for RoBERTa but with some differences. Training and validation accuracy and loss emerge to be converging nicely, as depicted in Figure 15 and Figure 16, respectively.
Table 12 explains the precision, recall, F1-Score, and accuracy of the BERT model. The precision for class 0 is 87%, while for class 1, it is 92%. The recall for classes 0 and 1 is 91% and 89%, respectively, whereas the F1-score is also somewhat similar, but they are opposite in numbers in relation to recall. Finally, accuracy is 90%.
On the other hand, the evaluation metrics for the RoBERTa model are presented in Table 13. The accuracy is 88%, F1-score for classes 0 and 1 is 87% and 89%, while recall is 89% and 87% for both classes, respectively. Finally, precision for classes 0 and 1 is 85% and 91%, respectively. Furthermore, Figure 17 and Figure 18 depict the precision and recall curve for BERT and RoBERTa. Finally, Table 14 and Table 15 give details about the parameter settings and AUC scores for both BERT and RoBERTa. The pre-trained model for BERT is bert-base-uncased while for RoBERTa is roberta-base. All other parameters such as learning rate, number of epochs, and loss function are the same. As far as AUC scores are concerned, BERT has an AUC score of 92.6%, and RoBERTa has a score of 93.7%.

4.11. Consolidated Results

This part summarises the data from the previous section and compares and contrasts the performance of various models, as summarised in Table 16.
First, the BoW model was constructed using XGBoost and Naive Bayes machine learning methods. Surprisingly, with just a tiny difference, they both performed well. Table 16 shows that BoW with Naive Bayes outperformed BoW with XGBoost, with an accuracy of 79%. Second, the same machine learning models are considered for the TF-IDF model. Surprisingly, the TF-IDF model produced similar results compared to BoW with XGBoost and Naive Bayes. Therefore, BoW with Naive Bayes achieved the best performance out of the four models.
Implementing a neural network is a difficult task. However, Table 17 clearly shows that we have implemented six different models to see how efficient they are when compared to traditional machine learning and word embedding models. TF-IDF with LSTM outperformed the other neural networks and the machine learning models with an accuracy of 84 % ; however, BERT and RoBERTa stood at 90% and 88%, respectively, and outstripped all the machine learning and deep learning models.

4.12. Comparison with State-of-the-Art Methods

As can be seen from Table 18, with an accuracy of 90% and 88%, BERT and RoBERTa surpassed other machine learning and deep learning models. The comparison is also extended to methods presented in previous research papers through implementing their machine learning models using word embedding features of BoW and TF-IDF. The proposed approaches differ from the state-of-the-art methodologies in various evaluation metrics and allow for comparison.
First, we looked at study [16] and observed that the BoW embedding approach was utilised to improve prediction, along with economic indicators, readability, and polarity. After considering the relationship or connection-based Bag-of-Words, the prediction quality was significantly improved. In addition, the neural network outperformed the machine learning techniques examined in [16]. Similarly, we compared the best strategy from [16] to our superior neural network technique. After applying the preprocessing and BoW embedding to the news headlines dataset, we applied CNN to the BoW model. BoW with CNN attained an accuracy score of 80.86%, higher than Naive Bayes of [16], which attained an accuracy score of 79.88%.
Second, we used Naive Bayes to analyse our dataset. The Naive Bayes algorithm utilised in [16] was not specified. Therefore, we put GaussianNB() and MultinomialNB() to the test and compared them to our CNN; we picked the best and compared to CNN. Third, we used LSTM to train the TF-IDF, which achieved an accuracy of 84%, outperforming the random forest model of [6], whose accuracy was just 67.93% Likewise, we used two novel approaches, BERT and RoBERTa. The expectations were quite high from these two models, and they delivered optimally. Both the algorithms obtained an accuracy of 90% and 88%. Overall, all the techniques performed better than the state-of-the-art methods, but BERT and RoBERTa outstripped each and every technique and proved worthwhile.

5. Conclusions

In this work, we studied sentiment analysis of news headlines as an important factor that investors consider when making investing decisions. We claimed that the sentiment analysis of financial news headlines impacts stock market values. The proposed methodology and analysis conducted in this study helped in supporting the goals. More research, however, is required. In both intellectual and business contexts, the following lines describe the important advice.
  • Word embedding methods, such as BoW and TF-IDF, were used in this study. Despite the fact that BoW and TF-IDF both count the number of terms in a text, they both have significant flaws. The word uniqueness and order of a term are not taken into account, and they are unable to represent the meaning and dimensions of the writing. Word2Vec (skip-gram) should be employed to solve these flaws in future studies. Word2Vec is beneficial since it analyses every word in the corpus and generates a vector. Other word embedding technologies, such as Skip-Gram and GloVe, may provide further insights when combined with machine and deep learning methods.
  • Word embedding algorithms have been analysed using XGBoost, Naive Bayes, LSTM, and CNN, and compared with the techniques used in other research papers. The best approaches were BoW + CNN (80.86%), TF-IDF + CNN (80.53%), TF-IDF + LSTM (84%), BERT (90%), and RoBERTa (88%), as these surpassed state-of-the-art methods and the machine learning algorithms used in this research. In future studies, Word2Vec, GloVe, and Skip-Gram should be used in conjunction with these machine and deep learning approaches to improve the current state-of-the-art. Compared to BoW and TF-IDF, these approaches offer a number of benefits. Word2Vec preserves the semantic meaning of distinct words in a text. The context information is maintained, and the embedding vector is quite tiny. GloVe, unlike Word2Vec, does not depend just on local statistics (contextual meaning of words) to generate word vectors but also integrates wide statistics (word co-occurrence). Skip-Gram, on the other hand, operates on any raw text. It also takes less memory than other word-to-vector representations.
  • In this work, BERT and RoBERTa, were used because they outperform older techniques in terms of model performance, capacity to handle bigger volumes of text and language, and ability to fine-tune the data to the unique linguistic context. Their accuracies were 90% and 88%, respectively, which is better than a few machine learning models and other deep learning models, such as LSTM and CNN, used in this study.
  • Reinforcement learning has been extensively studied for its potential to forecast stock price changes accurately. A larger body of knowledge and more useful applications will result from studies to identify and compare reinforcement learning algorithms to other types of deep learning algorithms.

Author Contributions

Conceptualisation, S.K. and S.S.; Formal analysis, V.K. and H.A.; Funding acquisition, T.M.; Investigation, S.S., H.A. and H.S.H.; Methodology, S.K., S.S. and V.K.; Software, S.K. and S.S.; Visualisation, S.S. and H.A.; Writing—original draft, S.K., S.S. and H.A.; Writing—review and editing, V.K., H.A. and S.S. All authors have read and agreed to the published version of the manuscript.

Funding

The authors extend their appreciation to the Deanship of Scientific Research at King Khalid University for supporting this research through Large Groups Project under grant number (RGP.2/16/43).

Institutional Review Board Statement

Not applicable.

Informed Consent Statement

Not applicable.

Data Availability Statement

Not applicable.

Conflicts of Interest

The authors declare no conflict of interest.

References

  1. AP CorpComm on Twitter: “Advisory: @AP Twitter Account Has Been Hacked. Tweet About an Attack at the White House Is False. We Will Advise More as soon as Possible.”/Twitter. Available online: https://twitter.com/ap_corpcomm/status/326750712669282306 (accessed on 20 September 2021).
  2. Hutto, C.; Gilbert, E. VADER: A parsimonious rule-based model for sentiment analysis of social media text. In Proceedings of the Eighth International AAAI Conference on Weblogs and Social Media, Ann Arbor, MI, USA, 1–4 June 2014; pp. 216–225. [Google Scholar]
  3. Devlin, J.; Chang, M.W.; Lee, K.; Toutanova, K. BERT: Pre-training of deep bidirectional transformers for language understanding. arXiv 2018, arXiv:1810.04805. [Google Scholar]
  4. Liu, Y.; Ott, M.; Goyal, N.; Du, J.; Joshi, M.; Chen, D.; Levy, O.; Lewis, M.; Zettlemoyer, L.; Stoyanov, V. RoBERTa: A Robustly Optimized BERT Pretraining Approach. arXiv 2019, arXiv:1907.11692. [Google Scholar]
  5. Pagolu, V.S.; Reddy, K.N.; Panda, G.; Majhi, B. Sentiment analysis of Twitter data for predicting stock market movements. In Proceedings of the International Conference on Signal Processing, Communication, Power and Embedded System (SCOPES), Paralakhemundi, India, 3–5 October 2016; pp. 1345–1350. [Google Scholar]
  6. Medeiros, M.C.; Borges, V.R. Tweet Sentiment Analysis Regarding the Brazilian Stock Market. In Proceedings of the Anais do VIII Brazilian Workshop on Social Network Analysis and Mining, Belem, PA, Brazil, 17–18 July 2019; pp. 71–82. [Google Scholar]
  7. Índice Bovespa—Wikipedia. Available online: https://en.wikipedia.org/wiki/%C3%8Dndice_Bovespa (accessed on 5 April 2022).
  8. Imbir, K.K. Psychoevolutionary Theory of Emotion (Plutchik). In Encyclopedia of Personality and Individual Differences; Springer International Publishing: Berlin/Heidelberg, Germany, 2017; pp. 1–9. [Google Scholar]
  9. Van der Maaten, L.; Hinton, G. Visualizing data using t-SNE. J. Mach. Learn. Res. 2008, 9, 2579–2605. [Google Scholar]
  10. Mansoor, M.; Gurumurthy, K.; Anantharam, R.U.; Prasad, V.R.B. Global Sentiment Analysis Of COVID-19 Tweets Over Time. arXiv 2020, arXiv:2010.14234. [Google Scholar]
  11. Biswas, S.; Sarkar, I.; Das, P.; Bose, R.; Roy, S. Examining the effects of pandemics on stock market trends through sentiment analysis. J. Xidian Univ. 2020, 14, 1163–1176. [Google Scholar]
  12. Vosen, S.; Schmidt, T. Forecasting private consumption: Survey-based indicators vs. Google trends. J. Forecast. 2011, 30, 565–578. [Google Scholar] [CrossRef] [Green Version]
  13. Choi, H.; Varian, H. Predicting the Present with Google Trends. Econ. Rec. 2012, 88, 2–9. [Google Scholar] [CrossRef]
  14. Atkins, A.; Niranjan, M.; Gerding, E. Financial news predicts stock market volatility better than close price. J. Financ. Data Sci. 2018, 4, 120–137. [Google Scholar] [CrossRef]
  15. Mingzheng, L.; Lei, C.; Jing, Z.; Qiang, L. A Chinese Stock Reviews Sentiment Analysis Based on BERT Model. Res. Sq. 2020; in preprint. [Google Scholar] [CrossRef]
  16. Hájek, P. Combining bag-of-words and sentiment features of annual reports to predict abnormal stock returns. Neural Comput. Appl. 2018, 29, 343–358. [Google Scholar] [CrossRef] [Green Version]
  17. Hart, R.P. Redeveloping DICTION: Theoretical considerations. Prog. Commun. Sci. 2001, 16, 43–60. [Google Scholar]
  18. Loughran, T.; McDonald, B. When is a liability not a liability? Textual analysis, dictionaries, and 10-Ks. J. Financ. 2011, 66, 35–65. [Google Scholar] [CrossRef]
  19. Venkata, R.S.; Sree, M.R.D.; Gandi, R.; Reddy, A.S. Comparative analysis of Stock Market Prediction Algorithms based on Twitter Data. Int. J. Comput. Appl. 2021, 174, 22–26. [Google Scholar]
  20. Jampala, R.C.; Goda, P.K.; Dokku, S.R. Predictive analytics in stock markets with special reference to BSE sensex. Int. J. Innov. Technol. Explor. Eng. 2019, 8, 615–619. [Google Scholar] [CrossRef]
  21. Li, Y.; Pan, Y. A novel ensemble deep learning model for stock prediction based on stock prices and news. Int. J. Data Sci. Anal. 2022, 13, 139–149. [Google Scholar] [CrossRef] [PubMed]
  22. Vargas, M.R.; De Lima, B.S.; Evsukoff, A.G. Deep learning for stock market prediction from financial news articles. In Proceedings of the IEEE International Conference on Computational Intelligence and Virtual Environments for Measurement Systems and Applications, Annecy, France, 26–28 June 2017; pp. 60–65. [Google Scholar] [CrossRef]
  23. Ding, X.; Zhang, Y.; Liu, T.; Duan, J. Deep learning for event-driven stock prediction. In Proceedings of the Twenty-Fourth International Joint Conference on Artificial Intelligence, Buenos Aires, Argentina, 25–31 July 2015; pp. 2327–2333. [Google Scholar]
  24. Vargas, M.R.; dos Anjos, C.E.; Bichara, G.L.; Evsukoff, A.G. Deep leaming for stock market prediction using technical indicators and financial news articles. In Proceedings of the International Joint Conference on Neural Networks, Rio de Janeiro, Brazil, 8–13 July 2018; pp. 1–8. [Google Scholar] [CrossRef]
  25. Dang, M.; Duong, D. Improvement methods for stock market prediction using financial news articles. In Proceedings of the 3rd National Foundation for Science and Technology Development Conference on Information and Computer Science (NICS), Danang City, Vietnam, 14–16 September 2016; pp. 125–129. [Google Scholar]
  26. Guo, T. ESG2Risk: A Deep Learning Framework from ESG News to Stock Volatility Prediction. arXiv 2020, arXiv:2005.02527. [Google Scholar] [CrossRef]
  27. Nann, S.; Krauss, J.; Schoder, D. Predictive analytics on public data-the case of stock markets. In Proceedings of the 21st European Conference on Information Systems (ECIS) Collections, Utrecht, The Netherlands, 6–8 June 2013. [Google Scholar]
  28. Automatic Document Classification: What It Is. Available online: https://expertsystem.com/what-is-automatic-document-classification (accessed on 24 April 2021).
  29. Arras, L.; Horn, F.; Montavon, G.; Müller, K.R.; Samek, W. “What is relevant in a text document?”: An interpretable machine learning approach. PLoS ONE 2017, 12, 1–19. [Google Scholar] [CrossRef] [PubMed]
  30. Gidófalvi, G. Using News Articles to Predict Stock Price Movements; Technical Report; University of California: San Diego, CA, USA, 2001. [Google Scholar]
  31. Shynkevich, Y.; McGinnity, T.M.; Coleman, S.; Belatreche, A. Stock price prediction based on stock-specific and sub-industry-specific news articles. In Proceedings of the International Joint Conference on Neural Networks, Killarney, Ireland, 12–17 July 2015; pp. 1–8. [Google Scholar]
  32. Akita, R.; Yoshihara, A.; Matsubara, T.; Uehara, K. Deep learning for stock prediction using numerical and textual information. In Proceedings of the IEEE/ACIS 15th International Conference on Computer and Information Science, Okayama, Japan, 26–29 June 2016; pp. 1–6. [Google Scholar] [CrossRef]
  33. Le, Q.; Mikolov, T. Distributed representations of sentences and documents. In Proceedings of the International Conference on Machine Learning, ICML, Beijing, China, 21–26 June 2014; pp. 1188–1196. [Google Scholar]
  34. Kalyani, J.; Bharathi, P.H.N.; Jyothi, P.R. Stock trend prediction using news sentiment analysis. Int. J. Comput. Sci. Inf. Technol. 2016, 8, 67–76. [Google Scholar]
  35. Samuels, A.; Mcgonical, J. Sentiment Analysis on Customer Responses. arXiv 2020, arXiv:2007.02237. [Google Scholar]
  36. Rajput, N.K.; Grover, B.A.; Rathi, V.K. Word frequency and sentiment analysis of twitter messages during coronavirus pandemic. arXiv 2020, arXiv:2004.03925. [Google Scholar]
  37. Sahu, K.; Bai, Y.; Choi, Y. Supervised Sentiment Analysis of Twitter Handle of President Trump with Data Visualization Technique. In Proceedings of the 10th Annual Computing and Communication Workshop and Conference, Las Vegas, NV, USA, 6–8 January 2020; pp. 640–646. [Google Scholar]
  38. Sahu, T.P.; Ahuja, S. Sentiment analysis of movie reviews: A study on feature selection & classification algorithms. In Proceedings of the International Conference on Microelectronics, Computing and Communications (MicroCom), Durgapur, India, 23–25 January 2016; pp. 1–6. [Google Scholar]
  39. Munikar, M.; Shakya, S.; Shrestha, A. Fine-grained Sentiment Classification using BERT. In Proceedings of the 2019 Artificial Intelligence for Transforming Business and Society (AITB), Kathmandu, Nepal, 5 November 2019; pp. 1–5. [Google Scholar] [CrossRef] [Green Version]
  40. Karimi, A.; Rossi, L.; Prati, A. Adversarial training for aspect-based sentiment analysis with bert. In Proceedings of the 25th International Conference on Pattern Recognition, Milan, Italy, 10–15 January 2021; pp. 8797–8803. [Google Scholar]
  41. Liu, H. Leveraging financial news for stock trend prediction with attention-based recurrent neural network. arXiv 2018, arXiv:1811.06173. [Google Scholar]
  42. Fauzi, M.A. Word2Vec model for sentiment analysis of product reviews in Indonesian language. Int. J. Electr. Comput. Eng. 2019, 9, 525. [Google Scholar] [CrossRef]
  43. Aamir, S.; Qurat-ul ain, M. Story beneath story: Do magazine articles reveal forthcoming returns on stock market? Afr. J. Bus. Manag. 2017, 11, 564–581. [Google Scholar] [CrossRef]
  44. Kollintza-Kyriakoulia, F.; Maragoudakis, M.; Krithara, A. Measuring the impact of financial news and social media on stock market modeling using time series mining techniques. Algorithms 2018, 11, 181. [Google Scholar] [CrossRef] [Green Version]
  45. Ding, X.; Zhang, Y.; Liu, T.; Duan, J. Knowledge-driven event embedding for stock prediction. In Proceedings of the 26th International Conference on Computational Linguistics, Osaka, Japan, 11–16 December 2016; pp. 2133–2142. [Google Scholar]
  46. Business News, Finance News, India News, BSE/NSE News, Stock Markets News, Sensex NIFTY, Latest Breaking News Headlines. Available online: https://www.business-standard.com (accessed on 6 July 2021).
  47. Find Open Datasets and Machine Learning Projects|Kaggle. Available online: https://www.kaggle.com/datasets (accessed on 15 April 2021).
  48. Economic News Article Tone—Dataset by Crowdflower|data.world. Available online: https://data.world/crowdflower/economic-news-article-tone (accessed on 12 June 2021).
  49. Yahoo Finance—Stock Market Live, Quotes, Business & Finance News. Available online: https://in.finance.yahoo.com (accessed on 24 March 2021).
  50. NSE—National Stock Exchange of India Ltd. Available online: https://www1.nseindia.com (accessed on 21 April 2021).
  51. List of Companies in the S & P 500 (Standard and Poor’s 500). Available online: https://github.com/datasets/s-and-p-500-companies-financials/tree/master/data (accessed on 7 June 2021).
  52. GoogleNews-vectors-negative300.bin.gz—Google Drive. Available online: https://drive.google.com/file/d/0B7XkCwpI5KDYNlNUTTlSS21pQmM/edit (accessed on 23 May 2022).
  53. Homepage—QuantPedia. Available online: https://quantpedia.com (accessed on 12 July 2021).
  54. Canova, S.; Cortinovis, D.L.; Ambrogi, F. How to describe univariate data. J. Thorac. Dis. 2017, 9, 1741. [Google Scholar] [CrossRef] [Green Version]
  55. FAANG Stocks Definition. Available online: https://www.investopedia.com/terms/f/faang-stocks.asp (accessed on 15 March 2022).
  56. Now that Tesla Has Joined the S&P 500, Know These 3 Things Before Investing—MarketWatch. Available online: https://www.marketwatch.com/story/tesla-is-getting-listed-on-the-sp-500-here-are-3-takeaways-for-retail-investors-2020-11-17 (accessed on 8 June 2021).
  57. Sandilands, D.D. Bivariate Analysis; Springer: Dordrecht, The Netherlands, 2014; pp. 416–418. [Google Scholar] [CrossRef]
  58. Standing Out From the Cloud: How to Shape and Format a Word Cloud|by Andrew Jamieson|Towards Data Science. Available online: https://towardsdatascience.com/standing-out-from-the-cloud-how-to-shape-and-format-a-word-cloud-bf54beab3389 (accessed on 25 July 2021).
  59. Kasthuriarachchy, B.H.; De Zoysa, K.; Premaratne, H. Enhanced bag-of-words model for phrase-level sentiment analysis. In Proceedings of the 14th International Conference on Advances in ICT for Emerging Regions, Colombo, Sri Lanka, 20–13 December 2014; pp. 210–214. [Google Scholar]
  60. Qaiser, S.; Ali, R. Text Mining: Use of TF-IDF to Examine the Relevance of Words to Documents. Int. J. Comput. Appl. 2018, 181, 25–29. [Google Scholar] [CrossRef]
  61. Hewamalage, H.; Bergmeir, C.; Bandara, K. Recurrent neural networks for time series forecasting: Current status and future directions. Int. J. Forecast. 2021, 37, 388–427. [Google Scholar] [CrossRef]
  62. Pawar, K.; Jalem, R.S.; Tiwari, V. Stock Market Price Prediction Using LSTM RNN. Adv. Intell. Syst. Comput. 2019, 841, 493–503. [Google Scholar]
  63. Pascanu, R.; Mikolov, T.; Bengio, Y. On the difficulty of training recurrent neural networks. In Proceedings of the International Conference on Machine Learning, Washington, DC, USA, 4–6 December 2013; pp. 1310–1318. [Google Scholar]
  64. Hu, Y.; Huber, A.; Anumula, J.; Liu, S.C. Overcoming the vanishing gradient problem in plain recurrent networks. arXiv 2018, arXiv:1801.06105. [Google Scholar]
Figure 1. An overview of the workflow of the proposed framework.
Mathematics 10 02001 g001
Figure 2. Tech companies with billion-dollar capitalisation.
Mathematics 10 02001 g002
Figure 3. Tech companies with trillion-dollar capitalisation.
Mathematics 10 02001 g003
Figure 4. Indian Banking companies with their market capitalisation.
Mathematics 10 02001 g004
Figure 5. Facebook news sentiments.
Mathematics 10 02001 g005
Figure 6. Facebook stock Buy and Sell decisions.
Mathematics 10 02001 g006
Figure 7. IndusInd news sentiments.
Mathematics 10 02001 g007
Figure 8. IndusInd stock Buy and Sell decisions.
Mathematics 10 02001 g008
Figure 9. WordCloud for news headlines.
Mathematics 10 02001 g009
Figure 10. The t-SNE plot for the word capitalism.
Mathematics 10 02001 g010
Figure 11. The t-SNE plot for word investment.
Mathematics 10 02001 g011
Figure 12. Training and validation accuracy for BoW to LSTM.
Mathematics 10 02001 g012
Figure 13. Training and validation accuracy for BERT.
Mathematics 10 02001 g013
Figure 14. Training and validation loss for BERT.
Mathematics 10 02001 g014
Figure 15. Training and validation accuracy for RoBERTa.
Mathematics 10 02001 g015
Figure 16. Training and validation loss for RoBERTa.
Mathematics 10 02001 g016
Figure 17. Precision and Recall curve for BERT.
Mathematics 10 02001 g017
Figure 18. Precision and Recall Curve for RoBERTa.
Mathematics 10 02001 g018
Table 1. Different text representation methods considered in various publications.
N-GramWord2VecTF-IDFTextBlobBoWBERTSkip-GramPOSReferences
[35]
[36]
[37]
[38]
[39]
[40]
[5]
[6]
[11]
[14]
[22]
[24]
[25]
[31]
[32]
[34]
[41]
[15]
[42]
[16]
[27]
Table 2. Different machine learning techniques used in the literature.
Random ForestSVMNaive BayesLSTMLDACNNDecision TreeKNNGRURegressionReferences
[5]
[6]
[11]
[14]
[21]
[22]
[24]
[25]
[31]
[32]
[34]
[41]
[15]
[42]
[16]
[27]
[43]
[44]
[19]
Table 3. The datasets utilised in different research work.
Data SourceDataset DetailsReferences
Twitter API Yahoo Finance
-
Period: 31 August 2015 to 25 August 2016. A total of 250,000 tweets on Microsoft.
-
The opening and closing prices of stock of $MSFT were extracted for the same period from Yahoo Finance.
[5]
Public Domain
-
The dataset is comprised of 4516 Portuguese tweets with respect to the main index of the BOVESPA.
[6]
Reddit Yahoo Finance
-
Reddit was used for collecting data on social news and conversations
-
Yahoo Finance was used to collect financial data.
[11]
Bannot Gang Yahoo Finance Reuters
-
min-by-min intraday data downloaded from the quant trading website “The Bannot Gang.”
-
Imputation from Yahoo finance database was used to complete the missing daily data.
-
Textual data were extracted from Reuters US.
[14]
CNBC Reuters WSJ Fortune
-
The news data was captured from the mentioned websites.
[21]
Reuters Yahoo Finance
-
A total of 106,494 news articles were gathered from Reuters website.
-
S and P 500 index was selected from Yahoo finance.
[22]
Reuters Yahoo Finance Google.com Archive Word2Vec
-
For the same period, Yahoo Finance provided stock price information for Chevron Corporation.
-
Google News data (about 100 billion words)
[24]
LexisNexis database Business Wire PR Newswire McClatchy.
-
Tribune Business News Yahoo Finance
-
Data gathered from 1 September 2009 to 1 September 2014.
-
LexisNexis Database was used for obtaining a total of 8264 financial news articles.
-
Business Wire, PR Newswire, and McClatchy.
-
TBN were chosen as news stories sources as they have sufficient press coverage of the stocks that make up the S & P 500 market index.
-
Historical pricing data were obtained from Yahoo Finance.
[25]
Nikkei Newspaper Nikkei 225
-
Nikkei newspaper of morning edition between 2001 and 2008—10 companies were chosen from Nikkei 225.
-
Companies frequently appearing in news between 2001 and 2008.
[31]
new.google.comreuters.com Yahoo Finance
-
Apple Inc. data collected from 1 February 2013 to 2 April 2016.
-
Apple Inc. news headlines and AAPL daily stock prices for the same time period.
[32]
Bloomberg Reuters Yahoo Finance
-
News articles were acquired from Reuters and Bloomberg from October 2006 to November 2013.
-
Reuters provided data for 473 firms listed on the S and P 500.
-
Stock price information for Companies from Yahoo
[34]
Pak and Gulf Economist
-
Articles on finance and business from the magazine during the last 16 years.
[43]
KSE Twitter
-
Tweets taken from Twitter and the KSE 100 index.
[19]
Table 4. Datasets used in this research work.
Dataset DetailsReferences
Full Economic News articles taken from WSJ (Wall Street Journal) and WAPO (The Washington Post)[46]
The Kaggle dataset included news from the Business-Standard website as well as S and P 500 corporations (2013–2018).[47]
Financial news article tone. This dataset judges tone on a scale of 1 to 9.[48]
Nifty 100 companies (2000–2020); S and P 500 companies (2000–2020).[49]
The Nifty 100 companies information, including symbol, company name, industry.[50]
The S and P 500 companies information, including symbol, name, and the sector.[51]
Table 5. Attributes of global stock market indices.
AttributesDetails
DateDate—The price of a stock moving up or down.
OpenThe trading price of the stock
HighHighest price
LowLowest price
CloseClosing price
VolumeTotal shares traded
Adj. CloseAdjusted closing price
NameA ticker symbol, often known as a stock symbol
Table 6. Classification report for BoW with XGBoost.
ClassPrecisionRecallF-1 ScoreSupport
00.850.670.75482
10.730.890.80488
accuracy 0.78970
macro avg0.790.780.78970
weighted avg0.790.780.78970
Table 7. Classification report for BoW with Naive Bayes.
ClassPrecisionRecallF-1 ScoreSupport
00.830.740.78482
10.770.850.81488
accuracy 0.79970
macro avg0.800.790.79970
weighted avg0.800.790.79970
Table 8. Classification report for TF-IDF with XGBoost.
ClassPrecisionRecallF-1 ScoreSupport
00.850.650.74482
10.720.890.79488
accuracy 0.77970
macro avg0.780.770.77970
weighted avg0.780.770.77970
Table 9. Classification report for TF-IDF with Naive Bayes.
ClassPrecisionRecallF-1 ScoreSupport
00.840.710.77482
10.750.870.81488
accuracy 0.79970
macro avg0.800.790.79970
weighted avg0.800.790.79970
Table 10. Classification report for TF-IDF with LSTM.
ClassPrecisionRecallF-1 ScoreSupport
00.820.830.83482
10.850.840.84488
accuracy 0.84970
macro avg0.840.840.84970
weighted avg0.840.840.84970
Table 11. Comparison of CNN models on BoW and TF-IDF.
ModelsAccuracy
BoW + CNN80.86%
TF-IDF + CNN80.53%
Table 12. Classification report for BERT.
ClassPrecisionRecallF-1 ScoreSupport
00.870.910.89218
10.920.890.91267
accuracy 0.90485
macro avg0.900.900.90485
weighted avg0.900.900.90485
Table 13. Classification report for RoBERTa.
ClassPrecisionRecallF-1 ScoreSupport
00.850.890.87218
10.910.870.89267
accuracy 0.88485
macro avg0.880.880.88485
weighted avg0.880.880.88485
Table 14. Parameter Setting.
Proposed Technique/ParameterValue
BERT
Pre-trained Modelbert-base-uncased
Learning Rate2 × 10 5
Number of Epochs5
Loss FunctionCrossEntropyLoss
RoBERTa
Pre-trained Modelroberta-base
Learning Rate2 × 10 5
Number of Epochs5
Loss FunctionCrossEntropyLoss
Table 15. BERT and RoBERTa AUC scores.
Proposed TechniqueAUC Score
BERT92.6%
RoBERTa93.7%
Table 16. Comparison among machine learning models.
Machine Learning ModelsAccuracy
BoW + XGBoost77.9%
BoW + Naive Bayes79%
TF-IDF + XGBoost76.90%
TF-IDF + Naive Bayes78.82%
Table 17. Comparison among deep learning models.
Deep Learning ModelsAccuracy
BoW + LSTM75%
TF-IDF + LSTM84%
BoW + CNN80.86%
TF-IDF + CNN80.53%
BERT90%
RoBERTa88%
Table 18. Comparison with state-of-the-art methods.
StudyFeaturesMethodAccuracy
Hájek [16]BoWNaive Bayes79.88%
Proposed Approach 1BoWCNN80.86%
Medeiros et al. [6]TF-IDFRF67.93%
Proposed Approach 2TF-IDFLSTM84%
Proposed Approach 3-BERT90%
Proposed Approach 4-RoBERTa88%
Publisher’s Note: MDPI stays neutral with regard to jurisdictional claims in published maps and institutional affiliations.

