Article

Effective Optimisation of the Patient Circuits of an Oncology Day Hospital: Mathematical Programming Models and Case Study

by
Adrián González-Maestro
1,†,
Elena Brozos-Vázquez
2,†,
Balbina Casas-Méndez
3,†,
Rafael López-López
1,4,†,
Rosa López-Rodríguez
2,† and
Francisco Reyes-Santias
1,5,*,†
1
Health Research Institute of Santiago de Compostela (IDIS), Complexo Hospitalario Universitario of Santiago de Compostela (SERGAS), 15706 Santiago de Compostela, Spain
2
Department of Medical Oncology, Hospital Clínico Universitario of Santiago de Compostela, 15706 Santiago de Compostela, Spain
3
Department of Statistics, Mathematical Analysis and Optimization, Universidade of Santiago de Compostela, 15782 Santiago de Compostela, Spain
4
Translational Medical Oncology Group (ONCOMET), 15706 Santiago de Compostela, Spain
5
Department of Business, Universidade of Vigo, 36310 Vigo, Spain
*
Author to whom correspondence should be addressed.
These authors contributed equally to this work.
Mathematics 2022, 10(1), 62; https://doi.org/10.3390/math10010062
Submission received: 20 November 2021 / Revised: 17 December 2021 / Accepted: 21 December 2021 / Published: 25 December 2021
(This article belongs to the Special Issue Mathematical Prediction Models Applied to Health Management)

Abstract

:
In this paper, we first use the information we have on the patients of an oncology day hospital to distribute the treatment schedules they have in each of the visits to this centre. To do this, we propose a deterministic mathematical programming model in such a way that we minimise the duration of the waiting room stays of the total set of patients and taking into account the restrictions of the circuit. Secondly, we will look for a solution to the same problem under a stochastic approach. This model will explicitly consider the existing uncertainty in terms of the different times involved in the circuit, and this model also allows the reorganisation of the schedules of medical appointments with oncologists. The models are complemented by a tool that solves the problem of assigning nurses to patients. The work is motivated by the particular characteristics of a real hospital and the models are used and compared with data from this case.

1. Introduction

Nowadays, a large proportion of diagnosed cancer cases are treated without the need for hospitalisation of the patient, which in general proves to be a great help in favour of the patient’s well-being and a better quality of life.
Normally, oncological therapies are performed in day centres where the patient goes to carry out the different requirements of his or her treatment and then returns home, where the therapy recovery takes place. On the other hand, during the last decades, the number of cases of cancer patients increased significantly (an enlargement that we are still experiencing today) mainly due to improvement in the life expectancy of individuals. It is particularly older people who are more prone to these diseases.
Greater demand means greater difficulty in maintaining the quality of services offered to patients. Specifically, we are referring to the capacity to maintain stable waiting times for patients during their stay in these centres. It should be noted that these types of centres have quite complex protocols of action that can be prone to generate significant waiting times for patients. It should be borne in mind that these are high-demand services combined with an organisation that sometimes has room for improvement. All this means that the planning of clinical centres to treat cancer patients is an important task of concern for the various professionals involved in hospitals and clinics at regional, national and international level. It should be noted that the existing treatments for this disease are quite expensive, and therefore, are faced with the obvious (but sometimes infeasible) solution of investing more money in these centres. However, the question arises as to whether it is possible to improve the organisation of the different procedures carried out in these units, without necessarily increasing the resources available. The entire process designed for the care and treatment of oncology patients comprises various stages to be covered by the patient on the day he/she comes to the hospital. It involves the collaboration of many professionals from the team, specialised in very different tasks (nurses, doctors, pharmacists, etc.), and the use of certain limited resources, both material (appointment rooms, special chairs for treatments, etc.) and human. Therefore, the existence of an efficient action protocol between all these agents is a key ingredient in minimising patient waiting time, the creation of the different appointments and the planning of nursing staff and other professionals involved (see [1]).

2. Motivation: The Problem of the ODH in Santiago de Compostela (Spain)

At the Oncology Day Hospital (ODH) in Santiago de Compostela (a city in northwestern Spain), cancer patients are treated on a daily outpatient basis by providing two types of medical services, namely consultations with doctors and chemotherapy treatments. These actions are strongly related, the consultation, i.e., the medical act, being a necessary antecedent to be able to carry out the treatments later on, albeit during the same day. The hospital’s current approach is to give patients an estimated appointment time, leaving the start of the treatment as an undetermined time that will be made known to the patient only in the moments before the treatment takes place. This creates the problem that the patient must remain in the hospital waiting room between the two medical services, which often causes, at the very least, uncertainty and, at times, discomfort for the patients.
Going into more detail, the ODH is a service of the Hospital Clínico Universitario of Santiago de Compostela (CHUS) where chemotherapy treatments are carried out on patients with different types of cancer. The health area of Santiago de Compostela (SCHA), see Figure 1, is large (450,000 inhabitants) and, for this reason, the ODH attends approximately 20,000 patients per year, which translates into 30,000 consultations with oncologists and 20,000 treatment sessions. Each patient, depending on the type of cancer they suffer from and the stage they are at, has a treatment adapted to their own characteristics, but they all have in common that they are carried out periodically. Specifically, treatments can be given in cycles of one session every one, two, three or six weeks. Therefore, the number of patients to be seen at the centre (as well as the type of cancer they suffer from) on a given day is information that is known in advance.
The circuit that a patient follows in this centre is as follows. First, they are registered on arrival at the centre and a blood test is performed. When the test results are ready, an oncologist certifies that they are correct and has a review with the patient. If everything related to the patient’s health status is in order, the pharmacy is ordered to prepare the patient’s chemotherapy substances. When the preparation is ready, the patient is transferred to one of the chemotherapy infusion chairs (if one is available). When the process is finished, the patient leaves the chair and leaves the centre.
In order to formalise an algorithm that processes the specific circumstances of a working day and determines appointment times, it is necessary to know two types of data: permanent data and data specific to the working day in question. Permanent data are data that remain unchanged over a period of time. Therefore, in this category we have deterministic data such as the number of chairs available, the number of nurses, pharmacists and oncologists available and the opening and closing hours of the centre. These data will generate capacity constraints that need to be taken into account.
The ODH has the following data: oncologist consultation hours from 8:00 h to 15:00 h, chemotherapy treatment hours from 8:00 h to 22:00 h, the duration of analyses is between 45 and 60 min, the duration of appointments with oncologists is 45 min for new patients and 15 min for old patients (on average), nine oncologists work every morning (three of each of the three specialties or types of cancer under consideration), five nurses work every morning and two every afternoon with one additional nurse for reinforcement at certain times, five wards with eight chemotherapy chairs (a total of 40 chairs) and three pharmacists prepare infusions every day. It is assumed that each nurse needs 15 min to start each treatment and, in addition, at any given time can be attentive to the performance of 16 treatments. The average time taken to prepare medicines for treatment is 70 min. We note that the number of physical and human resources is fixed but the times of the different stages show variability. The data specific to the working day in question are the number of patients to be seen and the type of cancer each of them suffers from (the duration of treatments can vary according to, especially, the type and stage of cancer), as well as how many of them are new patients and how many are not. The latter significantly affects the patient’s treatment time, as nurses need additional time to inform the new patient before starting chemotherapy.
In a preliminary investigation, refs. [2,3] analyzed the time ODH patients waited from the end of the appointment with the oncologist to the start of the administration of treatment. They concluded that the time these patients have to spend when they come to the hospital for intravenous chemotherapy means discomfort and a worsening of their quality of life, and it is therefore necessary to incorporate new measures to minimize lost time in an environment such as a hospital. The aim of this work is twofold. Firstly, by means of a deterministic model, to use the information we have on the patients of the oncology day hospital in Santiago de Compostela to distribute the different medical appointments they have in each of their visits to the centre in such a way as to minimise the duration of the waiting room stays for the total number of patients and taking into account the restrictions of the circuit. This is expected to improve the quality of life of patients and make the planning work of the service professionals more manageable. Secondly, we will look for a solution to the same problem under a stochastic approach. This model will explicitly take into account the existing uncertainty in the duration of the times affecting the process, to achieve better planning results, and will also allow the reorganisation of medical appointment schedules with oncologists. The models are complemented with a tool that solves the problem of assigning nurses to patients. The work is motivated by the particular characteristics of the ODH and the model results are used and compared with data from this real case.

3. Literature Review

Let us take a look at different aspects of current work.
Mathematical tools for decision support in health management. Ref. [4] provides a review of recent optimisation studies that present decision-support tools for the design and planning of outpatient appointment systems. In ref. [5], as an aid for healthcare managers with the COVID-19 patient prioritisation and scheduling problem, a tool was developed based on artificial intelligence, using the neural networks method, and operations research, using a mathematical fuzzy interval model. The results of this study indicated that the combination of both models provides an effective evaluation under conditions of scarce initial information to select a suitable list. The proposed approach achieves one goal: to minimise mortality rates under the constraints of available resources in each hospital. The main objective of [6] is the efficient and balanced use of equipment and resources in hospital operating theatres. In this context, data sets from one hospital were used through the methods of goal programming and constraint programming. The main objective of [7] is the design and application of a binary scheduling model to support the decision making process, especially with regard to manpower scheduling in organisations with stochastic demand. The results were applied to the personnel allocation process in the ambulance service station in Subotica (Serbia).
Optimizing the operation of oncology day centers or primary care clinics. There are several works addressing the tasks of optimising oncology day centres or primary care clinics appointment scheduling, with mathematical, artificial intelligence and simulation scheduling techniques being the most commonly used. Below we describe some of the works that address problems that are quite similar to the Santiago de Compostela ODH. In this work we focus on daily optimization of patient circuits, which could be extended to a weekly planning. Naturally, this task is integrated into a more general problem such as the schedule corresponding to the instant of initiation of treatment plans, which has been addressed by different authors, who have highlighted its relevance. Incidents such as a patient failing to keep appointments and the availability of resources clearly impact on the problem at hand. Ref. [8], in their work to quantify the association between cancer treatment delay and mortality, concludes that cancer treatment delay is a problem in healthcare systems worldwide. It is now possible to quantify the impact of delay on mortality in order to prioritise and model. Even a four-week delay in cancer treatment—surgical indications, systemic treatment and radiotherapy—is associated with increased mortality in seven types of cancer. Policies focused on minimising delays in cancer treatment initiation could improve population survival outcomes. Ref. [9], following a systematic review, concludes that a comprehensive strategic approach, including realignment of resources, operational efficiency and process improvement, holds the most promise for improving the efficiency and effectiveness of outpatient and ambulatory services, thereby reducing waiting times and improving health outcomes. These three broad areas identified are complementary and offer a comprehensive approach to policy improvement in these areas. In research by [10], they perform a baseline measurement of lung cancer patients’ waiting times for systemic therapy across the UK. The authors understand that the continued introduction of new therapies will have a significant effect on service demands and recommend that health service managers model the likely impact on resource needs, and suggest the use of the so-called C-PORT tool developed by the UK Department of Health. A study conducted by [11] at a single radiotherapy cancer treatment centre shows that the majority of outpatient consultations (80%) were seen within 20 min of their scheduled time. The reported delays were due to clinic workflow and the coordination of multiple appointments throughout the day. Findings from such studies, the authors believe, can help formulate strategies to improve efficiency and patient satisfaction. The problems identified by [12] in the course of an audit of patient waiting time and physician consultation time in a primary care clinic were addressed by the aforementioned paper which has formulated strategies to improve waiting and consultation time, including increasing staffing, implementing an algorithm for a staggered appointment system for patient follow-up and improving the queuing system for walk-in patients attending the clinic. The results shown in [13] provide some insights into waiting time, which is a barrier to healthcare delivery in mainland China. The authors show that adopting improvements in outpatient management software, following detailed analysis of patient data, patient surveys and patient interviews, can be an effective way to deal with long waiting time.
Applications of deterministic mathematical programming to the optimization of oncology patient circuits. Ref. [14] presents the situation of a clinical centre to which patients come to receive chemotherapy sessions with a certain periodicity, forming regular cycles of treatment sessions. Two objectives are pursued. On the one hand, to reduce as much as possible the delays in the patients’ cycles, given that excessive delays in the time between chemotherapy sessions greatly diminish their effectiveness. On the other hand, to reduce the hospital costs associated with the hours of work that are carried out. Ref. [15] addresses the problem of minimising patient waiting times during a working day in a centre offering oncology appointments and chemotherapy treatments in a context where it is already known how many and what type of patients need to be seen. Initially, a bi-objective optimisation problem is posed, trying to achieve a balanced workload throughout the working day both in terms of the use of the chemotherapy chairs and in terms of the consultations with the oncologists. Once the process has been completed, and a new method of appointment scheduling has been obtained, the simulation will be used to corroborate that the desired level of balanced workload can be achieved, as well as to compare it with the existing method and verify that the new method is more efficient. In [16], in the context of a centre to which patients come for chemotherapy, the problem of minimising delays in patient treatments and the total working time of the centre is addressed. Specifically, the aim is to find the optimal starting day of treatment for each patient so that their chemotherapy cycle is completed as soon as possible, as well as for the centre’s professionals to achieve this goal with as few working hours as possible. However, the problem is also posed by taking the number of resources as a decision variable to find out what would be the appropriate number of professionals and chairs to achieve optimal performance (if the hospital were in a position to devote a larger budget to increase such resources). The modelling in the paper by [17] studies a way to proceed when, for a given working day, patients in the centre are assigned appointments with their oncologist and chemotherapy treatments. Furthermore, it is assumed that the appointments with each patient’s oncologist are scheduled in advance, and the problem faced is to determine the schedules of each patient’s chemotherapy treatment sessions. Thus, this work is close to the problem at hand, although the constraints and the objective itself are not identical to those of ODH. However, it is noteworthy that the work has the great advantage that the proposed model can be solved exactly and very quickly, for the planning of a working day with a number of patients around 100, which is a good property inherited by the models introduced in our paper. In [18], treatments are scheduled for new patients and nursing needs are taken into account, taking into account last minute cancellations and multiple objectives. Ref. [19] uses a model similar to those considered in vehicle routing problems to balance resource use and minimise waiting times. They make simplifications such as not setting a limit on the number of nurses, although they plan a set of days. They only accurately solve problems with about 30 patients and generally use a two-stage heuristic involving a constructive algorithm and a local search. They perform a sensitivity analysis and use a second model that adjusts appointments robustly to longer than expected treatments.
Applications of stochastic mathematical programming to the optimization of oncology patient circuits. Ref. [20] addressed the problem of adjusting outpatient time and appointments along with the optimal number of physicians, for an outpatient appointment system in an individual block/fixed interval class, by using an adaptive penalty genetic algorithm. The length of service time for medical consultation, the time required for laboratory tests, and the time deviation from the appointment time are modelled by random variables. No-show patients are also included in the system. Using the adaptive penalty scheme, optimisation constraints are handled automatically and numerically. The solution methodology is easily applicable to other appointment systems. Ref. [21] presents a two-stage stochastic integer schedule to design patient appointment schedules under uncertainty of treatment times. The goal is to minimise a trade-off between the expected waiting times of patients and the expected total time to treat them. It is shown that solving this optimisation problem requires prohibitive computational time, so a heuristic algorithm is developed to find approximate solutions. Ref. [22] proposes such a model that is solved by averaging sample scenarios, which is an approach that can result in affordable computational times. This approach has served as a source of inspiration for the second model introduced in this paper. The work is motivated by a multidisciplinary oncology clinic that communicates the diagnosis and explains the treatment plan to its patients. In addition, regular patients are also seen by the clinicians. Therefore, all clinicians involved need a work plan in which various types of patients can be scheduled. These work plans are designed to optimise the waiting time of the patients and the waiting time of the clinicians. In [23], patient waiting times, chemotherapy chair downtime and nurse overtime are minimised using a stochastic programming algorithm. The work [24] includes stochastic programming aimed at minimising waiting times and the implementation of the methods with OpenSolver.
Optimization of oncology patient circuits through simulation techniques. A discrete event simulation model to explore appointment scheduling in a general hospital outpatient chemotherapy department has been developed by [25]. They consider different statistical distributions of the times involved in the problem. They identified an efficient schedule that kept bed utilisation at a tolerable level, restricting excess waiting time in a clinical setting. The authors suggest a scheduling method based on infusion time for the outpatient chemotherapy department. The study [26] proposes a feasible solution that increases resource utilisation without affecting patient service. The proposed simulation model shows how, with a better balance in the appointment system, the clinic could increase the number of patients seen by 18% while maintaining the same total patient time in the system. In other words, the model establishes a new schedule for infusion chairs that would allow more patients to enter the system and maintain the workload of nurses and pharmacists. The model distributes patients to available slots without exceeding the capacity of human resources. By means of simulation, waiting times, allocation of wards to specialists, multiple clinics and the use of resident and senior doctors are simultaneously considered in [27]. The convenience of computerised data collection is highlighted. Ref. [28] analyses the effects of possible improvements to the circuit by simulation. Consultation with the oncologist and pharmacy work are highlighted as key steps. They recommend citation for all stages and improved information flow between them.
Other methods applied to optimize the management of oncology patient circuits. Research by [29] addresses an oncology patient admission and allocation problem. The probability of patient appointment cancellation, as an important indicator of possible future gaps, is considered by the author in making admission and patient allocation decisions. The aim of walk-in admission by general outpatient clinics is to reduce the negative impact of patient absences and cancellations, and to improve the utilisation and accessibility of the clinic. This study presents a learning-based outpatient management (LGOM) system that focuses specifically on the management of patient admission and allocation during the day. The author develops a Markov decision process model to capture the patient admission decision process in the general outpatient clinic. Admission and patient allocation decisions are made from the perspective of maximising the long-term benefit of the system. LGOM is trained with simulation data and then applied to the real situation and the policy is updated to reflect the actual information. Ref. [30] applied a decision tree analysis to predictors that were significantly correlated with patient attendance behaviour to assess the probability of no-shows. The authors then developed a dynamic appointment scheduling procedure using different over-demand strategies for different numbers of appointments. A computer simulation was used to evaluate the effectiveness of the dynamic procedure against two other methods of randomly and uniformly assigning appointments. The dynamic scheduling procedure resulted in increased scheduling efficiency through overbooking, but with less than 5% risk of appointment conflicts (i.e., two patients presenting at the same time). In [31,32], discrete event simulation is incorporated into a kaizen approach aimed at reducing waiting times and better distributing the workload of hospital staff. The inclusion of this approach in a lean process has enabled staff to participate in a team-based problem-solving approach.

4. Contribution of the Paper

Within the field of literature reviewed in the previous section, this work was born as a consequence of the margin for improvement detected by ODH professionals in Santiago de Compostela, Spain. The primary objective is to be able to provide day hospital patients with an appointment as close as possible to the start time of their treatment, once the consultation with the oncologist has taken place. This would avoid the uncertainty that currently exists, as the patient leaving the oncology appointment now has to wait to be called to start oncology treatment without any additional information. Furthermore, it would be desirable to reduce waiting times, according to [2,3] studies. Therefore:
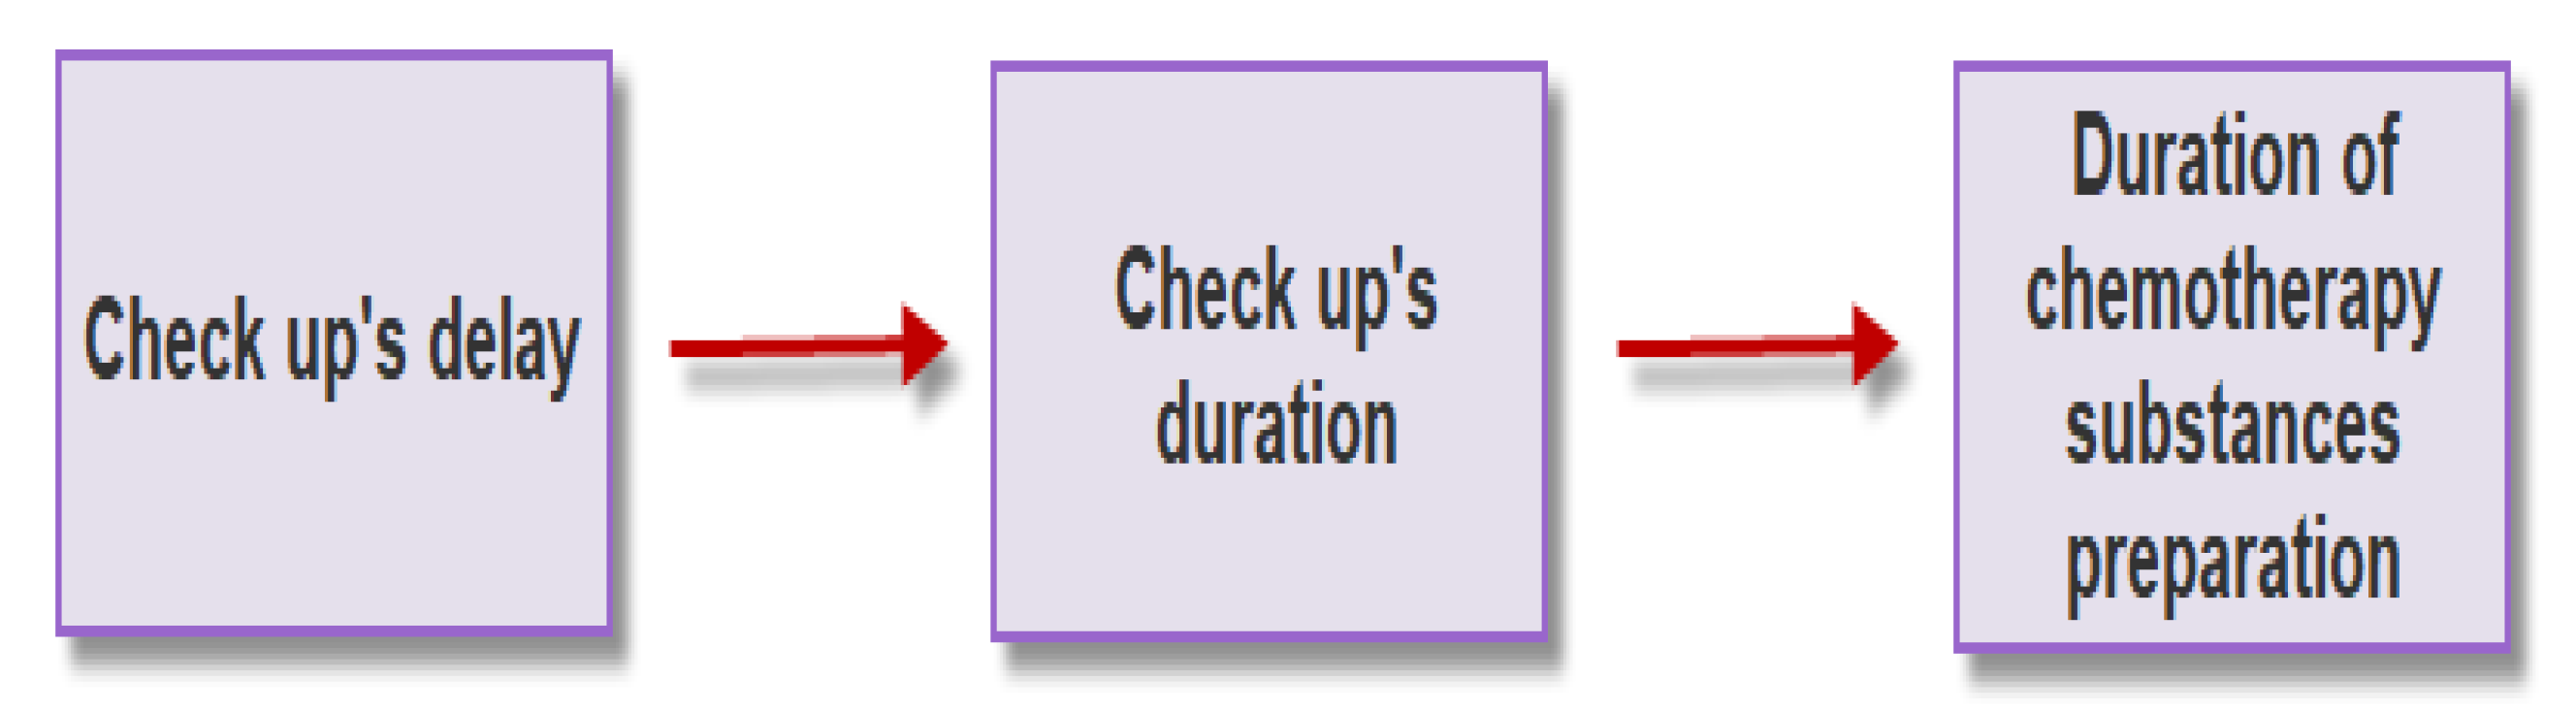
  • The first contribution was to measure the times involved in the circuit for all patients visiting the centre during a normal working week. Despite the difficulty of this task, the collaboration of each and every one of the CHUS professionals involved has been very valuable and has not only served to feed the models developed in the work, but has also shed light on the true reality of the times of the different stages of the circuit. This is of great use to the aforementioned professionals and in making different decisions aimed at improving the service.
  • Then, the model proposed in [17] was selected as it represents a problem very close to that of ODH and solves it very efficiently, and its objective and restrictions were adapted to fully represent our problem. The data collected have been used for the definition of the model parameters. A data-driven procedure is used to determine the ready times at which each patient can receive cancer treatment. While providing promising initial results, this model is deterministic and is not able to capture the underlying stochasticity in the mix of patients.
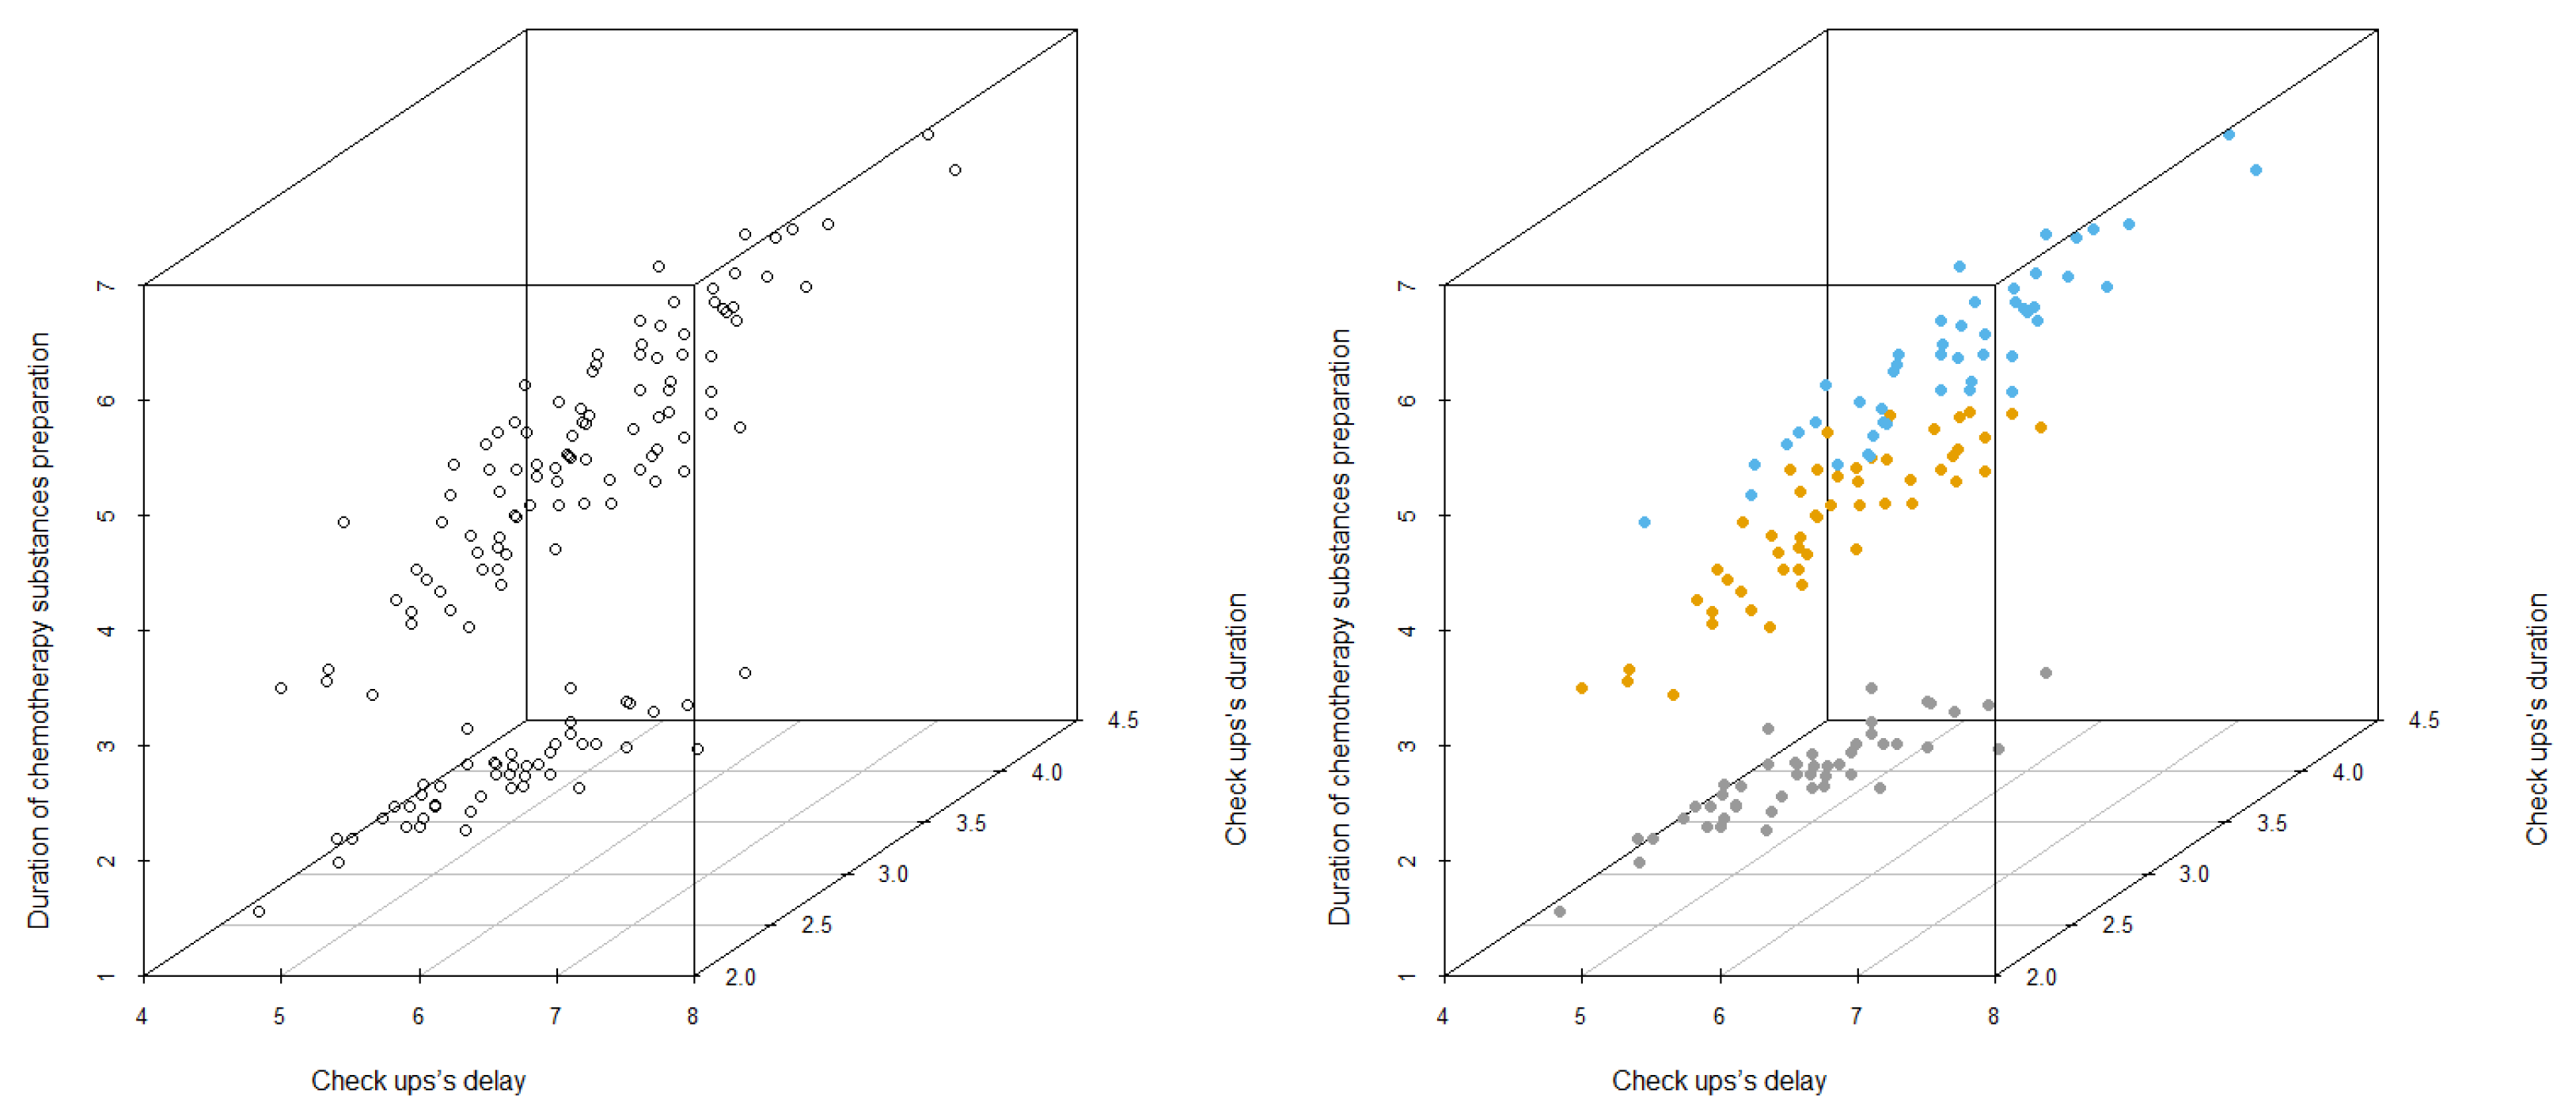
  • Thus, a second model is proposed, which generalises the previous one and, following the [22] approach, it is based on the data driven construction of different scenarios obtained from cluster analysis methods, that take into account the stochasticity of the times of the different stages of the process and the consequent variety in the patient mix. This second model achieves the objective of not only scheduling treatment appointments but also rescheduling appointments with oncologists from the original ones. In addition, an improvement in patient waiting times is achieved by comparing the results provided by the model with the available data. All models are programmed with the AMPL [33] language and solved with the Gurobi ( https://www.gurobi.com/, last accessed 20 Decemer 2021) solver in a fast way (seconds). The PC used for this work was a Lenovo Intel(R) Core(TM) i7-1065G7, 8 GB RAM, Windows 10 64-bit operating system.
  • Finally, the results obtained in both models feed a third and last model created to assign the nurses in charge of providing the treatment to the patients.
All of this, in short, provides a decision support tool in a healthcare context. It incorporates a prediction for patients of the start time of their oncological treatments, built through optimization criteria, resulting in individual and societal benefits measurable through the objective function of the proposed mathematical models.
Currently, the method used to perform these tasks is human-based. To our knowledge, no such study has been carried out in the environment close to the ODH.

5. Materials and Methods

We set out to use mathematical optimisation to obtain an algorithm that, by providing fully defined patient schedules, (i.e., including an estimate of both oncology review and chemotherapy treatment), also minimises waiting times between both medical services. To this end, interviews were arranged with all professionals involved in the circuit experienced by ODH patients and the existing literature on the topic of mathematical optimisation applied to outpatient chemotherapy was consulted. Our aim was to have a global understanding of how these types of problems are usually attacked mathematically and, from this knowledge, to be able to offer a solution that is valid for the specific circumstances of ODH. During the week of 11 January 2021 we collected data in the ODH of Santiago de Compostela on the duration of the different times related to consultations with oncologists and chemotherapy treatments. Specifically, we took the time differences between the theoretical and real times of the beginning of the oncological check-ups, the times of the durations of these check-ups, the time differences between the end of the check-ups and the times when the substances are ready to be administered, and finally the times of the durations of the chemotherapy treatments. From these data we can get an idea of where the critical stages of the process lie and how to approach the possible modelling of the problem.

5.1. Deterministic Model for Treatment Appointments

Under a deterministic approach and starting from an established schedule for appointments with the oncologist, the strategy would be to define a certain time as a margin between the theoretical start of oncology check-ups and the start of chemotherapy treatments that we consider appropriate for a large majority of patients. From this point, we would have an estimated time for each patient from which they would be ready to receive chemotherapy treatment and we could establish, for all treatments, optimal schedules with respect to the estimated waiting time for all patients that day. In this way, the patients would know in advance not only the estimated time for their check-up with the oncologist, but also an approximate time to receive their chemotherapy treatment. Thus, in addition to the optimisation process itself, we introduce the benefit for patients of knowing at what time (or from what time, in the case of a day with hypothetical delays) they will be called to start their treatment, allowing them to organise their idle time without the uncertainty of being called by the ODH at any time.
Once accurate information was obtained, the model of [17] was adapted to the particularities of our problem as follows.

5.1.1. Parameters

  • P: it establishes the number of patients with a chemotherapic appointment.
  • K: it establishes the number of chemotherapic chairs available.
  • T: it establishes the number of time slots used to split the 14 daily working hours.
  • l p with p { 1 , . . . , P } : chemotherapic treatments’ duration of each patient.
  • r p with p { 1 , . . . , P } : it establishes, for each patient, the first time slot where his chemotherapic treatment could be scheduled.
  • N d i s p t with t { 1 , . . . , T } : number of available nurses inside the chemotherapic room for each time slot.

5.1.2. Variables

  • x p , t with p { 1 , . . . , P } and t { 1 , . . . , T } : binary variable that is equal to 1 if the p patient begins his treatment in the time slot t.
  • C m a x : integer variable that establishes which time slot will be the first one with no treatment associated.
  • λ 1 and λ 2 : positive real variables. We will use them in order to ponder both parts of the bi-objective function.
Now we are prepared to formalize a mathematical model for this situation.

5.1.3. Mathematical Model

min λ 1 · p = 1 P t = 1 T [ ( t 1 r p ) · x p , t ] + λ 2 · C m a x
subject to
t = 1 T x p , t = 1 ,   p { 1 , . . . , P }
t = 1 r p x p , t = 0 provided that r p > 0 ,   p { 1 , . . . , P }
C m a x T ,
t = 1 T ( t + l p 1 ) · x p , t C m a x ,   p { 1 , . . . , P }
p = 1 P a = m a x { 1 , t l p + 1 } t x p , a K ,   t { 1 , . . . , T }
p = 1 P a = t t + 2 x p , a 5 ,   t { 1 , . . . , 24 }
p = 1 P a = t t + 2 x p , a 6 ,   t { 25 , . . . , 84 }
p = 1 P a = t t + 2 x p , a 3 ,   t { 85 , . . . , 108 }
p = 1 P a = t t + 2 x p , a 2 ,   t { 109 , . . . , 165 }
p = 1 P a = m a x { 1 , t l p + 1 } t x p , a 16 · N d i s p t ,   t { 1 , . . . , T }
As we can see, we want to minimize a bi-objective function converted into a single objective with weights. The first part of that function is an expression that grows while the sum of the differences between the moments when the treatments could have started and the moment when then really began increases. The second part references the moment of the day when the last treatment ends. Minimizing the first objective means reducing the average waiting time of patients, while minimizing the second implies achieving a working schedule that finalizes as soon as possible. Since the ODH’s interest is, above all, to provide an appointment schedule for treatments and to shorten patients’ waits, we have made all the calculations with λ 1 = 0.9 and λ 2 = 0.1 . In any case, the inclusion of C m a x in the model results in obtaining, in addition to the appointments for the different patients, the time at which the last treatment was completed.
Constraint (1) ensures that each patient starts exactly once his or her scheduled treatment. Constraint (2) ensures that no treatment is scheduled before it has been prepared in the oncology pharmacy. Constraints (3) and (4) make sure that the course of the infusion of the patient who finishes his treatment last is not later than the closing time of the hospital and, obviously, not earlier than the instant at which any other patient finishes their treatment. We impose constraint (5) in order to prevent that in any moment the number of chemotherapeutic chairs is surpassed by the number of ongoing treatments. Constraints (6)–(9) form a block that ensures that, over the course of the entire working day, at no time can a nurse initiate more than one treatment in a 15-min period, taking into account how the number of nurses available will vary over the course of the working day. The purpose of constraint (10) is to make sure that nurses’ working capacity is not exceeded. In other words, that no nurse has to deal with more than 16 ongoing treatments at any time.
In order to use the model, we must substitute the generic parameters of the above problem with the values determined by the reality of ODH. The chemotherapy sessions are carried out in the 40 chairs that exist for this purpose between 08:00 h and 22:00 h, so that 5 nurses conduct the chemotherapy sessions between 08:00 h and 10:00 h, 6 between 10:00 h and 15:00 h, 3 between 15:00 h and 17:00 h and 2 between 17:00 h and 22:00 h. In order to mathematically model the situation we also need to discretise these 14 working hours into a certain number of finite time intervals. Doing this represents a loss of precision when working with the time parameter, and the larger these intervals are, the worse the solution obtained will be. However, if these intervals are too small, they will not be practical for creating an organisational scheme with them, as they would assume a timeliness of the different stages of the process that, in general practice, would not be fulfilled.
We decided that a range of 5 min is an acceptable compromise between accuracy and manageability of the intervals. This choice is the consequence of an analysis carried out considering time intervals of different lengths, which we show, in short, in Section 6. We therefore divided the 14-h working day into 168 5-min intervals.
All of the above determines that K = 40, T = 168, N d i s p t = 5 ∀t ∈{1, ...., 24}, N d i s p t = 6 ∀ t ∈ {25, ...., 84}, N d i s p t = 3 ∀ t ∈ {85, ...., 108}, and N d i s p t = 2 ∀ t ∈ {109, ...., 168}. Moreover, nurses working capacity is M = 16.
The value of l p (treatment duration) is obtained in our data acquisition and, finally, the value of r p (ready time) is obtained by adding a pre-defined time margin to the theoretical check-up beginning time slot of the p-th patient. We explain below how these ready times are calculated based on certain time margins between each patient’s appointment with the oncologist and the start of his or her treatment. Figure 2 shows the three subsequent stages in the circuit of oncology patients after the theoretical instant of the appointment with the oncologist and preceding the moment when their treatment begins: delay in starting the appointment, duration of the appointment, and preparation of the treatment by the pharmacists. As mentioned, we collected data on these three times for one week at the ODH. Then, for each patient, we summed the values of these three times, obtaining a total minimum waiting time for each patient between his or her appointment with the oncologist and the time his or her therapy begins. With this set of values (minimum margin time for each patient), we select a sufficiently large one (accumulating a high percentage of values) that constitutes an approximate upper limit for the minimum time margins between the theoretical appointment with the oncologist and the start of treatment. As we will see later in Section 6, we have considered four possible values for these time margins, from most to least slack, 210, 180, 150 and 120 min, which we will refer to as Models 1, 2, 3 and 4, respectively. Finally, the ready time value or r p for each patient is obtained by adding to the instant at which he/she has been scheduled with the oncologist the margin chosen according to one of the four mentioned models.
  • Important Differences between the Models of the ODH and Those Presented in Previous Related Investigations:
Two models for treatment appointment planning in an oncology department are presented in [17]. In both, the constraints are the same: each treatment is guaranteed to be carried out, the treatment cannot start until the preparation of the treatment is finished, and capacity constraints in terms of chairs and nurses must be respected. In the current model the restrictions are similar. However, the restrictions on the workload that nurses can tolerate in our situation are less restrictive than in the aforementioned models, where these professionals cannot, within the same time slot, start a treatment and simultaneously see a certain amount of other ongoing treatments. In our case, in each time slot, the nurses are able to see 16 patients simultaneously and, at the same time, start a new treatment, as long as a treatment has not been initiated by this professional in the two immediately preceding intervals and a new one is not planned for the following two intervals (i.e., each nurse can start a new treatment every 15 min, that is, three time periods according to our choice of 5-min time periods).
In the objective, ref. [17] considers the sum of patient waiting time from ready time to start of treatment (using weights according to whether the patient is attributed a high, medium or low urgency) and a second summand related to the time needed to complete all treatments and ultimately the use of resources. This objective is addressed in the first model using only binary variables (which model the decisions to start different treatments) and defining a weak lower bound for the makespan as well as penalties for exceeding this bound. The second model uses, together with the binary variables, an integer variable that represents the makespan along with a parameter that represents the cost of each unit of time, and the penalties of the first model are no longer used. The present model is also integer, however it does not consider different emergencies for patients (although it would be perfectly possible to incorporate weights for the different patients in the first summand of the objective function, making use, for example, of the duration of their treatments or the distances to their homes), nor a cost per unit of time (the cost of the makespan is its own value). We will also modify the objective function slightly, by including a pair of scalars ( λ 1 and λ 2 ) that multiply both terms of the objective function. We choose to include these scalars in our biobjective function in order to have an intuitive and simple way to determine if we mainly want the optimal solution reduces the waiting time of the patients or that the working day ends with a significant margin over the official end of working (22:00 h). An important difference between [17] and our work is that in [17], the main problem is to finish treatments as soon as possible with the available capacity of nurses and treatments while the ready times are prefixed being equal to 0 by default, assuming that, in general, oncological appointment and reception of the treatment are done on different days. In our case, both tasks are performed on the same day which requires an extra effort compared to [17] to obtain these ready times. It should be noted that subsequent to the determination of treatment appointments, ref. [17] assigns nurses to patients using a heuristic, whereas here a binary linear programming model is built for this purpose and solved exactly (Section 5.3). Finally, ref. [17] mentions stochasticity in the mix of patient types, although it does not capture directly that fact in the model. Here we address that important aspect of stochasticity by building a general model (Section 5.2) that also allows for the reorganisation of oncologists’ appointments.

5.2. Stochastic Model of Oncologist and Treatment Appointments

Our sample of patients presents a large variability with respect to delays in the start of the consultation, duration of that consultation and treatment manufacturing time. This motivates us to think of alternative modelling such as the one we are going to introduce next, stochastic modelling, which can more adequately represent the ODH problem. Given the inherent structure of the oncology patient circuit optimization problem, in which appointments with the specialist are decisions that can be made at a given time while taking into account uncertainties about the future, a model of the so-called two-stage stochastic models can be defined. As it is well-known, the following equation establishes a generic objective function of a two-stage stochastic minimization program, which can be broken down into two summands:
m i n i m i z e f ( X ) + E [ g ( X , Y , ψ ) ]
In Equation (11), X is the set of the so-called first-stage variables, also known as “here-and-now” decisions (in our case, oncologist appointment times). Y is the set of second-stage variables, or “wait-and-see” decisions (in this setup, schedules of oncology treatments) while ψ is the set of random variables. These random variables are modeled as a set of plausible scenarios with associated probability of occurrence (in our problem, different scenarios represent different possible daily mixes of patients with respect to the four times of interest, e.g., patients with high delayed oncology appointment, oncology appointment duration, treatment preparation and treatment receipt, or patients with medium delayed oncology appointment, oncology appointment duration and treatment preparation and fast treatment receipt). The operator (E) calculates the expected value of the function g for the scenarios considered. The first-stage decisions must be applied at the time of solving the optimization problem. On the other hand, second-stage decisions are made once the random variables take values, i.e., in a particular scenario. Thus, the interpretation of the objective function of a two-stage stochastic problem is to find a set of decisions that are optimal given various scenarios, with an associated probability of occurrence, that models uncertainty about the future.
The basic concepts of this type of modelling can be found in [34] or [35]. In this paper we will make use of a two-stage model and consider several possible scenarios. Each scenario represents a type of working day in which the flow of patients is generally moving at a certain speed. In each of these scenarios, the patients’ ready times would be calculated by adding to the theoretical start times of each patient’s check-up a certain amount of time according to the aforementioned speed of patient flow. The strategy would be to calculate the solutions to the problems associated with each of these types, thus obtaining various times for the start of chemotherapy for each patient. It is left to the ODH professionals to choose the estimated start of chemotherapy treatment that would be assigned to each patient, depending on the evolution of the working day. This is linked to the mix of patients, of one type or another, depending on the magnitude of the times involved in the process. In this situation, they would wait until the end of the oncology check-up to inform the patient of the estimated time of their chemotherapy session. On the other hand, this new modelling also allows the possibility of modifying the schedules of the oncological check-ups. Once all the possible times for the start of chemotherapy are set, the procedure to follow would be to establish the start times of the oncological check-ups in such a way that the average waiting time for all patients is minimised. The weights used for this average are a consequence of the plausibility of the different scenarios according to the data collected in the hospital for this paper.
To construct these scenarios, we use the k-means algorithm [36]. We divide the total sample of patients into a number of subgroups that have the lowest possible internal variability with respect to the times involved in patient waiting time (less than the variability of the total sample). We then calculate an upper bound for the sum of these times in each subgroup (analogous to the procedure used in the deterministic model). After this, we have as many time margins as scenarios that we can apply to the total of our patients to calculate their ready times, and thus have a ready time for each patient in each scenario.
Figure 3 illustrates the construction of three scenarios for patients by means of the k-means algorithm making use of three times involved in waiting times. A fictitious dataset of 150 patients has been considered. We look at three times (delay of revisions, duration of revisions and duration of preparation of chemotherapy substances) for each of these patients. In the image on the left we can see a three-dimensional graph with the 150 points. Each of these points represents a patient and has three associated coordinates (one for each time). If we use the “k-means” procedure on this set of patients, we obtain a partition of our original dataset, consisting of three subgroups of patients (see the right image, where each point is illustrated with a colour according to the group to which it belongs), each of dimension 50. Since each subgroup has 50 patients, all scenarios would be considered equiprobable in this case.
After applying the k-means algorithm to our data set, we have obtained four different scenarios. In the following, we present the main elements of the stochastic model.

5.2.1. Parameters

The new parameters are listed in Table 1.

5.2.2. Variables

  • y [ p , t ] with p { 1 , . . . , P } and t { 1 , . . . , T } : binary variable, for scenario 1, that is equal to 1 if the p patient begins his treatment in the time slot t.
  • f [ p , t ] with p { 1 , . . . , P } and t { 1 , . . . , T } : binary variable, for scenario 2, that is equal to 1 if the p patient begins his treatment in the time slot t.
  • x [ p , t ] with p { 1 , . . . , P } and t { 1 , . . . , T } : binary variable, for scenario 3, that is equal to 1 if the p patient begins his treatment in the time slot t.
  • z [ p , t ] with p { 1 , . . . , P } and t { 1 , . . . , T } : binary variable, for scenario 4, that is equal to 1 if the p patient begins his treatment in the time slot t.
  • c [ p , t ] with p { 1 , . . . , P } and t { 1 , . . . , T } : (first stage) binary variable that is equal to 1 if the p patient is scheduled for the oncologist in the time slot t.
Note that y [ p , t ] , f [ p , t ] , x [ p , t ] and z [ p , t ] are the variables associated with the allocation of the schedules for the patients’ chemotherapy considering that the total set of patients is an homogeneous group and well represented for the groups 1, 2, 3 and 4, respectively, obtained through the “k-means” algorithm.

5.2.3. Objective Function of the Mathematical Model

Therefore, we pose the following possible objective function for our stochastic modelling:
min 0.287 · p = 1 P ( t = 1 T ( t · y [ p , t ] ) ( t = 1 T ( t · c [ p , t ] ) ) 2.6 ) +   0.272 · p = 1 P ( t = 1 T ( t · f [ p , t ] ) ( t = 1 T ( t · c [ p , t ] ) ) 4.2 ) +   0.364 · p = 1 P ( t = 1 T ( t · x [ p , t ] ) ( t = 1 T ( t · c [ p , t ] ) ) 2.2 ) +   0.077 · p = 1 P ( t = 1 T ( t · z [ p , t ] ) ( t = 1 T ( t · c [ p , t ] ) ) 1.8 )
Considering the first line of the objective function, for each patient p, in scenario 1:
  • t = 1 T ( t · y [ p , t ] ) represents the period in which he starts his treatment,
  • t = 1 T ( t · c [ p , t ] ) represents the period in which he is scheduled for the oncologist.
Taking into account row 1 of Table 1,
  • ( t = 1 T ( t · y [ p , t ] ) ( t = 1 T ( t · c [ p , t ] ) ) 2.6 ) is the waiting time of patient p from the theoretical exit of the appointment with the oncologist to the start of treatment, and
  • p = 1 P ( t = 1 T ( t · y [ p , t ] ) ( t = 1 T ( t · c [ p , t ] ) ) 2.6 ) is the total waiting time from the theoretical exits of the appointment with the oncologist to the start of treatments, in scenario 1.
The last three lines of the objective function of the stochastic model have a similar interpretation corresponding to the remaining scenarios, respectively. Now taking into account the second row of Table 1, the objective function represents the average value for the four scenarios of the total patient waiting time. Note that this objective function does not include the variable C m a x in order to reduce the number of constraints and achieve a faster resolution time. All the variables have a series of restrictions associated with them that we must fulfil. We explain them below. All the restrictions exposed for the deterministic process are applied to this new model, up to four times, once for each scheduling problem associated with each of the four scenarios to be considered. Moreover, as in this model we also face the restructuring of appointments with the oncologist assigned to each patient, new constraints arise that must be met in order to preserve a distribution of oncology appointments that is feasible for ODH professionals. Specifically, the way in which patients’ oncology check-ups are distributed is conditioned by the type of cancer they suffer from. In each individual, this disease may present as type I, type II or type III. These three groups represent digestive cancers, breast cancers and other cancers, respectively. There are three specialists available for each of these cancers, which limits the maximum number of simultaneous oncology reviews for each speciality to three. In addition, we estimate that each review theoretically lasts approximately 15 min, and therefore the number of patients seen by each speciality cannot be more than three in any 15-min time slot throughout the working day. In total, this stochastic modelling has more than 40 constraints. The Appendix A shows in detail the AMPL code [33] of the stochastic model in extensive form of our problem.
As a preview of the results, Section 6.3 will show the main information of the four scenarios we have considered, obtained after applying the k-means algorithm to our data set. For each scenario, we indicate the percentage of patients in this data set that constitute the scenario (this percentage will be the probability we assign to the scenario) as well as the average of the four times of interest (check-ups’ delays, oncological check-ups, substance preparation and treatments) in that subset of data. It should be noted that scenario three, which is the most frequent scenario, has the four average values close to the means of the entire data set. Scenario two corresponds to cases where on average all the times are lower than the mean, except for the duration of the appointment with the oncologist, but in any case it is not a significant increase. Scenario one is characterized by significant delays in the start of the appointment with the oncologist and the fourth scenario is the most unfavorable, although unlikely, and corresponds to long times in the three most important cases, delay in the start of the oncology consultation, preparation of drugs and duration of treatments.

5.3. Model of Nurse-to-Patient Allocation

Finally, we pose a new mathematical scheduling problem that will serve to obtain a distribution of work among all the nurses in the chemotherapy ward. In this way, the responsibility for the start of all the treatments given throughout the day would be distributed among the 6 nurses who are operational in the ward at any given time.
The parameters and variables of the problem are as follows:

5.3.1. Parameters

  • P: it establishes the number of patients with a chemotherapic appointment.
  • T: it establishes the number of time slots used to split the 14 working hours.
  • N d i s p t wth t { 1 , . . . , T } : number of available nurses inside the chemotherapic room for each time slot.
  • y p , t with p { 1 , . . . , P } and t { 1 , . . . , T } : binary parameter that is equal to 1 if patient p has his appointment scheduled for time slot t.

5.3.2. Variables

  • e i , p , t with p ∈ { 1 , . . . , P } , t { 1 , . . . , T } and i { 1 , . . . , N d i s p t } : binary variable that is equal to 1 if patient p begins his appointment during time slot t assisted by nurse i.
Therefore, this problem should be solved taking for the parameter y p , t the value of the variable associated with the appointment for cancer treatment of patient p in period t, obtained by solving the deterministic model, or obtained by solving the stochastic model. In the latter case, patients can be assigned to nurses four times, once for each scenario.
The formulation of the model would be as follows.

5.3.3. Mathematical Model

min p = 1 P t = 1 T i = 1 N e i , p , t
subject to
t = 1 T i = 1 N [ i · e i , p , t ] = 1 ,   p { 1 , . . . , P }
i = 1 N e i , p , t y p , t ,   p { 1 , . . . , P } ,   t { 1 , . . . , T }
p = 1 P a = t m i n { T , t + 2 } e i , p , t 1 ,   i { 1 , . . . , N } ,   t { 1 , . . . , T }
e i , p , t = 0 ,   i { 4 , . . . , 6 } ,   p { 1 , . . . , P } ,   t { 85 , . . . , 108 }
e i , p , t = 0 ,   i { 3 , . . . , 6 } ,   p { 1 , . . . , P } ,   t { 109 , . . . , T }
e 6 , p , t = 0 ,   p { 1 , . . . , P } ,   t { 1 , . . . , 24 }
What is really important here are the constraints of the problem, which guarantee that the solution will be a feasible workload distribution for all the nurses. The objective function we select seeks to concentrate work on a subset of the nurses in order to leave the rest “idle”. This can be useful to elucidate how many staff are essential in the given context, but as we say the vital part of this problem are the constraints, so that the objective function can be modified. As for the concrete functions that each of the aforementioned restrictions fulfil, we have that number (12) ensures that each patient is assigned exactly one nurse. Number (13) requires that, if a patient has been assigned a treatment for a certain time, one of the nurses is responsible for initialising it at that time. Number (14) precludes any nurse from having more than one treatment start assigned in a 15-min period. Finally, the restriction blocks (15)-(17) mark the availability of the hospital’s pool of nurses in each period. This is, five nurses between 8:00 h and 10:00 h, six between 10:00 h and 15:00 h, three between 15:00 h and 17:00 h and, finally, two nurses between 17:00 h and 22:00 h.

6. Results of the Case Study

After having validated the behavior and efficiency of the previous models, with numerical examples, we show here the main results obtained by applying them to the ODH data; a total of 290 patients attended over the 5 days of a week.

6.1. Summary of the Collected Data

We now proceed to summarise the statistical information from the data collected in the hospital during the week of 11 January 2021. We will show four pairs of boxplots and histograms, one for each considered time in the data. In terms of the analysis of the data obtained, it is concluded that the majority of oncological check-ups do not take more than 45 min longer than the estimated start time. However, as we can see in Figure 4 there are still non-negligible amounts of data above this threshold. Furthermore, the interquartile range of the sample exceeds 30 min in duration, indicating the large variability involved in this waiting time. With regard to the duration of appointments with the oncologist, it seems clear that, in general, the duration of appointments with the oncologist is less than a quarter of an hour (more than 60% of the data show times of less than 15 min). The interquartile range is barely more than 10 min and there are relatively few outliers (see Figure 5). Substance preparation is the most problematic stage of the whole process. As we can see in Figure 6, duration times tend to cluster between 50 and 100 min. Moreover, the interquartile range is around three quarters of an hour. Therefore, this is a stage with long average times and great variability. Finally, the stage of chemotherapy treatments is the one that shows the greatest variability, presenting significant volumes of data beyond four hours in duration (see Figure 7). The comparison between the latter times and the data on the duration of oncology check-ups shows that it is clear that this stage shows much more variability. Specifically, the data collected in the ODH during the week analysed show that more than 80% of the oncological check-ups carried out lasted less than half an hour, while with regard to chemotherapy treatments, 35.35% of the total lasted between 0 and 100 min, 33.44% lasted between 100 and 200 min, 22.29% lasted between 200 and 300 min and 8.92% lasted more than 300 min. On the other hand, it is worth mentioning that the chemotherapy treatment stage is the last stage of the process, and therefore the one with the most uncertainty regarding its possible start time. Much of this uncertainty is explained by the immediately preceding process: the pharmacy stage. This stage is second only to the chemotherapy stage itself in terms of variability. All these factors make the planning of treatment schedules a more delicate task than the planning of oncology consultations.
Looking in detail at the data collected during the week of 11–15 January, we can see that if we want to take an upper level for the differences between the theoretical and real start times of the oncological revisions that are fulfilled by 85% of the patients, we should go to 60 min. On the other hand, to establish an upper limit for the duration of these check-ups suitable for 85% of the patients, we must go to 60 min. Regarding the time of preparation of the therapy substances, in order to again obtain a new level that covers 85% of the patients, we need 90 min. Therefore, it may seem wise to take a margin of 210 min over the theoretical starting time of the oncological check-up to determine the moment from which both the patient and the treatment will be ready for the chemotherapy session. This framework should be applied indiscriminately to all patients, given that we do not have any estimate of the specific duration of each patient’s revisions. On the other hand, we do have an estimate of the duration of the chemotherapy treatments that each patient will receive. For this purpose, we will run the model with the prudent “ready times” described above Specifically, apart from the aforementioned 210 min of time between the beginning of the theoretical review and the moment when the patient is ready to receive the chemotherapy, we are going to execute the program with 180, 150 and 120 min of margin. The 180 min margin is the result of considering 45 min of time for the delay of the oncologic revision, 45 for the duration of this and 90 for the preparation of the drugs. The 150-min rate considers 30, 30 and 90 min, respectively. Finally, the margin of 120 considers 15, 15 and 90 min, respectively. We will be able to get an idea of what we could achieve if the delays in the start of the reviews were mitigated or if the durations of the processes of the reviews themselves and of the formation of the patient’s therapy substances were reduced.

6.2. Results of the Deterministic Model

Table 2 shows the sum of waiting times for all patients for each day of the week of 11 January 2021. The first column shows the waiting times for the current procedure, while the following columns show the waiting times resulting from applying the deterministic model with specific ready times. The Model 1 column shows the waiting times obtained with the model using ready times that are the result of setting a margin of 210 min between the theoretical start of the review and the time when the patient is ready to receive the therapy. The Model 2 column represents the analogous data taking a 180-min window. Column Model 3 shows a margin of 150 min, and finally column Model 4 shows 120 min of margin.
Note that if we take a margin of 210 min to calculate the “ready times”, we would be assuming the price of worsening waiting times by an average of 48 min per patient in exchange for having a well-defined schedule for both oncology check-ups and chemotherapy treatments. It seems debatable whether or not the model is worth applying in these circumstances. However, considering small advances in “ready times”, the situation improves considerably. Thus, by simply reducing the margin of the times with which we generate the ready times by 30 min (i.e., taking margins of 180 min), we would have a situation in which we achieve a complete planning of the day, increasing the average waiting time per patient by less than 20 min. If we consider even greater improvements, taking margins of 150 and 120 min, we would manage to reduce waiting times by an average of 17 and 45 min per patient, respectively. It should be noted that results are sensitive to the choice of the length of the time intervals considered. Table 3 gives a comparison of results considering time intervals of length 5, 10 or 15 min. We see that the results are worse for the values 10 and 15, which justifies our choice of 5 min.
Figure 8 shows how the number of treatments in progress evolves throughout the day on Monday according to the current procedure and how the model would be applied with ready times resulting from taking margins of 120 min.
As we can see, when using the mathematical model, the distribution of the treatment workload tends to shift to earlier hours compared to the current procedure. Specifically, the model proposes more treatments in progress between 11:30 am and 2:30 pm, but less in the afternoon, except for a short period between 7:00 pm and 7:30 pm. This distribution of treatments is consistent with the deterministic model being able to reduce total waiting times. This is a positive consequence for both patients and ODH professionals: patients in general would finish their treatments earlier and be able to return home earlier, which we can translate into a higher quality of service for them, while for the service professionals there is a greater margin of response to possible delays in order not to have to perform treatments beyond the official ODH closing time.
Table 2 and Figure 8 show the overall improvement provided by the deterministic model in terms of patients’ waiting times and the effects on their treatment start times. Next, Table 4 and Figure 9 show the specific changes or values of the variables in the optimal situation. Thus, in Table 4 we consider the data for Monday 11 January 2021. Specifically, for each of the patients, we provide the duration of the application of their treatment, the actual start time for its application and the start time proposed by the deterministic model considering a time margin of 120 min, all expressed in time units of 5 min.
Figure 9 represents these data, which for clarity are expressed, both in the upper and lower graph, as a function of the time of day and ordered, from bottom to top, by the duration of the treatment, from the longest to the shortest. The top graph shows the actual data and the bottom graph shows the model proposal. For each patient, the time elapsed from the opening time of the centre to the start of treatment is shown in blue and the treatment time in red. We can see in detail how, when applying the deterministic model, there is a higher number of treatments in progress between 12:30 h and 14:00 h. However, let us note that its applicability is determined by achieving delay times in the start of oncology appointments and the duration of oncology appointments themselves of no more than 15 min, and a treatment preparation of no more than 90 min, i.e., time margins for receiving treatment, from the scheduled appointment time with the oncologist, adjusted to 120 min.

6.3. Results of the Stochastic Model

Before using the stochastic model we have to divide the patients using the k-means method. After applying this algorithm on the set of our patients we obtain four subgroups. Table 5 shows, for each group or scenario, the mean of the four times of interest of the oncological patient circuit. Next, Table 6 contains the sum of waiting times obtained for all patients for each day of the week of 11 January 2021. The first column shows the waiting times for the current procedure, while the following columns show the waiting times resulting from applying the stochastic model, the percentages of improvement and the number of patients for each day, respectively. It can be seen that the improvement achieved in waiting times using the stochastic model is between that achieved by the deterministic model in its two most optimistic cases (that is, margins). Specifically, waiting times in this case are reduced by 17%, which translates into mitigating each patient’s wait by an average of 21 min. The results in Table 6 are expected values, calculated from the realizations of the randomized experiment and the probabilities of the different scenarios. In Table 7 we delve into the results, showing for Monday, 11 January 2021, the waiting times obtained in each of the scenarios, the probabilities of the scenarios, the average already shown in Table 6 and , additionally, the total computation time with Gurobi. We note that scenario 4 is the one with the longest treatment processing times and translates into longer waiting times. Figure 10 also shows for Monday, 11 January 2021 the comparison between actual oncologist appointment times and those proposed by the stochastic model. We see that the last are less concentrated (i.e., more dispersed) in the early morning hours in the interest of reducing patient waiting times.

7. Discussion, Conclusions and Framework for a Further Research Agenda

From all the literature reviewed, the studies by [15,17] largely inspired our proposed deterministic model. Ref. [15] solves a problem of scheduling appointments for patients attending an oncology centre, although the main objective is to achieve a scheduling scheme that avoids peaks in the workload of the centre’s professionals during the working day, while [17] mainly aims to reduce patient waiting times and makespan as much as possible. Therefore, as far as the objective function is concerned, our deterministic model is more similar to the work of [17], although the set of constraints generated by the context of this study are quite different from those emanating from the reality of the ODH. While the deterministic model provides positive estimated results in terms of reducing patient waiting times, although it is fairly simple to implement, the relatively random nature of the problem may be a limitation of this model. For this reason, in this paper, a two-stage stochastic programming model is also presented ( [34]). We assume uncertainty with respect to the time duration of the different stages of the patient circuit and consider several possible scenarios for the flow of the set of patients through the different stages of the process. Classification techniques were used to design these scenarios. We thus present a model that offers several possible schedules for the chemotherapy of each patient. The role of the oncology day hospital professionals is to decide, depending on how the working day is, which estimate to communicate to each patient for the start of treatment. Note that this model is a stochastic generalisation of our deterministic model, close to that of [17]. It should be said at this point that an advance of our work over [17]’s is that it provides not only a treatment appointment for each patient, which also takes into account the workflow of the day in question, but also automates and optimises the generation of appointments with oncologists. It is also worth noting the relationship between the three models generated in this setup in the sense that we can use the stochastic model to optimise appointments with oncologists, then use these results in the deterministic model to obtain treatment appointments, and finally, with the results of the deterministic model to assign nurses to patients. In terms of resolution of the stochastic model, we adopt the approach of [22] and, as in this paper, resolution efficiency is achieved. Although the resolution method we use is close to that of [22], there are important differences in the two studies, as the latter is motivated by a multidisciplinary clinic and the aim is to minimise patient waiting time and weighted overtime and downtime of different clinics. The randomness is attributed to the possible arrival of multidisciplinary patients which is modelled through the use of the multinomial statistical distribution, however the problem we investigated concerning appointments for oncological treatment and the randomness in the different times that make up the circuit of a patient in the day centre is not considered.
At the ODH, the distribution of patients seen each day in the different specialities is not uncertain and is organised by the doctors themselves.
Ref. [23] is one of the most recent studies that addresses the establishment of appointments for receiving oncologic treatments by means of a two-stage stochastic model. The main difference with the present study is that the motivating center performs the consultation with the physician and the actual infusion of the treatment on different days, so that only the existence of uncertainty in the duration of treatments is considered. However, the work of [23] simultaneously plans the succession of patient arrivals at the center, the appointment time, and the assignment of patients to nurses and chairs. Although the compact approach is elegant, it is laborious to solve and requires the use of a specific heuristic algorithm resulting from the adaptation of the Progressive Hedging Algorithm and a detailed computational study to determine its performance. However, when working with a number of nurses and chairs similar to that of ODH, computation times in excess of one thousand seconds are required. In any case, the methodology of both works is different and it should be noted that [23] proposes as a future line something that we are addressing, such as the joint planning of treatment schedules and appointments with the oncologist.
To conclude the discussion, we mention the reference of [24], also relatively recent and close to our study. There too, both deterministic and stochastic approaches are employed. First, it proposes to develop a method of of oncologist and chemotherapy appointments with the objective of balancing the workload of nurses and oncologists, to the extent that the number of chairs occupied, or oncology appointments started, in each unit of time is a decision variable in the problem.
It uses an integer programming model, nonlinear in fact, which, rather than determining specific appointments for patients, provides the number of clients initiating their treatment or consultation in a given time period. The discrete-event simulation methodology for modeling the flow of patients in the oncology clinic is used to show that the proposed scheduling methods can improve the well-being of patients by reducing waiting times and improve staff work by providing a more balanced workload. Factors that affect workload balance, such as patient volume or nurse scheduling, are also studied. As for the stochastic approach, they address the problem of scheduling chemotherapy patients with uncertainty in the duration of treatments. They propose a two-stage stochastic programming model, which is very difficult to solve due to the large number of scenarios, the non-linear constraints used and the need for additional variables and constraints. Therefore, they propose a two-stage algorithm to compute the expected downtime and waiting time. This two-stage algorithm does not guarantee optimisation with respect to patient waiting time and downtime and therefore they propose as a future research direction to develop new methods to solve the proposed stochastic programming model. Results with real data are also not provided.
With respect to the conclusions, the stochastic model, in addition to appointments for treatments we obtain defined schedules for patients with respect to their medical appointments, making the minimisation of patient waiting times between medical appointments more effective. This model has an estimated improvement in waiting times of 17%. Note that the scheduling of check-up times respects minimum restrictions to ensure that the schedules are manageable for the oncologists in charge of the first stage of the process. It would be up to the service professionals to select one model or the other.
While the use of the deterministic model is simpler and allows the automation of the allocation of treatment appointments, thus improving on the current system and relieving the nurses of this responsibility, the stochastic model takes into account more information about the timing of the process and allows the initial oncology appointments to be rescheduled. However, this model requires daily coordination of all involved staff on the work progress to select the appointment provided to patients. Other strategies are also possible, such as choosing the earliest appointment among all possible appointments, for each patient, or the later one.
If we analyse Table 2 in detail, we can see that the result of applying our deterministic model with the 210 and 180 min quotas is to increase patients’ waiting times, but in exchange for offering them in advance a specific timetable for both their oncology check-up and their chemotherapy session. It should be noted that this increase, in the case of the 180 min quota (the most realistic), is less than 4000 min over the total of all patients in the week in which the data was collected. This represents an increase in waiting time on average of less than a quarter of an hour per patient, which does not seem too much considering that the average waiting time per patient with the current procedure is close to two hours (110 min). Therefore, it might seem worthwhile to apply the algorithm and assume this increase in waiting time in order to obtain fully defined schedules in advance. Moreover, we also have to take into account that the distribution of treatments obtained with the algorithm offers professionals a greater capacity to react to unforeseen events, as we mentioned when analysing Figure 8. On the other hand, it had also seemed interesting to explore the option of reducing the second stage waiting times of patients by a reasonable investment of resources or by other strategies. As we can see in Table 2, just by reducing the average margin time by 30 min, a complete organisational scheme for patients can be obtained without increasing waiting times compared to the current situation. On the contrary, waiting times will be reduced compared to the current baseline. With respect to the stochastic model, in addition to achieving defined schedules for patients with respect to the two medical commitments they have, this model provides an estimated improvement in waiting times of 17%, a measure obtained from the available data. The stochastic model is complemented by a tool that solves the problem of assigning nurses to patients, which uses directly the results of the stochastic model as parameters. Finally, we agree with [27] or [28], among others, about the convenience of computerised data collection and efficient information flow among the stages of a circuit of oncology patients.

Framework for a Further Research Agenda

As is typical of the used methodology, the models can provide a post-optimality analysis that would allow us to see the effect of modifications in the parameters of the model. Note that we make use of deterministic (fixed) parameters such as number of nurses, pharmacists, doctors, or also consulting rooms, or chemotherapy chairs. We also have stochastic (variable) parameters: the time distributions of the various stages of the circuit. Therefore, one possibility for future study is to analyse in depth the effect of changes in both fixed and random parameters.
Regarding the computational aspects of the work, we should mention that all the models studied were solved with the mathematical programming language AMPL ( [33]) and using the Gurobi solver. The computation times, considering a time horizon corresponding to a working day, never exceeded 30 s (an important aspect for the application of the model in the health sector) in the deterministic case, and those needed to solve the stochastic model were also acceptable (about 200 s). It is worth noting that the Gurobi solver provides a single optimal solution, although the values of the variables in the optimum need not be unique. Further study of different optimal solutions may lead to the choice of one or the other depending on additional properties, such as more or less balanced workloads. In relation to this issue, a possible extension of the presented models could consider, by means of weightings, priorities for certain types of patients such as longer treatments, those living far from the ODH or those with a delicate health condition, and thus have a stronger impact on aspects that in some cases are already taken into account at present. Another open problem would be to carry out a deeper computational study of the scope of both models beyond the case studied in this paper, which is limited to the dimension of the daily problem of the ODH of Santiago de Compostela.
Some additional future study questions have been also proposed by the ODH professionals themselves. Firstly, it will undoubtedly improve results and be more efficient to consider ready times for groups of patients according to their characteristics (mainly type of cancer and stage) instead of setting a common ready time for all of them. On the other hand, the planning of oncological appointments is done on a weekly basis, therefore, thinking especially of the stochastic model, but also the deterministic one, it would be reasonable to test its performance by working with a weekly time horizon. This implies working with a larger number of patients, which would increase the computation time and make it difficult to obtain an exact solution in reasonable time, although it would open the door to the design of an algorithm, possibly of a heuristic type that would allow fast solutions to be obtained, even if they were not exactly optimal. It is clear that the real implementation of the system requires its integration into the set of computing tools used by the hospital. Finally, there are other possibilities for handling the randomness of times in the oncology patient circuit such as chance constraint programming [37], which can be explored further.

Author Contributions

Conceptualization, A.G.-M., E.B.-V., B.C.-M., R.L.-L., R.L.-R. and F.R.-S.; methodology, A.G.-M., E.B.-V., B.C.-M., R.L.-L., R.L.-R. and F.R.-S.; software, A.G.-M., B.C.-M. and F.R.-S.; validation, A.G.-M., E.B.-V., B.C.-M., R.L.-L., R.L.-R. and F.R.-S.; formal analysis, A.G.-M., B.C.-M. and F.R.-S.; investigation, A.G.-M., E.B.-V., B.C.-M., R.L.-L., R.L.-R. and F.R.-S.; resources, A.G.-M., E.B.-V., B.C.-M., R.L.-L., R.L.-R. and F.R.-S.; data curation, A.G.-M., E.B.-V., B.C.-M., R.L.-L., R.L.-R. and F.R.-S.; writing—original draft preparation, A.G.-M., B.C.-M. and F.R.-S.; writing—review and editing, A.G.-M., E.B.-V., B.C.-M., R.L.-L., R.L.-R. and F.R.-S.; visualization, A.G.-M., E.B.-V., B.C.-M., R.L.-L., R.L.-R. and F.R.-S.; supervision, A.G.-M., E.B.-V., B.C.-M., R.L.-L., R.L.-R. and F.R.-S.; project administration, A.G.-M., E.B.-V., B.C.-M., R.L.-L., R.L.-R. and F.R.-S.; funding acquisition, A.G.-M., E.B.-V., B.C.-M., R.L.-L., R.L.-R. and F.R.-S. All authors have read and agreed to the published version of the manuscript.

Funding

This research has been funded by the ERDF, the Government of Spain/AEI [grant MTM2017-87197-C3-3-P] and the Xunta de Galicia [Grupos de Referencia Competitiva ED431C2017/38, and ED431C 2021/24].

Institutional Review Board Statement

Not applicable.

Informed Consent Statement

Not applicable.

Data Availability Statement

Data can be provided by the authors on request.

Acknowledgments

The authors would like to thank the help, knowledge and support provided for this work by different professionals from the University Clinical Hospital of Santiago de Compostela, in particular to Beatriz Bernárdez Ferrán and Nieves Mayo Bazarra. They also appreciate the positive criticism of the reviewers for their help on improving the contents and presentation of the work.

Conflicts of Interest

The authors declare no conflict of interest.

Abbreviations

The following abbreviations are used in this manuscript:
AMPLA Mathematical Programming Language
CHUSHospital Clínico Universitario of Santiago de Compostela
ODHOnco-haematological Day Hospital
IDISHealt Research Institute of Santiago de Compostela
LGOMLearning-based outpatient management
ONCOMETTranslational Medical Oncology Group
OpenSolverExcel add-in for solving optimization models
SCHASantiago de Compostela Health Area
SERGASGalician Health Service

Appendix A. The Two-Stage Stochastic Model in Extensive Form

This section shows the two-stage stochastic programming model in extensive form that has been presented in this paper, being an extension of the (deterministic) modification of the [17] model introduced in Section 5.1. The model of the current section has been written using the AMPL modeler and therefore could be used directly if accompanied by a data file and using a solver such as Gurobi, for example. Explanatory comments are incorporated next to the formulation itself.
Parameters and sets
  • param P > 0 ; #Number of patients assigned to the working day
  • param l { p i n 1 . . P } ; #Duration of patients’ chemotherapy treatments
  • param T > 0 ; #Number of time intervals that constitute the working day
  • param N d i s p { t i n 1 . . T } ; #Number of available nurses during each time interval
  • param q 1 integer; #Minutes consumed by delay of appointments, their duration and preparation of
  • chemotherapy substances (scenario 1)
  • param u 1 integer; #Idem scenario 2
  • param v 1 integer; #Idem scenario 3
  • param s 1 integer; #Idem scenario 4
  • param K > 0 ; #Number of available chemotherapy chairs
  • param N > 0 ; #Number of nurses working during the day
  • param M; #Number of treatments that a nurse can simultaneously supervise
  • set E1; #Cancer type I patients
  • set E2; #Cancer type II patients
  • set E3; #Cancer type III patients
Variables
  • var c { p i n 1 . . P , t i n 1 . . T } binary; #Medical check-ups schedule
  • var y { p i n 1 . . P , t i n 1 . . T } binary; #Chemotherapy treatments schedule at scenario 1
  • var f { p i n 1 . . P , t i n 1 . . T } binary; #Idem at scenario 2
  • var x { p i n 1 . . P , t i n 1 . . T } binary; #Idem at scenario 3
  • var z { p i n 1 . . P , t i n 1 . . T } binary; #Idem at scenario 4
Objective function
minimize obj:
  • 0.287*sum { p i n 1 . . P } ((sum { t i n 1 . . T } (t*y[p,t]))-(sum { t i n 1 . . T } (t*c[p,t]))- 2.6)
  • +0.272*sum { p i n 1 . . P } ((sum { t i n 1 . . T } (t*f[p,t]))-(sum { t i n 1 . . T } (t*c[p,t]))-4.2)
  • +0.364*sum { p i n 1 . . P } ((sum { t i n 1 . . T } (t*x[p,t]))-(sum { t i n 1 . . T } (t*c[p,t]))-2.2)
  • +0.078*sum { p i n 1 . . P } ((sum { t i n 1 . . T } (t*z[p,t]))-(sum { t i n 1 . . T } (t*c[p,t]))-1.8);
Constraints
  • subject to restriction0 { p i n 1 . . P } :
  • sum { t i n 1 . . 15 } c[p,t]=0; #Impossible to program medical check-ups before 09:20
  • subject to restriction0b { p i n 1 . . P } :
  • sum { t i n 61 . . T } c[p,t]=0; #Impossible to program medical check-ups after 13:00
  • subject to restriction0c { p i n 1 . . P } :
  • sum { t i n 16 . . 60 } c[p,t]=1; #Each patient has his medical check-up programmed
  • subject to restriction1 { p i n 1 . . P } :
  • sum { t i n 1 . . T } y[p,t]=1; #At scenario 1, each patient begins his treatment
  • subject to restriction1b { p i n 1 . . P } :
  • sum { t i n 1 . . T } f[p,t]=1; #At scenario 2, idem
  • subject to restriction1c { p i n 1 . . P } :
  • sum { t i n 1 . . T } x[p,t]=1; #At scenario 3, idem
  • subject to restriction1d { p i n 1 . . P } :
  • sum { t i n 1 . . T } z[p,t]=1; #At scenario 4, idem
  • subject to restriction2 {p in 1..P}:
  • (sum{t in 1..T}(t*y[p,t]))-(sum{t in 1..T}(t*c[p,t]))-q-1≥0;
  • #Each chemotherapy treatment begins after substances are ready and after the medical check-up is finished (scenario 1)
  • subject to restriction2b {p in 1..P}:
  • (sum{t in 1..T}(t*f[p,t]))-(sum{t in 1..T}(t*c[p,t]))-u-1≥0; #At scenario 2, idem
  • subject to restriction2c {p in 1..P}:
  • (sum{t in 1..T}(t*x[p,t]))-(sum{t in 1..T}(t*c[p,t]))-v-1≥0; #At scenario 3, idem
  • subject to restriction2d {p in 1..P}:
  • (sum{t in 1..T}(t*z[p,t]))-(sum{t in 1..T}(t*c[p,t]))-s-1≥0; #At scenario 4, idem
  • subject to restriction3 {t in 1..T}:
  • sum{p in 1..P, a in max(1,t-l[p]+1)..t} y[p,a]≤K; #At scenario 1, there aren’t more ongoing treatments than chairs
  • subject to restriction3b {t in 1..T}:
  • sum{p in 1..P, a in max(1,t-l[p]+1)..t} f[p,a]≤K; #At scenario 2, idem
  • subject to restriction3c {t in 1..T}:
  • sum{p in 1..P, a in max(1,t-l[p]+1)..t} x[p,a]≤K; #At scenario 3, idem
  • subject to restriction3d {t in 1..T}:
  • sum{p in 1..P, a in max(1,t-l[p]+1)..t} z[p,a]≤K; #At scenario 4, idem
  • subject to restriction4 {t in 1..T}:
  • sum{p in 1..P}((1-1/M)*y[p,t])≤Ndisp[t]; #At scenario 1, nurses can begin one treatment for time interval
  • subject to restriction4b {t in 1..T}:
  • sum{p in 1..P}((1-1/M)*f[p,t])≤Ndisp[t]; #At scenario 2, idem
  • subject to restriction4c {t in 1..T}:
  • sum{p in 1..P}((1-1/M)*x[p,t])≤Ndisp[t]; #At scenario 3, idem
  • subject to restriction4d {t in 1..T}:
  • sum{p in 1..P}((1-1/M)*z[p,t])≤Ndisp[t]; #At scenario 4, idem
  • subject to restriction5 {t in 1..T}:
  • sum{p in 1..P}((1/M)*(sum{a in max(1,t-l[p]+1)..t}y[p,a]))≤Ndisp[t];
    #At each time interval, it is not possible to have more than 16 ongoing treatments for each available nurse (scenario 1)
  • subject to restriction5b {t in 1..T}:
  • sum{p in 1..P}((1/M)*(sum{a in max(1,t-l[p]+1)..t}f[p,a]))≤Ndisp[t]; #At scenario 2, idem
  • subject to restriction5c {t in 1..T}:
  • sum{p in 1..P}((1/M)*(sum{a in max(1,t-l[p]+1)..t}x[p,a]))≤Ndisp[t]; #At scenario 3, idem
  • subject to restriction5d {t in 1..T}:
  • sum{p in 1..P}((1/M)*(sum{a in max(1,t-l[p]+1)..t}z[p,a]))≤Ndisp[t]; #At scenario 4, idem
  • subject to restriction6 {t in 16..60}:
  • sum{p in E1, a in t..t+2} c[p,t]≤3; #Cancer type I medical specialists can only handle 1 patient per 15 min
  • subject to restriction6b {t in 16..60}:
  • sum{p in E2, a in t..t+2} c[p,t]≤3; #Cancer type II idem
  • subject to restriction6c {t in 16..60}:
  • sum{p in E3, a in t..t+2} c[p,t]≤3; #Cancer type III idem
  • #Following constraints ensure that every 15 min the number of starting treatments do not exceed nurses working capacity:
  • subject to restriction7 {t in 1..24}:
  • sum{p in 1..P, a in t..t+2} y[p,a]≤5;
  • subject to restriction7b {t in 1..24}:
  • sum{p in 1..P, a in t..t+2} f[p,a]≤5;
  • subject to restriction7c {t in 1..24}:
  • sum{p in 1..P, a in t..t+2} x[p,a]≤5;
  • subject to restriction7d {t in 1..24}:
  • sum{p in 1..P, a in t..t+2} z[p,a]≤5;
  • subject to restriction8 {t in 25..84}:
  • sum{p in 1..P, a in t..t+2} y[p,a]≤6;
  • subject to restriction8b {t in 25..84}:
  • sum{p in 1..P, a in t..t+2} f[p,a]≤6;
  • subject to restriction8c {t in 25..84}:
  • sum{p in 1..P, a in t..t+2} x[p,a]≤6;
  • subject to restriction8d {t in 25..84}:
  • sum{p in 1..P, a in t..t+2} z[p,a]≤6;
  • subject to restriction9 {t in 85..108}:
  • sum{p in 1..P, a in t..t+2} y[p,a]≤3;
  • subject to restriction9b {t in 85..108}:
  • sum{p in 1..P, a in t..t+2} f[p,a]≤3;
  • subject to restriction9c {t in 85..108}:
  • sum{p in 1..P, a in t..t+2} x[p,a]≤3;
  • subject to restriction9d {t in 85..108}:
  • sum{p in 1..P, a in t..t+2} z[p,a]≤3;
  • subject to restriction10 {t in 109..165}:
  • sum{p in 1..P, a in t..t+2} y[p,a]≤2;
  • subject to restriction10b {t in 109..165}:
  • sum{p in 1..P, a in t..t+2} f[p,a]≤2;
  • subject to restriction10c {t in 109..165}:
  • sum{p in 1..P, a in t..t+2} x[p,a]≤2;
  • subject to restriction10d {t in 109..165}:
  • sum{p in 1..P, a in t..t+2} z[p,a]≤2;

References

  1. Alvarado, M.M.; Cotton, T.G.; Ntaimo, L.; Pérez, E.; Carpentier, W.R. Modeling and simulation of oncology clinic operations in discrete event system specification. Simulation 2018, 94, 105–121. [Google Scholar] [CrossRef]
  2. Brozos-Vázquez, E. Patients´ satisfaction when visiting day Hospital in Santiago de Compostela. Presented at the 1st Oncology Quality Care Symposium “Towards Excellence in Oncology Care”, Madrid, Spain, 15–16 November 2019. [Google Scholar]
  3. López-Rodríguez, R. Patient waiting time from the appointment with the oncologist to the administration of intravenous treatment in the University Clinical Hospital of Santiago de Compostela. Presented at the 1st Oncology Quality Care Symposium “Towards Excellence in Oncology Care”, Madrid, Spain, 15–16 November 2019. [Google Scholar]
  4. Ahmadi-Javid, A.; Jalali, Z.; Klassen, K.J. Outpatient appointment systems in healthcare: A review of optimization studies. Eur. J. Oper. Res. 2017, 258, 3–34. [Google Scholar] [CrossRef]
  5. Elleuch, M.A.; Hassena, A.B.; Abdelhedi, M.; Pinto, F.S. Real-time prediction of COVID-19 patients health situations using Artificial Neural Networks and Fuzzy Interval Mathematical modeling. Appl. Soft Comput. 2021, 110, 107643. [Google Scholar] [CrossRef] [PubMed]
  6. Gür, S.; Eren, T.; Alakaş, H.M. Surgical operation scheduling with goal programming and constraint programming: A case study. Mathematics 2019, 7, 251. [Google Scholar] [CrossRef] [Green Version]
  7. Horvat, A.M.; Dudic, B.; Radovanov, B.; Melovic, B.; Sedlak, O.; Davidekova, M. Binary programming model for rostering ambulance crew-relevance for the management and business. Mathematics 2021, 9, 64. [Google Scholar] [CrossRef]
  8. Hanna, T.P.; King, W.D.; Thibodeau, S.; Jalink, M.; Paulin, G.A.; Harvey-Jones, E.; O’Sullivan, D.E.; Booth, C.M.; Sullivan, R.; Aggarwal, A. Mortality due to cancer treatment delay: Systematic review and meta-analysis. BMJ 2020, 371, m4087. [Google Scholar] [CrossRef] [PubMed]
  9. Naiker, U.; FitzGerald, G.; Dulhunty, J.M.; Rosemann, M. Time to wait: A systematic review of strategies that affect out-patient waiting times. Aust. Health Rev. 2018, 42, 286–293. [Google Scholar] [CrossRef]
  10. Williams, M.V.; Drinkwater, K.J.; Jones, A.; O’Sullivan, B.; Tait, D. Waiting times for systemic cancer therapy in the United Kingdom in 2006. Br. J. Cancer 2008, 99, 695–703. [Google Scholar] [CrossRef]
  11. Chan, K.; Li, W.; Medlam, G.; Higgins, J.; Bolderston, A.; Yi, Q.; Wenz, J. Investigating patient wait times for daily outpatient radiotherapy appointments (a single-centre study). J. Med. Imaging Radiat. Sci. 2010, 41, 145–151. [Google Scholar] [CrossRef] [PubMed]
  12. Ahmad, B.A.; Khairatul, K.; Farnaza, A. An assessment of patient waiting and consultation time in a primary healthcare clinic. Malays. Fam. Physician J. 2017, 12, 14–21. [Google Scholar]
  13. Yu, W.; Shen, Z.; Mi, Y. Reducing outpatients’ waiting time in oncology clinic by improving management software. Acad. J. Educ. Res. 2017, 5, 392–398. [Google Scholar]
  14. Turkcan, A.; Zeng, B.; Lawley, M. Chemotherapy operations planning and scheduling. IIE Trans. Healthc. Syst. Eng. 2012, 2, 31–49. [Google Scholar] [CrossRef]
  15. Liang, B.; Turkcan, A.; Ceyhan, M.E.; Stuart, K. Improvement of chemotherapy patient flow and scheduling in an outpatient oncology clinic. Int. J. Prod. Res. 2015, 53, 7177–7190. [Google Scholar] [CrossRef]
  16. Heshmat, M.; Eltawil, A. Solving operational problems in outpatient chemotherapy clinics using mathematical programming and simulation. Ann. Oper. Res. 2019, 298, 289–306. [Google Scholar] [CrossRef]
  17. Hesaraki, A.F.; Dellaert, N.P.; de Kok, T. Generating outpatient chemotherapy appointment templates with balanced flowtime and makespan. Eur. J. Oper. Res. 2019, 275, 304–318. [Google Scholar] [CrossRef]
  18. Benzaid, M.; Lahrichi, N.; Rousseau, L.M. Chemotherapy appointment scheduling and daily outpatient–nurse assignment. Health Care Manag. Sci. 2020, 23, 34–50. [Google Scholar] [CrossRef] [PubMed]
  19. Issabakhsh, M.; Lee, S.; Kang, H. Scheduling patient appointment in an infusion center: A mixed integer robust optimization approach. Health Care Manag. Sci. 2021, 24, 117–139. [Google Scholar] [CrossRef]
  20. Harnpornchai, N.; Autchariyapanitkul, K.; Sirisrisakulchai, J.; Sriboonchitta, S. Optimal outpatient appointment system with uncertain parameters using adaptive-penalty genetic algorithm. J. Adv. Comput. Intell. Intell. Inform. 2015, 19, 585–592. [Google Scholar] [CrossRef]
  21. Castaing, J.; Cohn, A.; Denton, B.; Weizer, A. A stochastic programming approach to reduce patient wait times and overtime in an outpatient infusion center. IIE Trans. Healthc. Syst. Eng. 2016, 6, 111–125. [Google Scholar] [CrossRef]
  22. Leeftink, A.G.; Vliegen, I.M.H.; Hans, E.W. Stochastic integer programming for multi-disciplinary outpatient clinic planning. Health Care Manag. Sci. 2019, 22, 53–67. [Google Scholar] [CrossRef] [Green Version]
  23. Demir, N.B.; Gul, S.; Çelik, M. A stochastic programming approach for chemotherapy appointment scheduling. Nav. Res. Logist. 2021, 68, 112–133. [Google Scholar] [CrossRef]
  24. Liang, B. Chemotherapy Scheduling and Nurse Assignment. Ph.D. Thesis, Northeastern University, Boston, MA, USA, 2015. [Google Scholar]
  25. Yokouchi, M.; Aoki, S.; Sang, H.; Zhao, R.; Takakuwa, S. Operations analysis and appointment scheduling for an outpatient chemotherapy department. In Proceedings of the 2012 Winter Simulation Conference (WSC), Berlin, Germany, 9–12 December 2012; pp. 1–12. [Google Scholar]
  26. Huggins, A.; Claudio, D.; Pérez, E. Improving resource utilization in a cancer clinic: An optimization model. In Proceedings of the 2014 Industrial and Systems Engineering Research Conference, Toronto, ON, Canada, 31 May–3 June 2014. [Google Scholar]
  27. Santibáñez, P.; Chow, V.S.; French, J.; Puterman, M.L.; Tyldesley, S. Reducing patient wait times and improving resource utilization at British Columbia Cancer Agency’s ambulatory care unit through simulation. Health Care Manag. Sci. 2009, 12, 392–407. [Google Scholar] [CrossRef] [PubMed]
  28. Suss, S.; Bhuiyan, N.; Demirli, K.; Batist, G. Toward implementing patient flow in a cancer treatment center to reduce patient waiting time and improve efficiency. J. Oncol. Pract. 2017, 13, 530–537. [Google Scholar] [CrossRef] [PubMed]
  29. Issabakhsh, M. A Simulation-based Optimization Approach for Integrated Outpatient Flow and Medication Management. Ph.D. Thesis, University of Miami, Coral Gables, FL, USA, 2021. [Google Scholar]
  30. Creps, J.; Lotfi, V. A dynamic approach for outpatient scheduling. J. Med. Econ. 2017, 20, 786–787. [Google Scholar] [CrossRef]
  31. Laurainne, P. Optimisation du Parcours Patient en Hôpital de Jour en Oncohématologie par Simulation Intégrée à une Démarche Kaizen. Master’s Thesis, University of Montreal, Montreal, QC, Canada, 2016. [Google Scholar]
  32. Laurainne, P.; Jobin, M.H.; Cordeau, J.F.; Becker, G.; Shanti, A.; Kurtz, J.E.; Gourieux, B. Optimisation du parcours patient en hôpital de jour en oncohématologie par simulation intégrée à une démarche kaizen. Logist. Manag. 2017, 25, 34–42. [Google Scholar] [CrossRef]
  33. Fourer, R.; Gay, D.; Kernighan, B.W. AMPL. A Modeling Language for Mathematical Programming; Thomson: Stamford, CT, USA, 2003. [Google Scholar]
  34. Birge, J.R.; Louveaux, F. Introduction to Stochastic Programming, 2nd ed.; Springer Series in Operations Research and Financial Engineering: New York, NY, USA, 2011. [Google Scholar]
  35. Shapiro, A.; Dentcheva, D.; Ruszczynski, A. Lectures on Stochastic Programming: Modeling and Theory; SIAM: Philadelphia, PA, USA, 2009. [Google Scholar]
  36. Hastie, T.; Tibshirani, R.; Friedmand, J. The Elements of Statistical Learning, 2nd ed.; Springer Series in Statistics: New York, NY, USA, 2008; Volume 1. [Google Scholar]
  37. Verderame, P.M.; Elia, J.A.; Li, J.; Floudas, C.A. Planning and scheduling under uncertainty: A review across multiple sectors. Ind. Eng. Chem. Res. 2010, 49, 3993–4017. [Google Scholar] [CrossRef]
Figure 1. Health Area of Santiago de Compostela, in Spain.
Mathematics 10 00062 g001
Figure 2. Subsequent stages in the circuit of oncology patients after the theoretical instant of the appointment with the oncologist and preceding the moment when their treatment begins.
Mathematics 10 00062 g002
Figure 3. Illustration of the construction of 3 scenarios for patients by means of the k-means algorithm making use of 3 times involved in waiting times.
Mathematics 10 00062 g003
Figure 4. Boxplot and histogram of the oncological check-ups’ delays. Axis X: delay time in minutes. Axis Y: number of patients.
Mathematics 10 00062 g004
Figure 5. Boxplot and histogram of the oncological check-ups’ durations. Axis X: check-ups’ durations in minutes. Axis Y: number of patients.
Mathematics 10 00062 g005
Figure 6. Boxplot and histogram of the durations of substance preparation. Axis X: durations of substance preparation in minutes. Axis Y: number of patients.
Mathematics 10 00062 g006
Figure 7. Boxplot and histogram of the durations of the treatments. Axis X: durations of the treatments in minutes. Axis Y: number of patients.
Mathematics 10 00062 g007
Figure 8. Comparison of the number of oncology treatments in progress actually being performed and those proposed by the deterministic optimization model (120 min of margin) at each point in time on Monday, 11 January 2021. Axis X: time of the day between 8:00 am and 10:00 pm. Axis Y: number of treatments in progress.
Mathematics 10 00062 g008
Figure 9. Time elapsed from the opening of the centre to the start of treatment (blue colour) and treatment duration (red colour) on Monday 11 January 2021: actual data (top) and data proposed by the deterministic model with time margins of 120 min (bottom). Patients have been ordered from down to up from the longest to the shortest treatments. X-axis: time of day between 8:00 and 22:00 h. Y-axis: patient number.
Mathematics 10 00062 g009
Figure 10. Actual oncologist appointment time and stochastic model proposed appointment time for patients on Monday 11 January 2021. X-axis: time of day between 8:00 and 13:00 h. Y-axis: patient number.
Mathematics 10 00062 g010
Table 1. New parameters of the problem, which are incorporated into the stochastic model.
Scenario Scenario Scenario Scenario
1234
Average length of oncology appointments2.64.22.21.8
% of patients in each scenario28.727.236.47.7
Table 2. Total waiting minutes over the different ready times considered provided by the deterministic model.
At Present Model 1 Model 2 Model 3 Model 4 Patients
Monday7339925579006250460056
Tuesday10,38213,37511,6759275711572
Wednesday7351979081906360448061
Thursday5906779063604860336050
Friday5810807566155085355551
Total36,78848,28540,74031,83023,110290
Table 3. Total waiting minutes obtained with the deterministic approach, using Model 1 for the ready times, with different durations of the considered time intervals.
Duration of the Time Intervals:5 min10 min15 min
Monday9255977010,815
Tuesday13,37514,12015,420
Wednesday979010,32010,890
Thursday779081808250
Friday807584709285
Total48,28550,86054,660
Table 4. Treatment duration, actual start time and start time proposed by the deterministic model with 120 min of margin, expressed in number of 5-min periods, for the 56 patients on Monday 11 January 2021.
Patient
Number
Treatment
Duration
Real
Time
Proposed
Time
Patient
Number
Treatment
Duration
Real
Time
Proposed
Time
129726129546050
230654630444647
319554931826561
423778132275957
525564133185445
627505734246650
737505335216745
824465736457453
922575737278461
1030604938135741
1165437639394544
1259497240464250
1382505241288049
1469517442339181
1512665343128065
169806944404144
1712535745493947
1812654346446066
1940554147309067
208826948844252
2121534249398185
2235635550369369
2318656151308458
2418636552226865
2546384453197253
2643383954267041
2745524755248461
288806556615673
Table 5. Average times (minutes) for each scenario designed to apply the stochastic model.
Scenario 1 Scenario 2 Scenario 3 Scenario 4
Check-ups’ delays49141541
Oncological check-ups1321119
Substance preparation634290147
Treatments12577116197
Patients59567516
% Patients28.6%27.2%36.4%7.8%
Table 6. Waiting minutes provided by the stochastic model and with actual procedure.
At Present Stochastic Model Improvement ( % ) Patients
Monday7339602917.7456
Tuesday10,382754427.372
Wednesday7351639213.061
Thursday5906523911.350
Friday581053448.051
Total36,78830,54817.0290
Table 7. Mean value of waiting minutes on Monday, 11 January 2021, waiting time in the randomized experiment realizations, probabilities of each scenario, actual waiting time and computation time (s).
At
Present
Scenario
1
Scenario
2
Scenario
3
Scenario
4
Average
Result
Computing
Time
733965503585638510,9756029215
Probabilities 28.627.236.47.8
Publisher’s Note: MDPI stays neutral with regard to jurisdictional claims in published maps and institutional affiliations.

