

Characterisation of Colorectal Cancer Cell Lines through Proteomic Profiling of Their Extracellular Vesicles
 , and
, and 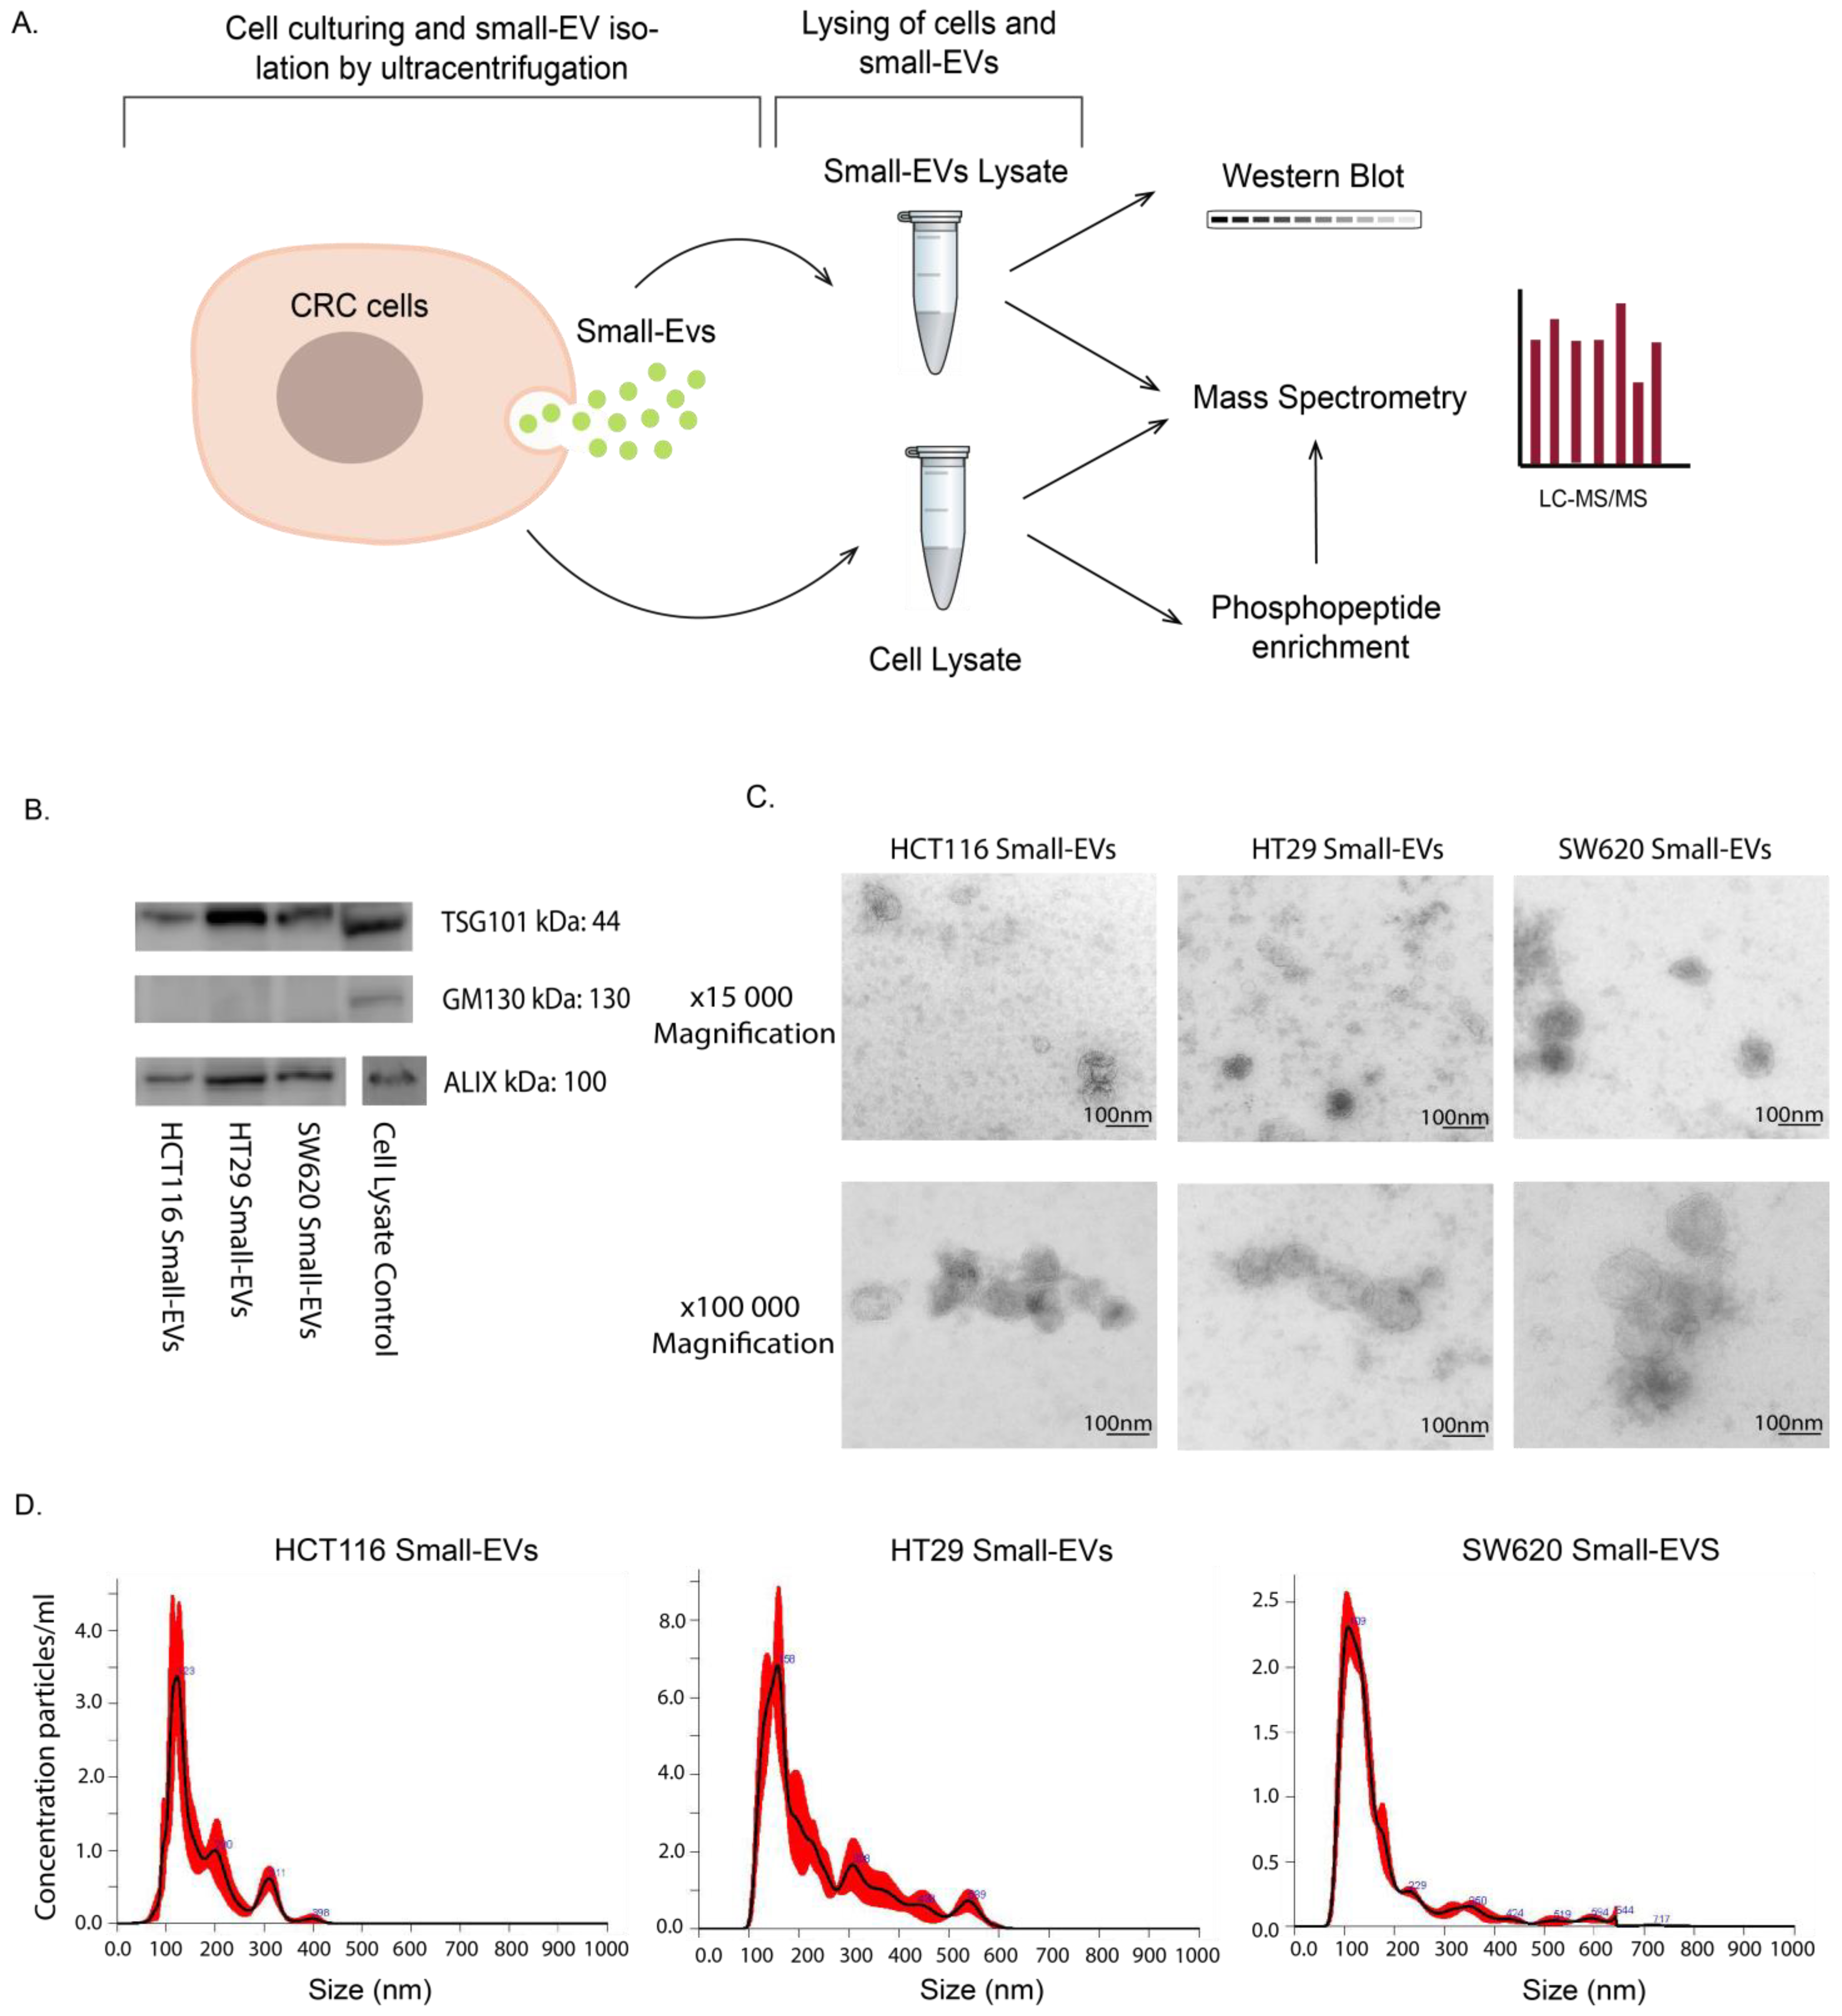
Abstract
:1. Introduction
2. Materials and Methods
2.1. Cell Culture
2.2. sEV Lysate Isolation and Preparation
2.3. Cell Lysate Preparation and Protein Measurement
2.4. Particle Size Determination
2.5. Immunoblotting
2.6. Mass Spectrometry Experimental Setup
2.7. Mass Spectrometry Analysis
2.8. Differentially Expressed Protein Identification
2.9. Data Visualisation
3. Results
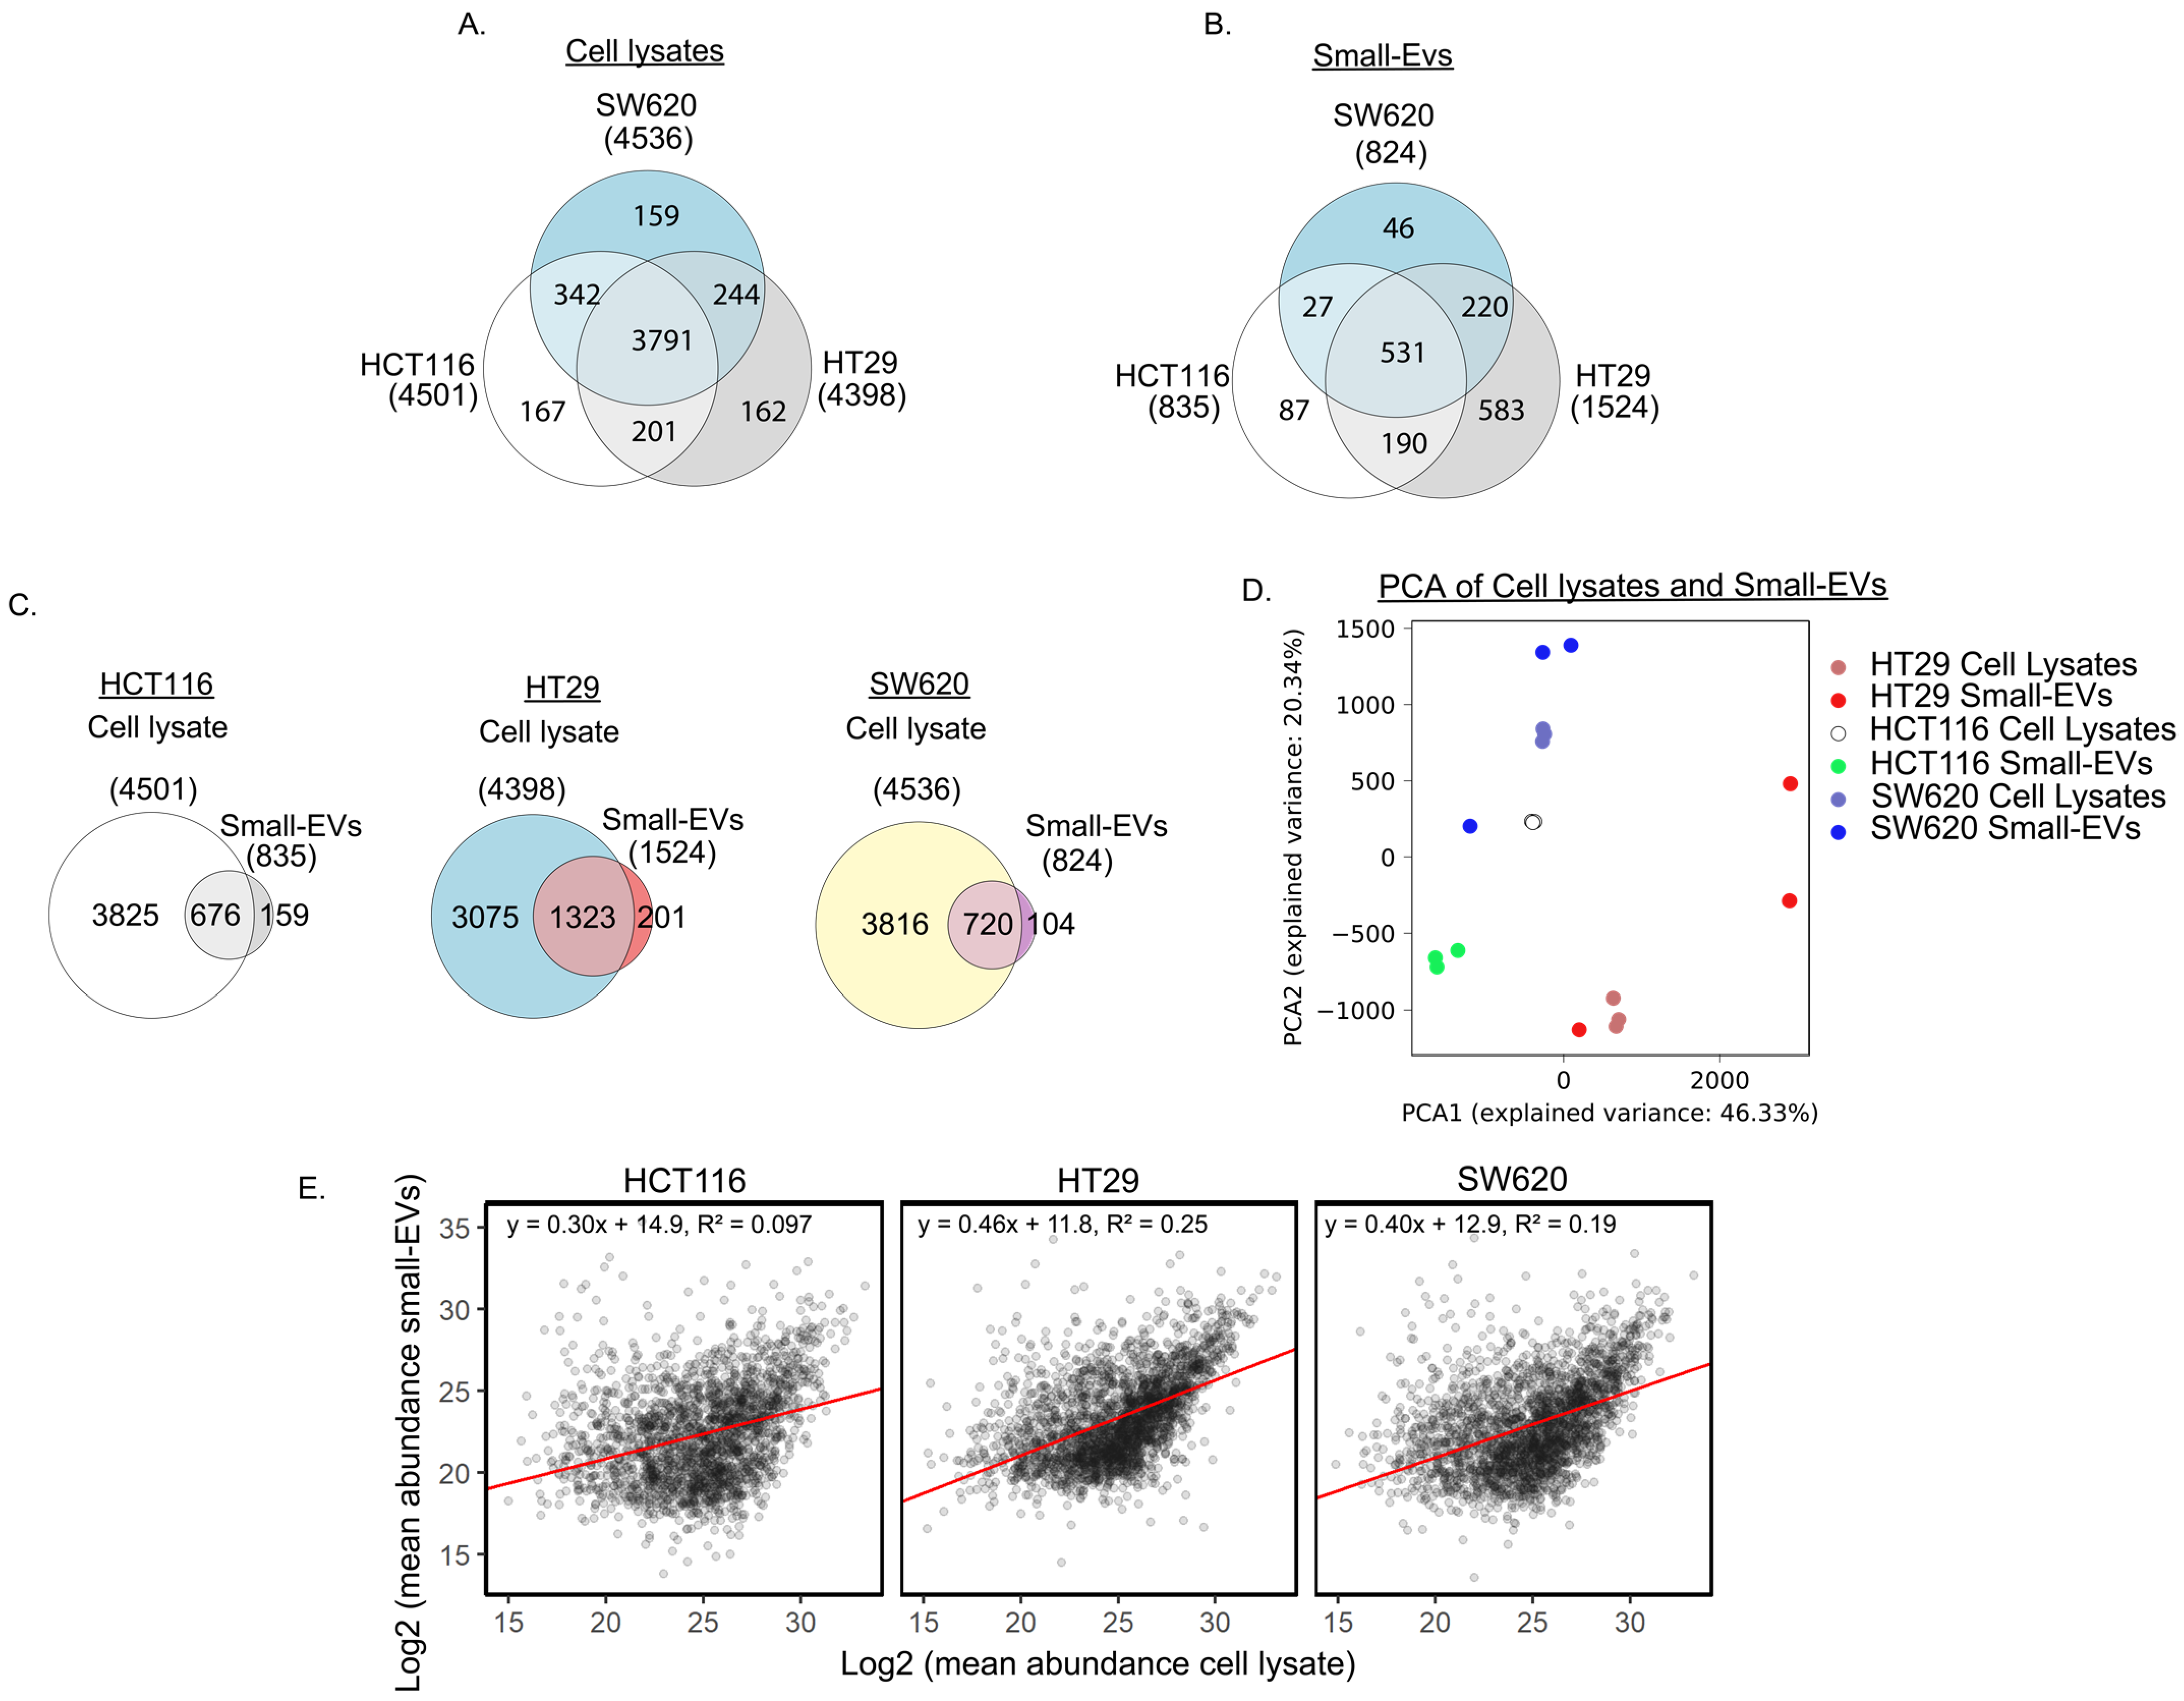
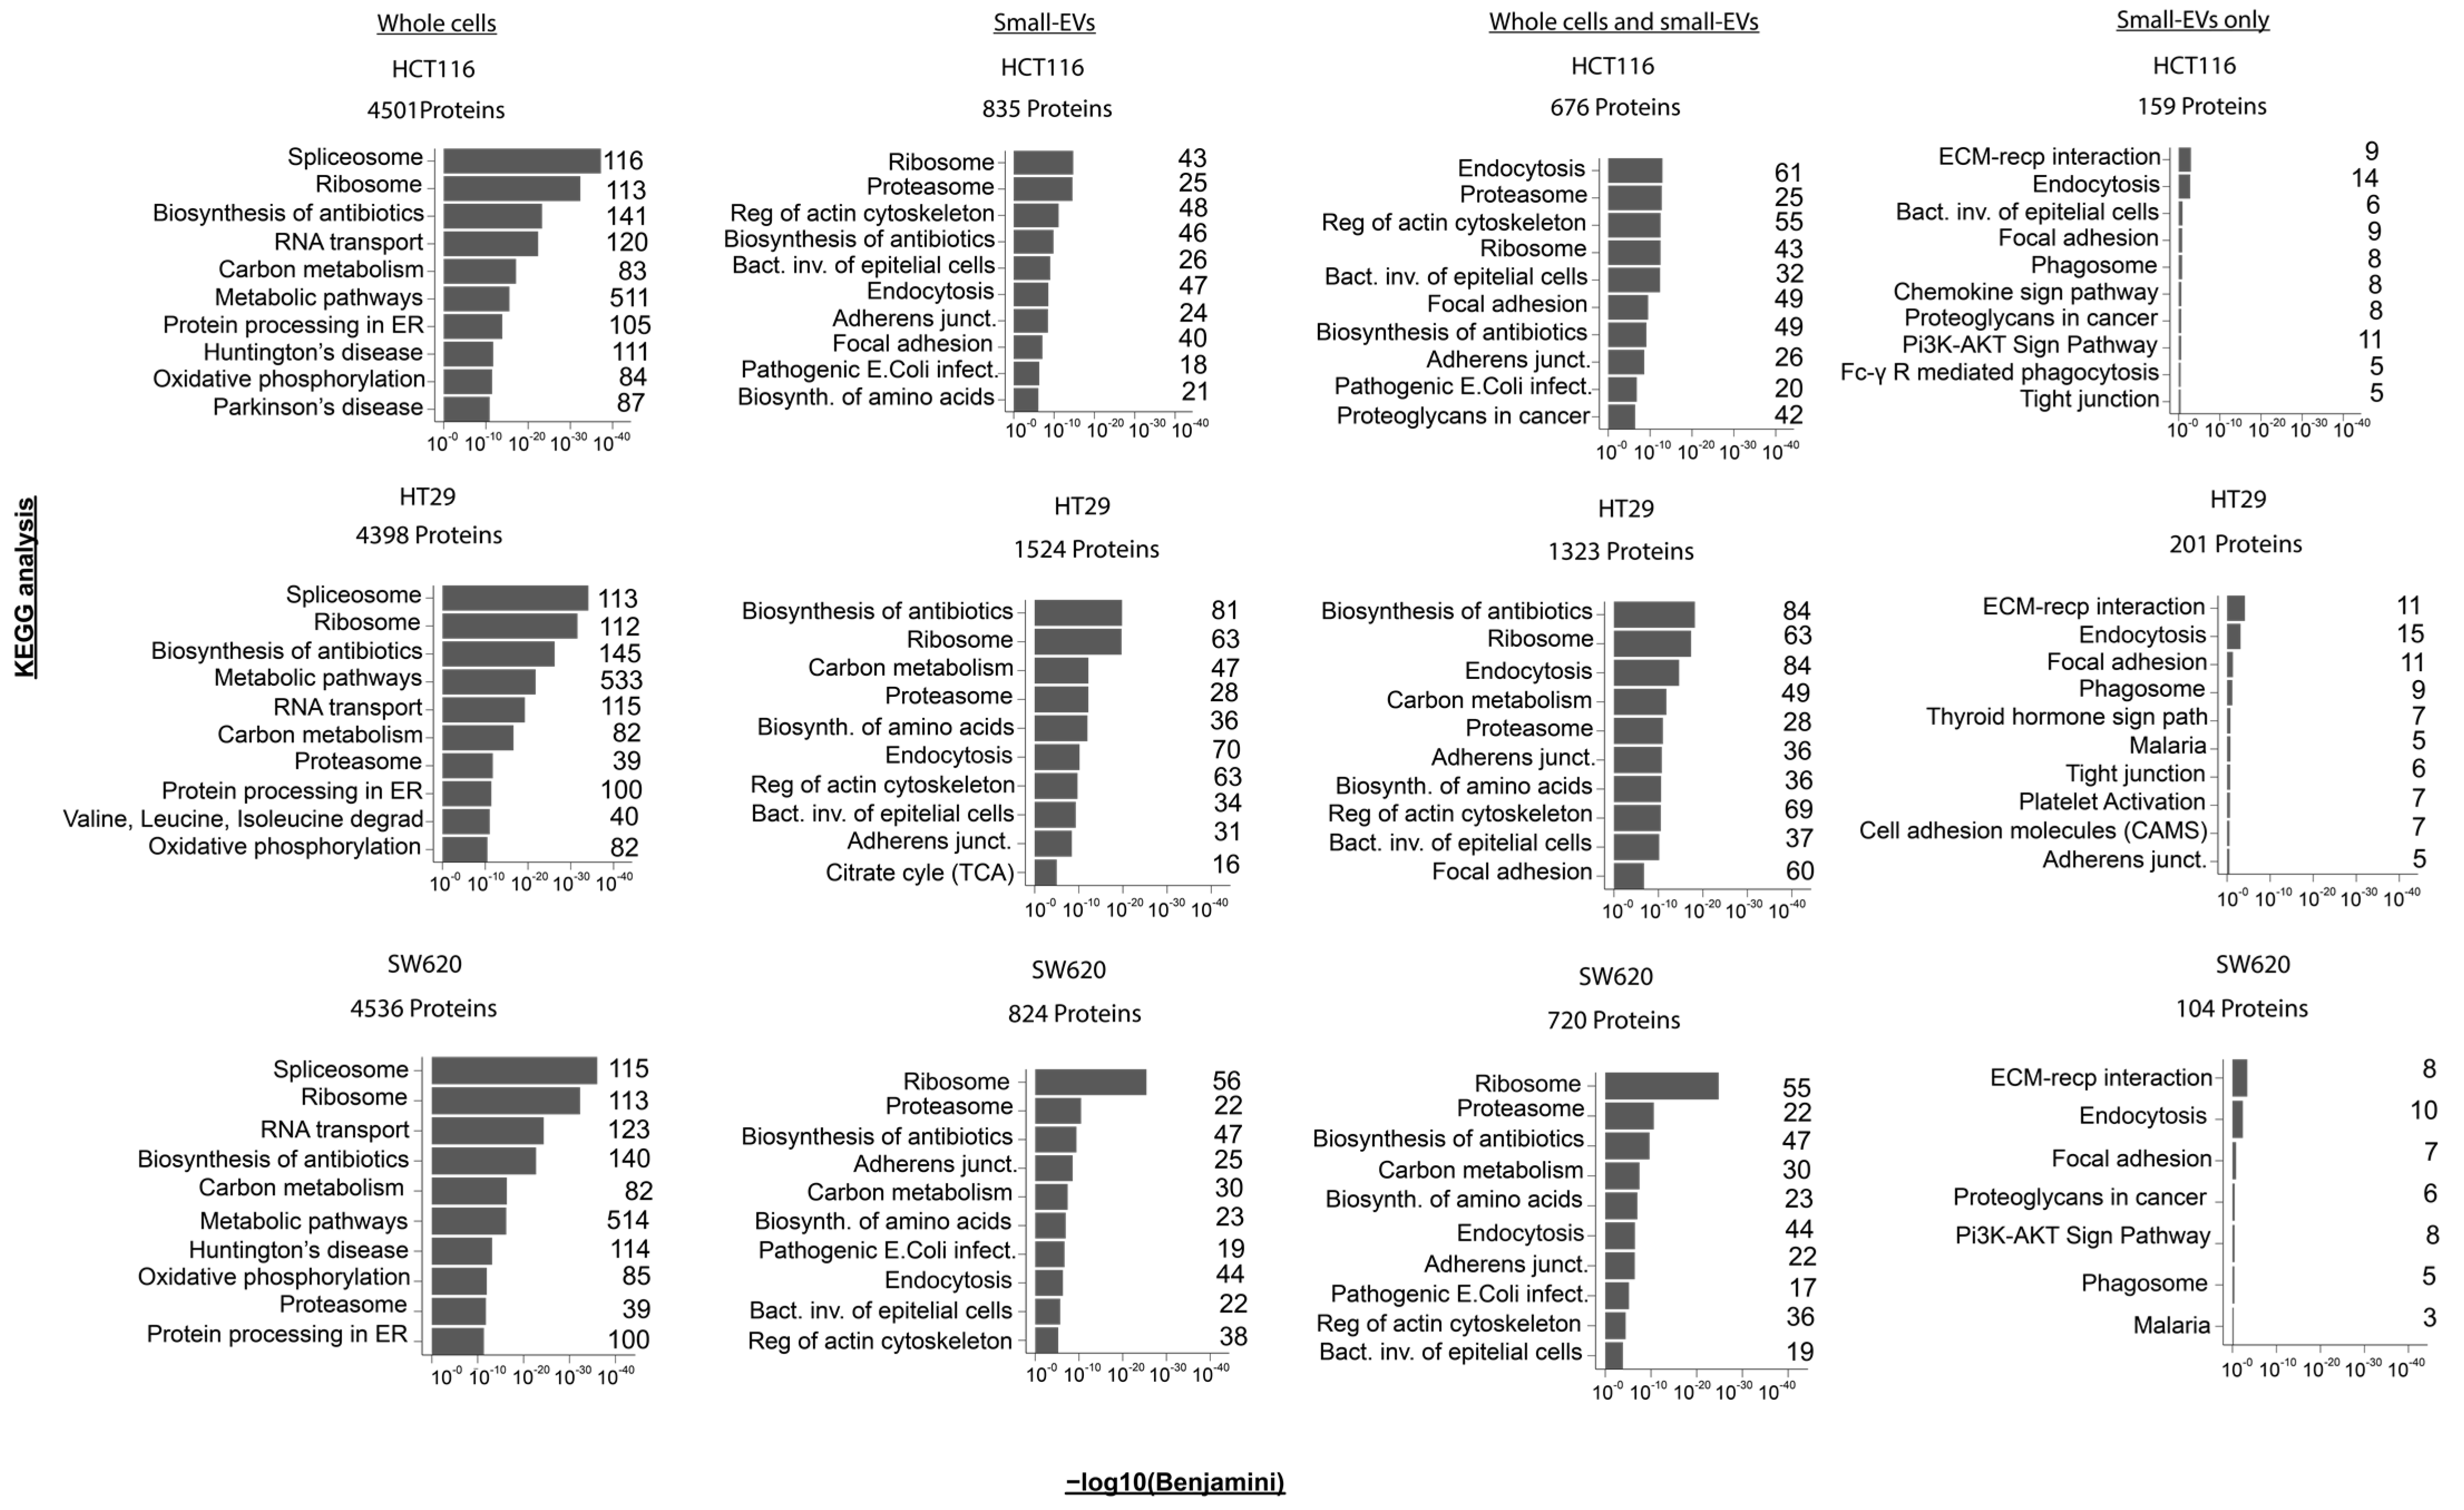
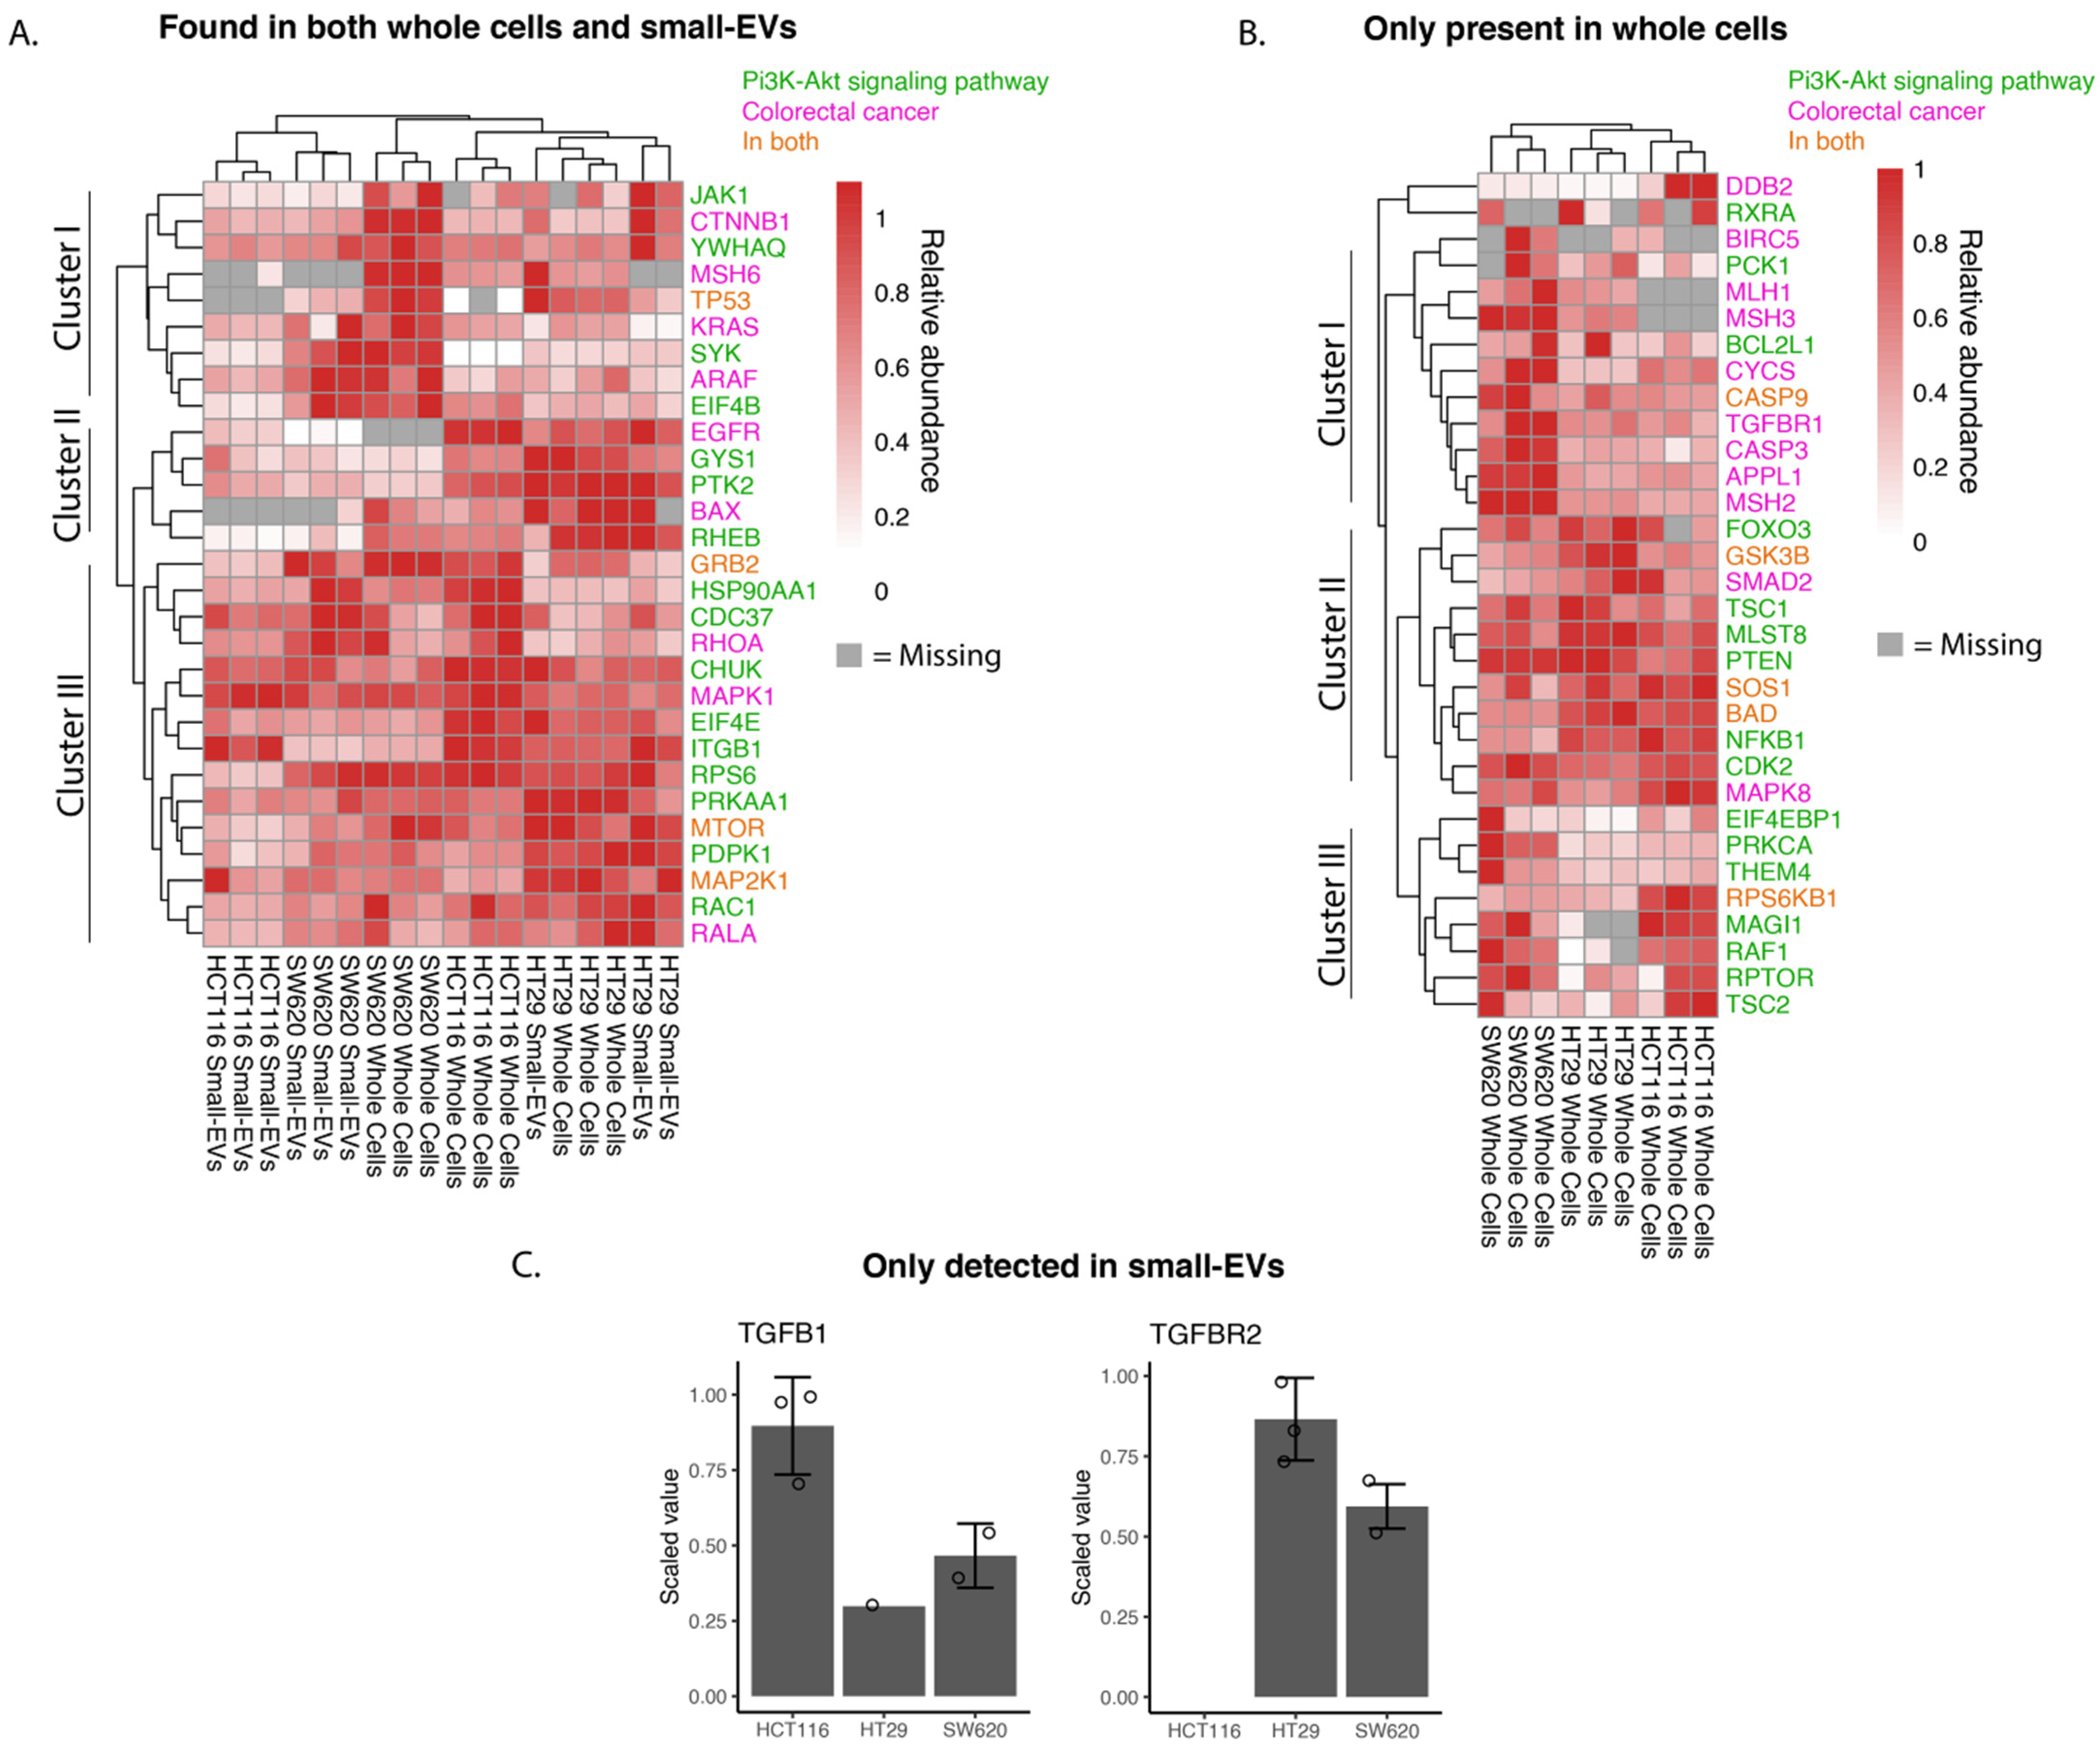
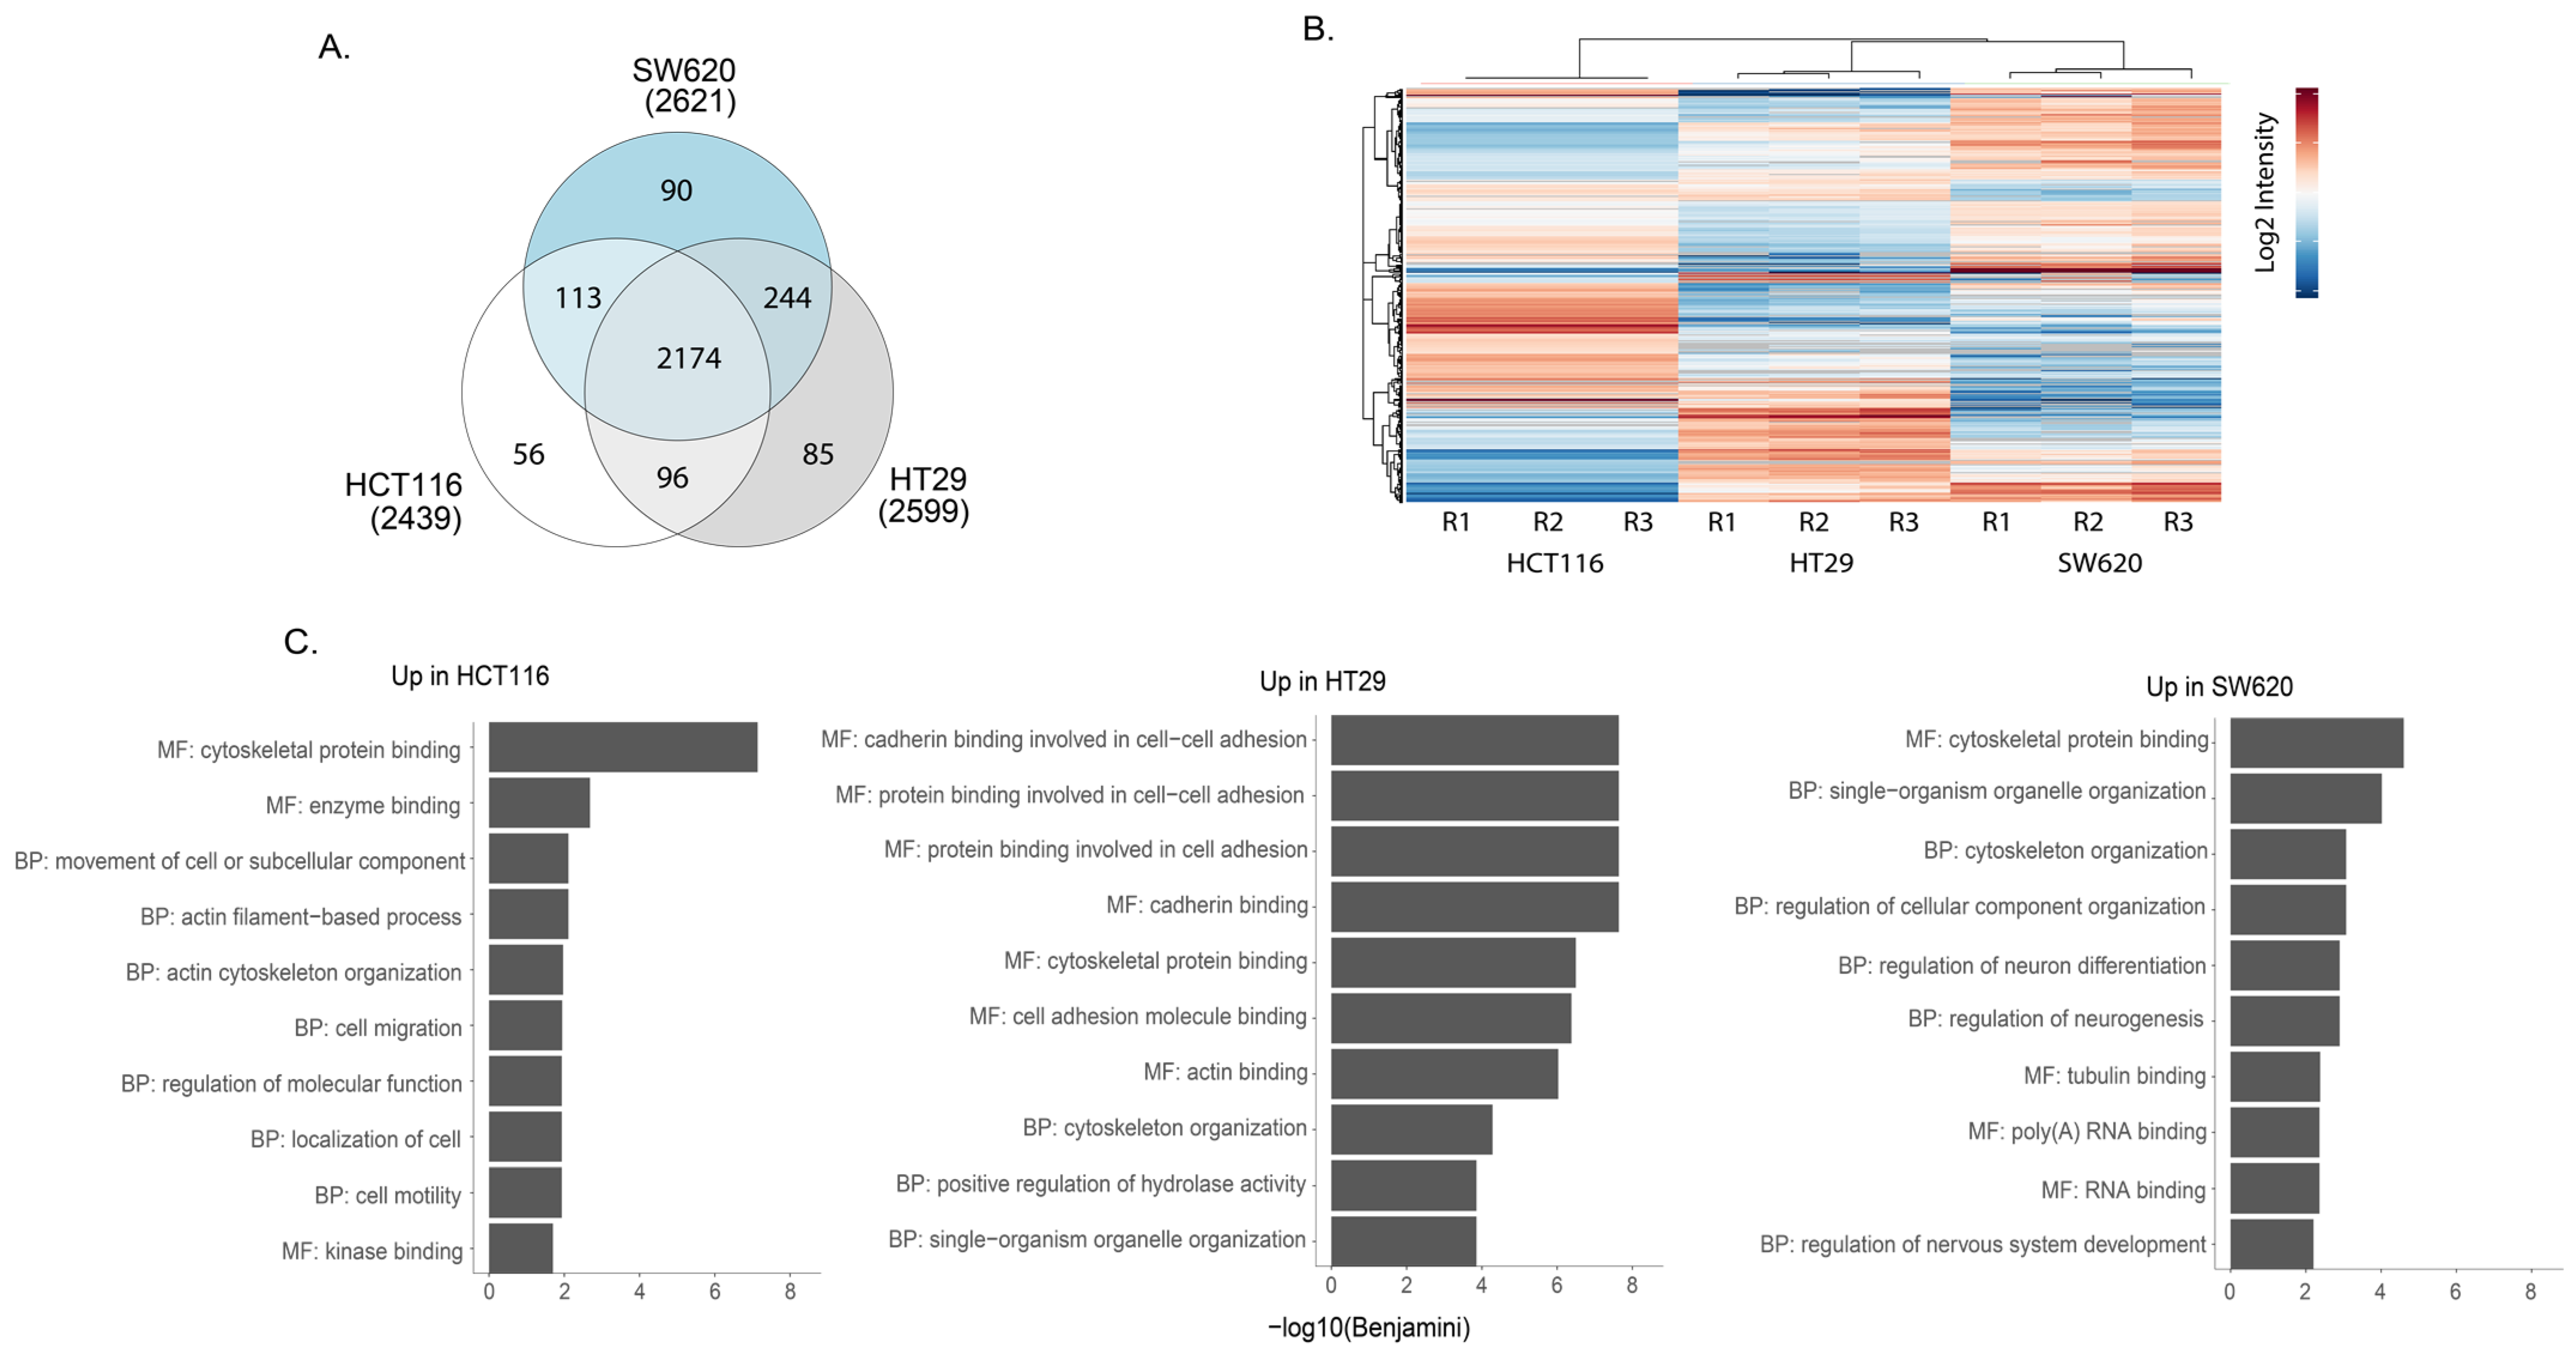
3.1. Proteomic Analysis of CRC Cells and sEVs
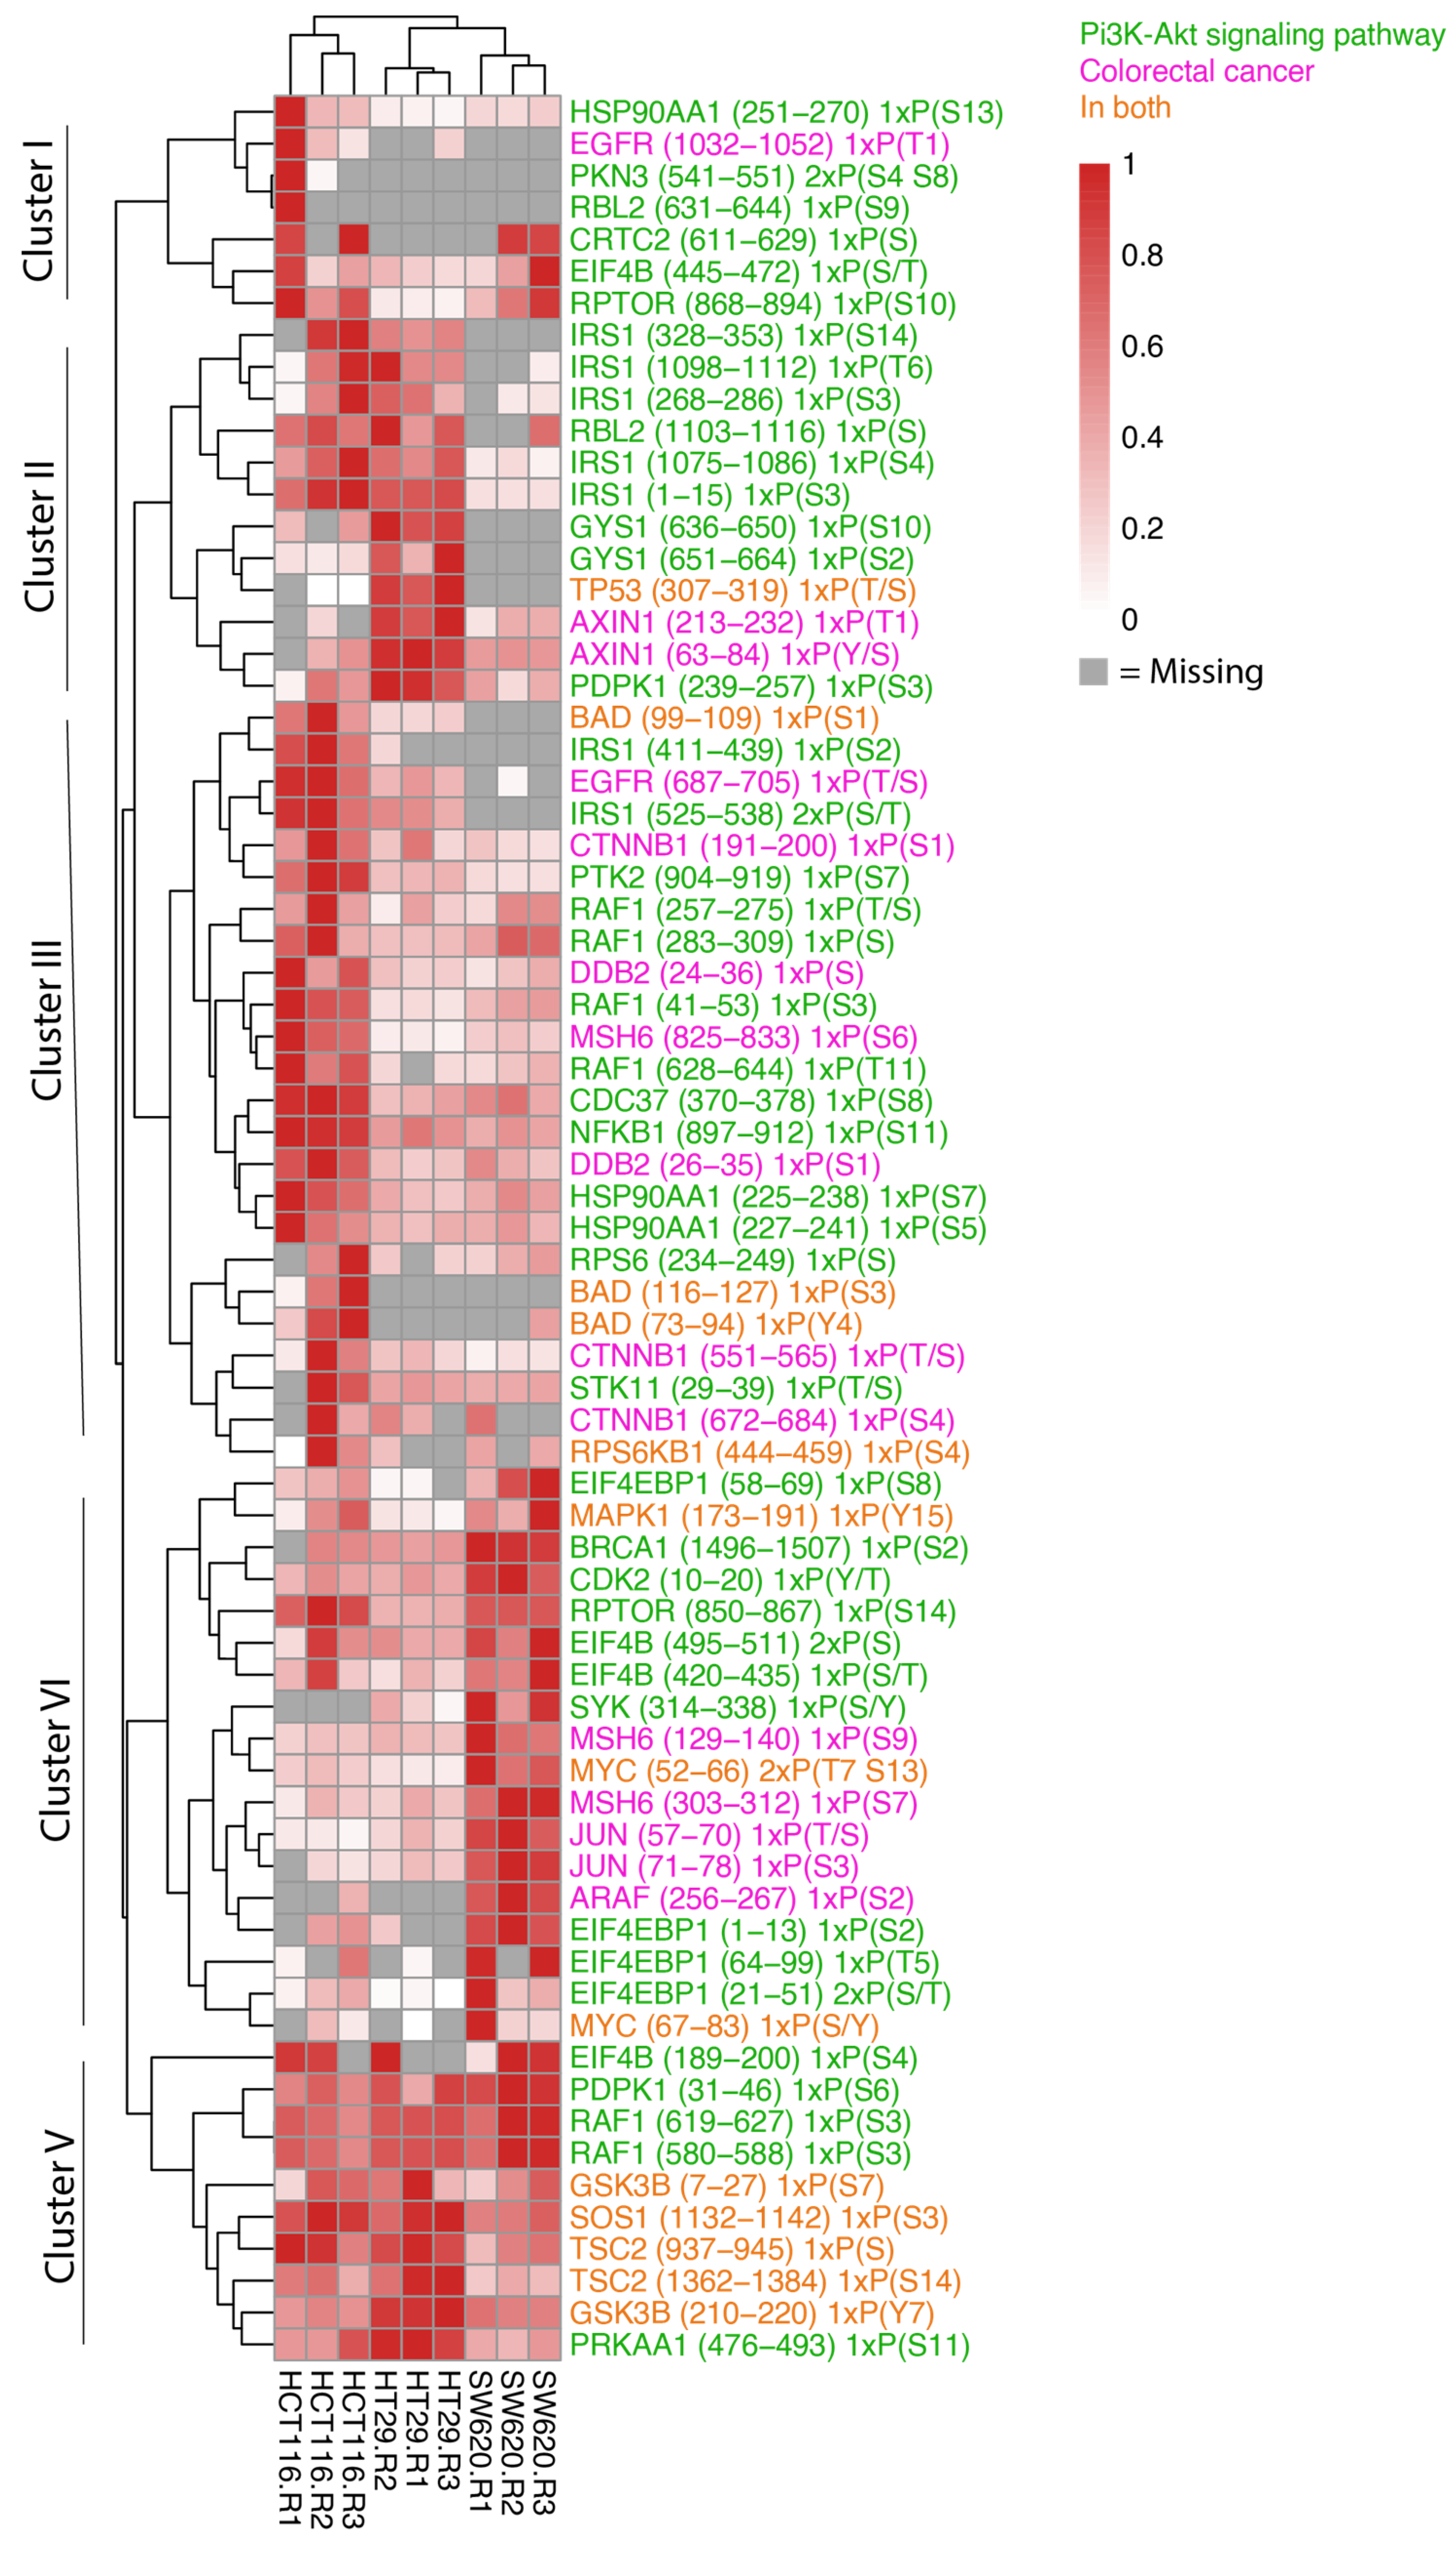
3.2. The HCT116, HT29 and SW620 Phosphoproteome
4. Discussion
5. Conclusions
Supplementary Materials
Author Contributions
Funding
Institutional Review Board Statement
Informed Consent Statement
Data Availability Statement
Acknowledgments
Conflicts of Interest
References
- Mahasneh, A.; Al-Shaheri, F.; Jamal, E. Molecular biomarkers for an early diagnosis, effective treatment and prognosis of colorectal cancer: Current updates. Exp. Mol. Pathol. 2017, 102, 475–483. [Google Scholar] [CrossRef] [PubMed]
- Koveitypour, Z.; Panahi, F.; Vakilian, M.; Peymani, M.; Seyed Forootan, F.; Nasr Esfahani, M.H.; Ghaedi, K. Signaling pathways involved in colorectal cancer progression. Cell Biosci. 2019, 9, 97. [Google Scholar] [CrossRef] [Green Version]
- Xu, R.; Rai, A.; Chen, M.; Suwakulsiri, W.; Greening, D.W.; Simpson, R.J. Extracellular vesicles in cancer—Implications for future improvements in cancer care. Nat. Rev. Clin. Oncol. 2018, 15, 617–638. [Google Scholar] [CrossRef] [PubMed]
- Bhome, R.; Goh, R.W.; Bullock, M.D.; Pillar, N.; Thirdborough, S.M.; Mellone, M.; Mirnezami, R.; Galea, D.; Veselkov, K.; Gu, Q.; et al. Exosomal microRNAs derived from colorectal cancer-associated fibroblasts: Role in driving cancer progression. AGING 2017, 9, 2666. [Google Scholar] [CrossRef] [Green Version]
- Zhang, S.; Zhang, Y.; Qu, J.; Che, X.; Fan, Y.; Hou, K.; Guo, T.; Deng, G.; Song, N.; Li, C.; et al. Exosomes promote cetuximab resistance via the PTEN/Akt pathway in colon cancer cells. Braz. J. Med. Biol. Res. 2017, 51, e6472. [Google Scholar] [CrossRef] [PubMed] [Green Version]
- Kalluri, R. The biology and function of exosomes in cancer. J. Clin. Investig. 2016, 126, 1208–1215. [Google Scholar] [CrossRef]
- Wang, B.; Wang, Y.; Yan, Z.; Sun, Y.; Su, C. Colorectal cancer cell-derived exosomes promote proliferation and decrease apoptosis by activating the ERK pathway. J. Clin. Exp. Pathol. 2019, 12, 2485. [Google Scholar]
- Cheshomi, H.; Matin, M.M. Exosomes and their importance in metastasis, diagnosis, and therapy of colorectal cancer. J. Cell. Biochem. 2018, 120, 2671–2686. [Google Scholar] [CrossRef]
- Hong, B.S.; Cho, J.H.; Kim, H.; Choi, E.J.; Rho, S.; Kim, J.; Choi, D.-S.; Kim, Y.-K.; Hwang, D.; Gho, Y.S. Colorectal cancer cell-derived microvesicles are enriched in cell cycle-related mRNAs that promote proliferation of endothelial cells. BMC Genom. 2009, 10, 556. [Google Scholar] [CrossRef] [Green Version]
- Huang, Z.; Yang, M.; Li, Y.; Yang, F.; Feng, Y. Exosomes Derived from Hypoxic Colorectal Cancer Cells Transfer Wnt4 to Normoxic Cells to Elicit a Prometastatic Phenotype. Int. J. Biol. Sci. 2018, 14, 2094–2102. [Google Scholar] [CrossRef]
- Huang, Z.; Feng, Y. Exosomes Derived From Hypoxic Colorectal Cancer Cells Promote Angiogenesis Through Wnt4-Induced beta-Catenin Signaling in Endothelial Cells. Oncol. Res. 2017, 25, 651–661. [Google Scholar] [CrossRef] [PubMed]
- Park, J.E.; Tan, H.S.; Datta, A.; Lai, R.C.; Zhang, H.; Meng, W.; Lim, S.K.; Sze, S.K. Hypoxic tumor cell modulates its microenvironment to enhance angiogenic and metastatic potential by secretion of proteins and exosomes. Mol. Cell. Proteom. 2010, 9, 1085–1099. [Google Scholar] [CrossRef] [Green Version]
- Lucchetti, D.; Calapa, F.; Palmieri, V.; Fanali, C.; Carbone, F.; Papa, A.; De Maria, R.; De Spirito, M.; Sgambato, A. Differentiation Affects the Release of Exosomes from Colon Cancer Cells and Their Ability to Modulate the Behavior of Recipient Cells. Am. J. Pathol. 2017, 187, 1633–1647. [Google Scholar] [CrossRef] [Green Version]
- Peinado, H.; Aleckovic, M.; Lavotshkin, S.; Matei, I.; Costa-Silva, B.; Moreno-Bueno, G.; Hergueta-Redondo, M.; Williams, C.; García-Santos, G.; Ghajar, C.M.; et al. Melanoma exosomes educate bone marrow progenitor cells toward a pro-metastatic phenotype through MET. Nat. Med. 2012, 18, 883–891. [Google Scholar] [CrossRef] [PubMed] [Green Version]
- Viatour, P.; Merville, M.P.; Bours, V.; Chariot, A. Phosphorylation of NF-kappaB and IkappaB proteins: Implications in cancer and inflammation. Trends Biochem. Sci. 2005, 30, 43–52. [Google Scholar] [CrossRef] [PubMed]
- Singh, V.; Ram, M.; Kumar, R.; Prasad, R.; Roy, B.K.; Singh, K.K. Phosphorylation: Implications in Cancer. Protein J. 2017, 36, 1–6. [Google Scholar] [CrossRef] [PubMed]
- Fang, J.Y.; Richardson, B.C. The MAPK signalling pathways and colorectal cancer. Lancet Oncol. 2005, 6, 322–327. [Google Scholar] [CrossRef]
- Zheng, X.; Xu, K.; Zhou, B.; Chen, T.; Huang, Y.; Li, Q.; Wen, F.; Ge, W.; Wang, J.; Yu, S.; et al. A circulating extracellular vesicles-based novel screening tool for colorectal cancer revealed by shotgun and data-independent acquisition mass spectrometry. J. Extracell. Vesicles 2020, 9, 1750202. [Google Scholar] [CrossRef] [Green Version]
- Lux, A.; Kahlert, C.; Grutzmann, R.; Pilarsky, C. c-Met and PD-L1 on Circulating Exosomes as Diagnostic and Prognostic Markers for Pancreatic Cancer. Int. J. Mol. Sci. 2019, 20, 3305. [Google Scholar] [CrossRef] [Green Version]
- Bairoch, A. The Cellosaurus, a Cell-Line Knowledge Resource. J. Biomol. Technol. 2018, 29, 25–38. [Google Scholar] [CrossRef] [PubMed]
- NCI. Molecular Characterization of the NCI-60 2015 [Updated 05.12.2015]. Available online: https://dtp.cancer.gov/discovery_development/nci-60/characterization.htm (accessed on 2 January 2023).
- Rappsilber, J.; Mann, M.; Ishihama, Y. Protocol for micro-purification, enrichment, pre-fractionation and storage of peptides for proteomics using StageTips. Nat. Protoc. 2007, 2, 1896–1906. [Google Scholar] [CrossRef] [PubMed]
- Zhang, X.; Smits, A.H.; van Tilburg, G.B.; Ovaa, H.; Huber, W.; Vermeulen, M. Proteome-wide identification of ubiquitin interactions using UbIA-MS. Nat. Protoc. 2018, 13, 530–550. [Google Scholar] [CrossRef] [PubMed]
- Larsson, J. eulerr: Area-Proportional Euler and Venn Diagrams with Ellipses. 2022. R-Package. Available online: https://CRAN.R-project.org/package=eulerr (accessed on 7 January 2023).
- Kolde, R. pheatmap: Pretty Heatmaps. 2019. R-Package. Available online: https://cran.r-project.org/package=pheatmap (accessed on 7 January 2023).
- Hoshino, A.; Kim, H.S.; Bojmar, L.; Gyan, K.E.; Cioffi, M.; Hernandez, J.; Zambirinis, C.P.; Rodrigues, G.; Molina, H.; Heissel, S.; et al. Extracellular Vesicle and Particle Biomarkers Define Multiple Human Cancers. Cell 2020, 182, 1044–1061.e18. [Google Scholar] [CrossRef] [PubMed]
- Thery, C.; Witwer, K.W.; Aikawa, E.; Alcaraz, M.J.; Anderson, J.D.; Andriantsitohaina, R.; Antoniou, A.; Arab, T.; Archer, F.; Atkin-Smith, G.K.; et al. Minimal information for studies of extracellular vesicles 2018 (MISEV2018): A position statement of the International Society for Extracellular Vesicles and update of the MISEV2014 guidelines. J. Extracell. Vesicles 2018, 7, 1535750. [Google Scholar] [CrossRef] [Green Version]
- Ren, R.; Sun, H.; Ma, C.; Liu, J.; Wang, H. Colon cancer cells secrete exosomes to promote self-proliferation by shortening mitosis duration and activation of STAT3 in a hypoxic environment. Cell Biosci. 2019, 9, 62. [Google Scholar] [CrossRef] [PubMed]
- Riches, A.; Campbell, E.; Borger, E.; Powis, S. Regulation of exosome release from mammary epithelial and breast cancer cells—A new regulatory pathway. Eur. J. Cancer 2014, 50, 1025–1034. [Google Scholar] [CrossRef] [PubMed]
- Huang, D.W.; Sherman, B.T.; Tan, Q.; Collins, J.R.; Alvord, W.G.; Roayaei, J.; Stephens, R.; Baseler, M.W.; Lane, H.C.; Lempicki, R.A. The DAVID Gene Functional Classification Tool: A novel biological module-centric algorithm to functionally analyze large gene lists. Genome Biol. 2007, 8, R183. [Google Scholar] [CrossRef] [Green Version]
- Zhang, J.; Roberts, T.M.; Shivdasani, R.A. Targeting PI3K signaling as a therapeutic approach for colorectal cancer. Gastroenterology 2011, 141, 50–61. [Google Scholar] [CrossRef]
- Valle, L.; Serena-Acedo, T.; Liyanarachchi, S.; Hampel, H.; Comeras, I.; Li, Z.; Zeng, Q.; Zhang, H.-T.; Pennison, M.J.; Sadim, M.; et al. Germline allele-specific expression of TGFBR1 confers an increased risk of colorectal cancer. Science 2008, 321, 1361–1365. [Google Scholar] [CrossRef] [Green Version]
- Xu, Y.; Pasche, B. TGF-beta signaling alterations and susceptibility to colorectal cancer. Hum. Mol. Genet. 2007, 16, R14–R20. [Google Scholar] [CrossRef] [Green Version]
- Gual, P.; Le Marchand-Brustel, Y.; Tanti, J.F. Positive and negative regulation of insulin signaling through IRS-1 phosphorylation. Biochimie 2005, 87, 99–109. [Google Scholar] [CrossRef] [PubMed]
- Ignatiadis, M.; Sledge, G.W.; Jeffrey, S.S. Liquid biopsy enters the clinic—Implementation issues and future challenges. Nat. Rev. Clin. Oncol. 2021, 18, 297–312. [Google Scholar] [CrossRef] [PubMed]
- Wen, S.W.; Lima, L.G.; Lobb, R.J.; Norris, E.L.; Hastie, M.L.; Krumeich, S.; Möller, A. Breast Cancer-Derived Exosomes Reflect the Cell-of-Origin Phenotype. Proteomics 2019, 19, e1800180. [Google Scholar] [CrossRef] [PubMed]
- Lobb, R.J.; Hastie, M.L.; Norris, E.L.; van Amerongen, R.; Gorman, J.J.; Moller, A. Oncogenic transformation of lung cells results in distinct exosome protein profile similar to the cell of origin. Proteomics 2017, 17, 1600432. [Google Scholar] [CrossRef]
- Stoorvogel, W. Resolving sorting mechanisms into exosomes. Cell Res. 2015, 25, 531–532. [Google Scholar] [CrossRef] [Green Version]
- Villarroya-Beltri, C.; Baixauli, F.; Gutierrez-Vazquez, C.; Sanchez-Madrid, F.; Mittelbrunn, M. Sorting it out: Regulation of exosome loading. Semin. Cancer Biol. 2014, 28, 3–13. [Google Scholar] [CrossRef] [Green Version]
- Fang, Y.; Wu, N.; Gan, X.; Yan, W.; Morrell, J.C.; Gould, S.J. Higher-order oligomerization targets plasma membrane proteins and HIV gag to exosomes. PLoS Biol. 2007, 5, e158. [Google Scholar] [CrossRef] [Green Version]
- Anand, S.; Samuel, M.; Kumar, S.; Mathivanan, S. Ticket to a bubble ride: Cargo sorting into exosomes and extracellular vesicles. Biochim. Biophys. Acta Proteins Proteom. 2019, 1867, 140203. [Google Scholar] [CrossRef]
- Lemieux, E.; Cagnol, S.; Beaudry, K.; Carrier, J.; Rivard, N. Oncogenic KRAS signalling promotes the Wnt/beta-catenin pathway through LRP6 in colorectal cancer. Oncogene 2015, 34, 4914–4927. [Google Scholar] [CrossRef]
- Slattery, M.L.; Mullany, L.E.; Wolff, R.K.; Sakoda, L.C.; Samowitz, W.S.; Herrick, J.S. The p53-signaling pathway and colorectal cancer: Interactions between downstream p53 target genes and miRNAs. Genomics 2019, 111, 762–771. [Google Scholar] [CrossRef]
- Francipane ML, E. mTOR pathway in colorectal cancer an update. Oncotarget 2014, 5, 49–66. [Google Scholar] [CrossRef] [PubMed]
- Soleimani, A.; Rahmani, F.; Ferns, G.A.; Ryzhikov, M.; Avan, A.; Hassanian, S.M. Role of the NF-kappaB signaling pathway in the pathogenesis of colorectal cancer. Gene 2020, 726, 144132. [Google Scholar] [CrossRef] [PubMed]
- Fleming, N.I.; Jorissen, R.N.; Mouradov, D.; Christie, M.; Sakthianandeswaren, A.; Palmieri, M.; Day, F.; Li, S.; Tsui, C.; Lipton, L.; et al. SMAD2, SMAD3 and SMAD4 mutations in colorectal cancer. Cancer Res. 2013, 73, 725–735. [Google Scholar] [CrossRef] [PubMed] [Green Version]
- Urbanelli, L.; Magini, A.; Buratta, S.; Brozzi, A.; Sagini, K.; Polchi, A.; Tancini, B.; Emiliani, C. Signaling pathways in exosomes biogenesis, secretion and fate. Genes 2013, 4, 152–170. [Google Scholar] [CrossRef] [Green Version]
- Maia, J.; Caja, S.; Strano Moraes, M.C.; Couto, N.; Costa-Silva, B. Exosome-Based Cell-Cell Communication in the Tumor Microenvironment. Front. Cell Dev. Biol. 2018, 6, 18. [Google Scholar] [CrossRef] [Green Version]
- Zhang, W.; Zhou, Q.; Wei, Y.; Da, M.; Zhang, C.; Zhong, J.; Liu, J.; Shen, J. The exosome-mediated PI3k/Akt/mTOR signaling. Int. J. Clin. Exp. Pathol. 2019, 12, 2474–2484. [Google Scholar]
- Lafitte, M.; Lecointre, C.; Roche, S. Roles of exosomes in metastatic colorectal cancer. Am. J. Physiol. Cell Physiol. 2019, 317, C869–C880. [Google Scholar] [CrossRef]
- Principe, D.R.; Doll, J.A.; Bauer, J.; Jung, B.; Munshi, H.G.; Bartholin, L.; Pasche, B.; Lee, C.; Grippo, P.J. TGF-beta: Duality of function between tumor prevention and carcinogenesis. J. Natl. Cancer Inst. 2014, 106, djt369. [Google Scholar] [CrossRef]
- Villalba, M.; Evans, S.R.; Vidal-Vanaclocha, F.; Calvo, A. Role of TGF-beta in metastatic colon cancer: It is finally time for targeted therapy. Cell Tissue Res. 2017, 370, 29–39. [Google Scholar] [CrossRef]
- Fricke, F.; Lee, J.; Michalak, M.; Warnken, U.; Hausser, I.; Suarez-Carmona, M.; Halama, N.; Schnölzer, M.; Kopitz, J.; Gebert, J. TGFBR2-dependent alterations of exosomal cargo and functions in DNA mismatch repair-deficient HCT116 colorectal cancer cells. Cell Commun. Signal. 2017, 15, 14. [Google Scholar] [CrossRef] [Green Version]
- Fricke, F.; Michalak, M.; Warnken, U.; Hausser, I.; Schnolzer, M.; Kopitz, J.; Gebert, J. SILAC-Based Quantification of TGFBR2-Regulated Protein Expression in Extracellular Vesicles of Microsatellite Unstable Colorectal Cancers. Int. J. Mol. Sci. 2019, 20, 4162. [Google Scholar] [CrossRef] [PubMed] [Green Version]
- Grady, W.M. Polymerase Slippage Restoration of Frameshifted TGFBR2 in Colorectal Cancer: A Novel Paradigm. Gastroenterology 2015, 148, 1276–1279. [Google Scholar] [CrossRef] [PubMed]
- Cai, X.; Liu, C.; Zhang, T.N.; Zhu, Y.W.; Dong, X.; Xue, P. Down-regulation of FN1 inhibits colorectal carcinogenesis by suppressing proliferation, migration, and invasion. J. Cell Biochem. 2018, 119, 4717–4728. [Google Scholar] [CrossRef] [PubMed]
- Gillies, T.E.; Pargett, M.; Silva, J.M.; Teragawa, C.K.; McCormick, F.; Albeck, J.G. Oncogenic mutant RAS signaling activity is rescaled by the ERK/MAPK pathway. Mol. Syst. Biol. 2020, 16, e9518. [Google Scholar] [CrossRef]
- Kress, T.R.; Raabe, T.; Feller, S.M. High Erk activity suppresses expression of the cell cycle inhibitor p27Kip1 in colorectal cancer cells. Cell Commun. Signal. 2010, 8, 1. [Google Scholar] [CrossRef] [Green Version]
- Boudjadi, S.; Carrier, J.C.; Groulx, J.F.; Beaulieu, J.F. Integrin alpha1beta1 expression is controlled by c-MYC in colorectal cancer cells. Oncogene 2016, 35, 1671–1678. [Google Scholar] [CrossRef] [Green Version]
- Runkle, K.B.; Kharbanda, A.; Stypulkowski, E.; Cao, X.J.; Wang, W.; Garcia, B.A.; Witze, E.S. Inhibition of DHHC20-Mediated EGFR Palmitoylation Creates a Dependence on EGFR Signaling. Mol. Cell. 2016, 62, 385–396. [Google Scholar] [CrossRef] [Green Version]
- Roumeliotis, T.I.; Williams, S.P.; Goncalves, E.; Alsinet, C.; Del Castillo Velasco-Herrera, M.; Aben, N.; Ghavidel, F.Z.; Michaut, M.; Schubert, M.; Price, S.; et al. Genomic Determinants of Protein Abundance Variation in Colorectal Cancer Cells. Cell Rep. 2017, 20, 2201–2214. [Google Scholar] [CrossRef] [Green Version]
- Danielsen, S.A.; Eide, P.W.; Nesbakken, A.; Guren, T.; Leithe, E.; Lothe, R.A. Portrait of the PI3K/AKT pathway in colorectal cancer. Biochim. Biophys. Acta 2015, 1855, 104–121. [Google Scholar] [CrossRef]
- Lan, B.; Zeng, S.; Grutzmann, R.; Pilarsky, C. The Role of Exosomes in Pancreatic Cancer. Int. J. Mol. Sci. 2019, 20, 4332. [Google Scholar] [CrossRef] [Green Version]
- Delom, F.; Chevet, E. Phosphoprotein analysis: From proteins to proteomes. Proteome Sci. 2006, 4, 15. [Google Scholar] [CrossRef] [PubMed] [Green Version]
- Li, C.; Sun, Y.D.; Yu, G.Y.; Cui, J.R.; Lou, Z.; Zhang, H.; Huang, Y.; Bai, C.-G.; Deng, L.-L.; Liu, P.; et al. Integrated Omics of Metastatic Colorectal Cancer. Cancer Cell. 2020, 38, 734–747.e9. [Google Scholar] [CrossRef]
- Lim, L.C.; Lim, Y.M. Proteome Heterogeneity in Colorectal Cancer. Proteomics 2018, 18, 1700169. [Google Scholar] [CrossRef]
- Tiruvayipati, S.; Wolfgeher, D.; Yue, M.; Duan, F.; Andrade, J.; Jiang, H.; Schuger, L. Variability in protein cargo detection in technical and biological replicates of exosome-enriched extracellular vesicles. PLoS ONE 2020, 15, e0228871. [Google Scholar] [CrossRef] [Green Version]
- Doyle, L.M.; Wang, M.Z. Overview of Extracellular Vesicles, Their Origin, Composition, Purpose, and Methods for Exosome Isolation and Analysis. Cells 2019, 8, 727. [Google Scholar] [CrossRef] [PubMed] [Green Version]
- Risha, Y.; Minic, Z.; Ghobadloo, S.M.; Berezovski, M.V. The proteomic analysis of breast cell line exosomes reveals disease patterns and potential biomarkers. Sci. Rep. 2020, 10, 13572. [Google Scholar] [CrossRef] [PubMed]
- Chen, I.H.; Xue, L.; Hsu, C.C.; Paez, J.S.; Pan, L.; Andaluz, H.; Wendt, M.K.; Iliuk, A.B.; Zhu, J.-K.; Tao, W.A. Phosphoproteins in extracellular vesicles as candidate markers for breast cancer. Proc. Natl. Acad. Sci. USA 2017, 114, 3175–3180. [Google Scholar] [CrossRef] [Green Version]
- Gonzales, P.A.; Pisitkun, T.; Hoffert, J.D.; Tchapyjnikov, D.; Star, R.A.; Kleta, R.; Wang, N.S.; Knepper, M.A. Large-scale proteomics and phosphoproteomics of urinary exosomes. J. Am. Soc. Nephrol. 2009, 20, 363–379. [Google Scholar] [CrossRef]


Disclaimer/Publisher’s Note: The statements, opinions and data contained in all publications are solely those of the individual author(s) and contributor(s) and not of MDPI and/or the editor(s). MDPI and/or the editor(s) disclaim responsibility for any injury to people or property resulting from any ideas, methods, instructions or products referred to in the content. |
© 2023 by the authors. Licensee MDPI, Basel, Switzerland. This article is an open access article distributed under the terms and conditions of the Creative Commons Attribution (CC BY) license (https://creativecommons.org/licenses/by/4.0/).
Share and Cite
Heck, K.A.; Lindholm, H.T.; Niederdorfer, B.; Tsirvouli, E.; Kuiper, M.; Flobak, Å.; Lægreid, A.; Thommesen, L. Characterisation of Colorectal Cancer Cell Lines through Proteomic Profiling of Their Extracellular Vesicles. Proteomes 2023, 11, 3. https://doi.org/10.3390/proteomes11010003
Heck KA, Lindholm HT, Niederdorfer B, Tsirvouli E, Kuiper M, Flobak Å, Lægreid A, Thommesen L. Characterisation of Colorectal Cancer Cell Lines through Proteomic Profiling of Their Extracellular Vesicles. Proteomes. 2023; 11(1):3. https://doi.org/10.3390/proteomes11010003
Chicago/Turabian StyleHeck, Kathleen A., Håvard T. Lindholm, Barbara Niederdorfer, Eirini Tsirvouli, Martin Kuiper, Åsmund Flobak, Astrid Lægreid, and Liv Thommesen. 2023. "Characterisation of Colorectal Cancer Cell Lines through Proteomic Profiling of Their Extracellular Vesicles" Proteomes 11, no. 1: 3. https://doi.org/10.3390/proteomes11010003