
Students’ Well-Being Fluctuations during COVID-19—A Matter of Grade, State, or Trait?

Abstract
:1. Introduction
- How do students’ academic, social, and emotional well-being fluctuate over time?
- To what extent are well-being fluctuations determined by contextual (state) factors (such as the pandemic), individual differences (trait), and student maturation (grade)?
2. Materials and Methods
2.1. Survey Data
2.2. Sample
2.3. Analysis
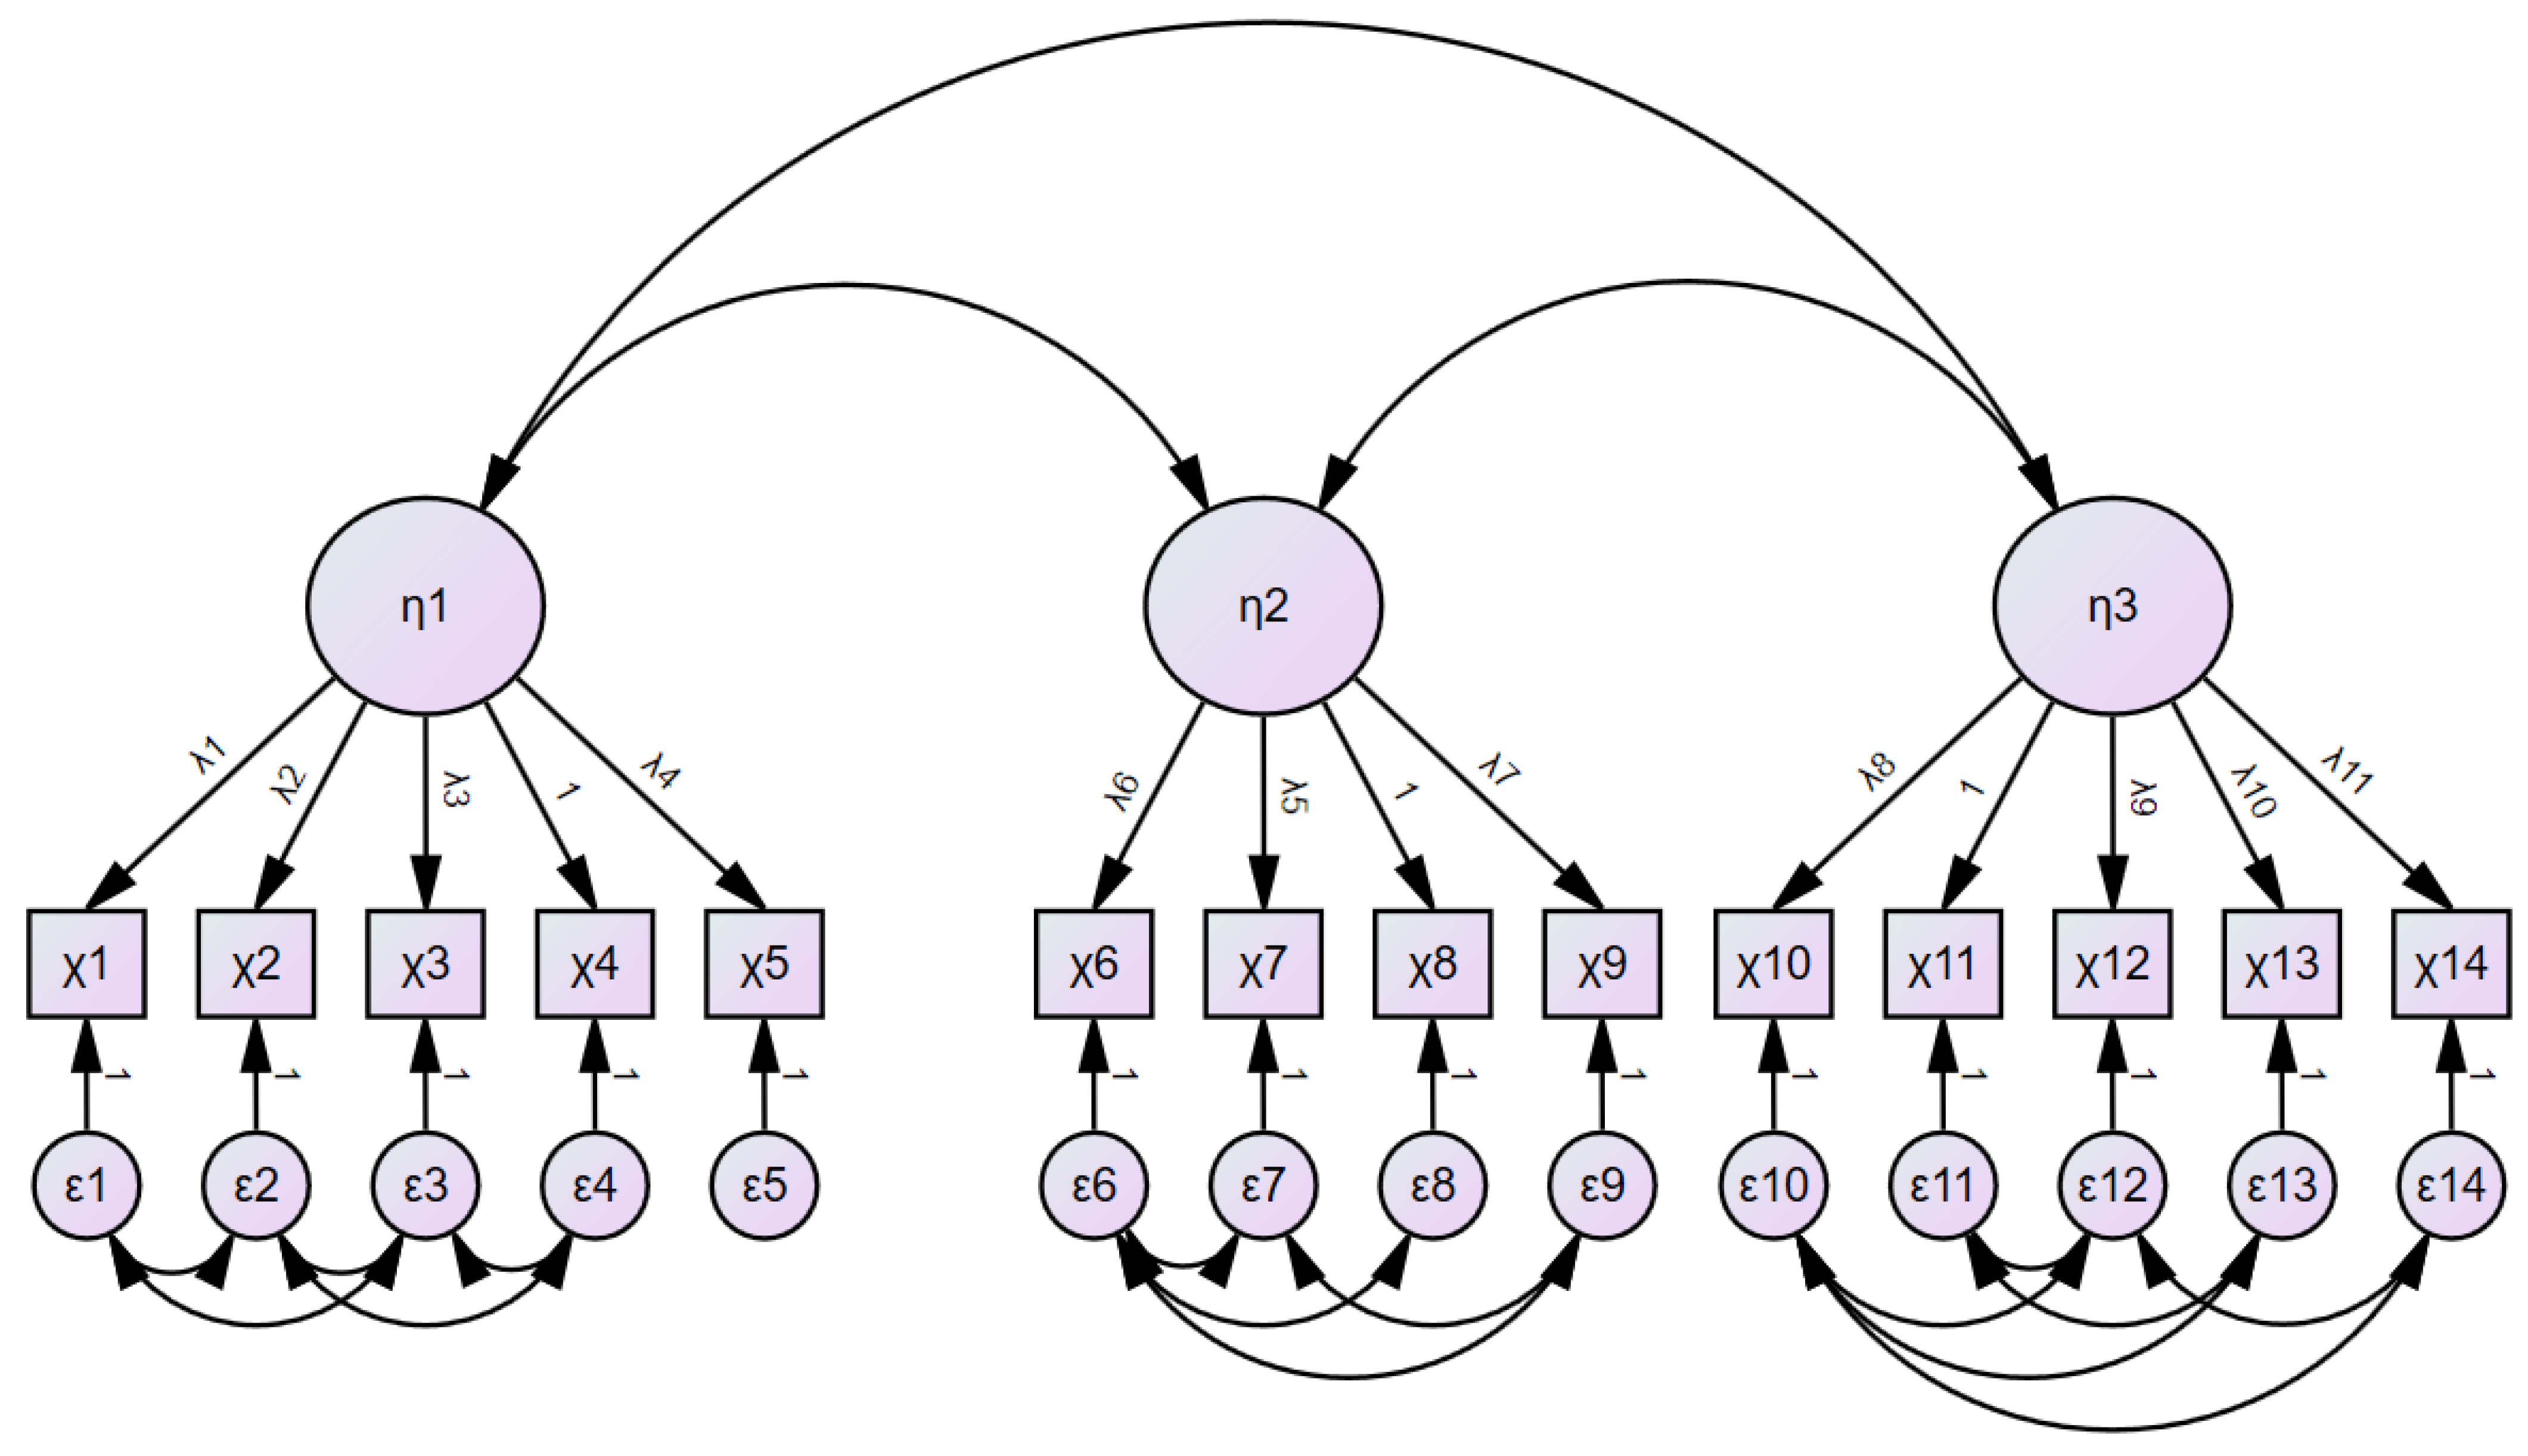
2.3.1. Factor Analysis and Fluctuations
2.3.2. Latent State-Trait Analysis
3. Results and Discussion
3.1. Fluctuations in Students’ Well-Being
3.2. State and/or Trait Dependent Well-Being Fluctuations
4. Conclusions
Author Contributions
Funding
Institutional Review Board Statement
Informed Consent Statement
Data Availability Statement
Conflicts of Interest
Appendix A. Distribution

| Variables | Frequency | Percentage |
|---|---|---|
| Gender | ||
| Male | 381 | 49.2% |
| Female | 384 | 49.6% |
| Other | 9 | 1.2% |
| Total | 774 | 100.0% |
| Grade | ||
| Start grade 1 in 2019 (n = 66) | 66 | 8.53% |
| Start grade 1 in 2018 (n = 198) | 198 | 25.58% |
| Start grade 1 in 2017 (n = 195) | 195 | 25.19% |
| Start grade 1 in 2016 (n = 163) | 163 | 21.06% |
| Start grade 1 in 2015 (n = 59) | 59 | 7.62% |
| Start grade 1 in 2014 (n = 89) | 89 | 11.50% |
| Start grade 1 in 2013 (n = 4) | 4 | 0.52% |
| Total | 774 | 100.0% |
Appendix B. Factor Analysis and Fluctuations
| Model | χ2 | Df | CFI | RMSEA | SRMR |
|---|---|---|---|---|---|
| Model 0-1: Configural/Unconstrained model without item 6 | 919.32 | 59 | 0.961 | 0.069 | 0.054 |
| Model 1-1: Configural/Unconstrained Gender | 912.04 | 118 | 0.963 | 0.047 | 0.052 |
| Model 1-2: Weak invariance Gender | 950.98 | 129 | 0.962 | 0.046 | 0.052 |
| Model 1-3: Strong invariance Gender | 1105.99 | 140 | 0.955 | 0.048 | 0.052 |
| Model 1-4: Strict invariance Gender | 1173.27 | 154 | 0.953 | 0.047 | 0.054 |
| Model 2-1: Configural/Unconstrained Grades | 1319.26 | 354 | 0.955 | 0.030 | 0.045 |
| Model 2-2: Weak invariance Grades | 1430.57 | 409 | 0.953 | 0.029 | 0.051 |
| Model 2-3: Strong invariance Grades | 1820.43 | 464 | 0.937 | 0.031 | 0.057 |
| Model 3-1: Longitudinal Configural/Unconstrained model | 1225.57 | 236 | 0.955 | 0.037 | 0.052 |
| Model 3-2: Longitudinal Weak invariance | 1284.44 | 269 | 0.954 | 0.035 | 0.052 |
| Model 3-3: Longitudinal Strong invariance | 1527.54 | 302 | 0.945 | 0.036 | 0.055 |
| Model 3-4: Longitudinal Strict invariance | 1823.29 | 344 | 0.933 | 0.037 | 0.054 |

| Factor | Item | Std. Loading |
|---|---|---|
| η 1 | Item 1 | 0.750 |
| Item 2 | 0.740 | |
| Item 3 | 0.619 | |
| Item 4 | 0.741 | |
| Item 5 | 0.859 | |
| η 2 | Item 7 | 0.520 |
| Item 9 | 0.785 | |
| Item 10 | 0.817 | |
| Item 11 | 0.727 | |
| η 3 | Item 12 | 0.822 |
| Item 13 | 0.750 | |
| Item 14 | 0.742 | |
| Item 15 | 0.521 | |
| Item 16 | 0.796 |
| CR | AVE | MSV | Cor. H 1 | Cor. H 2 | Cor. H 3 | |
|---|---|---|---|---|---|---|
| η 1-1 | 0.850 | 0.535 | 0.697 | 0.732 | ||
| η 2-1 | 0.796 | 0.501 | 0.697 | 0.835 | 0.708 | |
| η 3-1 | 0.840 | 0.520 | 0.288 | 0.410 | 0.537 | 0.721 |
| η 1-2 | 0.846 | 0.525 | 0.637 | 0.725 | ||
| η 2-2 | 0.797 | 0.503 | 0.637 | 0.798 | 0.709 | |
| η 3-2 | 0.840 | 0.517 | 0.370 | 0.489 | 0.608 | 0.719 |
| η 1-3 | 0.861 | 0.555 | 0.637 | 0.745 | ||
| η 2-3 | 0.821 | 0.538 | 0.637 | 0.798 | 0.734 | |
| η 3-3 | 0.858 | 0.553 | 0.480 | 0.515 | 0.693 | 0.743 |
| η 1-4 | 0.877 | 0.590 | 0.728 | 0.768 | ||
| η 2-4 | 0.821 | 0.540 | 0.728 | 0.853 | 0.735 | |
| η 3-4 | 0.875 | 0.588 | 0.389 | 0.484 | 0.624 | 0.767 |
| Levene Statistic | Degrees of Freedom | ||||
|---|---|---|---|---|---|
| Sample | Factor | Mean | Trimmed Mean | Df1 | Df2 |
| Full Sample (n = 774) | Academic well-being | 1.953 | 1.985 | 3 | 3092 |
| Emotional well-being | 2.457 | 2.406 | 3 | 3092 | |
| Social well-being | 0.655 | 0.651 | 3 | 3092 | |
| Start grade 1 in 2019 (n = 66) | Academic well-being | 0.219 | 0.211 | 3 | 260 |
| Emotional well-being | 2.956 * | 2.902 * | 3 | 260 | |
| Social well-being | 0.799 | 0.775 | 3 | 260 | |
| Start grade 1 in 2018 (n = 198) | Academic well-being | 0.738 | 0.738 | 3 | 788 |
| Emotional well-being | 1.517 | 1.599 | 3 | 788 | |
| Social well-being | 0.064 | 0.066 | 3 | 788 | |
| Start grade 1 in 2017 (n = 195) | Academic well-being | 2.529 | 2.513 | 3 | 766 |
| Emotional well-being | 2.179 | 2.097 | 3 | 766 | |
| Social well-being | 2.262 | 2.180 | 3 | 766 | |
| Start grade 1 in 2016 (n = 163) | Academic well-being | 0.392 | 0.359 | 3 | 648 |
| Emotional well-being | 2.632 * | 2.572 | 3 | 648 | |
| Social well-being | 0.580 | 0.594 | 3 | 648 | |
| Start grade 1 in 2015 (n = 59) | Academic well-being | 0.489 | 0.504 | 3 | 232 |
| Emotional well-being | 1.010 | 0.915 | 3 | 232 | |
| Social well-being | 1.121 | 1.070 | 3 | 232 | |
| Start grade 1 in 2014 (n = 89) | Academic well-being | 4.089 ** | 4.095 ** | 3 | 352 |
| Emotional well-being | 0.703 | 0.707 | 3 | 352 | |
| Social well-being | 0.467 | 0.457 | 3 | 352 | |
| Survey Round True-Mean Differences between Pairings | |||||||
|---|---|---|---|---|---|---|---|
| Sample | Factor | 1 vs. 2 | 1 vs. 3 | 1 vs. 4 | 2 vs. 3 | 2 vs. 4 | 3 vs. 4 |
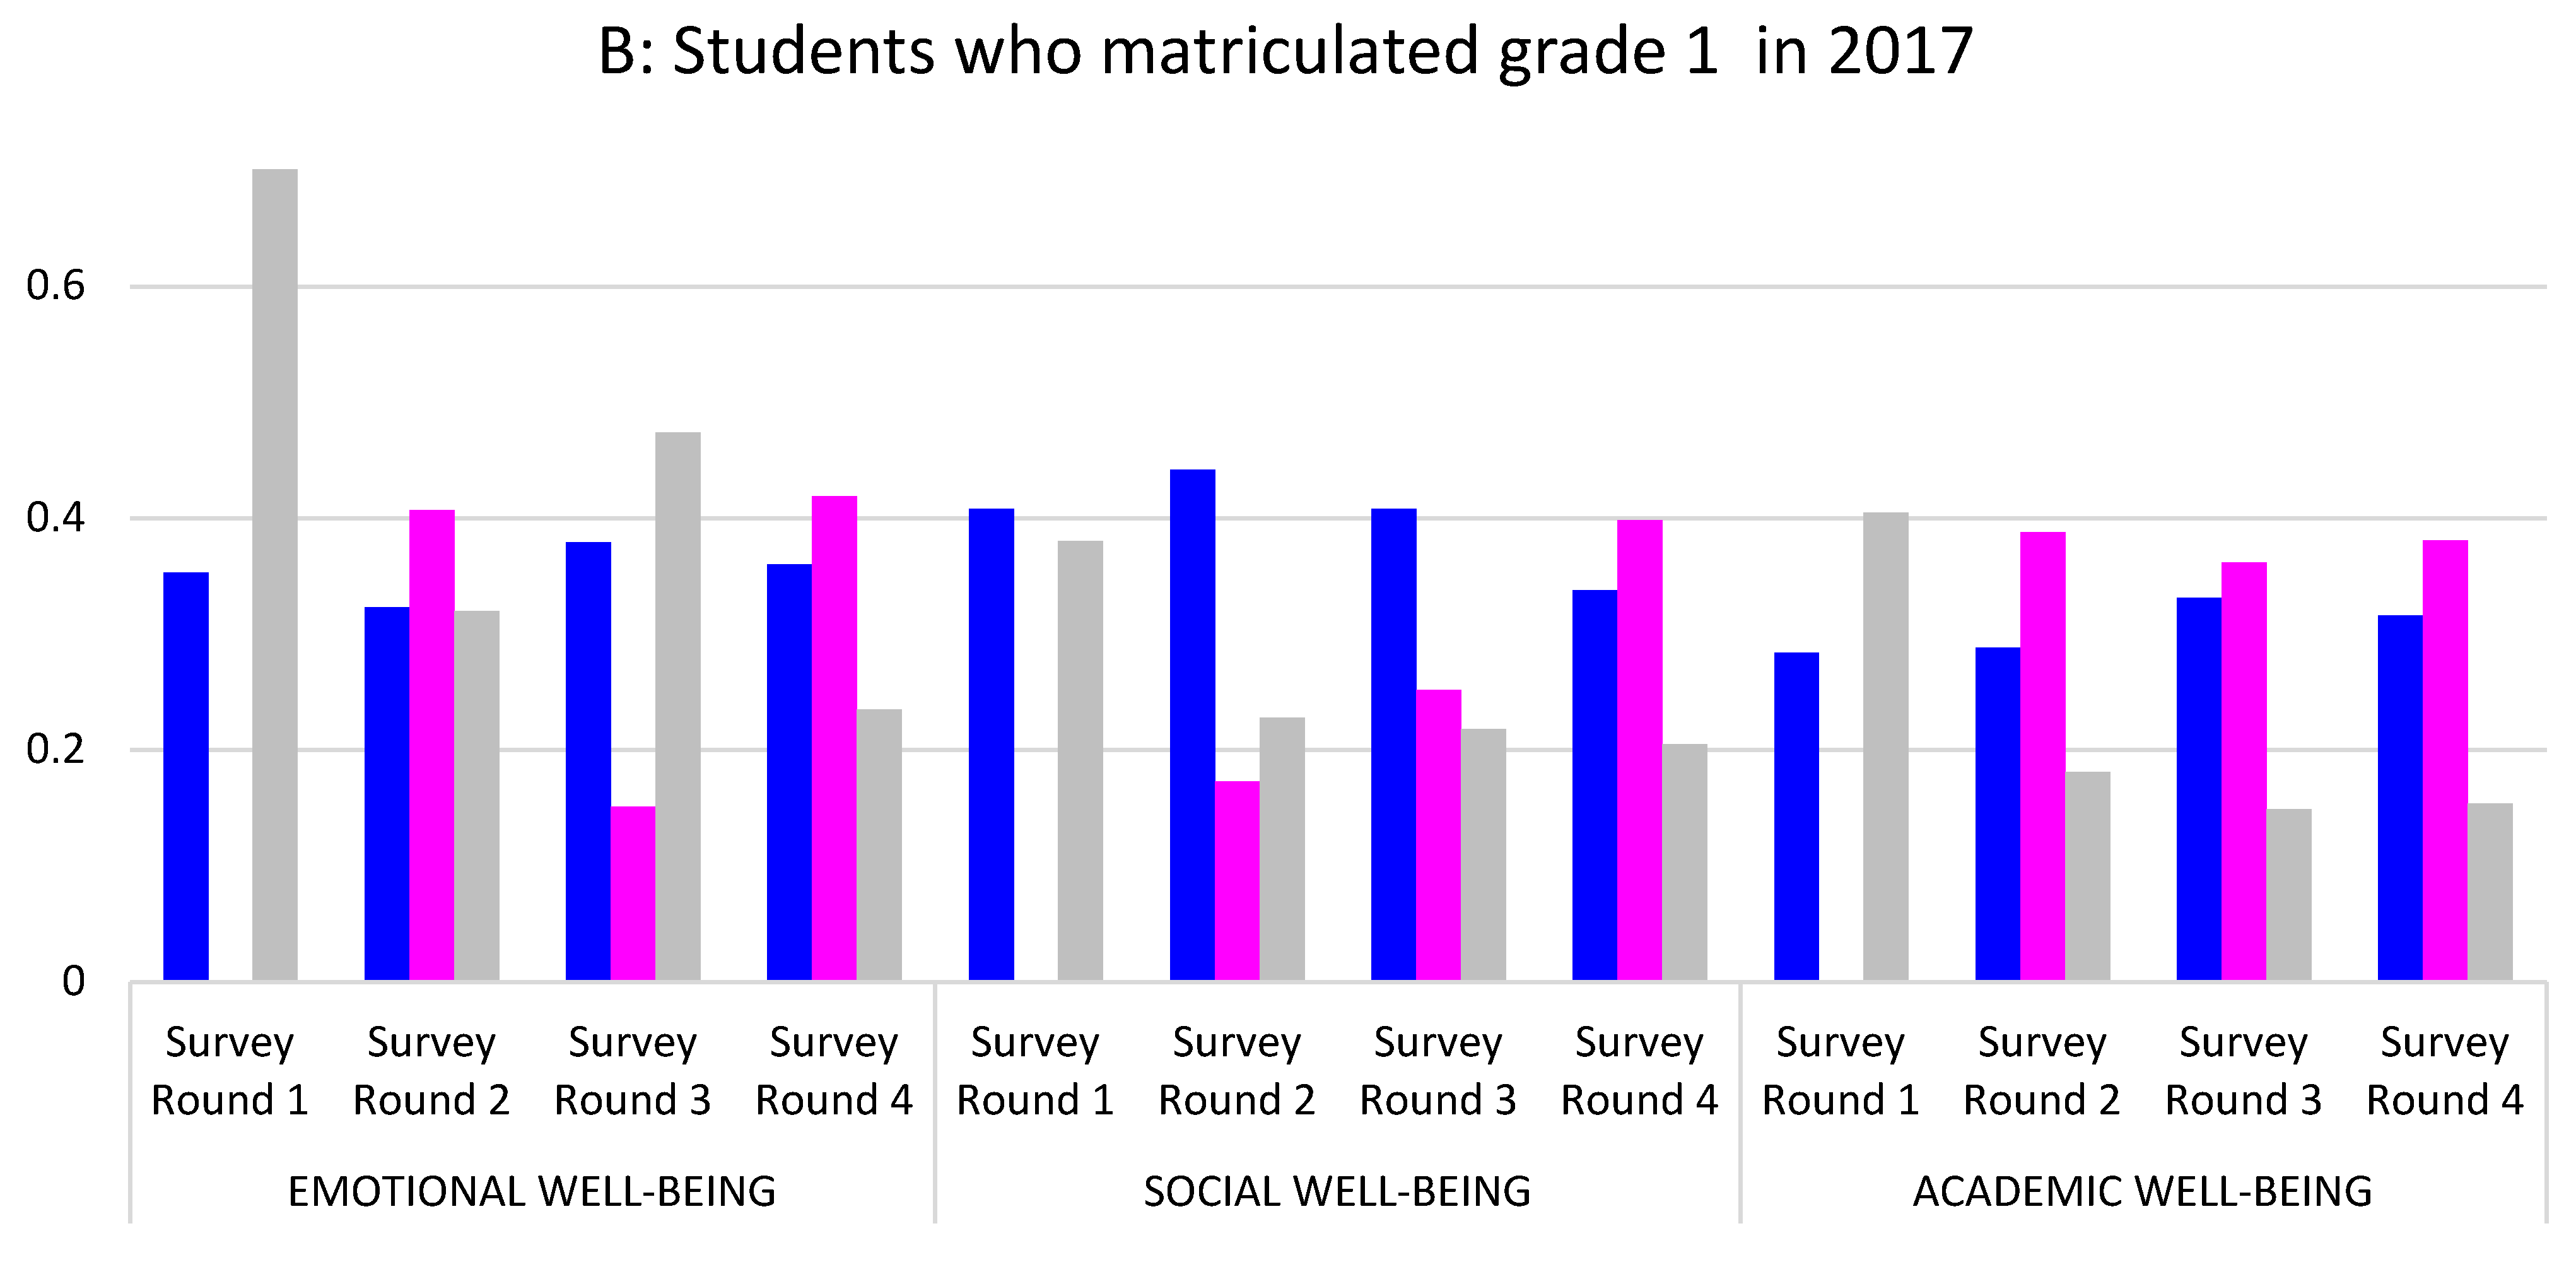
| Full Sample (n = 774) | Academic | 0.11 * | 0.27 *** | 0.35 *** | 0.15 *** | 0.24 *** | 0.09 |
| Emotional | 0.06 | 0.11 | 0.23 *** | 0.04 | 0.17 ** | 0.13 * | |
| Social | 0.17 *** | 0.19 *** | 0.20 *** | 0.01 | 0.03 | 0.01 | |
| Start grade 1 in 2019 (n = 66) | Academic | 0.33 * | 0.54 ** | 0.66 ** | 0.21 | 0.33 * | 0.12 |
| Emotional a | 0.11 | 0.18 | 0.28 | 0.08 | 0.17 | 0.10 | |
| Social | 0.01 | 0.02 | 0.06 | 0.01 | 0.05 | 0.03 | |
| Start grade 1 in 2018 (n = 198) | Academic | 0.54 *** | 0.63 *** | 0.71 *** | 0.09 | 0.17 | 0.08 |
| Emotional | 0.33 ** | 0.27 * | 0.42 *** | −0.06 | 0.09 | 0.15 | |
| Social | 0.31 *** | 0.31 *** | 0.33 *** | 0.00 | 0.03 | 0.02 | |
| Start grade 1 in 2017 (n = 195) | Academic | −0.02 | 0.13 | 0.22 * | 0.14 | 0.24 * | 0.09 |
| Emotional | 0.01 | 0.07 | 0.18 | 0.06 | 0.16 | 0.10 | |
| Social | 0.16 | 0.15 | 0.21 * | −0.01 | 0.05 | 0.06 | |
| Start grade 1 in 2016 (n = 163) | Academic | −0.04 | 0.16 | 0.22 | 0.19 | 0.25 * | 0.06 |
| Emotional | −0.06 | 0.05 | 0.15 | 0.11 | 0.21 | 0.10 | |
| Social | 0.19 | 0.17 | 0.16 | −0.02 | −0.03 | −0.01 | |
| Start grade 1 in 2015 (n = 59) | Academic | −0.35 * | −0.04 | 0.07 | 0.31 | 0.42 * | 0.11 |
| Emotional | −0.23 | −0.20 | 0.06 | 0.03 | 0.29 | 0.26 | |
| Social | 0.06 | 0.11 | 0.16 | 0.05 | 0.10 | 0.05 | |
| Start grade 1 in 2014 (n = 89) | Academic a | −0.14 | −0.02 | 0.06 | 0.11 | 0.19 | 0.08 |
| Emotional | −0.02 | 0.07 | 0.15 | 0.08 | 0.17 | 0.09 | |
| Social | 0.04 | 0.16 | 0.06 | 0.13 | 0.03 | −0.10 | |
| Survey Round | 1 | 2 | 3 | 4 | |||||
|---|---|---|---|---|---|---|---|---|---|
| Grade | Well-Being | Mean | SD | Mean | SD | Mean | SD | Mean | SD |
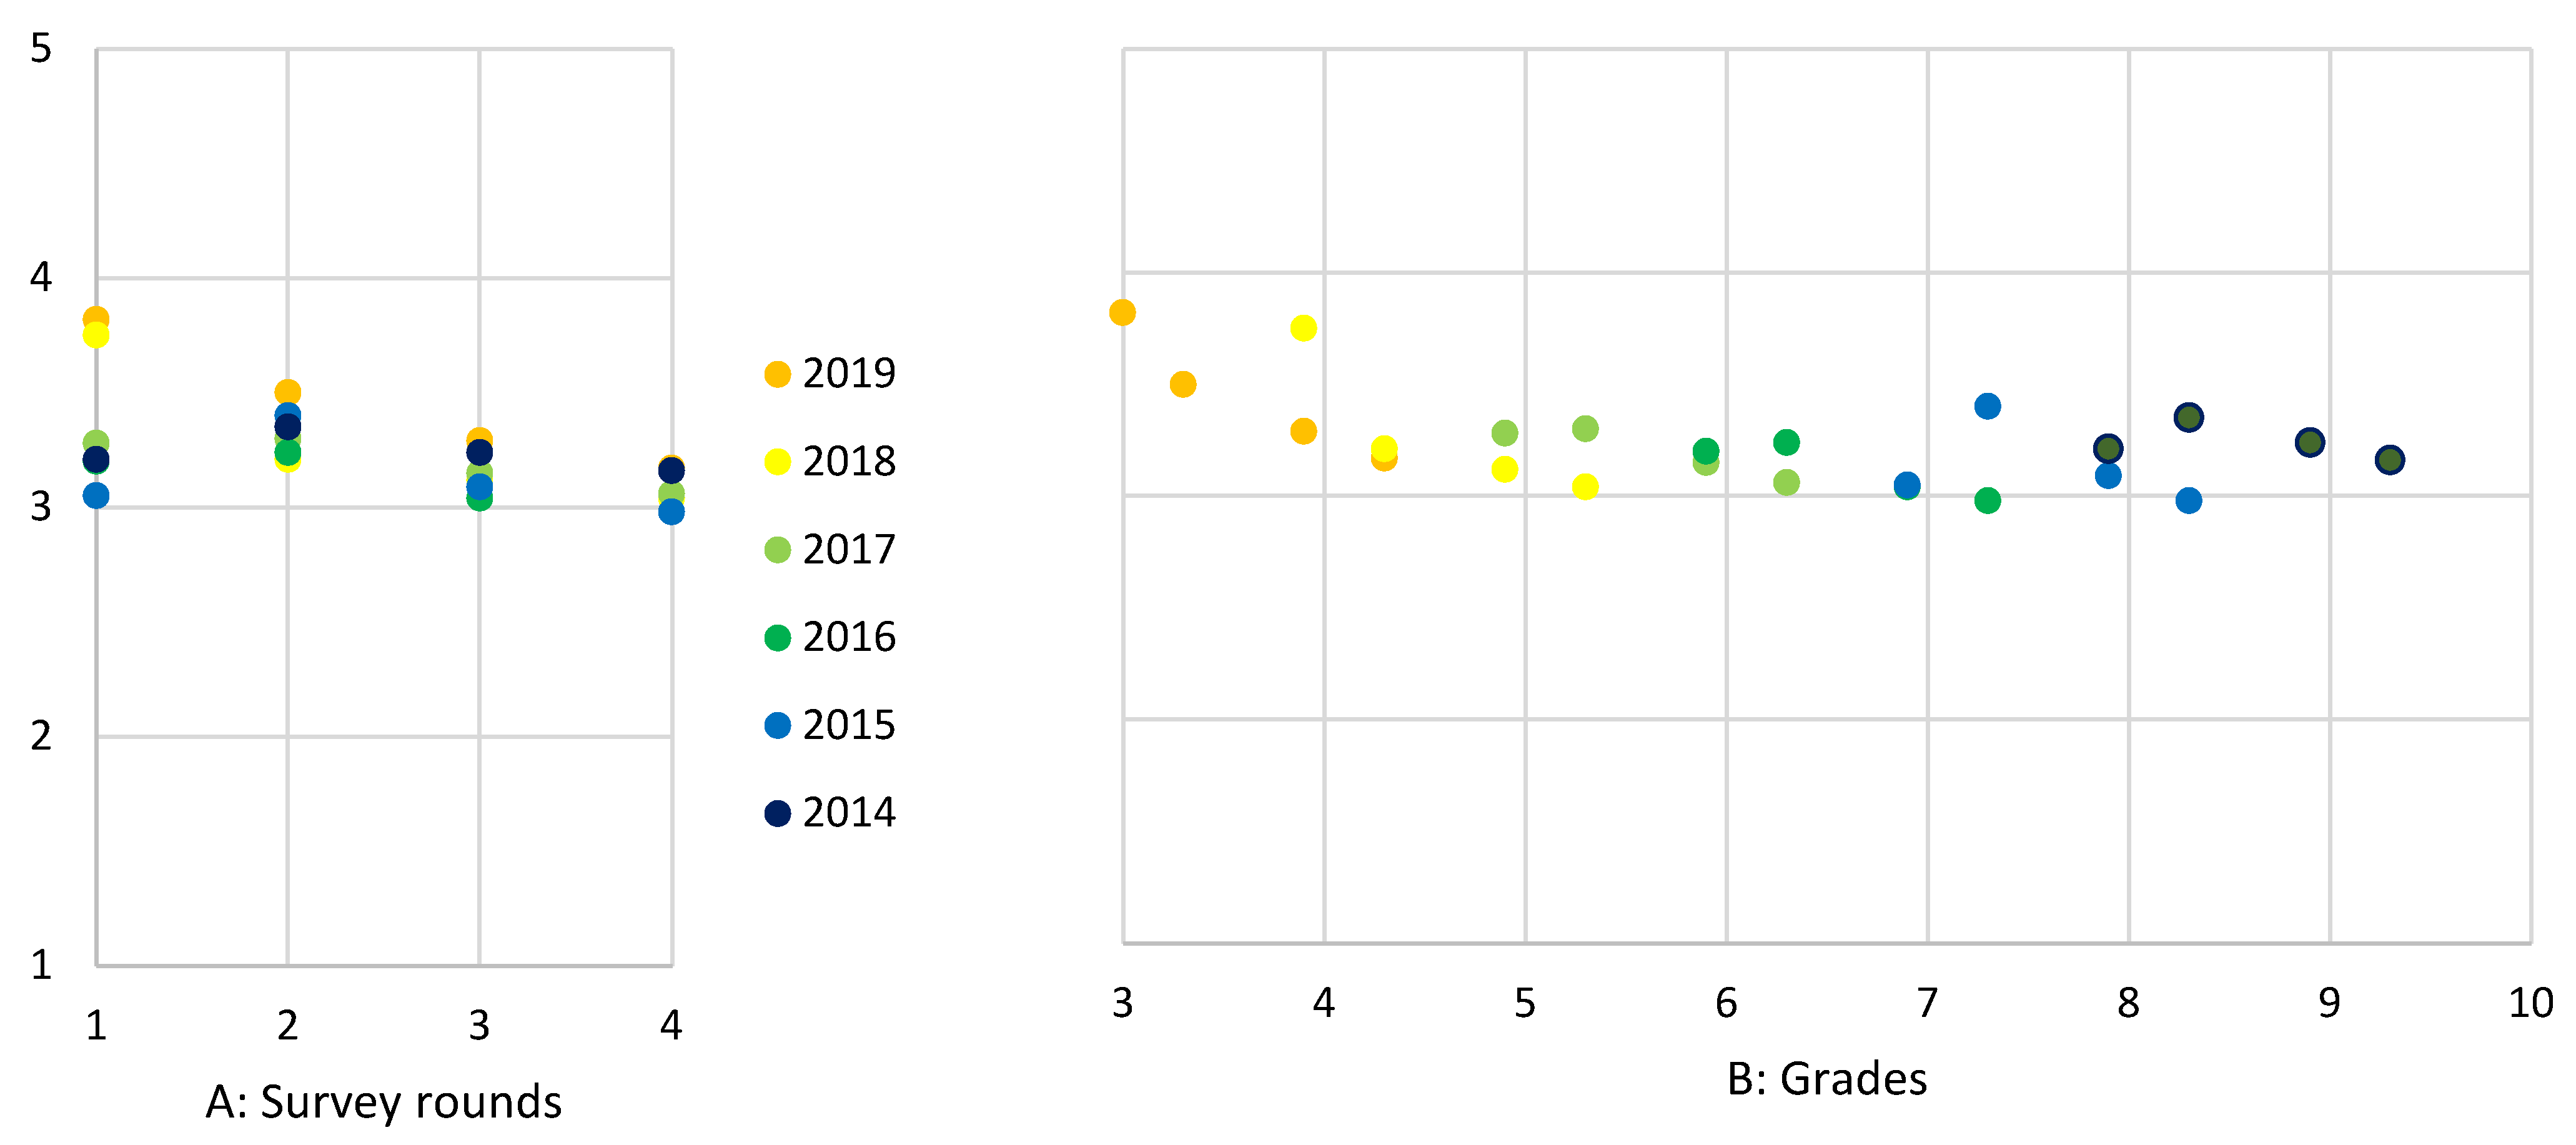
| Full sample (n = 774) | Academic | 3.40 | 0.76 | 3.29 | 0.72 | 3.14 | 0.70 | 3.05 | 0.72 |
| Emotional | 3.67 | 0.85 | 3.60 | 0.88 | 3.56 | 0.86 | 3.44 | 0.83 | |
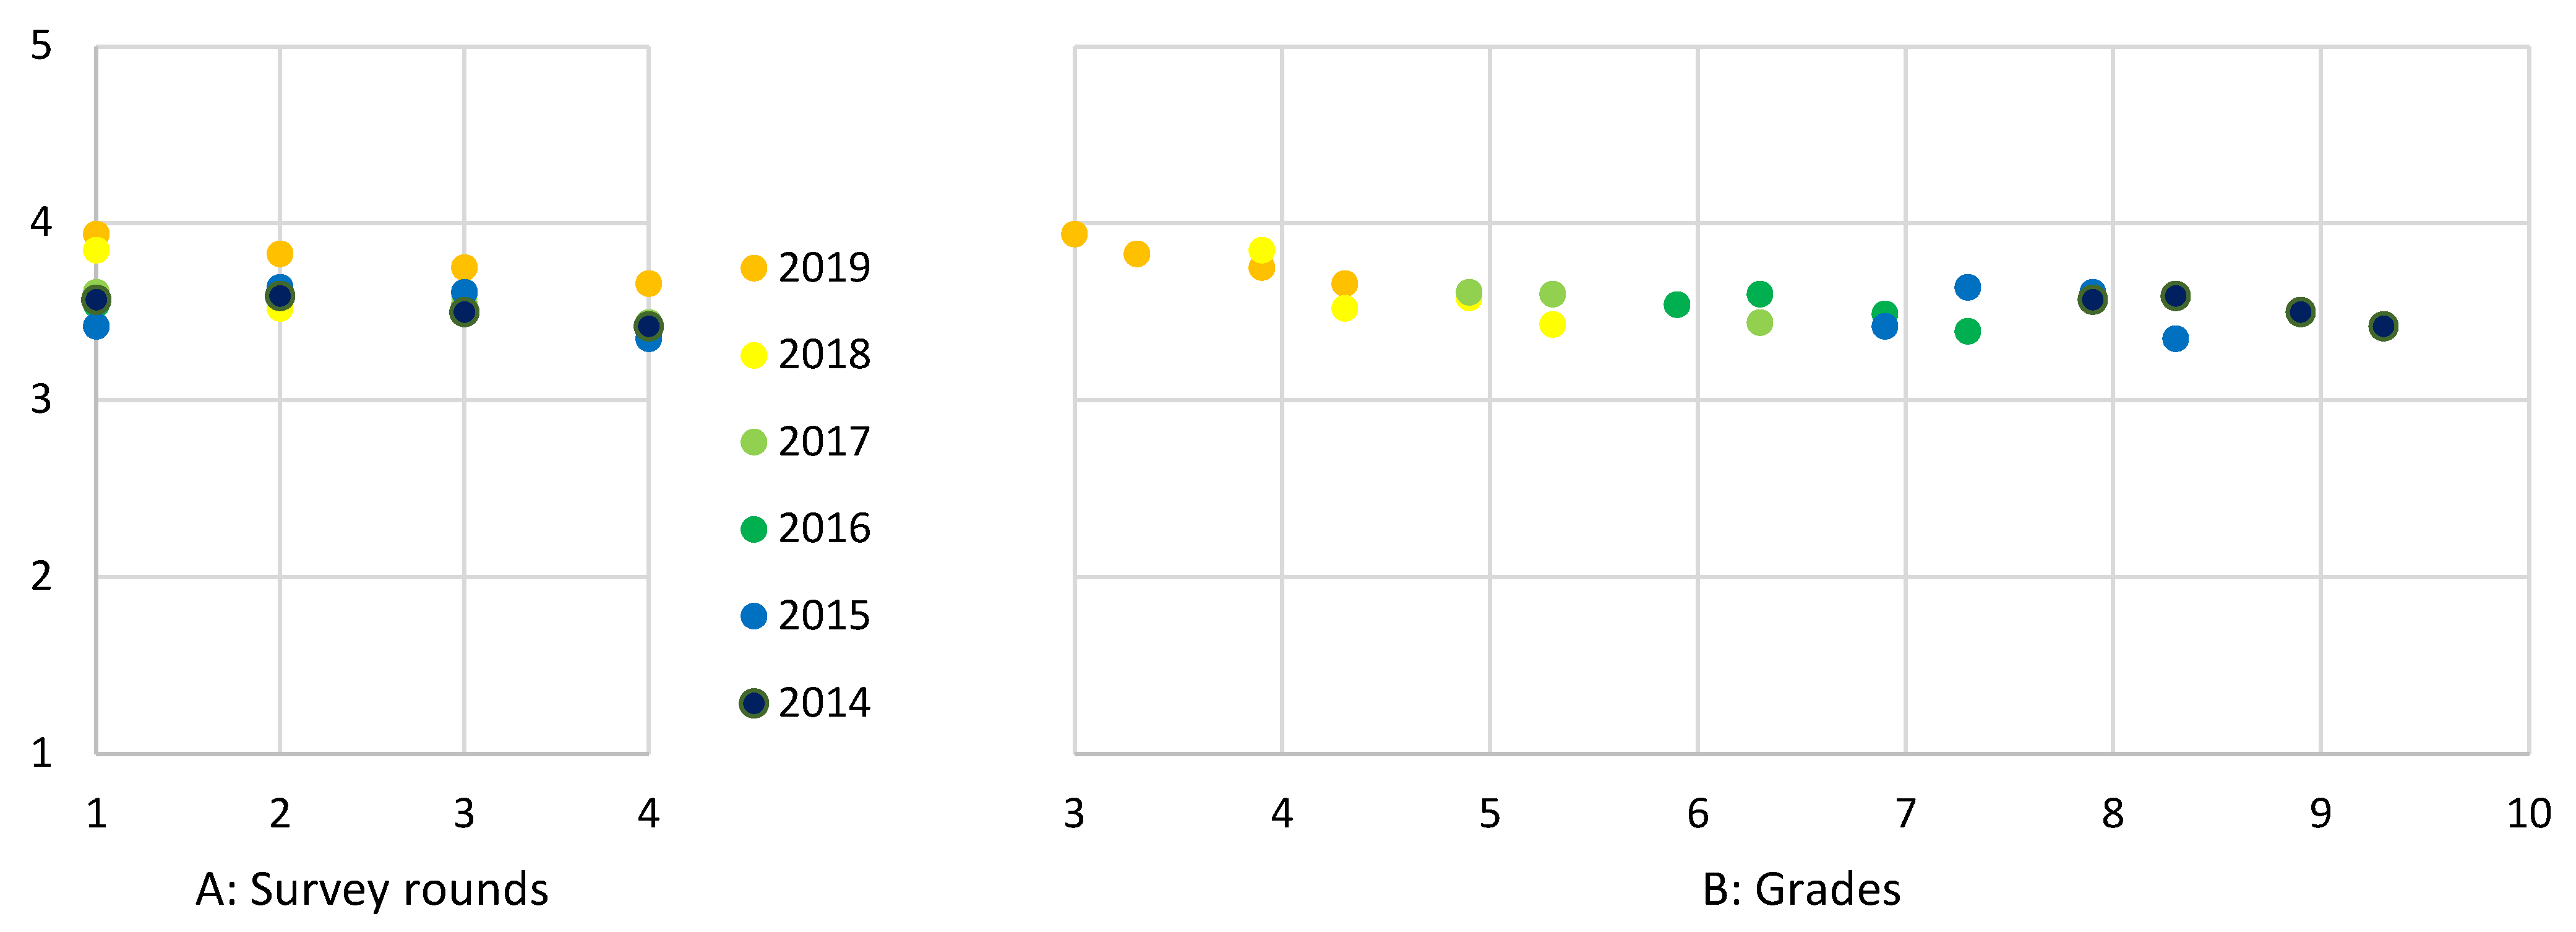
| Social | 4.00 | 0.68 | 3.83 | 0.65 | 3.82 | 0.67 | 3.80 | 0.65 | |
| Start grade 1 in 2019 (n = 66) | Academic | 3.82 | 0.62 | 3.50 | 0.64 | 3.29 | 0.62 | 3.17 | 0.67 |
| Emotional | 3.94 | 0.63 | 3.83 | 0.72 | 3.75 | 0.81 | 3.66 | 0.72 | |
| Social | 4.03 | 0.54 | 4.02 | 0.58 | 4.01 | 0.59 | 3.97 | 0.62 | |
| Start grade 1 in 2018 (n = 198) | Academic | 3.75 | 0.72 | 3.21 | 0.72 | 3.12 | 0.70 | 3.04 | 0.73 |
| Emotional | 3.85 | 0.82 | 3.52 | 0.89 | 3.58 | 0.82 | 3.43 | 0.85 | |
| Social | 4.05 | 0.68 | 3.75 | 0.65 | 3.74 | 0.67 | 3.72 | 0.69 | |
| Start grade 1 in 2017 (n = 195) | Academic | 3.28 | 0.78 | 3.30 | 0.77 | 3.15 | 0.69 | 3.06 | 0.67 |
| Emotional | 3.61 | 0.91 | 3.60 | 0.88 | 3.54 | 0.92 | 3.44 | 0.79 | |
| Social | 3.96 | 0.68 | 3.80 | 0.67 | 3.81 | 0.70 | 3.75 | 0.63 | |
| Start grade 1 in 2016 (n = 163) | Academic | 3.20 | 0.72 | 3.24 | 0.70 | 3.04 | 0.69 | 2.98 | 0.67 |
| Emotional | 3.54 | 0.86 | 3.60 | 0.91 | 3.49 | 0.82 | 3.39 | 0.78 | |
| Social | 3.98 | 0.73 | 3.79 | 0.65 | 3.81 | 0.63 | 3.82 | 0.65 | |
| Start grade 1 in 2015 (n = 59) | Academic | 3.05 | 0.64 | 3.40 | 0.67 | 3.09 | 0.66 | 2.98 | 0.74 |
| Emotional | 3.42 | 0.81 | 3.64 | 0.96 | 3.61 | 0.92 | 3.35 | 0.89 | |
| Social | 4.00 | 0.71 | 3.95 | 0.63 | 3.90 | 0.70 | 3.84 | 0.71 | |
| Start grade 1 in 2014 (n = 89) | Academic | 3.21 | 0.58 | 3.35 | 0.76 | 3.24 | 0.83 | 3.16 | 0.87 |
| Emotional | 3.57 | 0.84 | 3.59 | 0.84 | 3.50 | 0.89 | 3.42 | 0.95 | |
| Social | 3.97 | 0.70 | 3.94 | 0.62 | 3.81 | 0.65 | 3.91 | 0.60 | |
Appendix C

| Model | χ2 | Df | CFI | RMSEA | SRMR | |
|---|---|---|---|---|---|---|
| Full sample | ||||||
| Academic well-being | Configural | 537.77 | 144 | 0.962 | 0.059 | 0.038 |
| Weak invariance | 602.17 | 156 | 0.957 | 0.061 | 0.046 | |
| Strong invariance | 655.13 | 170 | 0.953 | 0.061 | 0.047 | |
| Emotional well-being | Configural | 325.97 | 85 | 0.964 | 0.061 | 0.041 |
| Weak invariance | 338.88 | 94 | 0.963 | 0.058 | 0.040 | |
| Strong invariance | 437.31 | 103 | 0.950 | 0.065 | 0.038 | |
| Social well-being | Configural | 621.33 | 144 | 0.945 | 0.065 | 0.035 |
| Weak invariance | 662.77 | 156 | 0.942 | 0.065 | 0.042 | |
| Strong invariance | 822.99 | 167 | 0.924 | 0.071 | 0.045 | |
| Start Grade 1 (2017) | ||||||
| Academic well-being | Configural | 290.14 | 144 | 0.945 | 0.072 | 0.051 |
| Weak invariance | 305.09 | 156 | 0.944 | 0.070 | 0.055 | |
| Strong invariance | 329.11 | 168 | 0.940 | 0.070 | 0.056 | |
| Emotional well-being | Configural | 156.00 | 85 | 0.960 | 0.066 | 0.055 |
| Weak invariance | 172.34 | 94 | 0.956 | 0.066 | 0.060 | |
| Strong invariance | 200.45 | 103 | 0.945 | 0.070 | 0.059 | |
| Social well-being | Configural | 306.42 | 144 | 0.927 | 0.076 | 0.056 |
| Weak invariance | 335.813 | 156 | 0.919 | 0.077 | 0.064 | |
| Strong invariance | 375.94 | 167 | 0.906 | 0.080 | 0.063 | |
| Assessment | Trait Consistency | Occasion-Specificity | Latent State Residual Variance Estimate | Reliability of Indicators | ||||
|---|---|---|---|---|---|---|---|---|
| Full longitudinal sample | ||||||||
| Academic well-being | Item 1 | Item 2 | Item 3 | Item 4 | Item 5 | |||
| Survey Round 1 | 0.563 | 0 | 0.216 | 0.484 | 0.653 | 0.477 | 0.616 | 0.608 |
| Survey Round 2 | 0.529 | 0.222 | 0.131 | 0.483 | 0.658 | 0.441 | 0.656 | 0.551 |
| Survey Round 3 | 0.601 | 0.149 | 0.115 | 0.487 | 0.669 | 0.462 | 0.712 | 0.551 |
| Survey Round 4 | 0.549 | 0.153 | 0.151 | 0.534 | 0.711 | 0.518 | 0.687 | 0.598 |
| Emotional well-being | Item 7 | - | Item 9 | Item 10 | Item 11 | |||
| Survey Round 1 | 0.471 | 0 | 0.507 | 0.356 | - | 0.526 | 0.752 | 0.428 |
| Survey Round 2 | 0.419 | 0.227 | 0.382 | 0.386 | - | 0.533 | 0.790 | 0.440 |
| Survey Round 3 | 0.449 | 0.239 | 0.314 | 0.416 | - | 0.521 | 0.764 | 0.444 |
| Survey Round 4 | 0.468 | 0.209 | 0.312 | 0.419 | - | 0.575 | 0.785 | 0.473 |
| Social well-being | Item 12 | Item 13 | Item 14 | Item 15 | Item 16 | |||
| Survey Round 1 | 0.370 | 0 | 0.376 | 0.452 | 0.711 | 0.486 | 0.224 | 0.471 |
| Survey Round 2 | 0.375 | 0.256 | 0.217 | 0.453 | 0.717 | 0.468 | 0.314 | 0.413 |
| Survey Round 3 | 0.358 | 0.332 | 0.191 | 0.531 | 0.785 | 0.476 | 0.295 | 0.462 |
| Survey Round 4 | 0.350 | 0.330 | 0.201 | 0.520 | 0.830 | 0.551 | 0.346 | 0.486 |
| Start grade 1 in 2017 | ||||||||
| Academic well-being | Item 1 | Item 2 | Item 3 | Item 4 | Item 5 | |||
| Survey Round 1 | 0.284 | 0.000 | 0.405 | 0.432 | 0.619 | 0.460 | 0.674 | 0.661 |
| Survey Round 2 | 0.288 | 0.388 | 0.181 | 0.444 | 0.654 | 0.440 | 0.671 | 0.619 |
| Survey Round 3 | 0.331 | 0.362 | 0.149 | 0.421 | 0.694 | 0.491 | 0.767 | 0.563 |
| Survey Round 4 | 0.316 | 0.381 | 0.154 | 0.472 | 0.687 | 0.494 | 0.724 | 0.554 |
| Emotional well-being | Item 7 | - | Item 9 | Item 10 | Item 11 | |||
| Survey Round 1 | 0.353 | 0.000 | 0.701 | 0.416 | - | 0.582 | 0.757 | 0.425 |
| Survey Round 2 | 0.323 | 0.407 | 0.320 | 0.473 | - | 0.575 | 0.790 | 0.483 |
| Survey Round 3 | 0.379 | 0.151 | 0.474 | 0.428 | - | 0.487 | 0.764 | 0.407 |
| Survey Round 4 | 0.360 | 0.419 | 0.235 | 0.508 | - | 0.621 | 0.759 | 0.471 |
| Social well-being | Item 12 | Item 13 | Item 14 | Item 15 | Item 16 | |||
| Survey Round 1 | 0.408 | 0.000 | 0.380 | 0.498 | 0.709 | 0.518 | 0.236 | 0.436 |
| Survey Round 2 | 0.442 | 0.173 | 0.228 | 0.445 | 0.696 | 0.480 | 0.345 | 0.373 |
| Survey Round 3 | 0.408 | 0.252 | 0.218 | 0.560 | 0.787 | 0.539 | 0.342 | 0.397 |
| Survey Round 4 | 0.338 | 0.398 | 0.205 | 0.587 | 0.870 | 0.627 | 0.394 | 0.464 |
References
- OECD. OECD Guidelines on Measuring Subjective Well-Being; OECD Publishing: Paris, France, 2013. [Google Scholar]
- Cloninger, C. On well-being: Current research trends and future directions. Mens Sana Monogr. 2008, 6, 3. [Google Scholar] [CrossRef] [PubMed]
- Martela, F.; Sheldon, K.M. Clarifying the concept of well-being: Psychological need satisfaction as the common core connecting eudaimonic and subjective well-being. Rev. Gen. Psychol. 2019, 23, 458–474. [Google Scholar] [CrossRef]
- Furlong, A.; Cartmel, F. Young People and Social Change: Individualization and Risk in Late Modernity; Open University Press: London, UK, 1997. [Google Scholar]
- Görlich, A.; Pless, M.; Katznelson, N.; Graversen, L. Ny Udsathed i Ungdomslivet: 11 Forskere Om Den Stigende Mistrivsel Blandt Unge; Hans Reitzels Forlag: Copenhagen, Denmark, 2019. [Google Scholar]
- Ottosen, M.H.; Andersen, D.; Dahl, K.M.; Toft Hansen, A.; Lausten, M.; Østergaard, S.V. Børn og Unge i Danmark—Velfærd og Trivsel; VIVE: Copenhagen, Denmark, 2018; p. 203.
- Meherali, S.; Punjani, N.; Louie-Poon, S.; Abdul Rahim, K.; Das, J.K.; Salam, R.A.; Lassi, Z.S. Mental health of children and adolescents amidst COVID-19 and past pandemics: A rapid systematic review. Int. J. Environ. Res. Public Health 2021, 18, 3432. [Google Scholar] [CrossRef] [PubMed]
- Lepp, L.; Aaviku, T.; Leijen, Ä.; Pedaste, M.; Saks, K. Teaching during COVID-19: The decisions made in teaching. Educ. Sci. 2021, 11, 47. [Google Scholar] [CrossRef]
- Mantovani, S.; Bove, C.; Ferri, P.; Manzoni, P.; Cesa Bianchi, A.; Picca, M. Children ‘under lockdown’: Voices, experiences, and resources during and after the COVID-19 emergency. Insights from a survey with children and families in the Lombardy region of Italy. Eur. Early Child. Educ. Res. J. 2021, 29, 35–50. [Google Scholar] [CrossRef]
- Wistoft, K.; Qvortrup, A.; Qvortrup, L.; Christensen, J. Elever, der havde det særligt svært med nødundervisningen under coronakrisen. Paideia 2020, 20, 22–38. [Google Scholar]
- Wistoft, K.; Christensen, J.; Qvortrup, L. Elevernes trivsel og mentale sundhed—Hvad har vi lært af nødundervisningen under coronakrisen. Learn. Tech-Tidsskr. Læremidler Didakt. Teknol. 2020, 5, 40–65. [Google Scholar]
- Qvortrup, A.; Christensen, J.; Lomholt, R. Elevers mestringsoplevelser og self efficacy under nødundervisningen i forbindelse med Covid-19-skolelukningerne. Learn. Tech. 2020, 7, 12–39. [Google Scholar] [CrossRef]
- Ahtiainen, R.; Asikainen, M.S.; Heikonen, L.; Hienonen, N.; Hotulainen, R.; Lindfors, P.; Lindgren, E.P.; Lintuvuori, M.; Kinnunen, J.; Koivuhovi, S.; et al. [Schooling, Teaching and Wellbeing in the School Community during the COVID-19 Pandemic. Report of Autumn 2021]; Helsingin Yliopisto: Helsinki, Finland; Tampereen Yliopisto: Helsinki, Finland, 2021. [Google Scholar]
- Brooks, S.K.; Webster, R.K.; Smith, L.E.; Woodland, L.; Wessely, S.; Greenberg, N.; Rubin, G.J. The psychological impact of quarantine and how to reduce it: Rapid review of the evidence. Lancet 2020, 395, 912–920. [Google Scholar] [CrossRef]
- Lupien, S.J.; de Leon, M.; de Santi, S.; Convit, A.; Tarshish, C.; Nair, N.P.V.; Thakur, M.; McEwen, B.S.; Hauger, R.L.; Meaney, M.J. Cortisol levels during human aging predict hippocampal atrophy and memory deficits. Nat. Neurosci. 1998, 1, 69–73. [Google Scholar] [CrossRef]
- McEwen, B.S. Central effects of stress hormones in health and disease: Understanding the protective and damaging effects of stress and stress mediators. Eur. J. Pharmacol. Eur. J. Pharmacol. 2008, 583, 174–185. [Google Scholar] [CrossRef] [PubMed]
- Shonkoff, J.P.; Boyce, W.T.; McEwen, B.S. Neuroscience, molecular biology, and the childhood roots of health disparities: Building a new framework for health promotion and disease prevention. JAMA 2009, 301, 2252–2259. [Google Scholar] [CrossRef] [PubMed]
- Korsgaard, S. Børn og Unge Kæmper for at Passe Ind [Children and Young People Struggle to Fit in]; Børns Vilkår (Children Rights National Association): Copenhagen, Denmark, 2022. [Google Scholar]
- Danskernes Sundhed: Den Nationale Sundhedsprofl 2021—Centrale Udfordringer [Health of the Danes: The National Health Profile 2021—Main Challenges]; Sundhedsstyrelsen [Danish Health Authority]: Copenhagen, Denmark, 2022.
- Fortsat Høj Trivsel i Skolen Blandt Folkeskoleelever; Børne og—Undervisningsministeriet: Copenhagen, Denmark, 2022.
- Qvortrup, L. Vi skal droppe fortællingen om, at mistrivslen er værre end tidligere. Altinget, 1 May 2023. [Google Scholar]
- Wistoft, K.; Qvortrup, L. Undgå Alarmisme: DPU-Forskere med 5 Gode Råd Mod Mistrivsel; SkoleMonitor: Copenhagen, Denmark, 2023. [Google Scholar]
- Katznelson, N.; Pless, M.; Görlich, A. Mistrivsel i Lyset af Tempo, Præstation og Psykologisering; Aalborg Uni: Aalborg, Denmark, 2022. [Google Scholar]
- Schmidt, A.L. Professor: Billedet af en hel generation i mistrivsel er ikke bare forkert, det er også dybt problematisk. Politiken, 19 December 2022. [Google Scholar]
- Katznelson, N. Vores måde at tale om mistrivsel, risikerer at skabe en snæver forståelse af normalitet. Altinget, 12 May 2023. [Google Scholar]
- Qvortrup, A. Stressors from and well-being after COVID-19 among Danish primary and lower secondary school students. Scand. J. Educ. Res. 2022, 9, 1–22. [Google Scholar] [CrossRef]
- Qvortrup, A.; Lykkegaard, E. A Case Report of Danish Students’ Wellbeing and Stress in a Time of Crisis and Recoveries. Med. Res. Arch. 2023, 11, 1–15. [Google Scholar] [CrossRef]
- Reis, H.T.; Sheldon, K.M.; Gable, S.L.; Roscoe, J.; Ryan, R.M. Daily well-being: The role of autonomy, competence, and relatedness. Personal. Soc. Psychol. Bull. 2000, 26, 419–435. [Google Scholar] [CrossRef]
- Lucas, R.E.; Diener, E. Subjective Well-Being. In Handbook of Emotions; The Guilford Press: New York, NY, USA, 2008; pp. 471–484. [Google Scholar]
- Schimmack, U.; Krause, P.; Wagner, G.G.; Schupp, J. Stability and change of well being: An experimentally enhanced latent state-trait-error analysis. Soc. Indic. Res. 2009, 95, 19–31. [Google Scholar] [CrossRef]
- Joshanloo, M. Stability and Change in Subjective, Psychological, and Social Well-Being: A Latent State-Trait Analysis of Mental Health Continuum–Short Form in Korea and the Netherlands. J. Personal. Assess. 2023, 105, 413–421. [Google Scholar] [CrossRef]
- Reis, H.T. Domains of experience: Investigating relationship processes from three perspectives. In Theoretical Frameworks for Personal Relationships; Erber, R., Gilmour, R., Eds.; Routledge: Hillsdale, NJ, USA, 1994; pp. 87–110. [Google Scholar]
- Watson, D. The vicissitudes of mood measurement: Effects of varying descriptors, time frames, and response formats on measures of positive and negative affect. J. Personal. Soc. Psychol. 1988, 55, 128–141. [Google Scholar] [CrossRef]
- Suldo, S.; Thalji, A.; Ferron, J. Longitudinal academic outcomes predicted by early adolescents’ subjective well-being, psychopathology, and mental health status yielded from a dual factor model. J. Posit. Psychol. 2011, 6, 17–30. [Google Scholar] [CrossRef]
- Huebner, E.S.; Hills, K.J.; Jiang, X.; Long, R.F.; Kelly, R.; Lyons, M.D. Schooling and children’s subjective well-being. In Handbook of Child Well-Being; Springer Science+Business Media: Dordrecht, The Netherlands, 2014; Volume 2, pp. 797–819. [Google Scholar]
- Delle Fave, A. Subjective indicators of well-being: Conceptual background and applications in social sciences. In Handbook of Research Methods and Applications in Happiness and Quality of Life; Edward Elgar Publishing: Hereford, UK, 2016; pp. 71–89. [Google Scholar]
- Adler, A. Well-being and academic achievement: Towards a new evidence-based educational paradigm. In Future Directions in Well-Being: Education, Organizations and Policy; Springer: Cham, Switzerland, 2017; pp. 203–208. [Google Scholar]
- Bücker, S.; Nuraydin, S.; Simonsmeier, B.A.; Schneider, M.; Luhmann, M. Subjective well-being and academic achievement: A meta-analysis. J. Res. Pers. 2018, 74, 83–94. [Google Scholar] [CrossRef]
- Shah, H.; Marks, N. A Well-Being Manifesto for a Flourishing Society; The New Economics Foundation: London, UK, 2004. [Google Scholar]
- Aspelin, J. Enhancing pre-service teachers’ socio-emotional competence. Int. J. Emot. Educ. 2019, 11, 153–168. [Google Scholar]
- Schapira, R.; Aram, D. Shared book reading at home and preschoolers’ socio-emotional competence. Early Educ. Dev. 2020, 31, 819–837. [Google Scholar] [CrossRef]
- Hochschild, A.R. Ideology and emotion management: A perspective and path for future research. Res. Agendas Sociol. Emot. 1990, 117, 117–142. [Google Scholar]
- Oberle, E. Early Adolescents’ Emotional Well-Being in the Classroom: The Role of Personal and Contextual Assets. J. Sch. Health 2018, 88, 101–111. [Google Scholar] [CrossRef] [PubMed]
- Jørring, A.H.; Bølling, M.; Nielsen, G.; Stevenson, M.P.; Bentsen, P. Swings and roundabouts? Pupils’ experiences of social and academic well-being in education outside the classroom. Education 3-13 2020, 48, 413–428. [Google Scholar] [CrossRef]
- Ling, X.; Chen, J.; Chow, D.H.K.; Xu, W.; Li, Y. The “trade-off” of student well-being and academic achievement: A perspective of multidimensional student well-being. Front. Psychol. 2022, 13, 772653. [Google Scholar] [CrossRef] [PubMed]
- Woods, A.D.; Gerasimova, D.; Van Dusen, B.; Nissen, J.; Bainter, S.; Uzdavines, A.; Davis-Kean, P.E.; Halvorson, M.; King, K.M.; Logan, J.A.R.; et al. Best practices for addressing missing data through multiple imputation. Infant Child Dev. 2023, e2407. [Google Scholar] [CrossRef]
- Azur, M.J.; Stuart, E.A.; Frangakis, C.; Leaf, P.J. Multiple imputation by chained equations: What is it and how does it work? Int. J. Methods Psychiatr. Res. 2011, 20, 40–49. [Google Scholar] [CrossRef]
- Guba, E.G.; Lincoln, Y.S. Epistemological and Methodological Bases of Naturalistic Inquiry. Ectj-Educ. Commun. Technol. J. 1982, 30, 233–252. [Google Scholar] [CrossRef]
- Field, A. Discovering Statistics Using IBM SPSS Statistics, 5th ed.; Sage: Thousand Oaks, CA, USA, 2018. [Google Scholar]
- Rahn, M. Factor Analysis: A Short Introduction; The Analysis Factor, LLC.: Ithaca, NY, USA, 2014. [Google Scholar]
- Kaiser, H.F. The application of electronic computers to factor analysis. Educ. Psychol. Meas. 1960, 20, 141–151. [Google Scholar] [CrossRef]
- Barker, L.E.; Shaw, K.M. Best (but oft-forgotten) practices: Checking assumptions concerning regression residuals. Am. J. Clin. Nutr. 2015, 102, 533–539. [Google Scholar] [CrossRef] [PubMed]
- Cattell, R.B.; Tsujioka, B. The importance of factor-trueness and validity, versus homogeneity and orthogonality, in test scales1. Educ. Psychol. Meas. 1964, 24, 3–30. [Google Scholar] [CrossRef]
- Hair, J.F.; Anderson, R.E.; Babin, B.J.; Black, W.C. Multivariate Data Analysis; Prentice-Hall, Inc.: Upper Saddle River, NJ, USA, 2010; Volume 7. [Google Scholar]
- Brown, T.A. Confirmatory Factor Analysis for Applied Research; Guilford Publications, The Guilford Press: New York, NY, USA, 2015. [Google Scholar]
- Steenkamp, J.-B.E.M.; Baumgartner, H. Assessing Measurement Invariance in Cross-National Consumer Research. J. Consum. Res. 1998, 25, 78–107. [Google Scholar] [CrossRef]
- Dunnett, C.W. A multiple comparison procedure for comparing several treatments with a control. J. Am. Stat. Assoc. 1955, 50, 1096–1121. [Google Scholar] [CrossRef]
- Dunnett, C.W. New tables for multiple comparisons with a control. Biometrics 1964, 20, 482–491. [Google Scholar] [CrossRef]
- Scheffe, H. The Analysis of Variance; John Wiley & Sons: New York, NY, USA, 1999. [Google Scholar]
- Steyer, R.; Schmitt, M.; Eid, M. Latent state–trait theory and research in personality and individual differences. Eur. J. Personal. 1999, 13, 389–408. [Google Scholar] [CrossRef]
- Eid, M.; Holtmann, J.; Santangelo, P.; Ebner-Priemer, U. On the definition of latent-state-trait models with autoregressive effects. Eur. J. Psychol. Assess. 2017, 33, 285–295. [Google Scholar] [CrossRef]
- Steyer, R.; Mayer, A.; Geiser, C.; Cole, D.A. A theory of states and traits—Revised. Annu. Rev. Clin. Psychol. 2015, 11, 71–98. [Google Scholar] [CrossRef]
- Geiser, C.; Götz, T.; Preckel, F.; Freund, P.A. States and traits. Eur. J. Psychol. Assess. 2017, 33, 219–223. [Google Scholar] [CrossRef]
- Burns, G.L.; Becker, S.P.; Geiser, C.; Leopold, D.R.; Willcutt, E.G. Are sluggish cognitive tempo, ADHD, and oppositional defiant disorder trait-or state-like constructs from prekindergarten to fourth grade? J. Clin. Child Adolesc. Psychol. 2020, 49, 460–468. [Google Scholar] [CrossRef]
- Geiser, C.; Hintz, F.; Burns, G.L.; Servera, M. Multitrait-multimethod-multioccasion modeling of personality data. In The Handbook of Personality Dynamics and Processes; Elsevier: Amsterdam, The Netherlands, 2021; pp. 909–934. [Google Scholar]
- Bollen, K.A.; Curran, P.J. Latent Curve Models: A Structural Equation Perspective; John Wiley & Sons: Hoboken, NJ, USA, 2006. [Google Scholar]
- Geiser, C.; Keller, B.T.; Lockhart, G.; Eid, M.; Cole, D.A.; Koch, T. Distinguishing state variability from trait change in longitudinal data: The role of measurement (non) invariance in latent state-trait analyses. Behav. Res. Methods 2015, 47, 172–203. [Google Scholar] [CrossRef] [PubMed]
- Qvortrup, A.; Lomholt, R.; Christensen, V.; Lundtofte, T.E.; Nielsen, A. Playful learning during the reopening of Danish schools after COVID 19 closures. Scand. J. Educ. Res. 2023, 67, 725–740. [Google Scholar] [CrossRef]
- Bandura, A. Self-Efficacy. The Exercise of Control; Worth Publishers: New York, NY, USA, 1997. [Google Scholar]
- Heider, F. The Psychology of Interpersonal Relations; John Wiley & Sons Inc.: New York, NY, USA, 2013. [Google Scholar]
- Weiner, B. Attribution Theory; Elsevier Ltd.: Los Angeles, CA, USA, 2010. [Google Scholar]
- Weiner, B. An attributional theory of achievement motivation and emotion. Psychol. Rev. 1985, 92, 548. [Google Scholar] [CrossRef] [PubMed]
- Browne, M.W.; Cudeck, R. Alternative ways of assessing model fit. In Testing Structural Equation Models; Bollen, K.A., Long, J.S., Eds.; Sage: Newbury Park, CA, USA, 1993; pp. 136–162. [Google Scholar]
- Hu, L.T.; Bentler, P.M. Cutoff criteria for fit indexes in covariance structure analysis: Conventional criteria versus new alternatives. Struct. Equ. Model. A Multidiscip. J. 1999, 6, 1–55. [Google Scholar] [CrossRef]
- Little, T.D. Longitudinal Structural Equation Modeling; Guilford Press: New York, NY, USA, 2013. [Google Scholar]
- Steyer, R.; Schmitt, T. The theory of confounding and its application in causal modeling with latent variables. In Latent Variables Analysis: Applications for Developmental Research; Eye, I.A.V., Clogg, C.C., Eds.; Sage: Thousand Oaks, CA, USA, 1994; pp. 36–67. [Google Scholar]
- Eid, M.; Geiser, C.; Koch, T. Measuring method effects: From traditional to design-oriented approaches. Curr. Dir. Psychol. Sci. 2016, 25, 275–280. [Google Scholar] [CrossRef]


| The emotional dimension of well-being encompasses individuals’ tendency to be satisfied with daily life, experience life positive, feel self-confident and think positively [43]. | The social dimension of well-being refers to the experience of belonging to a social group or a social community in which participation and the engagement of the individual are recognized and valued [44]. | Academic dimension of well-being refers to the experience of feeling happy in school, motivated about and engaged in school work [45] |
| Items | Empirical Factors | Factor Loading | Cronbach’s Alpha | |
|---|---|---|---|---|
| Item 1 a | The activities in school are boring * | Academic well-being | 0.733 | 0.878 |
| Item 2 | The activities in school make me want to learn more * | 0.835 | ||
| Item 3 | The activities in school help me get new ideas * | 0.679 | ||
| Item 4 | Learning new things in school is fun * | 0.803 | ||
| Item 5 | I like class activities in school * | 0.798 | ||
| Item 6 | I am happy ** | Emotional well-being | 0.798 | 0.851 |
| Item 7 | I am in a good mood ** | 0.789 | ||
| Item 8 a | I am unhappy ** | |||
| Item 9 | I am motivated in school ** | 0.717 | ||
| Item 10 | I am happy to attend school ** | 0.768 | ||
| Item 11 | I like my teachers ** | 0.585 | ||
| Item 12 | I feel understood *** | Social well-being | 0.761 | 0.839 |
| Item 13 | I feel like I fit in *** | 0.827 | ||
| Item 14 | I feel heard *** | 0.761 | ||
| Item 15 a | I feel excluded *** | 0.541 α | ||
| Item 16 | I have good classmates *** | 0.693 |
Disclaimer/Publisher’s Note: The statements, opinions and data contained in all publications are solely those of the individual author(s) and contributor(s) and not of MDPI and/or the editor(s). MDPI and/or the editor(s) disclaim responsibility for any injury to people or property resulting from any ideas, methods, instructions or products referred to in the content. |
© 2023 by the authors. Licensee MDPI, Basel, Switzerland. This article is an open access article distributed under the terms and conditions of the Creative Commons Attribution (CC BY) license (https://creativecommons.org/licenses/by/4.0/).
Share and Cite
Lykkegaard, E.; Qvortrup, A.; Juul, C.B. Students’ Well-Being Fluctuations during COVID-19—A Matter of Grade, State, or Trait? Educ. Sci. 2024, 14, 26. https://doi.org/10.3390/educsci14010026
Lykkegaard E, Qvortrup A, Juul CB. Students’ Well-Being Fluctuations during COVID-19—A Matter of Grade, State, or Trait? Education Sciences. 2024; 14(1):26. https://doi.org/10.3390/educsci14010026
Chicago/Turabian StyleLykkegaard, Eva, Ane Qvortrup, and Casper B. Juul. 2024. "Students’ Well-Being Fluctuations during COVID-19—A Matter of Grade, State, or Trait?" Education Sciences 14, no. 1: 26. https://doi.org/10.3390/educsci14010026