Article

Evaluating a Secondary Education Urban Ecology Project within the Framework of a Problem-Based Learning Methodology

by
Joaquin Ayerbe-López
* and
Francisco Javier Perales-Palacios
Department of Science Education, University of Granada, 18071 Granada, Spain
*
Author to whom correspondence should be addressed.
Educ. Sci. 2023, 13(9), 915; https://doi.org/10.3390/educsci13090915
Submission received: 12 June 2023 / Revised: 4 August 2023 / Accepted: 6 September 2023 / Published: 8 September 2023

Abstract

:
As a reaction to the current situation of local and global environmental deterioration, recent decades have seen the emergence of multiple educational strategies and methodologies within Environmental Education (EE) with the aim of promoting pro-environmental attitudes among young people. One of these strategies is Problem-Based Learning (PBL), and it is necessary to analyze the didactic implications of this methodology in the field of EE in order to maximize its effectiveness. This study evaluates the implementation and didactic implications of an environmental project designed under the PBL methodology. The project was carried out over consecutive years of compulsory secondary education (Grades 9 and 10) in two secondary schools in the province of Granada, Spain. The data collection instruments used included the researcher’s diary, self-assessment and reflection questionnaires for the participating students, and questionnaires and rubrics completed by the audience during the presentation of the final product. The study employed a qualitative interpretative approach, using response categorization and SWOT analyses, the results of which revealed multiple conclusions, highlighting the high level of motivation, work and participation of the students, as well as the didactic benefits of the enriching socialization of the project. Difficulties, such as time management and cooperative group work, lack of practice in the methodology used and challenges related to the use of information and communication technologies (ICT), were also identified. Finally, recommendations are provided for the application of this methodology in other educational contexts.

1. Introduction

Well into the 21st century, we can confidently assert that we are facing unprecedented anthropogenic environmental deterioration [1,2,3]. Some of the most important parameters indicating the various current environmental issues include climate change, biodiversity loss, disruptions in the global nitrogen and phosphorus cycles, ozone depletion, ocean acidification, global freshwater consumption, land use changes, chemical pollution, and atmospheric aerosol concentration [4]. It is evident that the solution to this array of problems is complex and multifactorial. However, as educators, we have an important role to play through Environmental Education (EE) in trying to improve this situation to the best of our abilities, particularly in terms of empowering individuals to take action [5]. In this sense, Ref. [6] points out that effective environmental education goes beyond a unidirectional transfer of information. Instead, it develops and enhances environmental attitudes, values, and knowledge while building skills that prepare individuals and communities to collaboratively undertake positive environmental action. In fact, there is now a general social consensus on the importance of EE as a key element for creating awareness in citizens of the need to maintain the environmental conditions of our surroundings within acceptable margins [7].
In any case, the challenges are also numerous, with the feeling that we are always trailing behind issues that surpass the objectives and possibilities of EE. Some of these challenges are as follows:
  • The paradox that even though we have more environmental information available, especially through the media, it has not resulted in a social transformation towards more sustainable lifestyles. These lifestyles often clash with immediate beliefs and interests that encourage consumerism and tend to overlook individual responsibility in the global situation.
  • Formal EE is practically anecdotal despite recognizing certain advances in curriculum designs and materials. However, the conditions of the teaching staff also do not contribute to greater involvement.
  • Pure activism [8], or in other words, taking pro-environmental actions without undertaking appropriate reflection on what we do, why we do it, and for what purpose, prevents us from interpreting what is happening and being able to undertake future actions based on well-founded reasons.
In recent years, alternative teaching and learning strategies have emerged in the field of science education in general, and EE in particular, as a reaction to conventional methods and in line with constructivist principles [9]. According to [10], there is already sufficient evidence of the effectiveness of various inquiry-based methods of instruction, including project-based learning, inquiry-based learning, guided discovery, and others, which have all provide opportunities for developing explanations and seeking solutions of a different nature. One such methodology is Problem-Based Learning (PBL). As Ref. [9] indicates, PBL approaches develop students’ abilities to tackle complex, unstructured problems that resemble situations they are likely to encounter in the future. Therefore, PBL seems to align with the educational needs of EE, which frequently involve finding solutions to diverse environmental problems [11,12]. Moreover, this methodology offers noteworthy didactic potential, manifested in the improvement of knowledge and skill integration, avoidance of fragmented learning, development of creative and critical thinking, interdisciplinary and autonomous learning, teamwork, and enhanced problem-solving [13,14,15,16]. Hence, the aforementioned supports the presumed suitability of PBL in EE development. However, few studies have analyzed the relationship between the two and the potential deficiencies and challenges that may arise in their implementation.
The aim of this work is to describe in the form of a case study the functioning, performance, problems addressed, and didactic implications of the methodology in question when applied to the field of EE, as well as to specify recommendations for future implementations. In order to achieve this objective, a qualitative interpretative investigation was carried out, consisting of a detailed analysis of the development of this methodology in two Spanish secondary schools over two consecutive academic years with students in the ninth and tenth grades of secondary education. For this purpose, an evaluation was performed using three instruments to collect formative evidence in the development of the PBL methodology, namely an analysis of Strengths, Weaknesses, Opportunities and Threats (SWOT) of the diary of the researcher who applied the PBL methodology, self-evaluation and reflection questionnaires of the participating students, and questionnaires and rubric of the audience present on the day of the exposition of the final product obtained by the students. Some of the conclusions following the analysis of the aforementioned instruments and their subsequent triangulation, as well as the comparison between the two years of intervention, were as follows: the high level of motivation, work and participation, the positive didactic implications of the rich socialization of the project, the problems in time management and cooperative group work, the lack of practice in the methodology under study (PBL) and the problems with the use of ICT.

2. Theoretical Framework

In recent years, various didactic and methodological strategies have been used in EE, such as service learning, problem-based learning, project-oriented learning, simulation games and case studies [17]. Project-based learning (PjBL), together with problem-based learning (PBL), are teaching approaches that are emerging as authentic alternatives to traditional methods. Through previous work using bibliographic analysis [
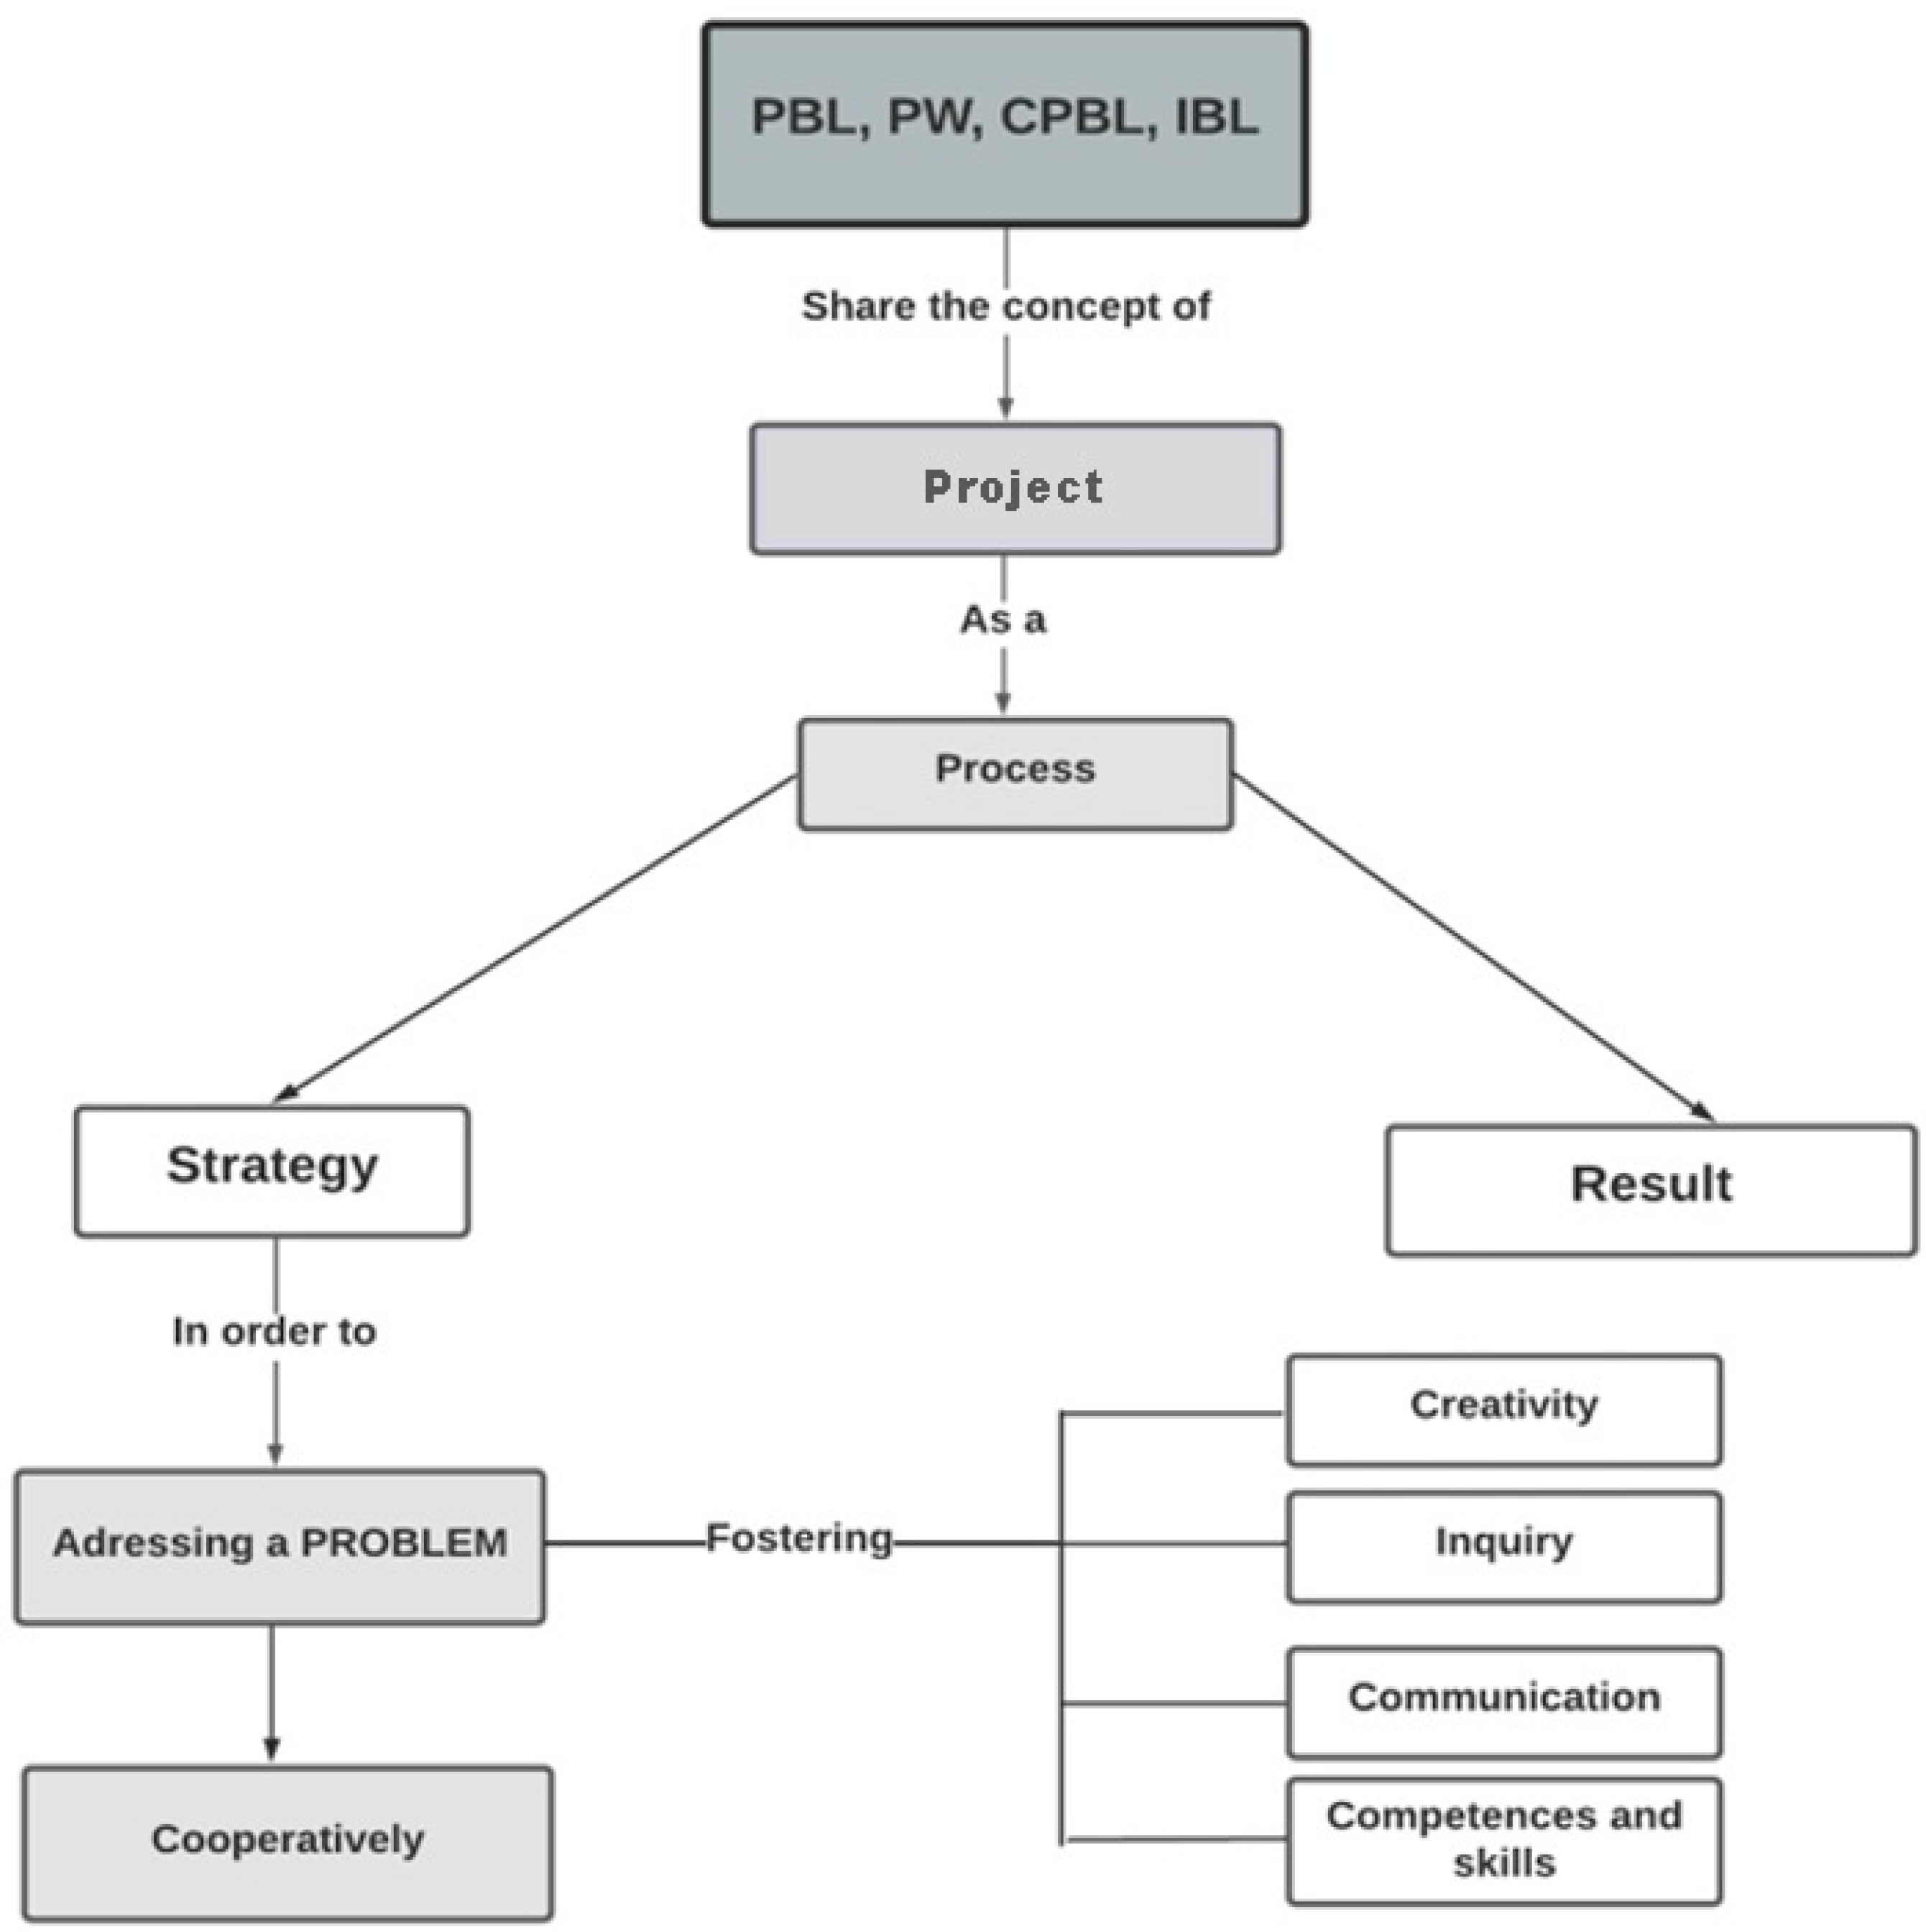
9], we established a comparison between both of them and also with Inquiry-Based Learning (IBL) and Cooperative Learning (CL), establishing a spatial relationship through the conceptual map shown in Figure 1.
One of the conclusions we reached was that the project, in terms of its denomination and internal relationships, can be considered as the overarching concept, with PBL, CPBL, and IBL as subconcepts, with the latter being seen as a consequence of Project-Based Learning (PjBL). It was found to stimulate creativity, inquiry, communication, and diverse learning.
Despite its adaptability to different types of knowledge, Environmental Problems (EPs) are an ideal target on which to focus PBL due to the disciplines involved in their resolution, their diversity and their magnitude, which is leading us to a state of “planetary emergency”. The 2030 Agenda of the United Nations and the periodic meetings on Climate Change (those of the IPPC, for example) are good proof of this.
Among other characteristics, EPs [18,19] possess the following features:
  • Due to their complex and ever-changing nature, they do not have a single solution (referred to as open-ended problems in educational jargon [20].
  • Their resolution requires reflection and creative investigation, drawing upon interdisciplinary scientific knowledge as well as everyday and traditional knowledge.
  • They should be useful and applicable to everyday life.
  • They can be used as a didactic end (learning problem-solving skills) or as a means (learning environmental content).
These same characteristics mean that there are also difficulties in dealing with them, some of which are as follows:
  • In the school curriculum, content is often not presented as problematic or integrated across different subjects.
  • They may not emerge from students’ interests and everyday experiences.
  • Their complexity is often overlooked, presenting them as simple and linear cause–effect relationships.
  • The responsibility for solving environmental problems is often attributed to higher authorities, neglecting individual and collective citizen responsibility.

Relationship between EE and PBL

Several studies have been carried out in recent years using PBL/PjBL as a strategy for EE on various topics and research designs. These have focused on water management [21], river dredging [22], ocean water [23,24], school projects [25,26], ecological farming [27], ecological gardens [28], knowledge and attitudes [29,30,31], the development of cross-domain and domain-specific components of experimental problem-solving ability [32], open problem-solving [33], use of smartphones and outdoor education [34]. The research designs used by the mentioned authors vary from quasi-experimental to single-group designs.
In an attempt to summarize the results from this diverse range of previous research, the following accomplishments of PBL in EE for its users can be mentioned: a favorable attitude to its use in the classroom is perceived, environmental awareness is increased, improvement in skills and problem-solving abilities is observed, integrated use of knowledge and knowledge sharing in collaborative group work occur, creativity and research are enhanced, as well as evidence-based argumentation, critical thinking, global thinking, and scientific competence. These findings have been corroborated by other studies [35,36,37,38,39].
On the other hand, in the literature review we conducted earlier, some difficulties or weaknesses for students in the application of PBL have been identified, which seem to contradict some of the previous results, at least partially. These include a lack of improvement in learning outcomes or critical thinking compared to traditional methods, a lack of practice in this methodology, inherent workload overload, challenges associated with group work, a lack of autonomy in approaching the proposed activities, as well as feelings of confusion, uncertainty, and insecurity, especially in the early stages of the strategy [40].
From the teachers’ perspective, [41,42] include the difficulty of evaluation as a negative aspect, and [42] points out that the implementation of PBL in the classroom is less comfortable for teachers, with increased noise and movement among students, as well as uncertainty compared to more traditional methodologies.
These last disadvantages can surely be totally or partially overcome as this way of working in the classroom is consolidated over time and the majority of the school where it is carried out join in.

3. Methodology

3.1. Research Methodology and Design

The research methodology employed in this study was qualitative, with data processing following a qualitative-interpretive approach [43]. To achieve the research objectives, the same teacher implemented a project in two different secondary schools over consecutive academic years. By replicating the interventions, the aim was to analyze the functioning of the methodology in question in two different contexts, allowing for the comparison and triangulation of the results obtained in both educational settings and enhancing their validity, which was further increased by employing three data collection instruments focused on the same instructional process (the methodology under study), which were triangulated and compared for this purpose.

3.2. Contextualisation and Description of the Sample

Both interventions were carried out in the province of Granada (Spain) in two public secondary schools. The teaching researcher was the same in both courses and had no experience in using PBL as a teaching methodology. The first year of the intervention was carried out in a grade 10 group with 26 students (14 boys and 12 girls) in a school in the provincial capital, which receives students from a medium socio-economic level and with academic results above the average for the area. However, the second intervention was carried out in a grade 9 group with 31 pupils (14 boys and 17 girls) from a secondary school in a village near the capital with a medium-low socio-economic level and with lower academic results than the former. This guaranteed the possibility of analyzing the development of the methodology under study in two different educational scenarios.

3.3. Description of the Project and Problem Posed

The project, which is detailed in Ref. [40], began with a driving question: “Is Granada a liveable city?”, generating, together with the analysis of news and evidence of the situation of environmental parameters, a starting debate that laid the foundations for the development of the project. Likewise, the problem situation the students were required to face was: “How can we improve the urban environment of your city/town?”. In order to answer these questions, the students were divided into cooperative groups (with specific roles assigned). Each group focused their research on a specific environmental parameter of the urban environment: noise pollution, air pollution by gases, the situation of rivers passing through the city, the surface area of urban parks and their condition. The groups analyzed the situation of each of the parameters and looked for possible solutions to the problems found in each of them. To this end, the tasks carried out by the students were diverse: preparation of a glossary of basic ecological and environmental terms; elaboration of a portfolio (with all the information related to the study carried out); creation of a learning diary on the project; diagnosis of the environmental situation in their locality (diversified in the parameters mentioned above: measurement of noise levels, determination of pollutants in river water, analysis of the diversity of parks and gardens, processing of information and elaboration of graphs and tables), the design of a plan of action for the improvement of the environment (this was the proposed solution to the problem posed) and preparation of a presentation and exposition to an audience outside the school. The evaluation was diversified, and rubrics were applied. The total duration of the intervention comprised 24 sessions (Table 1) in both academic years and was carried out within the subject of biology and geology, although language, geography and history teachers also participated.

3.4. Data Collection Instruments

As mentioned above, three instruments were used to obtain the required information to achieve the research objectives: the researcher’s diary, a self-assessment and reflection questionnaire (completed by the participating students) and a questionnaire and evaluation rubric on the presentation of the final product by the students (completed by the audience present).
The researcher’s diary is an extremely useful tool for collecting and/or storing information during the course of a research project [44]. At the end of each day, the diary was filled out, in which the researcher (and teacher) systematically noted down (including the title and date for each entry) reflections, points of view, preliminary conclusions, initial hypotheses, doubts, etc. These notes were structured into five descriptors: observations and description, problems or difficulties, positive aspects or progress, reflections or conclusions and possible improvements. The self-assessment and reflection questionnaire (which was anonymous) had three objectives. Firstly, the students’ level of awareness of the development and structure of the project developed was determined by asking them what the key question of the project was and what the main steps or stages of the project were. Secondly, the personal implications were uncovered by answering the following questions: What was the most important thing you learned from this project? What would you have liked to spend more time on or what would you have done differently? What part did you work on best? Finally, we wanted to know what the strengths and weaknesses of the project were from the students’ point of view, as well as suggestions for improvement; for this purpose, we asked the following questions: What was the most enjoyable part of this project? What was the part you liked the least? How should your teacher modify this project to make it better next time? The questionnaire was taken and adapted from Larmer et al. and administered following the end of the educational intervention [45]. Finally, the audience questionnaire and rubric were used to collect data to obtain relevant information after the students’ execution of the final product exposition. On the one hand, a questionnaire, completed voluntarily and anonymously by the audience, asked five questions about the content and execution of the final product presentation: What did you learn from this presentation, or what did it make you think about? What were the strengths of this presentation? How could this presentation be improved? Any other comments about this presentation? The audience was also asked to fill in a rubric for the students’ presentation (overall). The sections of the rubric were as follows: clear speech, volume, vocabulary, comprehension, content, body posture and eye contact. In both interventions, the audience to whom the final product was presented comprised undergraduates from the Faculty of Education Sciences of the University of Granada (Spain) in the first year of the Social Education degree and the second year of the Teaching degree, respectively. Both the questionnaire and the rubric were taken and adapted from Ref. [45].

4. Data Analysis

4.1. Researcher’s Diary

In this section of the investigation, a Strengths, Weaknesses, Opportunities and Threats (SWOT) analysis was carried out on the researcher’s diary entries. As Mc Dermott points out [46], it is not sufficient to assess the impressions included in the researcher’s diary; rather, it is necessary to systematize, through the SWOT analysis, the evaluation of the teaching–learning process that occurred, classifying and objectifying their assessments. To do this, each of the entries in the diary was divided into the ideas, impressions or descriptions of which it was composed, and each of them was assigned to one of the categories (Weaknesses, Threats, Strengths and Opportunities). The process for the treatment of said analysis was as follows [47,48,49]:
  • Comparison and graphic representation of the frequency of positive (strengths-opportunities, S-O) and negative (weaknesses-threats, W-T) statements in order to determine the general perception (positive or negative) of the teaching–learning process.
  • Comparison and graphic representation of the frequencies of the strengths against the weaknesses of each diary entry.
  • Inductive determination, from the entries in the researcher’s diary, of categories [43], grouping by similarity the weaknesses, threats, strengths and opportunities, obtaining the absolute frequencies in each one of them. A radial graph was subsequently generated to present this result.

4.2. Self-Assessment and Reflection Questionnaire

Once the student responses to the questionnaire were obtained, they were transcribed into a database and processed depending on the type of question. In the case of the first example, the number of students who knew the key question or project guide was simply counted, compared to those who did not (relative frequencies). For the second question, a scale of gradation of knowledge of the steps followed in the project was made as follows, obtaining the relative frequencies for each level of the scale: Excellent: details the steps of the project precisely; Satisfactory: lists most of the steps; Unsatisfactory: only specifies some disorderly steps; and Poor: does not specify the steps. For the remaining questions in the questionnaire, categories were obtained emergently, grouping the responses of the students to each question in the questionnaire by similarity [43]. The categories were formed when there were two or more assumable answers in the same category; otherwise, they were included in “others”. The number of responses per category was quantified, and the relative frequencies of the responses were calculated (which were tabulated), allowing for analysis in terms of satisfaction, deficiencies, improvements, etc.

4.3. Audience Opinion Questionnaire and Rubric

The responses were obtained and then transcribed into a database and processed as in the previous section using a qualitative interpretative methodology for grouping the open responses into emerging categories and with quantifiable elements. (relative frequencies), subsequently producing an analysis of them for each of the questions in the questionnaire [43]. Regarding the rubrics, the absolute and relative frequency of the assessment of each of the sections considered was determined.
In all three cases, the software used to process the data and to prepare the frequency tables and the generated graphs was Microsoft Excel 2016.

5. Results

In another study [44], we report other results obtained in the two educational interventions in terms of environmental awareness, lexical richness and abundance, and perception of the state of the environment.

5.1. Researcher’s Diary SWOT Analysis

Table 2 shows the absolute frequencies of each of the categories of the SWOT analysis implemented for each entry that was made in both years of intervention. In the first year, the number of strengths exceeded the number of weaknesses (37 versus 32); likewise, the opportunities and threats were balanced (8 in both cases). In the second year of the intervention, the number of strengths was again higher than the number of weaknesses (40 versus 37), while the opportunities presented a lower frequency (6) than the threats (10).
On the other hand, in Figure 2 and Figure 3, a greater weight is observed in the number of statements that are located in the upper part of the graph, which corresponds to the strengths, compared to the lower part, which corresponds to the weaknesses. This occurs in both interventions, although with a more positive trend for the first year of the implementation of the project.
The number of statements collected from the researcher’s diary with a positive connotation (strengths and opportunities) as opposed to those with a negative connotation (weaknesses and threats) were 45 and 40, respectively, in the first intervention (Table 3), with the sum of strengths and opportunities being slightly higher. In the second intervention, there were 46 (statements with a positive connotation) compared to 45 (negative connotation), giving a nearly balanced situation between the two (Figure 4 and Figure 5).
As for the process of categorizing the statements collected in the learning diary, Table 4 shows the different categories that emerged (12 in the first intervention and 10 in the second) and their frequency. The categories Information Search and Environmental Awareness did not appear in the second year. In the first intervention, Motivation, Performance and Attitude and Awareness stand out as strengths; weaknesses include Performance and Cooperative Groups; among the opportunities, rich socialization is noteworthy, whereas, among the threats, Time Management was the most frequent category. In the second intervention, the results are very similar except for the weaknesses, where Time Management stood out, and the threats, where ICT was prominent. These results can be easily seen visually in the radial graphs (Figure 6 and Figure 7).

5.2. Self-Assessment and Reflection Questionnaire

The total number of completed questionnaires was 26 in the first year and 31 in the second. Regarding the percentage of students who knew the driving question (“Is Granada a liveable city?”) of the project, in the first intervention it stood at 92% (24 of 26 students), while in the second year, the percentage was 47% (15 of 31 students).
Regarding the question of what steps had been followed in the project, more than 80% of the students in the first year of the intervention carried out an excellent or satisfactory description of the different steps implemented, with this percentage dropping to slightly over 30% in the second year (Table 5).
Table 6 shows the different categories obtained after processing the rest of the questions in the questionnaire; in some cases, the same answer could be considered in more than one category. These largely coincided in both intervention years, with slight adjustments. Furthermore, the absolute and relative frequencies by category are presented. Of the two most frequent categories of each issue, for all questions, at least one category coincides between both interventions, with questions where the coincidence amounts to 2 or 3 categories. It is considered that there is a high degree of similarity in the answers in both years of study.

5.3. Audience Opinion Questionnaire and Rubric

In the first year, 28 questionnaires and rubrics were collected, while in the second, there were 60. Table 7 shows both the categories obtained after processing the responses of the audience to the questionnaire, as well as the absolute and relative frequencies of each one in both interventions. The percentages were calculated based on the total responses obtained for each question (sometimes a response can be assimilated into more than one category). With the exception of the fourth question, the categories obtained in both years of study turn out to be quite similar. Of the two most frequent categories of each question, for all the questions, at least one category coincides between both interventions, with considerable agreement in the most frequent responses.
Regarding the rubric completed by the audience, Table 8 shows the frequencies (absolute and relative) per category in both interventions (percentages were calculated based on the total number of responses obtained for each question). As we have already mentioned, other results can be seen in [44]. The overall evaluation by the audience was significantly better in the first year of study compared to the second. This is evident in the generated comparative graphs of relative frequencies (Figure 8).

6. Discussion

If we go back to the objectives that led us to carry out the study, they sought to describe, as a case study, the functioning, performance, problems addressed, and didactic implications of PBL applied to the field of EE. On the other hand, this section should serve to provide recommendations for future implementations. After the analysis of the data collected through the three measuring instruments used, multiple conclusions have been drawn, reinforced by the triangulation of the data, by the replication in two interventions across consecutive academic years and by the support of previous studies with key contributions to the subject under study. In this sense, we can affirm that PBL was successfully implemented in both years of intervention, functioning and performing reasonably well, with numerous didactic implications, both positive and negative, detected. Likewise, there was a significant increase in the students’ levels of environmental awareness [10,38], as indicated in most of the studies previously quoted, thus demonstrating the effectiveness of this methodology in the field of EE.
Moreover, the results obtained show a better performance and functioning of PBL in the first year of the study, which may be due to the older age and/or the differences in the socio-cultural context of the two schools.

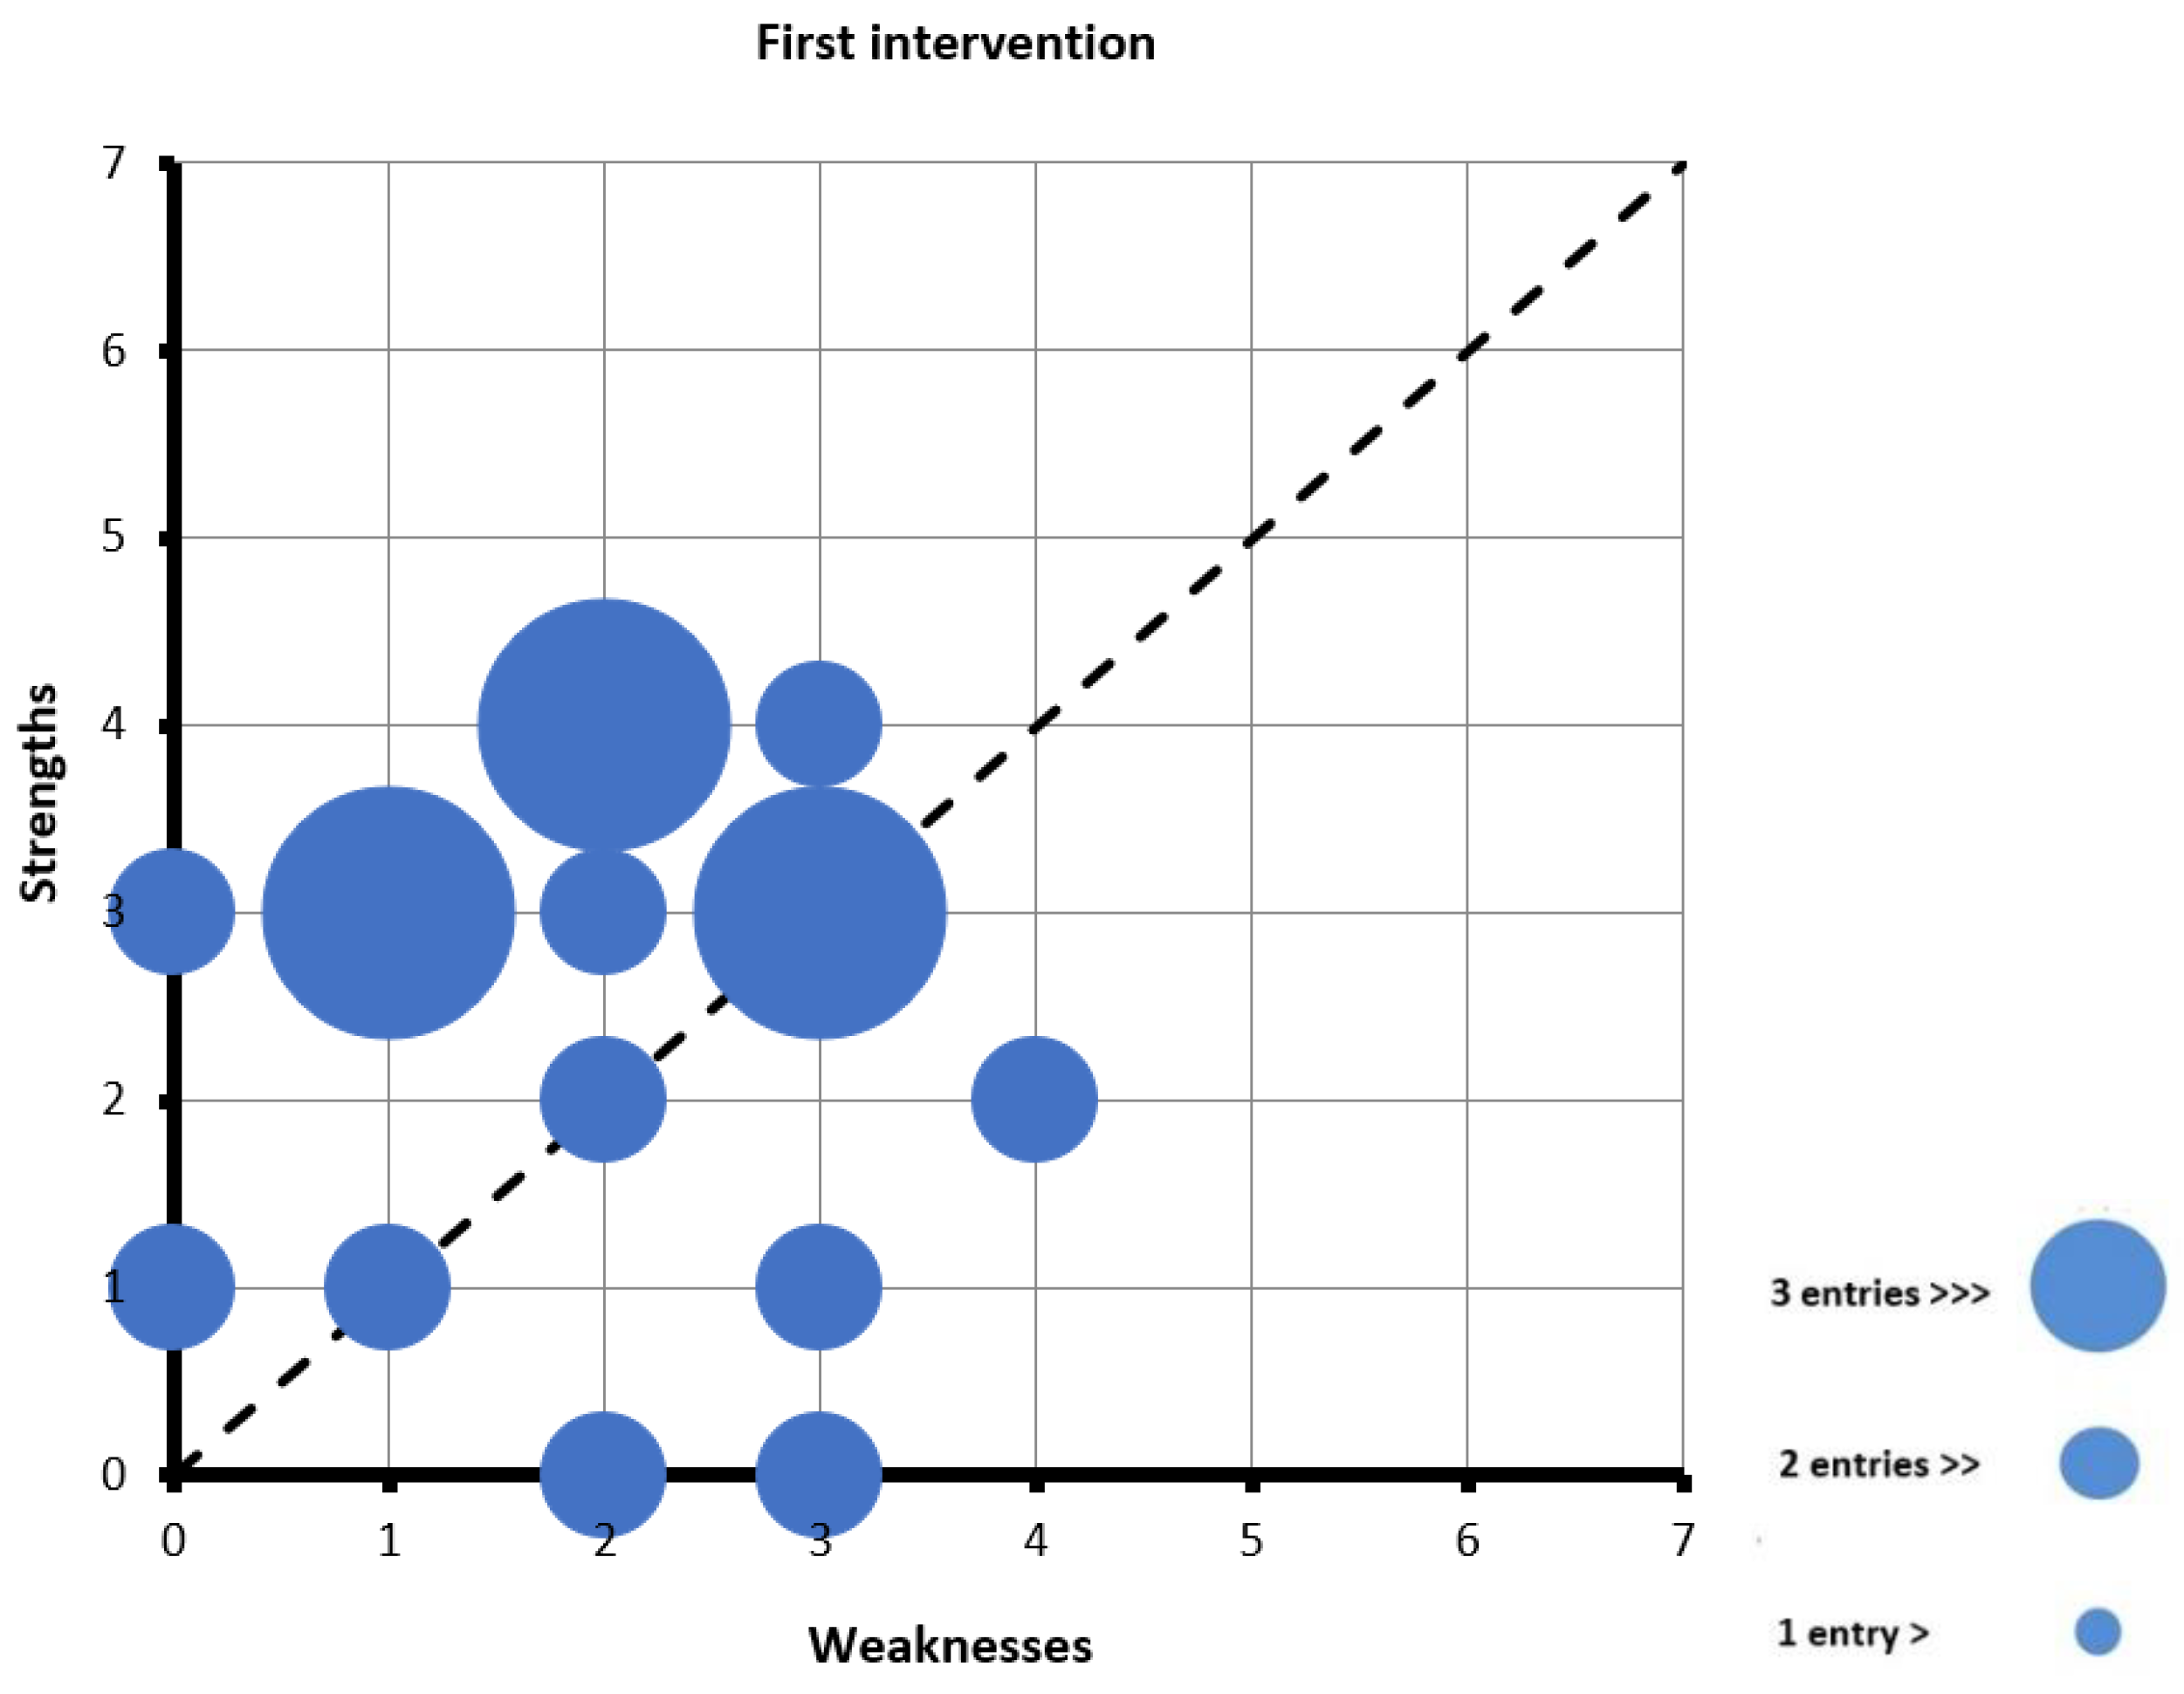
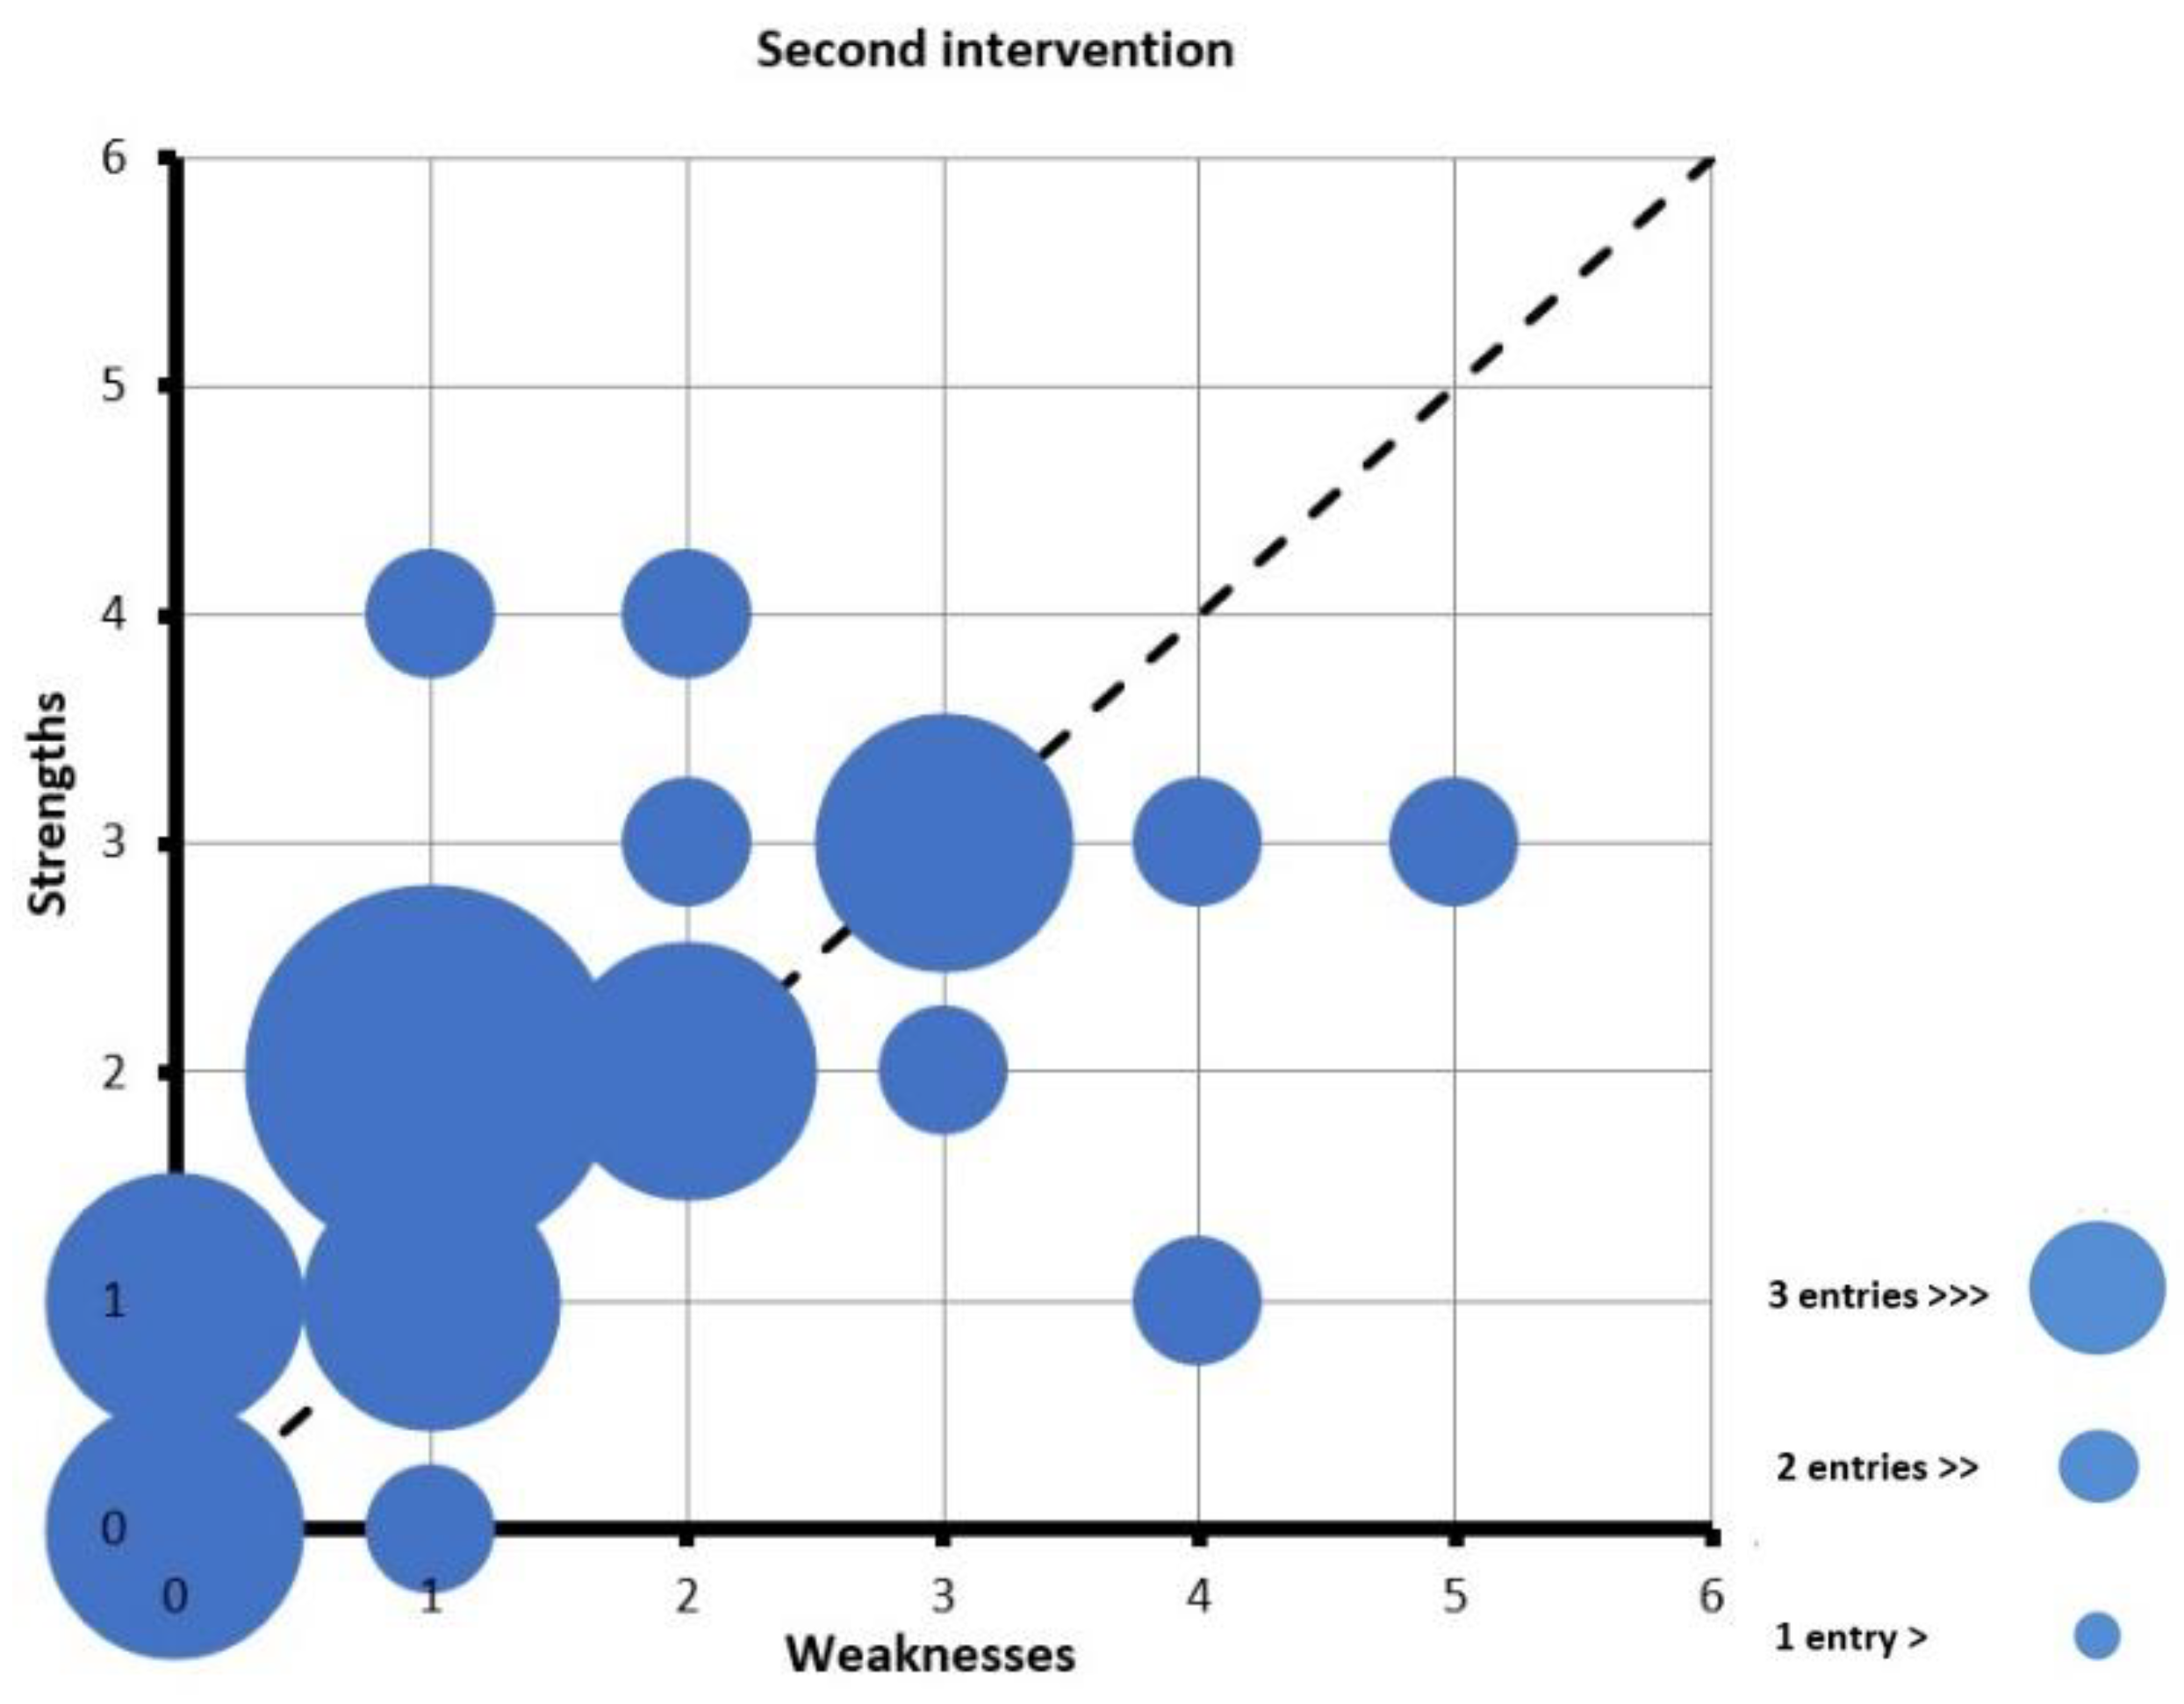
6.1. Researcher’s Diary SWOT Analysis

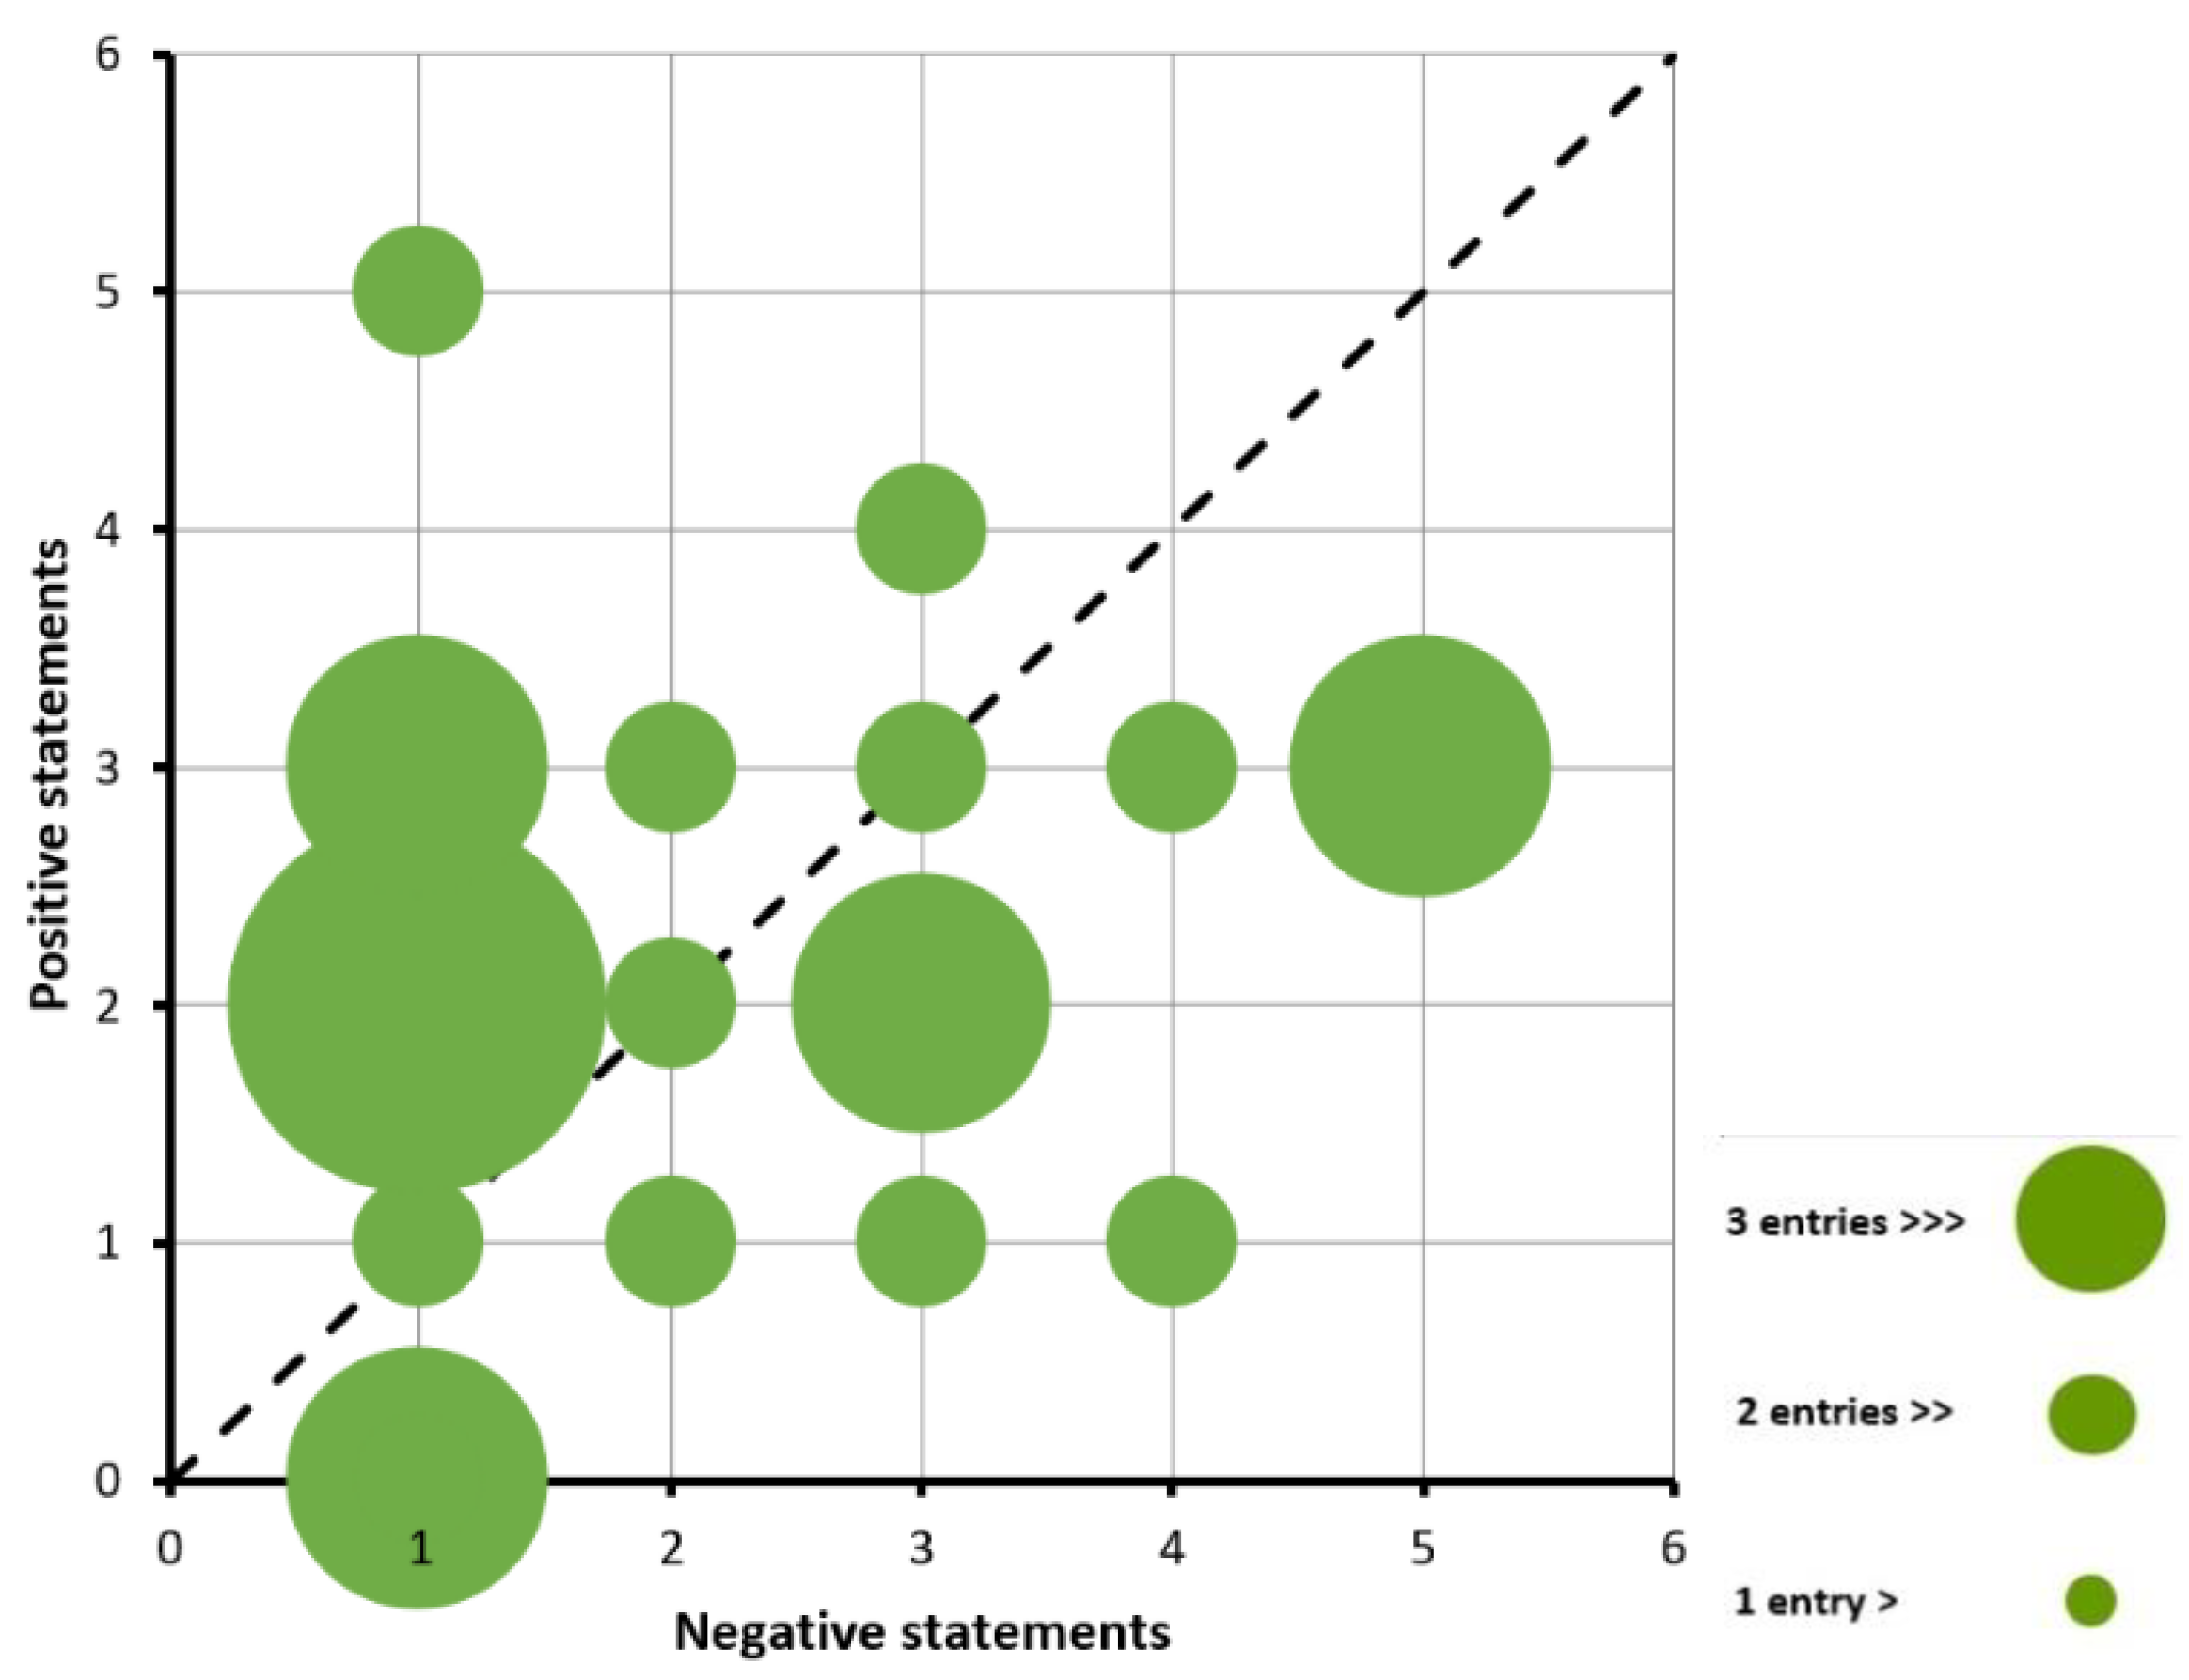
Although in the first year there was a slightly higher number of observations that were classified as Strengths or Advantages, the final balance between Strengths and Opportunities and Weaknesses and Threats was not decisive in any of the intervention years. Although many potentialities and positive effects were evident in its development, the fact that the students had never taken part in a project of this nature meant that there were also a considerable number of setbacks and difficulties in its implementation [21,28], which also resulted in serious disadvantages from the point of view of teaching [40,
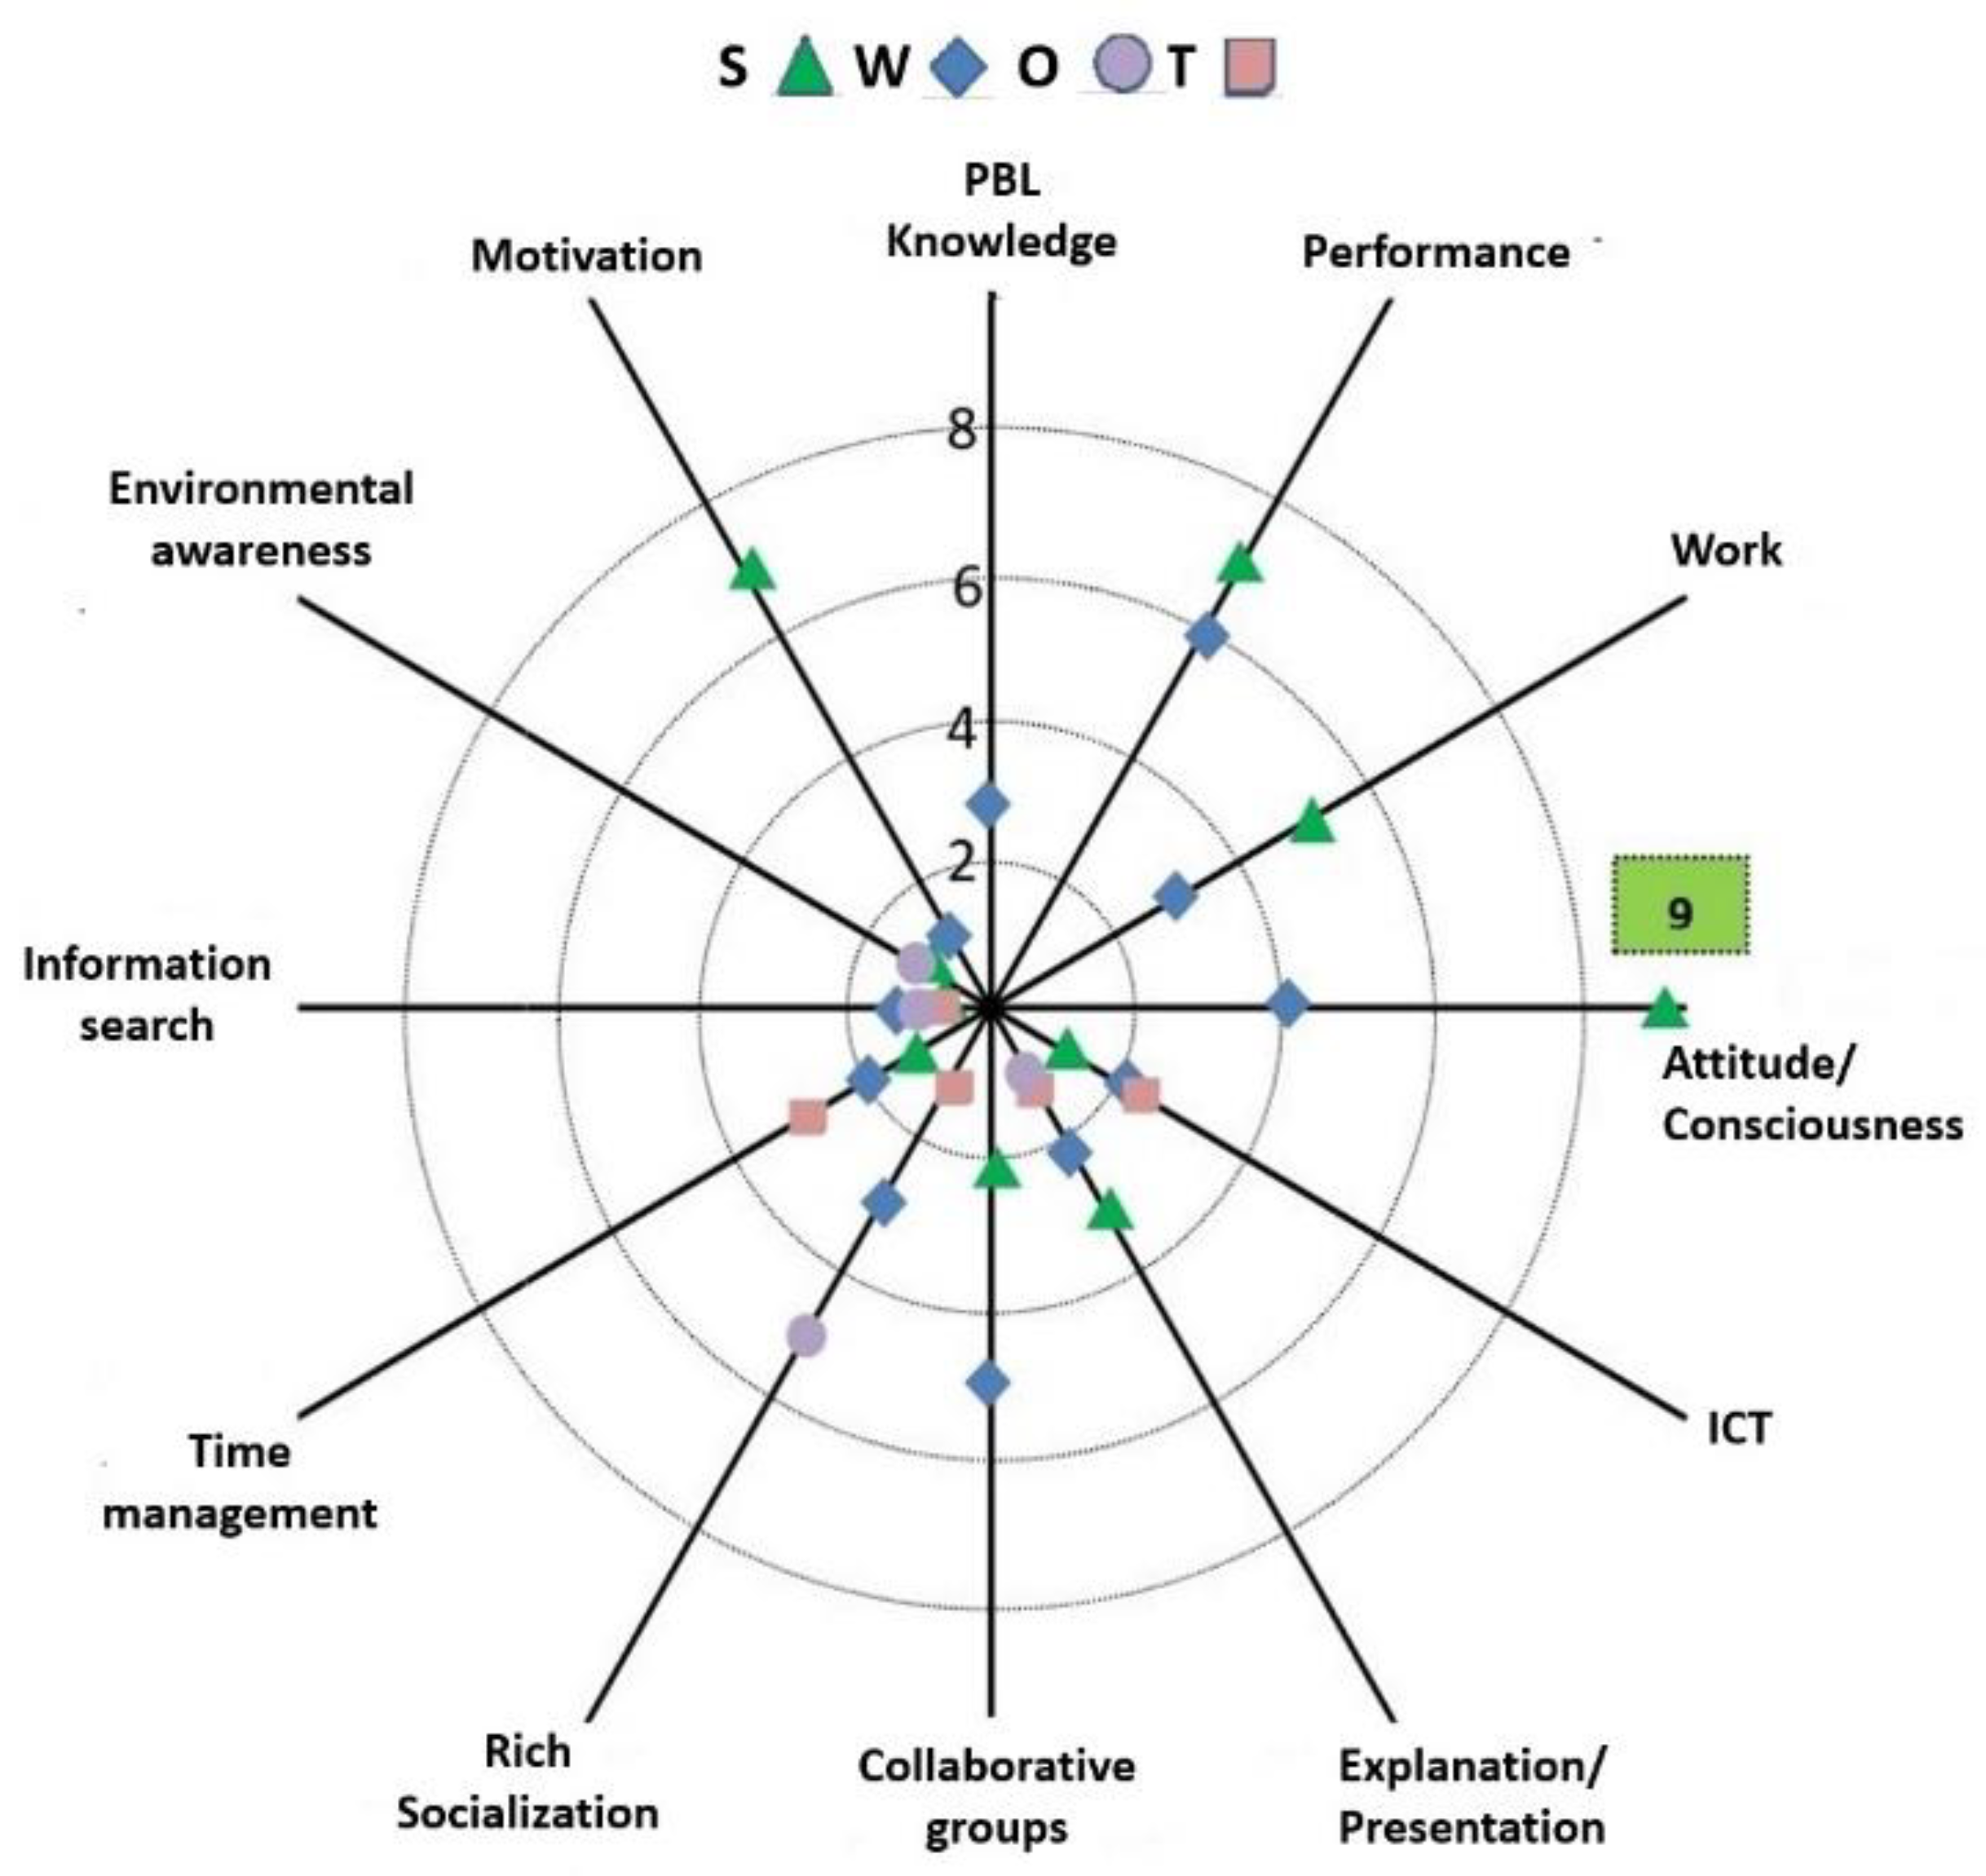
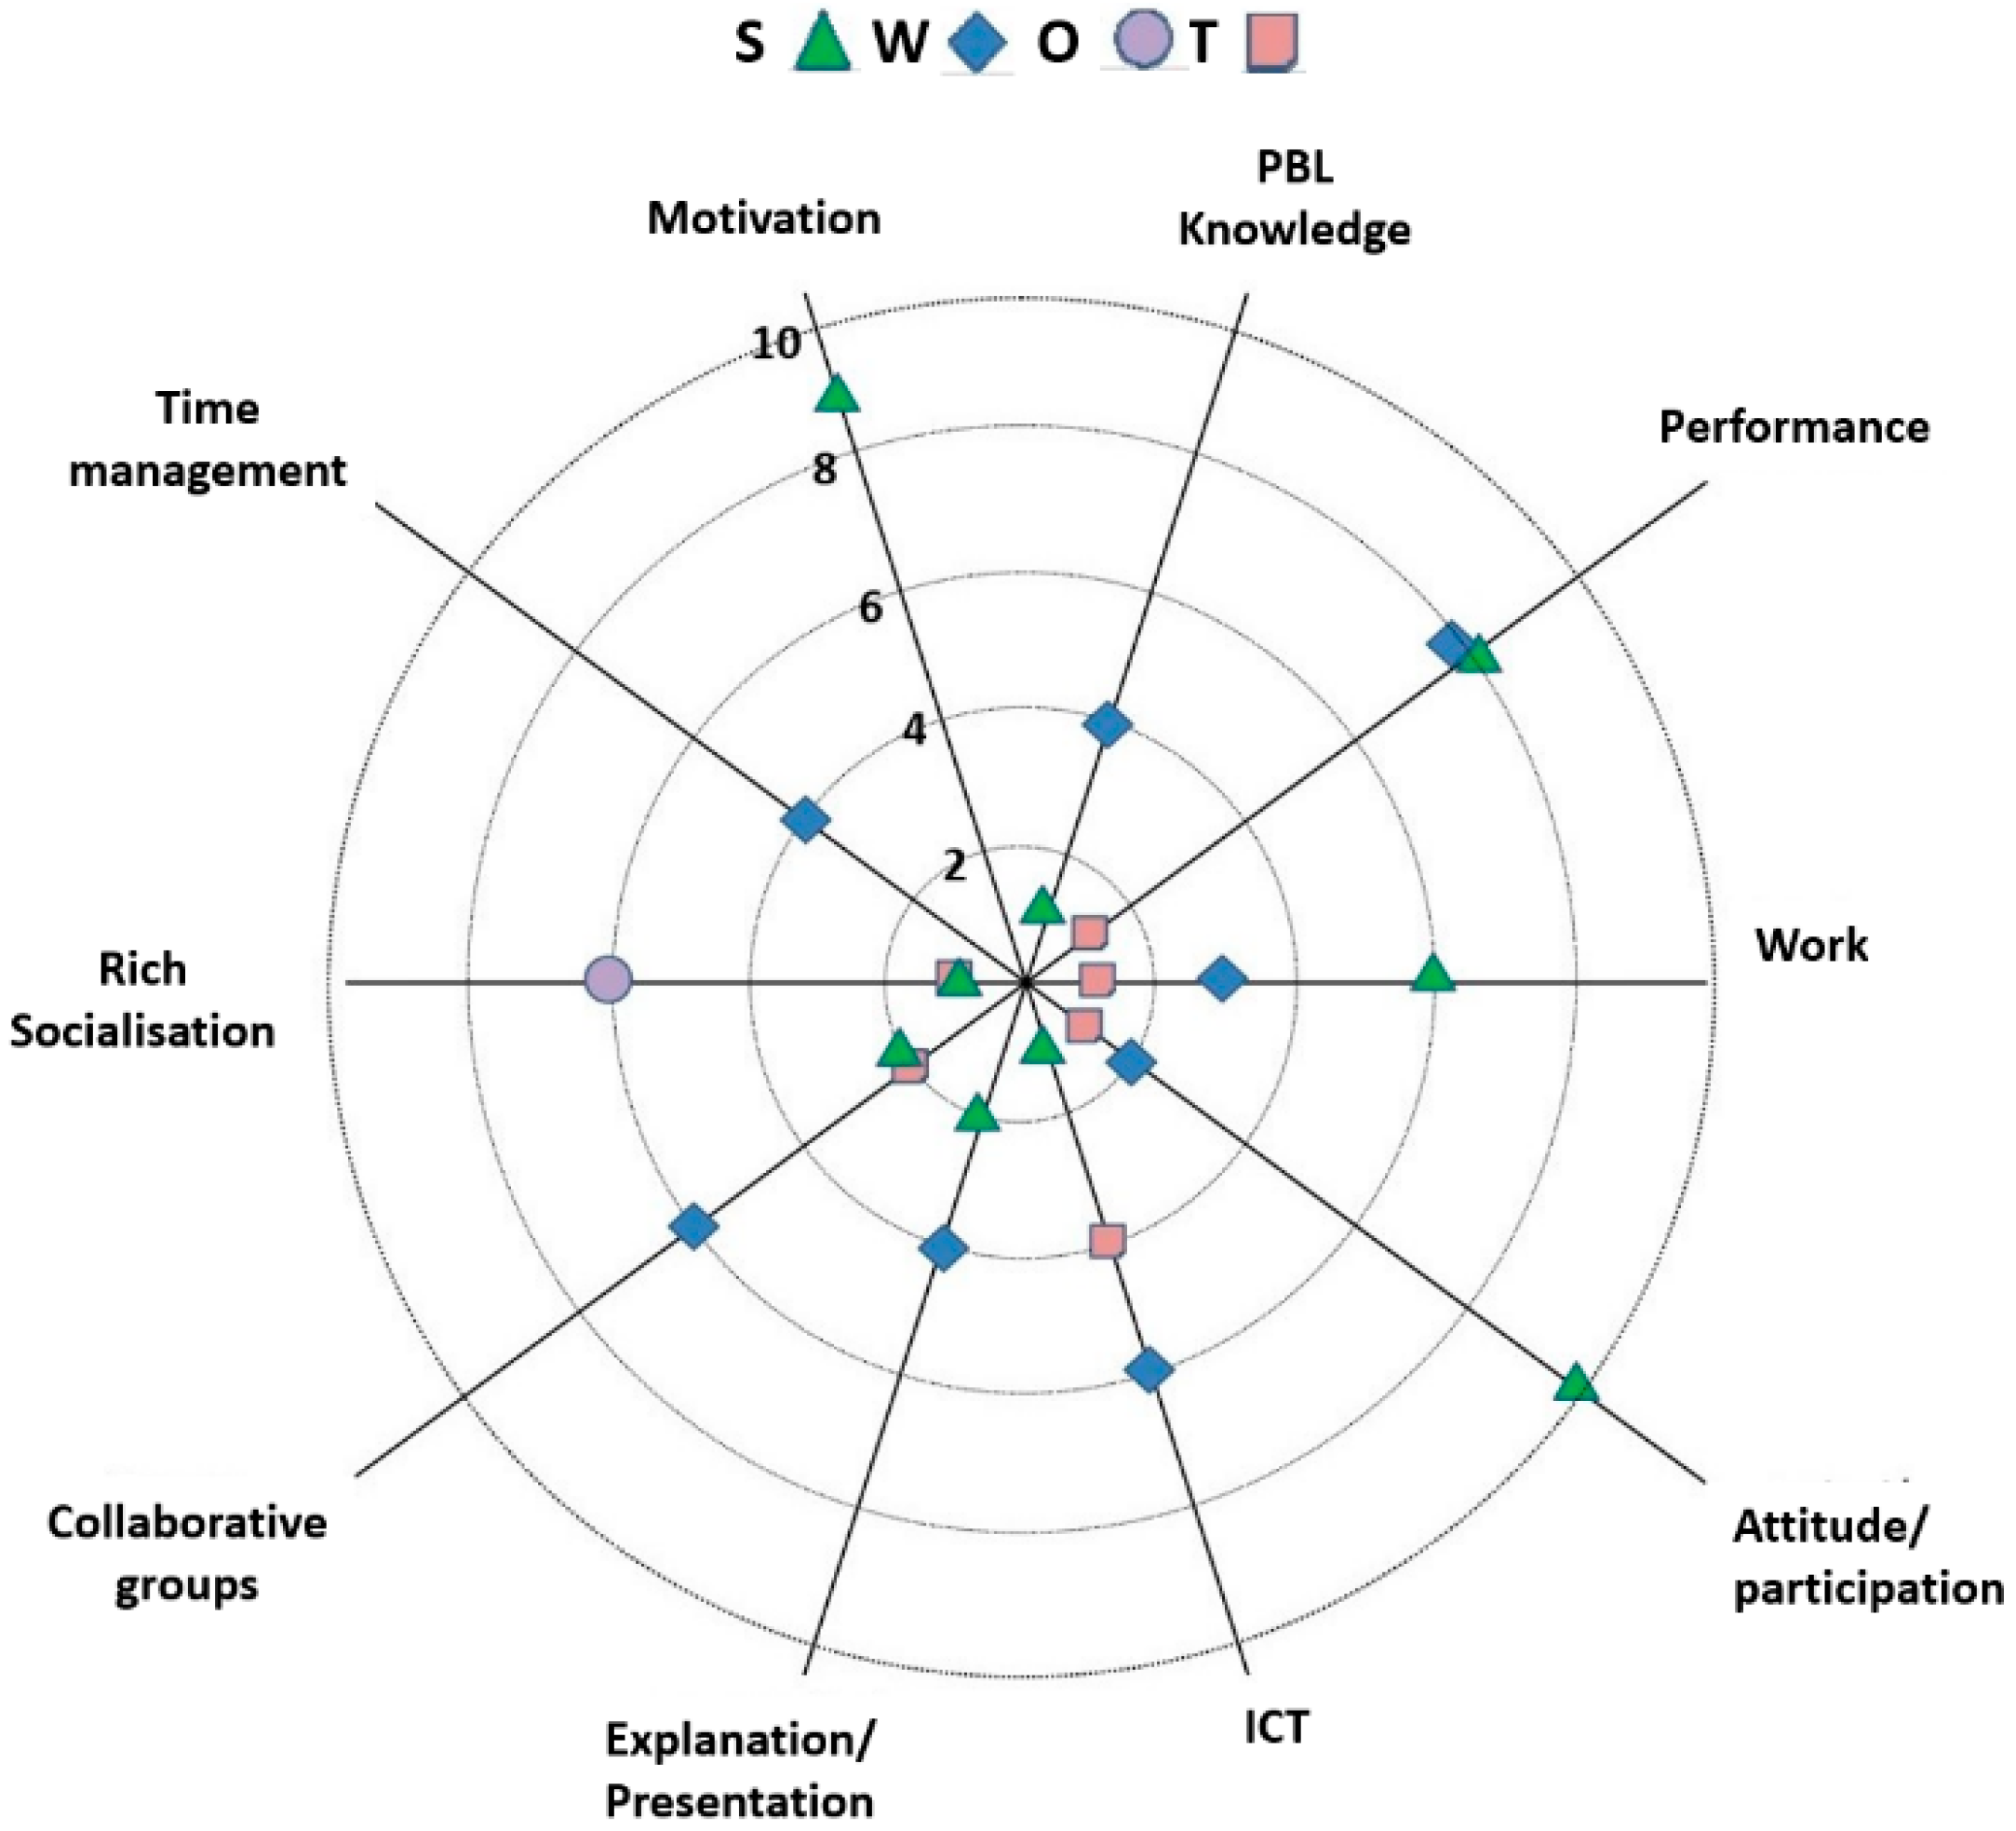
50], such as workload, noise level, management of cooperative groups and monitoring of students’ progress in their work, among others. As for the Motivation category, it was a very frequent strength in both years of intervention, and several studies suggest that PBL increases it among students [29,34,40,51,52]. In our study, this idea was demonstrated from the multiple comments made by the researcher in this regard in his diary, such as follows:
“[…] However, I see that their motivation is adequate, they constantly ask me questions, especially about the specific tasks to be carried out.”
“I must also comment that there are some students who during the first term were quite apathetic and unmotivated (traditional methodology) but now they have changed their attitude somewhat and their motivation has improved, which is evident in their active participation in their group and in their direct questions to the teacher”.
With visible motivation among the participating students, it is a logical consequence that there was good performance (Strength) in the development of the methodology under study; in many cases, these signs of good performance were related to novel and more stimulating tasks not usually carried out in the more conventional methodology [30] (Processing data or photographs, layout of posters, preparation of surveys, etc.). With regard to the Attitude/Participation category (Strength), it is clearly related to the previous ones, understanding that if the students were sufficiently motivated during the project, this facilitated an improvement in their attitude towards the tasks to be carried out and their participation and focus on them to increase [28]. In terms of the most frequent opportunities detected in the SWOT in both years of the intervention, the rich socialization category stands out among the others, understanding as such all the interactions that the students had with “actors” outside the educational center. This had a clear connection with the increased motivation of the students. Some references in this sense are as follows:
“At the end of the day they tell me about their experiences, the interaction with people when interviewing them has caught their attention.”
“Even at the end of it, some people from the audience went up to the stage to express their opinion spontaneously, which was quite positive for the students.”
In reference to the weaknesses, “Performance” was a negative aspect in both years of study, which is evident in some of the observations recorded in the researcher’s diary:
“In addition, I denote a lack of autonomy in many of the tasks that I entrust to them. I sincerely believe that it is due to the immaturity of the students and their lack of competence when it comes to facing real problems.”
“Performing the review of the portfolios, some students still have not done many of the tasks, despite the fact that it has been repeated and discussed several times individually and in groups.”
These references to situations in which low performance or lack of work is denoted may be due, among other reasons, to the complexity that the development of an ambitious project such as the one in this study can sometimes entail, such as a loss or lack of motivation on the part of students and work overload [21,40,53]. In addition, the category Cooperative groups refers to those difficulties that prevented better functioning within the groups, this fact being supported by previous studies [21,27] and evidenced in some of the researcher reflections:
“Students tend not to know how to work in a group, especially in the sense of not knowing how to distribute the work well.”
“Some students work considerably less within the group.”
One of the weaknesses in the second year of intervention was ICT, understood as a lack of competence among students in the use of different digital tools necessary for the project, materializing in the use of digital portfolios, spreadsheets or “the cloud”. This is a relevant fact since the methodology in question frequently requires a high level of competence in the use of ICT. Regarding threats, there were disparate results in the first and second years of the intervention. In the first year, the category Time management was especially prominent, which also turns out to be a recurring problem in PBL in other areas different from EE [54,55]. In the second year, the most frequent threat was the ICT category. In this case, it was due to the low quality and quantity of computing resources, such as computers or Internet connection. This complicated the future of the environmental project.

6.2. Self-Assessment and Reflection Questionnaire

The responses were more varied and comprehensive in the first year of intervention (grade 10), indicating a better functioning of the PBL. In fact, approximately 92% of the students in the first year (compared to 50% in the second year) remembered and identified the guiding question of the project, which is essential, especially when it is being initiated. This guiding question, along with the posed problem, serves as a reference throughout the project [45]. As mentioned earlier, this disparity may be due to the age differences among the students and/or the socio-cultural context of the educational institutions. The differences in the percentage of correctly indicating the main steps of the project (80% in the first year compared to 30% in the second year) support the aforementioned, with the level of awareness about the project’s development in the second year of study falling below desirable levels. This is an indication that the students’ performance within this methodology did not turn out to be optimal or could at least have been better. Regarding the third question in the questionnaire, particularly noteworthy was the More time to complete all the tasks category. These tasks refer to the various activities completed throughout the intervention. Many of the responses highlighted the need for tasks that involve interaction with others outside the classroom (rich socialization). This aspect is considered essential for the proper functioning of the PBL methodology [45,56], which aligns with the results of the SWOT analysis of the researcher’s diary in this regard. Some of the responses that have led us to think about this were:
“Perhaps we would need more days to go out and analyze the environmental situation and carry out surveys.”
“I would have repeated the visit to Granada. It was very good to know our city better and what happens to it.”
“In interacting with the population.”
Within the commented category, multiple references were also made to the lack of time provided to carry out certain tasks:
“I would have preferred to have had a little more time when preparing the presentation and to have done some improvement plan or diagnostic things in a different way, such as graphs.”
“The truth is that the only thing I would change would be to give a little more time to do the presentation.”
These approaches suggest that the problems concerning time management were already specified in the SWOT analysis and this fact is widely commented on in the existing bibliography [57,58,59,60], which is ambivalent because it is precisely an opportunity for students to learn to develop this competence [61]. Likewise, references in this third question to group work are frequent:
“The groups. There are people who have done absolutely nothing.”
“Group work should be done with people you get along with to feel comfortable.”
These difficulties with collaborative group work are referred to in previous research as problems to take into account in the development of the PBL methodology [62], thus constituting it as ideal for improving the capacity for collaboration and teamwork [63]. With respect to the fourth of the questions in the questionnaire, the response category In carrying out tasks for final products included all the mentions of the work phases leading to the elaboration of the final product that were the core of the project. This fact indicates that, despite the difficulties that the students might encounter in developing the project, they liked the methodology used in the EE framework [21,30]. Another frequent category of the fourth question was in conducting surveys, which once again confirms the didactic potential that “rich socialization” presents in the methodology in question [45,56]. In the fifth question, the categories Surveys in the street and The exposition at the Faculty stood out. Regarding the surveys, the students indicated in their questionnaires how pleasant and motivating this task was within the project. Furthermore, there were frequent references to the exposition of the final product at the Faculty:
“Go to the Faculty to present; It was a good experience.”
“In general, all the parts that have involved contact with people from outside the school environment and in which we have been able to report a little about our project.”
“The outings, especially for me, when we presented at the Faculty.”
On the other hand, the two commented categories suppose a development of the communication abilities of the students; this is a facet that is greatly enhanced within the PBL methodology [64,65]. In the sixth question, categories appear similar to those of previous questions, such as Teamwork. The students again make references to the unequal workload and effort of the different members [66]. Furthermore, the category Exposition at the Faculty was also frequent. This precisely indicates the need for students to work more on public presentations since it is a challenge for them. Some comments about it were:
“Having to present at the UGR. I was quite embarrassed.”
“The one to present, because I was scared to speak in front of so many people.”
“Time to make the exposition. It was a lot of fun, but I got really nervous.”
However, the most frequent category in this question was Carry out the tasks for the final product, understanding these as the different tasks necessary to achieve the final product. The students complained about the multiple activities they had to carry out, such as PowerPoint presentations, information searches, presentations, learning diary, etc. Finally, with respect to the seventh question, the Everything was correct category evidently predominated, it being understood that the students presented an acceptable level of satisfaction regarding the development of the project. Another of the categories that turned out to be frequent in both years of intervention was Explain the project better and guide the students more. Some of the responses were:
“He should have cared more about helping us with some things.”
“Guiding the students more, since there were times when I didn’t know what to do.”
“It could give us more indications of what would or would not be the right thing to do, although I know that it’s a way to encourage our creativity.”
The above comments are in line with previous studies, indicating that one of the problems with PBL is precisely that students sometimes feel lost or uncertain, which is inherent to active or “self-directed” methodologies. This fact implies that students learn to control the pace of learning and self-direct their own learning [28,63,67].

6.3. Audience Opinion Questionnaire and Rubric

These two tools proved to be useful for obtaining feedback from people outside the school on the outcome and presentation of the final product of the project in such a way as to serve as a comparison when triangulating the results obtained with the other data collection instruments of the study. In this sense, the evidence obtained shows considerable differences in the performance and functioning of the PBL methodology, being notably superior in the first year of intervention. The categories obtained after processing the instrument were not so homogeneous between the two years of study if we compare them with the researcher’s diary and the student questionnaires. With regard to the first question, two categories were the most repeated: To be aware of the pollution of the city of Granada and Granada province and to know the environmental situation of our province, making it clear that in both years of the intervention, there was a strong environmental message from the students to the audience, which is evidence of the good functioning of the methodology applied in addition to the increase in the level of environmental awareness among the participating students [25,26,29,31]. In the second question, the category The solutions and proposals for improvement provided stood out, again highlighting the success achieved with the project. The category Explanatory charts and slides was also noteworthy. PBL aims for students to develop higher-order cognitive processes, such as data collection, data processing, the production of graphs and the drawing of conclusions and proposals based thereon. This was evident in some of the audience’s comments in their questionnaires:
“The actual graphs that have been presented on noise, gas levels, etc.”
“Population surveys and data presentation.”
“The structure of the presentations has been very interesting in which, first, a problem has been raised, a topic to be investigated, they have analyzed it through surveys, samples, data collection and, finally, they have analyzed said data and have proposed improvements.”
As for the third of the questions in the questionnaire, in the first year of the study, the most frequent comments were ambivalent; on the one hand, the category Using more audiovisual media stood out, which is a criticism of the exposition, in contrast, It has been unbeatable, highlighting the work of the students, with comments such as:
“I think the cooperation between them is unbeatable; coordination and communication have been excellent.”
“Very interesting. Having little time and being in a pretty bad space, I think you have nothing to improve. Very good presentation.”
In the second year of the intervention, most of the responses from the audience were included in the category Management of nerves and appropriate tone of voice. There were many comments in this regard:
“Overall, the presentations have been very good, but in some cases, the students experienced lapses due to nerves. It could be improved by ensuring that the students are calmer.”
“In some cases, a bit more preparation for when the time to present comes and nerves come into play, using the appropriate tone of voice, and knowing how to search for strategies to avoid getting lost while presenting (reading from the slides).”
Finally, in question 4, the “Interesting. It’s been very good overall” category was reiterated, especially in the first year of study:
“All the groups have presented clearly, they have shown that they have a lot of management and fluency with the issue of environmental education. The tone has been correct and the topics covered are very interesting. Congratulations!”
“Organization, coordination, choosing the right aspects and points to present. It can be a heavy subject, but you have defended it adequately.”
However, in the second year, many other categories appeared with negative connotations regarding the presentation of the final product: Sometimes they give an image of insecurity or the errors due to the students’ age are understandable, and their courage in presenting is highly valued”. In any case, the fact that communicative competence is strongly developed in this methodology is reiterated [68].
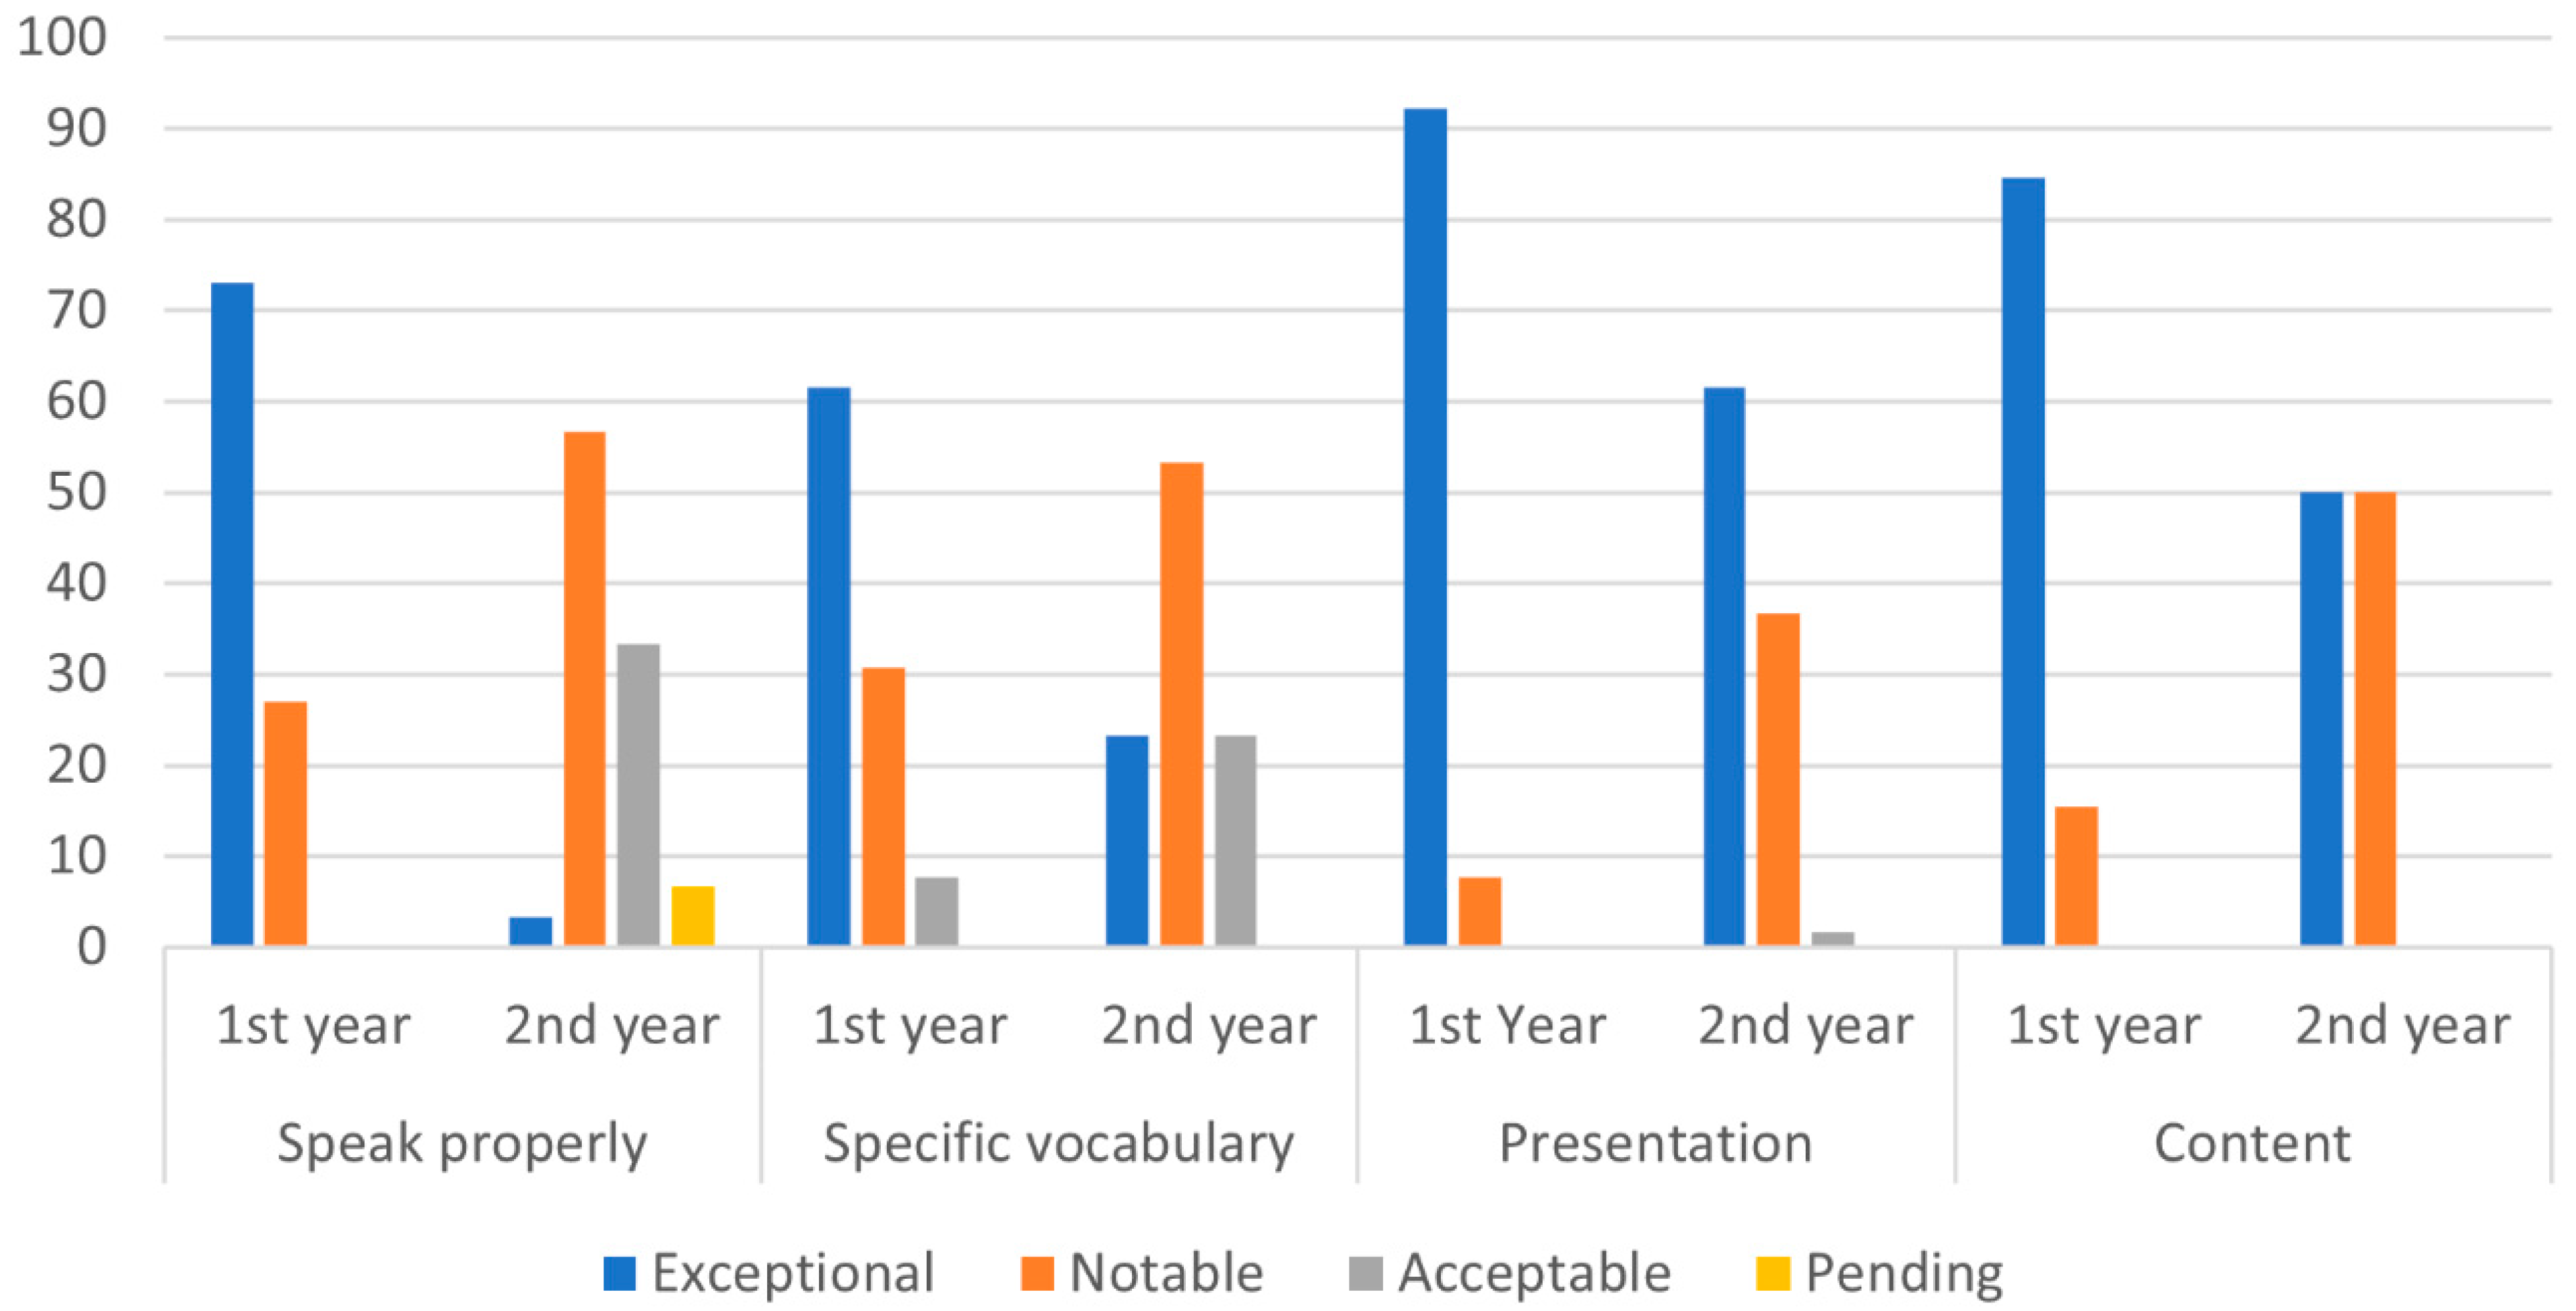
Finally, it is necessary to refer to the completed rubrics. The audience’s assessment was positive in all aspects considered in the relevant rubric for both years. There is a similar behaviour in both years of intervention since the Speak properly and Specific vocabulary sections were less valued than the Presentation and Content sections. However, there were nuances depending on the intervention since those evaluations considered as excellent in all the sections of the rubric were much more frequent in the first year of intervention, this being especially notable in the facet of They speak properly.

6.4. Improvement Proposals for the Implementation of PBL

Once the results obtained have been presented and assessed, and the difficulties in the application of the PBL methodology by the participating students have materialized (such as time management, the functioning of collaborative groups, presentations and/or oral presentations, the lack of autonomy, work overload, loss of motivation or lack of competence in ICT), we understand that it is necessary to carry out some proposals aimed at solving these difficulties.
First of all, we believe that it is essential to provide students with clear guidelines and expectations for their participation in the PBL process, including the delimitation of their roles and responsibilities in cooperative groups. Likewise, it is favorable to design and structure the tasks in such a way that they provide support to the students with the necessary resources and gradually increase the complexity of the problems, laying the foundations for more autonomous learning. Furthermore, it is positive to encourage, through the use of learning diaries, students to reflect on their experiences during and after completing each task, evaluating their own learning process and facilitating their internalization. These diaries should be available to teachers, making it easier to monitor the learning process of students. In addition, it is convenient to ensure that the problems presented are authentic and relevant to the lives of the students, thus increasing their participation and motivation. To solve problems in cooperative groups, it is crucial to promote collaboration and teamwork skills, designing tasks or situations in which students must develop effective communication, problem-solving, and decision-making strategies. With regard to time management, tools such as agendas and calendars should be provided so that they can set goals, track tasks and allocate specific time to work on each one. Likewise, examples of experiences with previous projects can be presented to them so that they have a realistic idea of how much time they may need to complete all the tasks. Work overload, can be managed by making task lists and through the equitable assignment of work (supervised by a teacher). The problems with ICT can be mitigated, however, by adapting activities so that they require fewer technological resources or by providing tutorials, workshops or online learning resources that allow students to acquire the necessary skills to use ICT.

6.5. Limitations of the Study

The results of this study cannot be generalized due to the small sample size. Moreover, despite having been replicated in two educational centers in different contexts, it would be necessary to increase the number of contexts in which the study could be carried out in order to extrapolate the results of the research. Another factor to take into account is that a single teacher implemented the methodology in question in the two years of intervention, which is a fact that could lead to a bias in the functioning and results obtained (Rosenthal effect). Likewise, it is worth mentioning that the results of the study could have been further triangulated with tools such as personal interviews with the students participating in the project or with the analysis of the learning diaries completed by them. Such research efforts could not be undertaken within the scope of this investigation.
Nevertheless, and without detracting from the observations made in the previous paragraph, we believe that this study has opened the way for future research in the field of PBL and EE in the context of secondary education, yielding results and conclusions of relevance to be taken into account in future studies in this field. This section is not mandatory but may be added if there are patents resulting from the work reported in this manuscript.

Author Contributions

Conceptualization, J.A-.L. and F.J.P.-P.; Methodology, J.A.-L. and F.J.P.-P.; Software, J.A.-L.; Validation, J.A.-L.; Formal analysis, J.A-.L.; Investigation, J.A.-L. and F.J.P.-P.; Data curation, J.A.-L.; Writing—original draft, J.A.-L. and F.J.P.-P.; Writing—review & editing, J.A.-L. and F.J.P.-P.; Supervision, F.J.P.-P.; Project administration, J.A.-L.; Funding acquisition, F.J.P.-P. All authors have read and agreed to the published version of the manuscript.

Funding

This research was funded by MCIN/AEI/10.13039/501100011033/ and “Unión Europea NextGenerationEU/PRTR”. 30.BK.87.R1.01 TED2021.129474B.I00.

Institutional Review Board Statement

At the time of the study, the University of Granada did not require any approval from the ethics committee for doctoral thesis research. However, this research project was sup-ported by the Consejería de Educación de la Junta de Andalucía (Administration responsible for the management of education), which approved two research projects with the references PIV-044/16 and PIV-050/17.

Informed Consent Statement

Informed consent was obtained from all subjects involved in the study.

Data Availability Statement

The data presented in this study are available upon request from the corresponding author.

Conflicts of Interest

The authors declare no conflict of interest.

References

  1. Golledge, N.R.; Keller, E.D.; Gomez, N.; Naughten, K.A.; Bernales, J.; Trusel, L.D.; Edwards, T.L. Global environmental consequences of twenty-first-century ice-sheet melt. Nature 2019, 566, 65–72. [Google Scholar] [CrossRef] [PubMed]
  2. Hickman, C. We need to (find a way to) talk about… Eco-anxiety. J. Soc. Work Pract. 2020, 34, 411–424. [Google Scholar] [CrossRef]
  3. Shen, M.; Huang, W.; Chen, M.; Song, B.; Zeng, G.; Zhang, Y. (Micro) plastic crisis: Un-ignorable contribution to global greenhouse gas emissions and climate change. J. Clean. Prod. 2020, 254, 120138. [Google Scholar] [CrossRef]
  4. Rockström, J.; Steffen, W.; Noone, K.; Persson, A.; Stuart Chapin, F.; Lambin, E.F.; Lenton, T.M.; Scheffer, M.; Folke, C.; Schellnhuber, H.J.; et al. A safe operating space for humanity. Nature 2009, 461, 472–475. [Google Scholar]
  5. Vega, P.; Suárez, P.A. Planteamiento de un marco teórico de la Educación Ambiental para un desarrollo sostenible. Rev. Electron. Ensen. Cienc. 2005, 4, 187–208. [Google Scholar]
  6. Ardoin, N.M.; Bowers, A.W.; Gaillard, E. Environmental education outcomes for conservation: A systematic review. Biol. Conserv. 2020, 241, 108224. [Google Scholar] [CrossRef]
  7. Gutiérrez, J. La Educación Ambiental “Fundamentos Teóricos, Propuestas de Transversalidad y Orientaciones Extracurriculares”; La Muralla: Madrid, Spain, 2011. [Google Scholar]
  8. Rodríguez-Marín, F.; García-Díaz, J.E. El activismo que no cesa. Obstáculos para incorporar la metodología didáctica basada en la investigación del alumno a la práctica de la Educación Ambiental. Investig. Esc. 2009, 67, 23–36. Available online: http://hdl.handle.net/11441/60787 (accessed on 27 April 2023).
  9. Perales, F.J.; Ayerbe, J. El trabajo por proyectos y por resolución de problemas en Educación Ambiental: Análisis y tendencias. In Proceedings of the XXVII Encuentros de Didáctica de las Ciencias Experimentales, Badajoz, Spain, 7–9 September 2016. [Google Scholar]
  10. Chinn, C.A.; Iordarwu, K. Theories of Learning. In Handbook of Research on Science Education; Lederman, N.G., Zeidler, D.L., Lederman, J.S., Eds.; Routledge: New York, NY, USA, 2023; Volume III, p. 119. [Google Scholar] [CrossRef]
  11. Owen, C. Problem-based learning. In Learning and Teaching in Higher Education; Daniels, K., Elliott, C., Finley, S., Chapman, C., Eds.; Edward Elgar Publishing: Cheltenham, UK, 2019; pp. 139–151. [Google Scholar] [CrossRef]
  12. Ayerbe, J. Project-Based Learning in Environmental Education. Implementation in Secondary Education. Doctoral Thesis, University of Granada, Granada, Spain, 2021. [Google Scholar]
  13. Birgili, B. Creative and critical thinking skills in problem-based learning environments. J. Gift. Educ. Creat. 2015, 2, 71–80. Available online: https://dergipark.org.tr/en/pub/jgedc/issue/38680/449365 (accessed on 27 May 2023).
  14. Dolmans, D.H.; Loyens, S.M.; Marcq, H.; Gijbels, D. Deep and surface learning in problem-based learning: A review of the literature. Adv. Health Sci. Educ. 2016, 21, 1087–1112. [Google Scholar] [CrossRef]
  15. Tan, O.S. Problem-Based Learning Innovation: Using Problems to Power Learning in the 21st Century; Gale Cengage Learning: Detroit, MI, USA, 2021; Available online: https://scholarworks.iu.edu/journals/index.php/ijpbl/article/download/28769/37349/86436 (accessed on 17 May 2023).
  16. Yew, E.H.; Goh, K. Problem-based learning: An overview of its process and impact on learning. Health Prof. Educ. 2016, 2, 75–79. [Google Scholar] [CrossRef]
  17. Tejedor, G.; Segalàs, J.; Barrón, Á.; Fernández-Morilla, M.; Fuertes, M.T.; Ruiz-Morales, J.; Gutiérrez, I.; García-González, E.; Hernández, Á. Didactic strategies to promote competencies in sustainability. Sustainability 2019, 11, 2086. [Google Scholar] [CrossRef]
  18. García Díaz, J.E. Educación Ambiental, Constructivismo y Complejidad; Diada: Sevilla, Spain, 2004. [Google Scholar]
  19. Rivarosa, A.; Perales, F.J. La resolución de problemas ambientales en la escuela y en la formación inicial de maestros. Rev. Iberoam. Educ. 2006, 40, 111–124. [Google Scholar] [CrossRef]
  20. Perales, F.J. La resolución de problemas: Una revisión estructurada. Enseñ. las Cienc. 1993, 11, 170–178. [Google Scholar] [CrossRef]
  21. Gutiérrez, J.; Pirrami, F. Water as Focus of Problem-Based Learning: An Integrated Curricular Program for Environmental Education in Secondary School. US-China Educ. Rev. 2011, 2, 270–280. [Google Scholar]
  22. Aguerri, M.; Bravo-Torija, B. El uso de pruebas en la resolución de problemas reales en 4° de ESO: ¿debemos dragar el río Ebro? Rev. Eureka Sobre Enseñanza Divulg. Cienc. 2017, 14, 302–316. Available online: http://hdl.handle.net/10498/19219 (accessed on 22 May 2023). [CrossRef]
  23. Gao, Q.; Hite, R.L. Developing global awareness and twenty-first century skills using PBL on ocean pollution. US-China Educ. Rev. 2018, 8, 341–351. [Google Scholar] [CrossRef]
  24. De Araújo, D.; Farias, R.; de Lucena, P.; Lindsey, M.; Piñeiro, C.; Dolbeth, M. Improving environmental awareness and ocean literacy through hands-on activities in the tropics. Appl. Environ. Educ. Commun. 2022, 21, 120–139. [Google Scholar] [CrossRef]
  25. Son, M.H.; Park, H.G.; Cheong, C. Effects of eco-friendly school project activity on middle school students’ environmental awareness. Hwankyungkyoyuk 2011, 24, 34–43. [Google Scholar]
  26. Hashimoto-Martell, E.A.; McNeill, K.L.; Hoffman, E.M. Connecting Urban Youth with their Environment: The Impact of an Urban Ecology Course on Student Content Knowledge, Environmental Attitudes and Responsible Behaviors. Res. Sci. Educ. 2012, 42, 1007–1026. [Google Scholar] [CrossRef]
  27. Kim, M.; Tan, H.T. A collaborative problem-solving process through environmental field studies. Int. J. Sci. Educ. 2013, 35, 357–387. [Google Scholar] [CrossRef]
  28. Aragón, L. ¿Cómo es el suelo de nuestro huerto? El Aprendizaje Basado en Problemas como estrategia en Educación Ambiental desde el Grado de Maestro/a en Educación Infantil. Didact. Cienc. Exp. Y Soc. 2016, 30, 171–188. [Google Scholar] [CrossRef]
  29. Genc, M. The project-based learning approach in environmental education. Int. Res. Geogr. Environ. Educ. 2014, 24, 105–117. [Google Scholar] [CrossRef]
  30. Al-Balushi, S.M.; Al-Aamri, S.S. The effect of environmental science projects on students’ environmental knowledge and science attitudes. Int. Res. Geogr. Environ. Educ. 2014, 23, 213–227. [Google Scholar] [CrossRef]
  31. Ural, E.; Dadli, G. The effect of problem-based learning on 7th-grade students’ environmental knowledge, attitudes, and reflective thinking skills in environmental education. J. Educ. Sci. Environ. Health 2020, 6, 177–192. [Google Scholar] [CrossRef]
  32. Roesch, F.; Nerb, J.; Riess, W. Promoting Experimental Problem-solving Ability in Sixth-grade Students Through Problem-oriented Teaching of Ecology: Findings of an intervention study in a complex domain. Int. J. Sci. Educ. 2015, 37, 577–598. [Google Scholar] [CrossRef]
  33. Rosa-Novalbos, D.; Martínez-Aznar, M.M. Resolución de problemas abiertos en ecología para la ESO. Ensen. Cienc. 2019, 37, 25–42. [Google Scholar] [CrossRef]
  34. Jakab, I.; Zigová, M.; Pucherová, Z. Modernization of Environmental Education with the Use of Project-Based Learning, Outdoor Education and Mobile Learning Supported by Information and Communication Technology. In Universities in the Networked Society; Smyrnova-Trybulska, E., Kommers, P., Morze, N., Malach, J., Eds.; Springer: Berlin/Heidelberg, Germany, 2019; pp. 223–248. [Google Scholar]
  35. Yuningsih, Y.; Susilo, M.J. Analogipedia: An android-based module utilizing PBL model based on analogical approach to improve students’ creativity. Anatol. J. Educ. 2022, 7, 45–56. [Google Scholar] [CrossRef]
  36. Baran, M.; Maskan, A.; Yasar, S. Learning Physics through Project-Based Learning Game Techniques. Int. J. Instr. 2018, 11, 221–234. [Google Scholar] [CrossRef]
  37. Setiawan, B.; Supiandi, M.I. The contribution of metacognitive skills and reasoning skills on problem solving ability based on Problem Based Learning (PBL) model. Anatol. J. Educ. 2018, 3, 75–86. [Google Scholar] [CrossRef]
  38. Kricsfalusy, V.; George, C.; Reed, M.G. Integrating problem-and project-based learning opportunities: Assessing outcomes of a field course in environment and sustainability. Environ. Educ. Res. 2018, 24, 593–610. [Google Scholar] [CrossRef]
  39. Portman, M.E.; Teff-Seker, Y. Community-level environmental projects as learning tools for planners: A case study of graduate planning students. Environ. Educ. Res. 2017, 23, 415–435. [Google Scholar] [CrossRef]
  40. Ayerbe, J.; Perales, F.J. Reinvent your city: Project-based learning for the improvement of environmental awareness in secondary school students. Enseñ. las Cienc. 2020, 38, 181–203. [Google Scholar] [CrossRef]
  41. Van den Bergh, V.; Mortelmans, D.; Spooren, P.; van Petegem, P.; Gijbels, D.; Vanthournout, G. New assessment modes within project-based education, the stakeholders. Stud. Educ. Eval. 2006, 32, 345–368. [Google Scholar] [CrossRef]
  42. Markham, T.; Larmer, J.; Ravitz, J.L. Project Based Learning Handbook: A Guide to Standards-Focused Project Based Learning for Middle and High School Teachers; Buck Institute for Education: Novato, CA, USA, 2003. [Google Scholar]
  43. Erickson, F. Ethnographic microanalysis of interaction. In Handbook of Qualitative Research in Education; Le Compte, M.D., Millroy, W.L., Preissle, J., Eds.; Academic Press: New York, NY, USA, 1992; pp. 201–223. [Google Scholar]
  44. Ayerbe, J.; Perales, F.J. Effects of a Project-Based Learning Methodology on Environmental Awareness of Secondary School Students. Int. J. Instr. 2024, in press.
  45. Hernández-Sampieri, R.; Collado, C.; Baptista, M.P. Metodología de la Investigación, 5th ed.; Mc Graw Hill: Madrid, Spain, 2010. [Google Scholar]
  46. Larmer, J.; Ross, D.; Mergendoller, J.R. PBL Starter Kit: To-the-Point Advice, Tools and Tips for Your First Project in Middle or High School; Buck Institute for Education: Novato, CA, USA, 2017. [Google Scholar]
  47. Mc Dermott, L.C. Investigación en Educación en la Física. Rev. Ensen. Física 1998, 11, 17–20. [Google Scholar]
  48. Romero, M.; Martínez, M.; Jiménez, M.R. Evaluación del máster interuniversitario de educación ambiental a través de las percepciones de estudiantes y profesores en un análisis DAFO. Rev. Eureka Sobre Ensen. Divulg. Cienc. 2015, 12, 347–361. Available online: http://hdl.handle.net/10498/17257 (accessed on 3 May 2023). [CrossRef]
  49. Romero, M.; Jiménez, M.R.; Martínez, M. SWOT analysis to evaluate the programme of a joint online/onsite master’s degree in environmental education through the students’ perceptions. Eval. Program Plan. 2016, 54, 41–49. [Google Scholar] [CrossRef]
  50. Mihic, M.; Zavrski, I. Professors’ and students’ perception of the advantages and disadvantages of project based learning. Int. J. Eng. Educ. 2017, 33, 1–14. [Google Scholar]
  51. Doppelt, Y. Implementation and assessment of project-based learning in a flexible environment. Int. J. Technol. Des. Educ. 2003, 13, 255–272. [Google Scholar] [CrossRef]
  52. Morgan, J.R.; Moon, A.M.; Barroso, L.R. Engineering better projects. In STEM Project-Based Learning; Capararo, R., Capraro, M.M., Morgan, J.R., Eds.; Brill Sense: Paderborn, Germany, 2013; pp. 29–39. [Google Scholar]
  53. Gülbahar, Y.; Tinmaz, H. Implementing project-based learning and e-portfolio assessment in an undergraduate course. J. Res. Technol. Educ. 2006, 38, 309–327. [Google Scholar] [CrossRef]
  54. Fukuzawa, S.; Boyd, C.; Cahn, J. Student motivation in response to problem-based learning. Collect. Essays Learn. Teach. 2017, 10, 175–188. [Google Scholar] [CrossRef]
  55. Ruiz-Gallardo, J.R.; González-Geraldo, J.L.; Castaño, S. What are our students doing? Workload, time allocation and time management in PBL instruction. A case study in Science Education. Teach. Teach. Educ. 2016, 53, 51–62. [Google Scholar] [CrossRef]
  56. Trujillo, F. Aprendizaje Basado en Proyectos. In Infantil, Primaria y Secundaria; Ministerio de Educación, Secretaría General Técnica: Madrid, Spain, 2015. [Google Scholar]
  57. Branda, L.A. El abc del ABP: Lo esencial del aprendizaje basado en problemas. Quad. Fund. Dr. Antoni Esteve 2013, 27, 1–16. [Google Scholar]
  58. Lage, J.C.; Petralanda, I.I. Aplicación del aprendizaje basado en problemas en la asignatura Contabilidad Financiera Superior: Ventajas y desventajas. Tend. Pedagog. 2014, 23, 45–60. [Google Scholar]
  59. Mergendoller, J.R.; Thomas, J.W. Managing Project Based Learning: Principles from the Field; Buck Institute for Education: Novato, CA, USA, 2001. [Google Scholar]
  60. Wurdinger, S.; Qureshi, M. Enhancing college students’ life skills through project based learning. Innov. High. Educ. 2015, 40, 279–286. [Google Scholar] [CrossRef]
  61. Oakes, W.C.; Jamieson, L.H.; Coyle, E.J. EPICS: Meeting EC 2000 Through Service-Learning. In Proceedings of the 2001 American Society for Engineering Education Annual Conference & Exposition, Albuquerque, NM, USA, 24–27 June 2001. [Google Scholar]
  62. González-Hernando, C.; Martín-Villamor, P.G.; Almeida, S.D.; Martín-Durántez, N.; López-Portero, S. Ventajas e inconvenientes del aprendizaje basado en problemas percibidos por los estudiantes de Enfermería. FEM Rev. Fund. Educ. Medica 2016, 19, 47–53. [Google Scholar] [CrossRef]
  63. Krajcik, J.S.; Czerniak, C.M. Teaching Science in Elementary and Middle School: A Project-Based Approach; Routledge: London, UK, 2014. [Google Scholar]
  64. Capraro, M.M.; Jones, M. Interdisciplinary STEM project-based learning. In STEM Project-Based Learning; Capararo, R.M., Capraro, M.M., Morgan, J.R., Eds.; Brill Sense: Paderborn, Germany, 2013; pp. 51–58. [Google Scholar]
  65. Capraro, R.M.; Slough, S.W. Why PBL? Why STEM? Why Now? An Introduction to STEM Project-Based Learning: An Integrated Science, Technology, Engineering, and Mathematics Approach. In STEM Project-Based Learning; Capararo, R.M., Capraro, M.M., Morgan, J.R., Eds.; Brill Sense: Paderborn, Germany, 2013; pp. 1–15. [Google Scholar]
  66. Mills, J.E.; Treagust, D.F. Engineering education: Is problem-based or project-based learning the answer? Australas. J. Eng. Educ. 2003, 3, 2–16. [Google Scholar]
  67. Bell, S. Project-based learning for the 21st century: Skills for the future. Clear. House 2010, 83, 39–43. [Google Scholar] [CrossRef]
  68. Asian, A. Problem-based learning in live online classes: Learning achievement, problem-solving skill, communication skill, and interaction. Comput. Educ. 2021, 171, 104237. [Google Scholar] [CrossRef]
Figure 1. Conceptual map relating Problem-based Learning (PBL), Project Work (PW), Cooperative Project-Based Learning (CPBL), and Inquiry-Based Learning (IBL).
Education 13 00915 g001
Figure 2. Number of strengths and weaknesses per entry in the researcher’s diary in first intervention.
Education 13 00915 g002
Figure 3. Number of strengths and weaknesses per entry in the researcher’s diary in second intervention.
Education 13 00915 g003
Figure 4. Set of positive versus negative statements collected in the researcher’s diary in first intervention.
Education 13 00915 g004
Figure 5. Set of positive versus negative statements collected in the researcher’s diary in second intervention.
Education 13 00915 g005
Figure 6. Radial graphs of frequency of appearance of the categories obtained in the SWOT analysis in first intervention.
Education 13 00915 g006
Figure 7. Radial graphs of frequency of appearance of the categories obtained in the SWOT analysis in second intervention.
Education 13 00915 g007
Figure 8. Comparative graph, between both interventions, of the relative frequencies of the assessments of each category of the rubric.
Education 13 00915 g008
Table 1. Phases and duration of the interventions.
PhaseSessions
Beginning event and problem presentation2
Learning of concepts4
Chat with experts (Council)1
Urban environment diagnosis4
Urban environment trip1 morning
Chat with experts (Ecologists)1
Processing of information and determination of environmental state2
Solving the problem: Creation of urban environmental improvement plan.5
Preparation of presentation for showing to audience4
Showing of presentation1
Table 2. Absolute frequencies of the SWOT analysis in both interventions.
First InterventionSecond Intervention
EntriesSWOTEntriesSWOT
16373288214037610
Table 3. Total positive and negative statements (absolute and relative frequency) and overall perception of the SWOT analysis in both interventions.
Intervention Negative StatementsPositive Statements
EntriesWeaknessesThreatsTotalStrengthsOpportunitiesTotalPerception
1st year1632840/0.4737845/0.53Positive
2nd year21371047/0.5140646/0.49Balanced
Table 4. Results of the categorization and frequency of the entries in the researcher’s diary in both years of intervention.
First InterventionSecond Intervention
CategorySWOTSWOT
Motivation71009000
PBL Knowledge03001400
Performance76008801
Work53006301
Attitude940010201
ICT12021604
Presentation32112400
Collaborative groups25002602
Rich socialization03511061
Time management12030400
Environmental awareness1111
Information search1010
Table 5. Degree of precision (absolute and relative frequency) in the description by the students of the different parts of the project in both interventions.
1st Intervention2nd Intervention
DescriptorN%N%
Excellent: details the steps of the project precisely103813
Satisfactory: lists most of the steps1246929
Unsatisfactory: only specifies some disorderly steps4151445
Poor: does not specify the steps00723
Table 6. Categories, absolute and relative frequencies obtained after processing the responses to the questionnaire by the students in both interventions.
1st Intervention2nd Intervention
QuestionCategoryN%N%
What was the most important thing you learned from this project?Detect and be aware of environmental problems20642053
Ecology5161232
Teamwork310410
Lose stage fright2625
Others13--
What would you have liked to spend more time on or what would you have done differently?Make more observations (in situ)311721
More time to take surveys311618
More time to complete all the tasks14501132
In nothing. It was right--515
Another way of making improvement and diagnosis plans620--
Others27515
What part did you work on best?In data processing26616
In search of information41338
In the preparation of the presentation and/or exposition310411
In conducting surveys261130
In carrying out tasks for final products2064822
In the taking of samples and measurements--411
Others--13
What was the most enjoyable part of this project?Make people aware of environmental problems26--
Team work26513
The excursion to the river--513
The exposition at the Faculty9261026
Preparing for the presentation26--
Carrying out the diagnosis39--
Carrying out the improvement plan26--
The measurement of environmental parameters412718
Surveys in the Street9261026
Others1325
What was the part you liked the least?Team work27516
The apathy of the population with the survey27--
Exposition at the Faculty311929
Nothing311413
Make the video for the exposition414--
Carry out the tasks for the final product1140619
Searching for information on the internet--26
Others311516
How should your teacher modify this project to make it better next time?Spend more time413--
Everything was correct7231644
Explain the project better and guide the students more51638
Make groups smaller and more homogeneous310--
Do more practices and excursions2726
Allow students to make groups--1131
Do more practices for the presentations27--
Give more value to individual effort310--
Others413411
Table 7. Categories, absolute and relative frequencies obtained after processing the responses to the questionnaire completed by the audience in both interventions.
1st Intervention2nd Intervention
QuestionCategoryN%N%
What did you learn from this presentation, or what did it make you think about?To be aware of the pollution of the city of Granada and Granada province14382637
To know the environmental situation of our province9242738
In which there is to collaborate actively, changing attitude in my daily actions51357
That solutions and environmental improvement plans must be provided411913
Others51334
What were the strengths of this presentation?Explanatory charts and slides8201416
Everything37--
The appropriate vocabulary for the topics presented37--
Clear and well-structured messages61567
The various types and causes of pollution detected--2832
The solutions and proposals for improvement provided9221517
The good organization--33
Preparatory work for the presentation3756
Confidence and completeness in the presentation51256
The message of environmental awareness transmitted--56
The end game with mobile--45
Others3711
How could this presentation be improved?Implementing more dynamics51434
Using more audiovisual media925--
Management of nerves, appropriate tone of voice.7193853
Preparing presentations better--710
Contributing more experiences and less memorization2568
Explaining more technical terminologies--46
It has been unbeatable514710
Using classrooms in better conditions411--
Others41168
Any other comments about this presentation?Interesting. It’s been very good overall19703660
They have known how to defend the issues exposed very well51858
Good organization, coordination and involvement--23
Sometimes they give an image of insecurity--35
Some students have not respected their classmates while presenting--35
The errors due to the students’ age are understandable, and their courage in presenting is highly valued.--1118
Denotes good previous work--23
Others311915
Table 8. Absolute frequencies (N) and relative frequencies (percentages) per category and rating level in both years of study.
Speak ProperlySpecific VocabularyPresentationContent
1st Year2nd Year1st Year2nd Year1st Year2nd Year1st Year2nd Year
AssessmentN%N%N%N%N%N%N%N%
Exceptional1973.123.31661.51423.32492.33761.62284.63050
Notable726.93456.7830.73253.327.72236.7415.43050
Acceptable002033.327.71423.30011.70000
Pending0046.7000000000000
Disclaimer/Publisher’s Note: The statements, opinions and data contained in all publications are solely those of the individual author(s) and contributor(s) and not of MDPI and/or the editor(s). MDPI and/or the editor(s) disclaim responsibility for any injury to people or property resulting from any ideas, methods, instructions or products referred to in the content.

