
Career Profiles of University Students: How STEM Students Distinguish Regarding Interests, Prestige and Sextype


1
Learning and Teaching with Media, Institute of Education, Department of Human Sciences, Universität der Bundeswehr München, 85579 Neubiberg, Germany
2
Division of Psychological Assessment, Department of Psychology, Paris Lodron Universität Salzburg, 5020 Salzburg, Austria
*
Author to whom correspondence should be addressed.
Educ. Sci. 2023, 13(3), 324; https://doi.org/10.3390/educsci13030324
Submission received: 8 February 2023
/
Revised: 9 March 2023
/
Accepted: 18 March 2023
/
Published: 22 March 2023
(This article belongs to the Special Issue Sticking with STEM: Who Comes, Who Stays, Who Goes, and Why?)
Abstract
:Various factors may be important while individuals develop vocational aspirations. Although occupations that fit one’s personal interests appear to be attractive, contextual factors may repel groups, such as young girls, to develop towards areas such as STEM. Especially, the sextype of STEM occupations, that is often considered as male, could limit STEM career choice of young girls. This study investigates career profiles of n = 9277 German university freshmen based on interests, prestige, and sextype. Eleven latent profiles were found. Five profiles can be characterized by their prestige levels and two further by their sextype. Certain profiles are significantly associated with study outcomes and study satisfaction, which allows to identify at-risk profiles. Of note, especially female students in STEM subjects with a low proportion of females distributed widely across the 11 profiles. The implications of this study suggest that career choice profiles according to Gottfredson’s framework can help to identify at-risk students.
1. Introduction
Although an individual’s career decision may depend on different factors, several theories emphasize the impact of an individual’s interests in this context, e.g., [1,2,3]. Often, concepts such as expectancies, values, and prior experiences are further considered for explaining career decisions, e.g., [4,5]. Such theories primarily focus on the individual and implicitly describe the “pull” factors that are important for the decision for developing towards a specific career path. If we, however, consider females’ decisions for or against STEM (science, technology, engineering, and mathematics), we see that many of them rule out such study areas because of occupational aspects, especially because they consider it as too male [5]. Thus, the sextype of occupations, as pointed out by Gottfredson (1981), seems to be an important obstacle for female students that prevents them from developing towards STEM careers. Another factor working simultaneously may be the prestige of an occupation: it may be considered as too low and thereby serve as an obstacle for students choosing an occupation, although more in the context of male students’ decision against social occupations rather than in STEM. Such occupational aspects, that often serve as “repel” factors that set boundaries for individuals for not going into a specific career, received less attention in research, besides in research building on Gottfredson’s [6] theory that considers interests, prestige, and sextype as dimensions for career decisions. However, these boundary conditions that repel individuals from some occupational areas may not affect all students similarly: several females choose a STEM career path despite such occupations being considered as “male”. This means that there are groups of individuals that may rather follow their interests while ignoring the sextype of an occupation (or perceiving the sextype differently). In other words, Gottfredson’s boundary dimensions do not have the same effect on career choices for everyone. Rather, there are different groups of individuals who deal differently with repellent factors in the sense of Gottfredson. This paper aims to focus such groups and therefore distinguishes latent profiles according to the dimensions proposed by Gottfredson [6]: interest, prestige, and sextype. It focuses on university freshmen as they just made the first step from a rather general education in school towards a narrower and more occupation-specific one at university. After identifying latent profiles, the paper analyzes how far a respective profile membership can be characterized by background variables at study entry, either by study subject choice or individual orientations for getting a better idea of the students in the respective profiles. In a third step, the study focuses on study outcomes of the students in the different profiles to validate how far students that find themselves in at-risk profiles according to [1,2] and how far they show disadvantages with respect to study outcomes and satisfaction. Using data from a large-scale panel study allows to longitudinally compare students’ outcomes and to focus on six different fields of study for comparison, including STEM fields with a medium (STEM-M) and a low proportion of females (STEM-L). Of particular interest is the question of the extent to which female STEM students form their own profile or are distributed across different profiles.
1.1. Gottfredson’s Theory and Related Constructs
A student’s vocational interests are an important predictor of their later vocational behaviour and, according to Holland’s [2] person–environment fit theory, students should aspire to an occupation that matches their interests. Holland’s recommendation is supported by a huge body of research that indicates favourable outcomes for interest congruence (fit) in relation to satisfaction, performance, and persistence [7,8,9,10,11]. Vocational interests, however, develop through the repeated interactions of the person and their occupational perceptions of the environment, including their perceptions about their outcomes, with their eventual performance or achievements [3,4]. Gottfredson’s [6,12,13] theory postulated two perceptions of an occupational environment that are fundamental to the development of interest, namely prestige and sextype.
Gottfredson’s Theory. Gottfredson’s [6,12,13] developmental theory of occupational aspirations expands on [2] person–environment fit by positing that, along with their field of interest, students also base their career choices on their aspired occupation’s level of prestige and its perceived masculine–feminine traits, known as sextype. Both dimensions have shown evidence of shaping student’s efficacy expectations, their interest development, and their career choices, both in the early stages of development and shortly before a career decision is required [14,15]. These three strongly interrelated dimensions [16] are emphasized in the latter of the four-stage process of circumscription which emphasizes the development of both a person’s self-concept and their cognitive map of occupations and causes them ultimately to develop an occupational aspiration by successively eliminating occupations that they do not find compatible. While children in the first stage (3–5 years) simply recognize what an occupation is, the second stage (6–8 years) emphasizes the morally central aspects of sex roles and produces rigid vocational preferences for same-sex adult behavior and the rejection of cross-sextyped activities, depending on their development. In the third stage (9–13 years), young students make social evaluations of both unacceptably low status occupations as well as high prestige careers and the amount of effort attaining one would require. Finally, as adolescents (stage four, 14+ years), students explore their internal and unique self to a greater degree in order to identify what types of work are compatible to their field of interest. By the end of the circumscription process, a student’s occupational choice is grounded within its social space, which is a bounded area on the cognitive map of occupations according to two axes—prestige level (high vs. low) and sextype (masculinity vs. femininity)—within which a person can discover where their interests fit into the world of work. Once an individual is inclined towards going to a specific occupation, then the reality whether this occupation is accessible or not comes to the fore. This outlines strategic and sometimes difficult choices during a compromise process which are, according to Gottfredson [13], based on the field of interest, prestige level, and sextype of each career alternative. The following outlines each of these dimensions in greater depth.
Field of Interest. Gottfredson [6] (p. 548) made parallels with her assessment of compatibility and Holland’s [2] person–environment fit (P-E fit) called interest congruence, although she notes the indirect nature of such kind of measure. Holland [2] defines vocational interests as trait-like characteristics that can best be described using six different interest dimensions (RIASEC): Realistic interests, Investigative interests, Artistic interests, Social interests, Enterprising interests, and Conventional interests. The RIASEC types can be used to describe the interest profiles of individuals and their academic or occupational environments. As a result, a match can be determined by comparing the individual and environmental RIASEC profiles. Holland’s [2] congruence hypothesis claims that the fit between a person and his or her environment predicts academic and occupational outcomes such as performance and persistence [9,10,11]. Holland [2] proposes a hexagonal structure of the six interest types and this arrangement is basis for many algorithms for calculating congruence. Although this hexagonal structure has been shown to be particularly evident in U.S. samples [17], it can be taken as given and gender invariant for German university samples [18]. Appropriately, RIASEC interests have been and still are extensively investigated in Germany (e.g., [19,20,21]).
Prestige. Although definitions differ, prestige, or social status, is a complex and multifaceted concept associated with an occupation’s socioeconomic status, level of education, difficultly, responsibility [17], as well as the aspects of the effort and skill required from the occupation [22]. Despite its complex nature, people in developed countries have remarkably similar interpretations of prestige [13] (p. 91), evidenced by various standardized prestige and social status scales that strongly correlate [23,24]. In principle, an occupation with a higher prestige is regarded as more desirable due to the social recognition and financial rewards that they provide, but they also may require a greater amount of effort and ability to attain [13], which is an aspect that is also taken up by rational choice theory [25]. A less challenging but still desirable aspect to prestige is to minimize the risk of downward social mobility by, at minimum, aspiring to return to the same status as their parents [26]. The choice of university degree has shown to be greatly influenced by parents, particularly their socio-economic status, which also significantly interacts with the student’s gender [27].
Sextype. The perceived gender identity of an occupation or study area influences young children’s perceptions about sex-typical vocational behaviour [13]. It is, however, noteworthy to point out that distinguishing and measuring the sextype of a wide range of occupations is less straightforward than it seems. Technology-related subjects such as engineering, computer sciences, and physics are obviously perceived as prototypically male areas [5] that persistently present a traditional gender gap [28]. They show a strong over-representation of males with usually more than three males for every one female, and for some engineering areas, the ratio is even as low as six to one [29]. Consequently, such areas are widely perceived as having a male gender identity that is also coherent with their male-over-represented sex proportion. Even though some STEM areas present balanced sex proportions (between 30% and 70% female students), such as mathematics, chemistry, and geography, they are still perceived as belonging to a male stereotyped science area [30]. Study programs in the life sciences have progressively shifted to a proportion of female students around 70% or more [31]. These observable shifts in sex proportion in the life sciences over time may also be reshaping societal perceptions of sextype in related areas. In this line, the proportion of females in technical areas raises if these include an aspect of life sciences. For example, typical computer science studies present around an 18% proportion of female students, but medical and bioinformatics present 46% and 48% female proportions, respectively. This effect, however, may interact with student’s attitudes towards stereotypically traditional gender roles, whether masculine or feminine, or more balanced egalitarian roles [32]. Nonetheless, career choices appear to be particularly affected if the sex proportion in the occupation exceeds the 30-70% balance [33], which in our study specifically relates to specific STEM-related study clusters with a low female proportion [19].
Of note, Gottfredson [13] discussed different configurations of these three dimensions. Furthermore, such configurations imply that there may be different manifest or latent profiles of students’ career choices. Since people do not always have the opportunity to choose an occupation that perfectly fits with regard to all three dimensions, they may have to compromise regarding one or more occupational characteristics. According to Gottfredson [12], a severe threat of the ‘right’ sextype is related to higher costs than a severe threat to the desired level of prestige or to the fulfillment of one’s interests. However, previous studies revealed mixed results regarding the compromise behavior and the weighting of the three dimensions. For example, Armstrong und Crombie [34] confirmed Gottfredson’s compromise hypothesis, while the study by Hesketh et al. [35] indicates that, under compromise condition, interests were more important for the attractiveness of a job than prestige or sextype. In fact, and of course, there are women who enter typically male domains. One reason for this may be that there are some individuals who weight the fulfillment of their interests or a prestigious position more strongly than the ‘right’ sextype when choosing a career.
1.2. A Person-Centered Approach to Career Choice
An appropriate method to reveal groups of individuals that deal differently with the dimensions of sextype, prestige, and interests when aspiring a career is a person-centered approach, such as a latent profile analysis. A person-centered approach distinguishes itself from a variable-centered approach which suggests that all members of a population show a similar configuration regarding a set of variables, usually applied in factor analyses or structural equation modelling [36]. In the context of our study, a variable-centered approach would assume that the whole population of students would be more concerned about, e.g., their gender-identity than about their prestige or interests. Such approaches correspond to some previous studies who found results that rank prestige as more important in conditions where it was not theoretically expected, e.g., [37,38,39]. This is different when a person-centered approach is used. Here, the assumption of a homogenous population is relaxed by suggesting that there can be different subpopulations of students with distinct profiles [40,41]. As a result, a person-centered approach could allow the possibility that some students are less concerned about the gender typicality and more concerned with a higher prestige occupation, while other groups could prioritize interests over gender typicality and/or prestige.
We found two studies that applied a person-centered approach to examine career choices based on Gottfredson’s theory [42,43]. Both studies found four types of career profiles; however, neither study assessed an empirical measure of vocational interest. Furthermore, Ryu and Jeong [43], also excluded sextype from their investigation because of contextual reasons. Our study expands this work by including all three of Gottfredson’s career choice dimensions within a large-scale sample with the goal of analyzing the extent to which different subpopulations of students differentially prioritize the three career choice dimensions in the context of their study decision.
1.3. Characteristics of Study Outcomes Related to Gottfredson’s Dimensions
Focusing on the interest dimension, students with a poor person–environment fit should show lower persistence, performance, and satisfaction according to Holland [2] and the supporting literature [8,9,10,11]; they may therefore be considered as at-risk students. If these findings are extrapolated onto a sample of university freshmen, this would imply that latent profiles that are characterized by a notably lower orientation to their field of interest may show poorer study outcomes such as lower completion rates, lower grades, less satisfaction with their studies [7], and furthermore higher intentions to dropout.
Students characterized by a prestige orientation may be characterized by a greater importance for status maintenance [26] to reach the same prestige level their parents already have. As discussed in [13,22,25], there is a relationship between effort and prestige. Students who aspire to prestigious careers may therefore experience consequences related to high effort requirements, such as challenges with study load or higher chances of failure. Prestige is also already reflected in different study subjects that can be characterized by differences in prestige such as occupations [49]; they may inherently distinguish the prestige of some of the latent profiles.
2. Research Questions
As summarized above, previous research on Gottfredson’s [6,12,13] career choice dimensions revealed mixed results: while some results suggest that people weigh matching sextype most heavily in career choices, other findings suggest that interests may play a more important role. In general, mixed results can be an indicator that different subpopulations exist. In the current study, this would mean that there are different groups of students who use different career choice strategies that may be related to different study outcomes. Therefore, the current study aims to investigate the following research questions:
- RQ1: How Far Can Different Profiles of Career Choice Based on Gottfredson’s Dimensions Be Distinguished within a Population of University Freshmen?
To examine RQ1, we use a person-centered approach, which is exploratory in nature and does not allow for the formulation of precise hypotheses. However, this approach still leaves some room for theoretically framed expectations [40,51]. For example, there may be students who do not prioritize their interests in order to pursue a prestigious or gender-typical career [6,12,13], while other students may focus on finding a job that fit their interests [2].
While the latent profile may reflect Gottfredson’s career choice dimensions, it is not a given that they will be distinctive in relation to aspects relevant at study entry. For making the latent profiles better identifiable, research question 2 analyzes how far further variables important at study entry may characterize the latent profiles:
- RQ2: How Far Are Different Career Profiles Related to Background and Early Study Variables?
Due to the exploratory nature of RQ1, and an a priori unknown characteristic about the latent profiles, our study cannot make any explicit hypotheses regarding what different background or early study variables might characterize a specific latent profile. We can, however, derive assumptions for specific profile characteristics and therefore assume students with a higher aspirational prestige to expect poorer study outcomes because of the greater efforts that will likely be required to attain a high prestige occupation ([13]; assumption A. 1). In addition, we assume students in profiles with a higher prestige to find it more important to maintain their parents’ status than those with a lower prestige ([26]; A. 2). For students that aspire to occupations with a lower prestige, we would also assume a lower rating of the chances for getting a good job (A. 3) according to rational choice theory [25].
In the framework of RQ2, it is examined how students from different study subjects distribute across different profiles. Of special interest in the current study is the question to what extent female STEM-L students constitute own profiles or in which profiles they can be found. In light of Gottfredson’s theory, female STEM-L students can be seen as a group of individuals who overcome the ‘wrong’ sextype, which may be grounded in especially strong interests in STEM fields and/or a particularly pronounced striving for a prestigious position. This may either lead to a distinct latent profile or these females are intermixed with individuals of other latent profiles.
RQ2 already raises aspects such as the study outcome expectation at study entry that may characterize several profiles. RQ3 now takes a longitudinal perspective and analyzes study outcomes and study satisfaction longitudinally to validate how far profiles that show pattern of at-risk students are indeed characterized by lower outcomes.
- RQ3: How Far Are the Different Career Profiles Related to Different Aspects of Study Outcomes?
Several meta-studies indicate that interest congruence predicts favourable outcomes such as satisfaction ([8]; A. 4), performance ([9,10,11]; A. 5), and persistence ([9,10,11]; A. 6), which suggests that profiles that are characterized by interest congruence will likely have better study outcomes. Regarding students who aspire a gender-atypical career, because it is more congruent to his or her interests, there is, however, the question if they are more likely to successfully complete their degree [9] or if they are affected by phenomena that incur with having an untypical sextype ([1]; A. 7a/b). Regarding prestige-characterized profiles, we assume students with high prestige to have poorer study outcomes due to increased difficulty required to attain their aspired occupation ([6,17]; A. 8). Furthermore, we assume students who aspire to high same-sex occupations to show more traditional gender role attitudes while those who aspire to low same-sex occupations are more egalitarian ([50]; A. 9).
3. Method
3.1. Sample
A sample of n = 9277 German university students from the National Education Panel Study (NEPS; SC5:15.0.0; [52]) was analyzed. Their age was between 18 and 27 years at study entry with a mean of 20.1 years (sd = 1.8). These students started in winter semester 2010/2011 and were from six study clusters, namely STEM-L, STEM-M, education, language, medicine, and economics [19]. Moreover, 61% of the 9277 students were female. It is noteworthy to point out that NEPS oversampled teaching education students [53] (p. 13), and therefore the data set comprises of an oversample of female students.
3.2. Measures
As NEPS is a longitudinal panel study, the measures may come from different time points. Variables for generating the latent profiles (RQ1) and for characterizing profiles (RQ2) were surveyed directly at study entry, while validation variables (RQ3) were surveyed later in the course of study. For RQ3, episode data of the first study program in which a student was enrolled were analyzed with respect to its study outcome. If a student, e.g., enrolled for electrical engineering, the episode data indicate if the student finished this program successfully as well as the final grade of this program.
3.2.1. Variables for Defining the Latent Profiles
The three career choice dimensions were generated in relation to each student’s occupational aspiration at the study entry (wave 1). Occupational aspirations are acquired by NEPS by asking the open-ended question: “Regardless of how your degree course is going, what job would you most like to have at some point?”. The open text answers were codified by NEPS into different occupational classification systems, such as ISCO-08 [54] and KldB2010 [55], and furthermore classified according to standardized prestige scales such as the Standard International Occupational Prestige Scale (SIOPS, [56]) and the Magnitude Prestige Scale (MPS, [24]).
Interest congruence builds on Holland’s [2] RIASEC dimensions, as measured using the 18-item adult version of the Interest Inventory Life Span (IILS-II; [57]), and the O*net [58] interest classification of the student’s occupational aspiration. A congruency measure based on the Euclidean distance between the individual and the occupational interest vectors was generated as described in [19]. It should be noted that shorter vectors indicate higher congruence.
Occupational Prestige of students’ aspirations is already classified in NEPS, and this study uses the classification using the German-based Magnitude Prestige Scale (MPS; [24]).
Sextype is estimated by the Same-Sex Proportion (SSP), which is generated using the proportion of each sex employed within their aspired occupation as classified within a taxonomy of occupations, similar to Beavis’ [59] concept of “sex composition”. Therefore, the 5-digit German system to classify occupations [55] is used to match female proportions from the Federal Statistical Office [60] onto the occupational aspirations available in NEPS. The study specifically applies SSP from the year 2010 as it corresponds with the start of university for the NEPS SC5 cohort.
3.2.2. Variables for Characterizing the Latent Profiles
Two types of variables are used to characterize profile membership:
- Background variables available at study entry; these include study outcome expectations (wave 1), chances for getting a good job (wave 1), and the importance of status maintenance of parents (wave 1).
The descriptive statistics, exemplary items, as well as references for the respective scales can be found in Supplementary Table S1.
3.2.3. Variables for Validating the Latent Profiles
For validating how far latent profile membership provides higher risks for a student, his or her study outcomes were analyzed longitudinally. This comprises of variables that were surveyed in later waves of the panel as well as episode data that refer to the outcomes of the first study program for which a student enrolled.
- Longitudinal variables that were available in later waves include the intention to dropout (wave 2), three dimensions of study satisfaction (wave 3; related to study content, study conditions, and coping with study burdens), and gender role attitudes (wave 4). Their descriptive statistics, exemplary items, and references for the respective scales can also be found in Supplementary Table S1.
- Study episode data. The NEPS dataset provides information about study episodes [53]. For example, a student can indicate the start and end dates of any study episode, e.g., a start date for his or her initial bachelor studies. Such episodes are sometimes open, which means without an end date, e.g., if a student is part of the panel attrition group.
Study Outcomes will focus on the successful completion or the failure of the first study episode up to eight years after the start, specifically up to wave 14. A very small number of students indicated that they ended their studies in the first term, or that they explicitly indicated that they did not finish their studies. Due to the marginal number of such cases, these two outcomes were not observed in the analysis.
Final Grades. If students successfully reach the end of a study episode then a final grade for this episode is usually provided. To ensure comparability, grades are z-standardized within each study subject. Our study therefore compares the z-scores for students who successfully completed their first study episode in their respective subject, i.e., engineering. It should be noted that the German grading system indicates better grades as lower values.
3.3. Analyses and Procedure
3.3.1. Description of Profiles: Latent Profile Analysis
A latent profile analysis (LPA) is a person-centered approach that assumes that it is possible to identity distinct latent subgroups based on their shared scores on certain indicators [36]. This study refers to the analysis as an LPA and not a latent class analysis (LCA) because of the continuous nature of the indicator variables [36] (p. 7). The three career choice dimensions, namely the (1) interest congruence, (2) occupational prestige, and (3) SSP within the aspired occupation, are used as input variables for the LPA. For calculating the LPA, the three input variables were z-standardized. In addition, interest congruence was inverted so that higher values indicate a higher congruence. Of note, all the charts and descriptions of the LPA in this paper use the raw values of the dimensions to allow readers to have a better estimation of the profile characteristics.
The latent profile analysis was run using MPlus version 8.2 [62] to derive alternative latent profile solutions ranging from three to twenty profiles (see Supplementary Table S2). The choice of latent profile configurations is guided by several statistical characteristics, especially by the replication of the best log-likelihood value in combination with testing improvements of the model fit over the k-1 model using the Vuong–Lo–Mendell–Rubin likelihood ratio test (LRT) and the bootstrapped likelihood ratio test (BLRT) [63]. In addition to statistical comparisons of alternative latent profile configurations, a review of each latent profile configuration helped to decide on the final solution. Based on the gender distribution in the sample, we furthermore validated the results of the gender inclusive latent profile analysis with two further latent profiles analyses that were separated for male and female students and comprised the same number of latent profiles like the gender inclusive one.
3.3.2. Characterization and Validation of the Profiles
Demographic and background variables, listed in Section 3.2.2, are used to explore assumptions that characterize members of a specific career profile. Career profiles are validated using variables listed in Section 3.2.3. Although some of the validation variables have a substantial percentage of missing responses due to the longitudinal panel attrition, their inclusion provides valuable evidence of each profile’s characteristics. Means and confidence intervals were used to analyze continuous variables for significant differences for all the validation variables except for successful and failed study outcomes, which are analyzed using a chi-square test.
4. Results
Before answering the research questions, we will first refer to the descriptive statistics (see Supplementary Tables S1 and S3–S5) and the correlations between the variables. A correlation matrix amongst interest congruence, prestige, and female proportions in their aspired occupations (adapted to generate the SSP), as well as other characterizing variables, can be found in Supplementary Table S3. The three career choice dimensions present significant but small correlations with one another. Furthermore, the sample distribution by study cluster and sex can be found in Supplementary Table S6.
4.1. Latent Profile Analysis
As a result of the LPA, an eleven-profile solution was chosen because of the LRT based on the k-1 model test, a satisfactory entropy, and a sound replication of the best log-likelihood value that indicates a stable solution (see Supplementary Table S2). Upon further inspection, the eleven-profile solution remained superior based on its well-differentiated profiles and evenly distributed sample.
To further validate the eleven career profiles, this study investigates whether LPAs using sex-separated samples, which are set to find the same number of profiles (eleven) in order to correspond with the latent profiles from the whole sample, come to similar results. Crosstabulations reveal that most profiles share 100% of their cases, while three female and four male profiles share upwards of 90% of their cases with whole sample profiles. Only one profile from either sex, related to sextype-characterized profiles, shares around 80% of their cases with a corresponding profile from the whole sample. This suggests that other than the sextype characterized profiles, the majority of the eleven profiles could be interpreted without undue concern for sex differences (See Supplementary Tables S7–S9).
Due to the comparably high number of profiles and the large sample sizes that allow even small differences to be significant, and because furthermore the LPA aims at revealing homogenous classes (with small standard deviations) that lead to high effect sizes of the profile differences, we added a gray range around the sample mean to indicate less distinguished profiles for a better interpretation of the differences in Figure 1. For congruence and prestige, the gray area indicates values within +/− 1 SD of the sample mean (congruence 0.49/1.14; prestige 163/109). For SSP, the gray neutral area is defined theoretically [33] as a male/female sex proportion between 30 and 70% which centers around a balanced 50% value [33]. Of note, one must keep in mind that the SSP of an occupation and the proportion of females in a profile are different measures. Each profile’s mean score was used to characterize it as either low or high if it falls outside of the gray range (see Supplementary Figure S1 for a zoomed-in version). The following section describes the latent profiles by the most characterizing aspects; more detailed information can be found in Supplementary Table S10. All profiles were within one standard deviation of the mean with respect to congruence.
The largest profile (P9; Teaching Aspirations; n = 4021) accounts for 43% of the sample and consists of 78% female students. The means of all three career choice dimensions (interests, prestige, and sextype) are within the less distinguishable gray range (see Figure 1 and Supplementary Table S10 for the values; see Supplementary Tables S11–S13 for effect sizes). Looking into students’ occupational aspirations, we found that more than 80% of P9 profile aspire to become teachers (see Supplementary Table S14).
4.1.1. Prestige Characterized Profiles
While all profiles were within one standard deviation from the sample mean with respect to interest congruence, we see five profiles that are clearly distinguished by their prestige: one with a distinctly high prestige, one with a distinctly low prestige, and three further profiles that can also be distinguished by their low prestige but require further distinguishing criterion.
The P8 profile (High Prestige Medical Aspirations; n = 718, 8%) consists of 68% females. Besides their high prestige, P8 also present above average congruence and a neutral SSP. Participants of this profile mainly aspire to work in medical occupations.
In contrast, students of the P7 profile (Low Prestige High Same-Sex Proportion Aspirations; n = 157; 2%) are characterized by a very low prestige. The profile consists of 26% female students and is further characterized by a high SSP and a congruence that is clearly below average. As their SSP factor suggests, these students aspire to gender-typical professions. Male students mainly aspire to become machine operators and work in mechatronics, while the females aim towards business organization and strategy supervisors.
The P1 profile (Low Prestige Technical Aspirations; n = 149, 2%) is one of the three low prestige profiles which need to be distinguished in more detail. Although their prestige is quite low, it is not as low as P7. It consists of 38% female students and is further characterized by an interest congruence clearly below average and an SSP that tends to be high. This profile mainly aspires toward technical professions either in the domain of engineering or machine operations for males, or medical technicians and other skilled technical professions for females.
The P3 profile (Low Prestige Economic Aspirations; n = 288; 3%) consists of 58% female students. The SSP of this group is slightly tending towards high and the interest congruence slightly below average. This profile aspires to rather economics-oriented occupations such as media designing and advertising, technical design, banking, and business administration.
The P5 profile (Low Prestige Social Aspirations; n = 652; 7%) consists of 73% female students. The SSP of this group’s aspiration is clearly towards the higher range and their interest congruence slightly above average. Participants of this group mainly aspire to become social workers.
4.1.2. SSP Characterized Profiles
Besides these, the LPA also revealed two SSP characterized profiles.
The P4 profile (Low Same-sex Proportion Aspirations; n = 414, 4%) consists of 88% female students. Both their prestige and congruence are slightly below average, but their highly atypical SSP distinguishes their aspirations. Female students mainly aspire to work in technical and economic occupations such as construction and business consulting, while male students aspire to become primary school teachers.
The P10 profile (High Same-Sex Proportion Aspirations; n = 1565; 17%) consists of 31% females. The congruence of this group’s participants is slightly above average while their prestige slightly below. In this profile, female students mainly aspire to become primary school teachers, while males aspire to technical occupations such as machine building and operation.
4.1.3. Profiles with Less Distinguishable Career Choice Dimensions
Like the P9 profile, the remaining profiles are within the gray range on all three career choice dimensions and therefore are only distinguished by their profile’s main occupational aspirations.
The P2 profile (Natural Science Aspirations; n = 397; 4%) consists of 53% female students. Both males and female students of this profile mainly aspire to occupations related to the natural sciences such as chemistry, physics, and biology.
The P11 profile (Academic/Research Aspirations; n = 308; 3%) consists of 50% female students. Participants of this profile mainly aspire to become university researchers/lecturers, with some aspiring to be dentists or veterinarians.
The P6 profile (Less Distinguished Aspirations; n = 608, 7%) consists of 43% female students. The aspirations are partially of two career paths related to computer sciences and language. Males mainly aspire to computer sciences-related occupations with a small portion aspiring to journalism, while the females aspire to work in language-related occupations such as journalism, copy editors, and translators and a small portion aspire to become computer scientists.
4.2. Characterization of the Profiles
The demographic and background variables that characterize the profiles include gender, study cluster, teaching orientation, as well as the importance of maintaining their parent’s status. In addition, two outcome-related characterizing variables are also included, namely study outcome expectations and chances of getting a good job.
4.2.1. Sex
The chi-square test found a significant and moderate effect size for sex in association with the career profiles (χ2 (10) = 1301.216, p < 0.001, Contingency Coeff = 0.351, Cramer’s V = 0.375). Specifically, males were significantly associated with six profiles, namely P10 (High SSP), P6 (Less Distinguished), P7 (Low Prestige High SSP), P1 (Low Prestige Technical), P11 (Academic/Research), and P2 (Natural Science), in order of the highest significant standardized residuals (see Supplementary Figure S2 and Supplementary Table S15). Conversely, females were significantly associated with P9 (Teaching), P4 (Low SSP), P5 (Low Prestige Social), and P8 (High Prestige Medical) profiles.
4.2.2. Study Clusters
The chi-square test results indicate a significant association between study clusters and career profiles (χ2 (50) = 12,267.61, p < 0.001). Due to the larger number of levels involved in the analysis, an effect size cannot be calculated. In addition, several cells have less than five cases per cell. This, however, does not violate the expected frequency assumption because the minimum expected frequency of 9.96 well exceeds the recommended number [64] (p. 935). The results suggest that students in STEM-L are significantly and positively associated with several profiles including P10 (High SSP), P7 (Low Prestige High SSP), P6 (Less Distinguished), P1 (Low Prestige Technical), P4 (Low SSP), P3 (Low Prestige Economic), P11 (Academic/Research), and P2 (Natural Science), while STEM-M students are significantly associated with P2 (Natural Science), P9 (Teaching), and P11 (Academic/Research). The results further indicated that medicine students are particularly associated with P8 (High Prestige Medical) and to a lesser extent P11 (Academic/Research), some of whom aspire to be dentists (see Figure 2 and Supplementary Table S16). Economics students are significantly associated with P3 (Low Prestige Economic), P4 (Low SSP), and P5 (Low Prestige Social), while education students are significantly associated with P5 (Low Prestige Social) and P9 (Teaching). Finally, language students are significantly associated with P9 (Teaching).
4.2.3. Study Orientation Teaching
The chi-square test indicates a strong and significant effect size for teaching vs. non-teaching orientation in association with the different career profiles (χ2 (10) = 4635.636, p < 0.001. Contingency Coeff = 0.578, Cramer’s V = 0.707). Students that are teaching orientated are significantly associated with the P9 (Teaching) profile which consists of 43% of the sample (see Supplementary Table S17).
4.2.4. Outcome Expectation at Study Entry
Two profiles indicate better study outcome expectations, namely P8 (High Prestige Medical) and P11 (Academic/Research), while, by contrast, P1 (Low Prestige Technical), P3 (Low Prestige Economic), and P7 (Low Prestige High Same-Sex) indicate lower study outcome expectations that are significantly below the sample mean (see Figure 3a, Supplementary Figure S3a, and Supplementary Table S18).
4.2.5. Chances for Getting a Good Job
Most notably, P8 (High Prestige Medical) indicates significantly and above average career prospects from studying their degree, followed by P1 (Low Prestige Technical), P3 (Low Prestige Economic), P7 (Low Prestige High SSP), P10 (High SSP), and P11 (Academic/Research), who all indicate chances that are significantly above the sample mean. By contrast, P5 (Low Prestige Social), P9 (Teaching), and P6 (Less Distinguished) rate their career prospects as significantly below that of the sample mean (see Figure 3b, Supplementary Figure S3b, and Supplementary Table S18).
4.2.6. Status Maintenance of Parents
The results indicated that P2 (Natural Science), P3 (Low Prestige Economic), P4 (Low SSP), P6 (Less Distinguished), and P11 (Academic/Research) care more about maintaining the status of their parents than the sample mean, while P8 (High Prestige Medical) and P9 (Teaching) take a view of maintaining their parents’ status that is below that of the sample mean (see Figure 3c, Supplementary Figure S3c and Supplementary Table S18).
4.3. Validation of the Profiles
In the following, we investigate the profiles in relation to variables that indicate study outcomes longitudinally and that therefore allow to estimate how far a specific profile could be considered as an at-risk profile. Therefore, we will first focus on the study outcomes from episode data (Figure 4) before we investigate variables of later survey waves that may already have been indicators for success and failure (Figure 5; see Supplementary Figure S4 for a zoomed-in version of Figure 5 and Supplementary Table S19 for means and standard deviations of each validation variable). For a comprehensive comparison of the effect sizes for each validation variable amongst the career profiles, see Supplementary Tables S20–S25. For an overview of the significance of both characterization and validation variables across the career profiles, see Table 1.
Regarding study outcomes (see Figure 4; Supplementary Table S26 for the chi-square test contingency table), the chi-square analysis presents a significant χ2 (20) = 138.297, p < 0.001, but a small effect size (Contingency Coeff = 0.122, Cramer’s V = 0.087), suggesting that the results should be cautiously interpreted due to weak associations. Nonetheless, significant differences in study outcomes were observed.
In the following, we will present the most salient results of Figure 4 and Figure 5 as well as results that relate to our assumptions regarding the research questions.
The Teaching Aspirations (P9) profile is both more likely to fail and less likely to successfully finish their degree, which indicates poor study outcomes (see Figure 4). This is reflected in the satisfaction with the study conditions value that is observably the lowest while other variables were located around the sample mean (see Figure 5c and Supplementary Figure S4c). The second profile less likely to reach a successful study outcome is P6 (Less Distinguished) that, however, indicates a high satisfaction with study conditions and a good coping with study burden.
If we now look to the prestige-characterized profiles, students in the High Prestige Medical (P8) are less likely to fail and more likely to successfully finish their studies. Although they show a low intention to dropout and a high satisfaction with the study content, this profile is characterized by the worst coping with the study conditions. This is contrasted by the Low Prestige Social (P5) profile that has the same study outcome pattern but shows the best coping with the study conditions, although with the lowest grades at the end of the study. The other three prestige-characterized profiles do not show significant effects regarding study outcomes, although P1 (Low Prestige Technical) shows the highest intention to drop out and the lowest satisfaction with the study content. P3 (Low Prestige Economic) shows the second highest intention to dropout but with a quite high satisfaction with the study conditions, and P7 (Low Prestige High SSP) also one of the lower coping strategies.
Both sextype characterized profiles (P4-Low SSP and P10-High SSP) are significantly less likely to fail their studies, with P4 showing comparably the best grades at the end of the study.
Students of the Natural Science (P2) profile are significantly more likely to successfully finish their studies and less likely to have open study outcomes; they show a high satisfaction with their study content but are the second lowest group with respect to coping with their study burdens. Students of P11 (Academic/Research) also are less likely to show open study outcomes. They are comparably satisfied with the study content and are receiving comparably good grades.
Finally, we look at gender roles attitudes. While we conceptually would have preferred to discuss gender role attitudes as an early background variable, this was not possible due to its collection in the later waves. Its inclusion can indicate if students of a profile are more or less inclined to traditional gender roles. Like Figure 5f shows, students with High SSP (P10) and Low Prestige Economic (P3) profiles indicate more traditional gender role attitudes while the Low SSP (P4), the Low Prestige Social (P5), and High Prestige Medical (P8) all indicate higher egalitarian gender role attitudes.
5. Summary and Discussion
5.1. Distinguishing Latent Profiles according to Gottfredson’s Theory
Reflecting on Gottfredson’s theory [6,12,13] and looking overarchingly onto the latent profiles that we found, we can hardly see profiles that are distinguished by their interests. Although there were significant differences between the profiles on the interest dimension, all of them centered +/− 1 SD from the sample mean on a relatively high level. This indicates that the individual interests were an important factor for their career choices and that a major compromise [6,12,13], i.e., compromising interests for a higher sextype, did not take place within this sample of students. Of note, students already possess the highest level of school leaving degree and therefore may have not been in need to compromise their interests so much. Additionally, the prestige of the occupations that students aspired was relatively high, but here, we could see one profile with an even higher prestige (P8, High Prestige Medical) and four profiles with a clearly lower prestige. We want to emphasize that all low prestige profiles either were related to a lower study outcome expectation (P1 Low Prestige Technical, P3 Low Prestige Economic, and P7 Low Prestige High SSP), a lower estimation of their chances for getting a good job (P5 Low Prestige Social), or a higher intention to dropout (P1 Low Prestige Technical, P3 Low Prestige Economic), which indicates that students within these profiles made some moderate compromises [6,12,13] and might therefore be at-risk students, especially students of P7 (Low Prestige High SSP) who also showed lower values regarding coping with study burdens (Table 1 gives an overview on the respective profile characteristics). Regarding sextype, most profiles were within a neutral range between 30 and 70% SSP with one profile (P4 Low SSP) indicating a lower SSP and two profiles, P7 (Low Prestige High SSP) and P10 (High SSP), indicating a higher SSP. While P4 (Low SSP) students showed a quite positive pattern including better grades, students of P7 (Low Prestige High SSP) were already characterized as at-risk students with a moderate level of compromise.
5.2. Identifying At-Risk Students
Combining these observations with the results about study outcomes, we see that two of the potential at-risk profiles (P3 Low Prestige Economic, P7 Low Prestige High SSP) show, although not significant, below average study success rates, with students of P7 (Low Prestige High SSP) showing the lowest proportion of successfully finished study episodes. This highlights how Gottfredson’s dimensions and the estimated compromises [6,12,13] can point towards at-risk students that, however, must be validated in a broader context as only two of the four profiles actually show lower study outcomes. Furthermore, two profiles, P6 (Less Distinguished) and P9 (Teaching), also show lower success rates, although they are inconspicuous with respect to Gottfredson’s dimensions. For them, a lower estimation of their chances for getting a good job (for both P6 Less Distinguished and P9 Teaching) together with a low satisfaction with the study conditions (P9 Teaching) rather point to effects of expectancy value theories [4] and the socio-cognitive career theory [3] to explain their study outcomes. Consequently, Gottfredson’s [6,12,13] concept of compromise can help to identify some groups of at-risk students, but several groups of at-risk students cannot be discovered by compromise pattern, at least in this study.
5.3. Occupational Characteristics
Moving now the focus from the Gottfredson dimensions to the underlying occupational aspirations of the latent profiles, we see that most profiles can be characterized by quite narrow ranges of prestige and SSP of these occupations. Some profiles comprised of students who mostly aspire to the same occupation, e.g., P9 (Teaching) with respect to teaching profiles (about 80%), or P8 (High Prestige Medical) regarding medical professions (also over 80% when including specializations). Furthermore, three of the four low prestige profiles can be distinguished by broad occupational categories, e.g., P1 (Low Prestige Technical), P3 (Low Prestige Economic), and P5 (Low Prestige Social). While such distinction seems theoretically as well as empirically meaningful, it points towards framing conditions of the underlying concepts of Gottfredson’s theory [6,12,13]: interest, prestige, and sextype, all three which relate to the same occupation or occupational aspiration. All three have the challenge of measurement with the respective consequences. Using an individual’s self-rated estimation of prestige and sextype may be biased and therefore unreliable, especially for individuals who aspire to low prestige occupations, because low socioeconomic status individuals show evidence of systematically rating low prestige occupations as higher when compared to individuals from a higher status background [65] (p. 270). Using, in contrast, a standardized scale of prestige, such as the MPS [24], and the proportions of males and females in an occupation for sextype, e.g., according to official labor statistics data [29], may cause deviations between the calculated and the perceived occurrence. We already discussed this with respect to science domains with a balanced SSP that is still often perceived as male ([30]; see also the introductory part). However, this phenomenon may also apply to life science subjects such as medicine and biology. Although they usually are less perceived as male domains, the corresponding scientist jobs such as medical doctor or biologist may still have a male connotation. This may result from media portrayals, and we can exemplify that by the coverage of virology, epidemiology, and infection biology researchers in the beginning of the COVID-19 pandemic in Germany (https://www.spiegel.de/gesundheit/corona-virus-christian-drosten-ist-nummer-eins-bei-medienpraesenz-von-virologen-a-e3d97148-06db-4b9d-bb5d-511543f7cf43 (accessed on 19 March 2023)): Although the proportion of female students in this area is about 70%, the top five researchers that were mentioned in press reports about COVID-19 were male and their coverage had a proportion of about 85% of all reports. Furthermore, just 2 female researchers could be found in the top 10 (on position 6 and 9) with a coverage of 4% and 2%, respectively. This biased media coverage may show impacts on the perceived sextype of occupations and the respective tolerable boundary [6,12,13]. Such phenomena may also explain mixed results from previous research that arose when researchers tried to test Gottfredson’s theory with respect to compromise [37,38,39]. Of note, the proportion of female students that earned a university access degree raised dramatically during the last decades [66], and consequently, the proportion of females in high prestige occupations is changing. Thus, one must generally acknowledge interaction between occupations and prestige and sextype, also for areas outside STEM.
5.4. Teaching Aspirations
The largest profile (P9, Teaching, 43%) is characterized by teaching aspirations with students of almost each of the six study areas. Although this profile was inconspicuous with respect to most additional analyses, students of this profile showed the lowest satisfaction with their study conditions, a significantly lower success and a higher failure rate, lower estimation of their chances for getting a good job, and a lower importance of maintaining their parents’ status. Focusing subject areas, the teaching profile comprised of comparably few STEM and especially few STEM-L students, which highlights the STEM teacher congruence dilemma [61] that suggests that recruiting teachers in STEM is difficult because the type of interest profiles that STEM teachers would benefit from (i.e., high social for teaching and high realistic for STEM) are rare in society.
5.5. Female STEM-L Students
In the theoretical part, we raised the question whether females in STEM-L constitute their own profile since they have to overcome the ‘wrong’ sextype, which may be grounded in especially strong interests (i.e., a high congruence) and/or a particularly pronounced striving for prestigious occupations. However, the results indicate that women in STEM-L are relatively broadly distributed across the 11 profiles and that the largest proportion of female STEM-L students (36%) are assigned to profile 4 (see Supplementary Table S6). This profile is characterized neither by particularly high congruence nor by particularly high prestige. In addition, 13% of female STEM-L students can be found in P9 (Teaching), while the other half of them is scattered across all profiles with more than 5% of them being present in 8 out of 11 profiles. This finding may indicate that female students in STEM-L, although studying a subject area with a low SSP, rather prefer occupations with a more balanced SSP, which may refer to the tolerable boundary for sextype according to Gottfredson [6]. Considering furthermore that the Low SSP (P4) profile is comprised of a small number of male students of any subject area, while more than 5% of the economics and more than 35% of the STEM-L students in this profile are female, we can support Gottfredson’s [13] (p. 105) observation that “women are more willing to perform cross-sextyped work than are men”, i.e., sextype is less a barrier for female students than it is for male students.
5.6. Further Characteristics of the Study Areas
In contrast to the P9 (Teaching) profile that includes students of all study areas (besides medicine), most profiles show rather clear study area characteristics (see Supplementary Table S6). This is most obvious for medical students as most fall into P8 (High Prestige Medical) with a small number, between 5% and 10%, of female students going into P11 (Academic/Research). All other profiles were just populated marginally (<5%) by medicine students. This is similar for students of education who, besides being present in P9 (Teaching), could mainly be found in P5 (Low Prestige Social), for students of the languages who could be found in P6 (Less Distinguished) besides in P9 (Teaching) with a considerable number of female students also being in P10 (High SSP), and for STEM-M with students being present in P2 (Natural Science) besides P9 (Teaching) with several students also being present in P10 (High SSP). As with STEM-L, we see quite scattered distributions across the profiles for economics. The P11 (Academic/Research) profile is a sparsely populated one which may reflect the small numbers of students who intend to stay in academia. Such sparse populations can also be found in three of the four low prestige profiles P1 (Low Prestige Technical), P3 (Low Prestige Economics), and P7(Low Prestige High SSP), which indicates that university students usually aspire higher prestige occupations, but this is different for P5 (Low Prestige Social), which may indicate that social aspirations usually show lower prestige levels.
5.7. Evaluation of our Assumptions
After providing a general view on our results, we will now focus on the assumptions that we stated in the context of our research questions. We raised several assumptions about interest characterized profiles, especially a higher satisfaction (A. 4), performance (A. 5), and persistence (A. 6). The profiles in this study, however, showed quite similar levels of interest congruence and can hardly be defined by an outstanding interest congruence, although there are significant differences between some of them. Comparing now the three profiles with the highest congruence level (P8, High Prestige Medical; P5, Low Prestige Social; P6, Less Distinguished) and the two with the lowest (P1, Low Prestige Technical; P7, Low Prestige High SSP), we see a higher satisfaction with the study contents for P8 and lower satisfactions for P1 and P7, all with at least medium effect sizes, while for P5 and P6, the results are less distinguishable. Regarding satisfaction with study conditions, all profiles stand out against P9 (Teaching), while there are only small and indifferent effects with respect to the other profiles. Moreover, for coping with study burden, we see that the high interest profile P8 (High Prestige Medical) shows worse coping, while the other two high interest profile (P5, Low Prestige Social; P6, Less Distinguished) show better coping. Consequently, we just have vague evidence for assumption 4 and this is primarily with respect to the satisfaction study content—this, however, seems to fit the connection to interests. Regarding performance (A. 5), we do not find evidence for assumption 5 with the high interest P5 (Low Prestige Social) showing the worst grades of all profiles. Regarding persistence (A. 6), we see the high congruence profiles (P8, High Prestige Medical; P5, Low Prestige Social) with higher success and lower failure rates, but the third high interest profile (P6, Less Distinguished) showed lower success rates similarly to P7 (Low Prestige High SSP). P1 (Low Prestige Technical) was inconspicuous. Thus, for the interest related profiles, these assumptions cannot be confirmed convincingly. Considering previous work of [7,9] that found effects of interest congruence with variable centered approaches, we like to emphasize the observation that all profiles share a narrow range of interests, and the effects of interest congruence may be moderated by prestige- and sextype-related effects that were much more distinguishable in our latent profile analysis. In this context, we want to point towards findings on differences in interest congruence of different subject areas like in [19] and thus we assume that the inconsistencies regarding the assumptions 4–6 may further result of subject- and profile-specific differences.
Regarding prestige profiles, assumptions 1, 3, and 8 proposed poorer outcomes of students in high prestige profiles with A. 1 targeting students’ outcome expectations, A. 3 targeting the chances for getting a good job, and A. 8 targeting study success and failure. If we now look at profiles with the higher prestige, we just see a higher outcome expectation for P11 (Academic/Research) and P8 (High Prestige Medical), while for the low prestige profiles P1 (Low Prestige Technical), P3 (Low Prestige Economic) and P7 (Low Prestige High SSP), we see a lower study outcome expectation. If we would discuss this finding in the context of Gottfredson’s theory about tolerable effort boundaries [6,13], we would rather have expected students in the lower prestige profiles to show a comparable or higher outcome expectation. Focusing on these results from the perspective of expectancy–value theories [4], however, we would argue that students with a lower outcome expectation aspire to lower prestige occupations. Thus, we must emphasize that expectancy–value theory [4] seems to be more appropriate to model an outcome–expectation–prestige relation than Gottfredson’s theory about effort boundaries [6] like we proposed in A. 1. Regarding the chances of getting a good job (A. 3), the profile with the highest prestige (P8, High Prestige Medical) and the one low prestige profile (P5, Low Prestige Social) were able to support this assumption. The other low prestige profiles (P1, Low Prestige Technical, P3, Low Prestige Economic, and P7, Low Prestige High SSP) also presented above average ratings on their chances of getting a good job, while a profile with an above average prestige occupation such as teaching rated their chances as below the sample mean. These mixed results may point to job-specific characteristics which none of the theories that we have discussed are able to coherently explain [4,6,13,25]. Focusing on A. 8, we see that the high prestige profile P8 (High Prestige Medical) shows higher chances of success as well as lower chances of failure, however combined with the lowest value for coping with study burden that might indicate the high efforts required for highly prestigious jobs according to Gottfredson [6]. It should be noted that studying medicine in Germany requires excellent grades in the school leaving examination, and it may be possible that a considerable effort is required to attain those grades as well as for passing exams in the medicine studies which can be experienced as a heavy burden. This could provide partial evidence for A. 8. Regarding our assumption in A. 2, that students in profiles with higher prestige emphasize the importance of status maintenance, we found a diverse set of prestige profiles that found maintaining their parent’s status as important, while the profile who did not find maintaining their parent’s status as important were of a high prestige i.e., P8 (High Prestige Medical). Of note, students of P8 (High Prestige Medical) already have parents in high prestige professions (see Supplementary Figure S5 and Supplementary Table S27). This gives the impression that status maintenance is not a factor that is directly related to aspirational prestige.
Finally, regarding the sextype characterized profiles, we discussed how far this is associated with a higher or lower chance for successful study outcomes (A. 7a/b) and gender role attitudes (A. 9). Here, we see that the high (P10, High SSP) and low SSP (P4, Low SSP) aspiration profiles show significant lower rates of failing. We could assume that the effects of an atypical career choice relate to (A. 7a), although they are not above average in the congruence dimension, while for the typical career choice, the “right sextype” factor may apply (A. 7b). Finally, we can confirm A. 9 with Low SSP profiles (P4, Low SSP) comprising of more egalitarian gender role attitudes than the High SSP Profiles (P7, Low prestige High SSP; P10 High SSP). Of note, also P5 (Low prestige Social) shows a rather egalitarian gender role attitude, while P3 (Low prestige Economic) rather a traditional one.
5.8. Limitations
We already discussed several limitations of the study above, such as that interest, prestige, and sextype relate to the same aspiration and therefore somehow depend on each other, which is most obvious for the sextype–prestige combinations. This dependence is a side condition of Gottfredson’s theory [1] and especially applies if the prestige and sextype scores are estimated from established scales [23,24] or labor market data [60]. Sextype was originally measured as a self-reported masculine–feminine rating of occupations [6], but this is neither available in our data nor conceptually practical to generate for such a large set of occupations like for the ISCO-08 that comprises of 436 Unit Groups [54]. As already discussed before, using ratings of the participants may rather provide further bias than better estimations for inter-individual comparisons, especially as sex proportions in occupations were changing over time.
While Gottfredson [1] was introducing the concept of the sextype of an occupation as male and female, this sextype per se is less a factor than the relation between the sextype and the sex of the individual. Thus, sextype-oriented vocational choices mean occupations with a high same sex proportion. This implicated for the latent profile analysis to include either the sextype variable in a mixed sex sample that might inform about male and female occupations, to split the sample into males and females for the profile analysis, which would reveal profiles for male and female students, or to use the SSP for the profile analysis. We consider the SSP variable as conceptually similar to Gottfredson’s [6] original sextype variable and the respective consequences that it produces similar to previous research [16,59]. However, we also provided a comparison to split male/female LPAs for comparison that, however, revealed quite similar profiles for most of the students.
Another limitation relates to the generalizability of the results outside of Germany. Since previous studies found evidence that the structural validity of the RIASEC interests may depend on the cultural context of an investigation [17], the results of the current study may not be readily transferable to other countries or cultures. This may be reinforced by cultural differences in the prestige of occupations or in (the strength of) gender stereotypes (see, e.g., [67,68]).
A fourth limitation relates to the large sample of teachers in the study. Although NEPS intentionally oversampled teachers [53], the large teacher profile P9 (43% of the sample) indicates challenges for the prestige/sextype analyses of Gottfredson [1]: as both are quite homogeneous for the teachers in this profile, this may have suppressed differences in the interest congruence that were found, e.g., by [61]. Considering phenomena such as the teacher congruence dilemma for STEM teachers, it becomes clear that much greater differentiation between and within occupations may be desirable, but this may provide obstacles for valid estimations of prestige and sextype of such distinguished occupations, especially regarding secondary education teachers who are distinguished by just one category in classifications such as the ISCO-08 [54].
Finally, the study is subject to all phenomena that incur with large-scale panel studies such as panel attrition and missing values in variables of later waves like those that are discussed in [69].
6. Conclusions
The focus of our study was on career profiles of university freshmen, and we applied Gottfredson’s [6,12,13] dimensions to create latent profiles. The analysis disclosed several profiles that were distinguished by prestige and/or sextype and some of them could also be classified as at-risk profiles. Yet, the analysis showed that many profiles also represent a latent structure of occupational clusters. Consequently, we see that students from several study areas, especially medicine, education, and languages, only distribute to few profiles. This is different for students of economics and STEM and especially for female students in STEM-L that distribute over 8 of the 11 profiles with more than 5% of the subsample size each. Furthermore, we can observe that only about a third of the female STEM-L students can be found in the low SSP profile and almost two thirds divert to other profiles. This is different for male students of whom more than half stays in the respective two high SSP profiles. Of note, only a marginal number of male students (smaller than 5% of each subject sample) was found in the Low SSP (P4) profile. Thus, regarding the topic of the special issue “Sticking with STEM: Who Comes, Who Stays, Who Goes, and Why?” we can conclude that female students in STEM-L, although studying a subject with a male sextype according to Gottfredson [6,12,13], rather seem to estimate this sextype as inappropriate and turn away towards occupations with a more appropriate sextype. Previous studies have made various conclusions which suggest that a good fit in STEM is particularly relevant (e.g., [19,44,45,46,47,48]), which leads us to hypothesize that STEM-L studies might just be seen as a vehicle for female students to come to a more sex-balanced profession.
The latter is an important side condition when looking into the at-risk profiles. Here, we identified two low-prestige profiles, one with a high SSP, as being at-risk together with two others that are inconspicuous with respect to interests, prestige, or sextype. For the sample of university students, we would therefore conclude that the identification of at-risk students may be more straightforward in the context of expectancy–value [4] or rational choice theory [25] rather than the interaction of interests, prestige, and sextype as proposed by Gottfredson [13] (p. 103). It seems that if students have crossed the barrier of choosing a low SSP study area, they do this purposefully and consequently show a lower chance of failing.
Sometimes, there is the claim that female students experience disadvantages because they do not go into prestigious STEM professions, e.g., [70]. Although STEM professions may provide higher incomes than others (what we did not analyze in this paper), we see the three high prestige profiles P8 (High Prestige Medical), P11 (Academic research), or P9 (Teaching) neither as STEM specific nor with a male over-representation. P2 (Natural Science), the top-prestige STEM profile, is ranked 4th in prestige and shows a quite balanced proportion of male and female students. Thus, if we focus on prestige as a career driver, we would conclude that there are more prestigious options than following a STEM career and consequently, we would consider the claim that women avoid prestigious careers as a myth, at least in the context of university students.
Our study focuses on university students that comprise of a school leaving degree that enables them almost all career options. Future research might refine our approach with respect to two directions: One direction may be to look into the labor market and analyze how far such profiles can be replicated in a population of working people; the other direction might look into schools before career decisions are made and analyze respective career profiles there. Considering three points of measurement, e.g., at the ages of 15, 25, and 35 by growth curve modelling or latent transition analyses, could model changes in aspirations over time amongst the three career choice dimensions [71].
Supplementary Materials
The following supporting information can be downloaded at: https://www.mdpi.com/article/10.3390/educsci13030324/s1, Table S1. Means, Standard Deviations and Reliability amongst Characterization and Validation Variables. Table S2. Latent Profile Model Fit Information for the Selection of Career Profiles (n = 9277). Table S3. Correlation matrix of Career Choice Dimensions and other Characterization Variables for the whole sample (sex-combined). Table S4. Correlations amongst Career Choice Dimensions and other Characterization Variables for sex-separated samples (upper triangle female; lower triangle male). Table S5. Descriptive Statistics: Sex ratio, Age and Study Fields of Career Profiles (n = 9277). Table S6. Descriptive Statistics: Study Cluster and Sex Interaction by Career Profile (n = 9277). Table S7. Crosstabulation of Females and Whole Sample Career Profiles. Table S8. Crosstabulation of Whole Sample Career Profiles (P11) with Males Sample Career Profiles. Table S9. Cross-tabulated Distribution of Whole and Sex-Separated Profiles (n = 9277). Table S10. Career Profile Labels according to Career Choice Dimension Levels. Table S11. Matrix of Effect Size Comparisons amongst Career Profiles based on Interest Congruence. Table S12. Matrix of Effect Size Comparisons amongst Career Profiles based on the Magnitude Prestige Scale. Table S13. Matrix of Effect Size Comparisons amongst Career Profiles based on Same-Sex Proportion. Table S14. Top Five Occupational Aspirations of Career Profiles by Sex (n = 9277). Table S15. Chi Square Test Contingency Table of Gender Distribution in relation to the Career Profiles. Table S16. Chi Square Test Contingency Table of Study Clusters in relation to the Career Profiles. Table S17. Chi Square Test Contingency Table of Study Teaching Orientation in relation to the Career Profiles. Table S18. Descriptive Statistics of Early Background Variables by Career Profiles. Table S19. Descriptive Statistics of Validation Variables by Career Profiles. Table S20. Matrix of Effect Size Comparisons amongst Career Profiles based on Intentions to Dropout. Table S21. Matrix of Effect Size Comparisons amongst Career Profiles based on Satisfaction with Study Content. Table S22. Matrix of Effect Size Comparisons amongst Career Profiles based on Satisfaction with Study Conditions. Table S23. Matrix of Effect Size Comparisons amongst Career Profiles based on Satisfaction with Coping with Study Burdens. Table S24. Matrix of Effect Size Comparisons amongst Career Profiles based on Grades at the End of Studies. Table S25. Matrix of Effect Size Comparisons amongst Career Profiles based on Gender Role Attitudes. Table S26. Chi Square Test Contingency Table of Study Outcomes in relation to the Career Profiles. Table S27. Descriptive Statistics of Career Profile’s Occupational Prestige with Parents. Figure S1. The Means and Confidence Intervals of Career Profiles across the three Career Choice Dimensions (Zoomed-in Version). Figure S2. Bargraph of the Gender Distribution of Career Profiles with Significance based of Chi Square Test Z-scores. Figure S3. Variables for the Validation of the Compromise Profiles (Zoomed-in Version). Figure S4. Variables for the Validation of the Compromise Profiles (Zoomed-in Version). Figure S5. Comparison of Career Profile’s Occupational Prestige with Parents. References [2,7,19,24,50,72,73,74,75,76] are cited in the supplementary materials.
Author Contributions
Conceptualization, D.M. and B.E.; methodology, D.M. and B.E.; formal analysis, D.M., F.G.H. and B.E.; data curation, D.M.; writing—original draft preparation, D.M and F.G.H.; writing—review and editing, D.M., F.G.H. and B.E.; visualization, D.M.; supervision, B.E.; project administration, B.E. All authors have read and agreed to the published version of the manuscript.
Funding
This research was funded by the Deutsche Forschungsgemeinschaft (German Research Foundation, DFG), Grant number ER470/2-1.
Institutional Review Board Statement
All students from this cohort gave informed consent to participate in the panel by providing their phone number for being contacted for telephone interviews after being informed about the purposes of the study. Specific information about the recruitment process can be found in the field report of the study [77].
Informed Consent Statement
Informed consent was obtained from all subjects involved in the study through the National Educational Panel Study (NEPS; see [52]).
Data Availability Statement
Publicly available datasets were analyzed in this study. Data sources used for the analyses were from the cohort of first year students (doi: 10.5157/NEPS:SC5:14.0.0) of the German National Educational Panel Study [52]).
Acknowledgments
This paper uses data from the National Educational Panel Study (NEPS; see [52]). The NEPS is carried out by the Leibniz Institute for Educational Trajectories (LIfBi, Germany) in cooperation with a nationwide network.
Conflicts of Interest
The authors declare no conflict of interest.
References
- Gottfredson, L.S. Using Gottfredson’s theory of circumscription and compromise in career guidance and counseling. In Career Development and Counseling. Putting Theory and Research to Work; Brown, S.D., Lent, R.W., Eds.; John Wiley & Sons: Hoboken, NJ, USA, 2005; pp. 71–100. [Google Scholar]
- Holland, J.L. Making Vocational Choices. A Theory of Vocational Personalities and Work Environments, 3rd ed.; Psychological Assessment Resources; American Psychological Association: Washington, DC, USA, 1997. [Google Scholar]
- Lent, R.W.; Brown, S.D.; Hackett, G. Toward a unifying social cognitive theory of career and academic interest, choice, and performance. J. Vocat. Behav. 1994, 45, 79–122. [Google Scholar] [CrossRef]
- Eccles, J.S.; Adler, T.F.; Futterman, R.; Goff, S.B.; Kaczala, C.M.; Meece, J.L.; Midgley, C. Expectancies, values, and academic behaviors. In Achievement and Achievement Motives; Spence, J.T., Ed.; Freeman: San Francisco, CA, USA, 1983; pp. 75–146. [Google Scholar]
- Hannover, B.; Kessels, U. Self-to-prototype matching as a strategy for making academic choices. Why High School students do not like math and science. Learn. Instr. 2004, 14, 51–67. [Google Scholar] [CrossRef]
- Gottfredson, L.S. Circumscription and compromise: A developmental theory of occupational aspirations. J. Couns. Psychol. 1981, 28, 545–580. [Google Scholar] [CrossRef]
- Ertl, B.; Hartmann, F.G.; Wunderlich, A. Impact of interest congruence on study outcomes. Front. Psychol. 2022, 13, 816620. [Google Scholar] [CrossRef]
- Hoff, K.A.; Song, Q.C.; Wee, C.J.M.; Phan WM, J.; Rounds, J. Interest fit and job satisfaction: A systematic review and meta-analysis. J. Vocat. Behav. 2020, 123, 103503. [Google Scholar] [CrossRef]
- Nye, C.D.; Su, R.; Rounds, J.; Drasgow, F. Vocational interests and performance. A quantitative summary of over 60 years of research. Perspect. Psychol. Sci. 2012, 7, 384–403. [Google Scholar] [CrossRef] [PubMed]
- Nye, C.D.; Su, R.; Rounds, J.; Drasgow, F. Interest congruence and performance: Revisiting recent meta-analytic findings. J. Vocat. Behav. 2017, 98, 138–151. [Google Scholar] [CrossRef]
- Van Iddekinge, C.H.; Roth, P.L.; Putka, D.J.; Lanivich, S.E. Are you interested? A meta-analysis of relations between vocational interests and employee performance and turnover. J. Appl. Psychol. 2011, 96, 1167–1194. [Google Scholar] [CrossRef]
- Gottfredson, L.S. Gottfredson’s theory of circumscription and compromise. In Career Choice and Development; Brown, D., Brooks, L., Eds.; Jossey-Bass: San Francisco, CA, USA, 1996; pp. 179–232. [Google Scholar]
- Gottfredson, L.S. Gottfredson’s theory of circumscription, compromise, and self-creation. In Career Choice and Development; Brown, D., Ed.; John Wiley & Sons: Hoboken, NJ, USA, 2002; pp. 85–148. [Google Scholar]
- Lapan, R.T.; Hinkelman, J.M.; Adams, A.; Turner, S. Understanding Rural Adolescents’ Interests, Values, and Efficacy Expectations. J. Career Dev. 1999, 26, 107–124. [Google Scholar] [CrossRef]
- Helwig, A.A. Gender-Role Stereotyping: Testing Theory with a Longitudinal Sample. Sex Roles 1998, 38, 403–423. [Google Scholar] [CrossRef]
- Einarsdóttir, S.; Rounds, J. Application of Three Dimensions of Vocational Interests to the Strong Interest Inventory. J. Vocat. Behav. 2000, 56, 363–379. [Google Scholar] [CrossRef]
- Tracey, T.J.; Rounds, J. The spherical representation of vocational interests. J. Vocat. Behav. 1996, 48, 3–41. [Google Scholar] [CrossRef]
- Nagy, G.; Trautwein, U.; Lüdtke, O. The structure of vocational interests in Germany: Different methodologies, different conclusions. J. Vocat. Behav. 2010, 76, 153–169. [Google Scholar] [CrossRef]
- Ertl, B.; Hartmann, F.G. The interest profiles and interest congruence of male and female students in STEM and non-STEM fields. Front. Psychol. 2019, 10, 897. [Google Scholar] [CrossRef] [PubMed] [Green Version]
- Ertl, B.; Hartmann, F.G.; Wunderlich, A. Stability of vocational interests during university studies. J. Individ. Differ. 2023. [Google Scholar] [CrossRef]
- Stoll, G.; Rieger, S.; Nagengast, B.; Trautwein, U.; Rounds, J. Stability and change in vocational interests after graduation from high school: A six-wave longitudinal study. J. Personal. Soc. Psychol. 2021, 120, 1091–1116. [Google Scholar] [CrossRef]
- Sodano, S.M.; Tracey, T.J. Prestige in interest activity assessment. J. Vocat. Behav. 2008, 73, 310–317. [Google Scholar] [CrossRef]
- Ganzeboom, H.; Treiman, D.J. nternationally Comparable Measures of Occupational Status for the 1988 International Standard Classification of Occupations. Soc. Sci. Res. 1996, 25, 201–239. [Google Scholar] [CrossRef]
- Christoph, B. Zur Messung des Berufsprestiges. Aktualisierung der Magnitude-Prestigeskala auf die Berufsklassifikation ISCO88. ZUMA Nachr. 2005, 29, 79–127. Available online: https://nbn-resolving.org/urn:nbn:de:0168-ssoar-207543 (accessed on 17 March 2023).
- Stocké, V. Educational Decisions as Rational Choice? An Empirical Test of the Erikson-Jonsson Model for Explaining Educational Attainment. 2008. Available online: http://ub-madoc.bib.uni-mannheim.de/2308 (accessed on 17 March 2023).
- Stocké, V. Explaining educational decision and effects of families’ social class position: An empirical test of the Breen–Goldthorpe model of educational attainment. Eur. Sociol. Rev. 2007, 23, 505–519. [Google Scholar] [CrossRef]
- Olmos-Gómez, M.C.; Luque-Suárez, M.; Becerril-Ruiz, D.; Cuevas-Rincón, J.M. Gender and Socioeconomic Status as Factors of Individual Differences in Pre-University Students’ Decision-Making for Careers, with a Focus on Family Influence and Psychosocial Factors. Int. J. Environ. Res. Public Health 2021, 18, 1344. [Google Scholar] [CrossRef] [PubMed]
- Tomperi, P.; Kvivesen, M.; Manshadi, S.; Uteng, S.; Shestova, Y.; Lyash, O.; Lazareva, I.; Lyash, A. Investigation of STEM Subject and Career Aspirations of Lower Secondary School Students in the North Calotte Region of Finland, Norway, and Russia. Educ. Sci. 2022, 12, 192. [Google Scholar] [CrossRef]
- Destatis (Statistisches Bundesamt). Studierende in Mathematik, Informatik, Naturwissenschaft (MINT) und Technik-Fächern. 2021. Available online: https://www.destatis.de/DE/Themen/Gesellschaft-Umwelt/Bildung-Forschung-Kultur/Hochschulen/Tabellen/studierende-mint-faechern.html (accessed on 17 August 2021).
- Miller, D.I.; Eagly, A.H.; Linn, M.C. Women’s representation in science predicts national gender-science stereotypes: Evidence from 66 nations. J. Educ. Psychol. 2015, 107, 631–644. [Google Scholar] [CrossRef] [Green Version]
- Braunschweig, L.; Christoph, B.; Schreyer, F. Ingenieur- und Naturwissenschaften: In manchen MINT-Fächern Dominieren Frauen. 2019. Available online: https://www.iab-forum.de/ingenieur-und-naturwissenschaften-in-manchen-mint-faechern-dominieren-frauen (accessed on 30 January 2022).
- Makarova, E.; Aeschlimann, B.; Herzog, W. The Gender Gap in STEM Fields: The Impact of the Gender Stereotype of Math and Science on Secondary Students’ Career Aspirations. Front. Educ. 2019, 4, 60. [Google Scholar] [CrossRef]
- Frome, P.M.; Alfeld, C.J.; Eccles, J.S.; Barber, B.L. Why don’t they want a male-dominated job? An investigation of young women who changed their occupational aspirations. Educ. Res. Eval. 2006, 12, 359–372. [Google Scholar] [CrossRef]
- Armstrong, P.I.; Crombie, G. Compromises in Adolescents’ Occupational Aspirations and Expectations from Grades 8 to 10. J. Vocat. Behav. 2000, 56, 82–98. [Google Scholar] [CrossRef]
- Hesketh, B.; Durant, C.; Pryor, R. Career compromise: A test of Gottfredson’s (1981) theory using a policy-capturing procedure. J. Vocat. Behav. 1990, 36, 97–108. [Google Scholar] [CrossRef]
- Collins, L.M.; Lanza, S.T. Latent Class and Latent Transition Analysis. In With Applications in the Social, Behavioral, and Health Sciences; John Wiley & Sons, Inc.: Hoboken, NJ, USA, 2010. [Google Scholar]
- Blanchard, C.A.; Lichtenberg, J.W. Compromise in career decision making: A test of Gottfredson’s theory. J. Vocat. Behav. 2003, 62, 250–271. [Google Scholar] [CrossRef]
- Junk, K.E.; Armstrong, P.I. Stability of Career Aspirations: A Longitudinal Test of Gottfredson’s Theory. J. Career Dev. 2010, 37, 579–598. [Google Scholar] [CrossRef]
- Wee, S. Compromises in career-related decisions: Examining the role of compromise severity. J. Couns. Psychol. 2014, 61, 593–604. [Google Scholar] [CrossRef]
- Hofmans, J.; Wille, B.; Schreurs, B. Person-centered methods in vocational research. J. Vocat. Behav. 2020, 118, 103398. [Google Scholar] [CrossRef]
- Spurk, D.; Hirschi, A.; Wang, M.; Valero, D.; Kauffeld, S. Latent profile analysis: A review and “how to” guide of its application within vocational behavior research. J. Vocat. Behav. 2020, 120, 103445. [Google Scholar] [CrossRef]
- Berger, J.B.; Ramirez, G.B.; Lyons, S. Past to Present. A Historical Look at Retention. In College Student Retention. Formula for Student Success, 2nd ed.; Seidman, A., Ed.; Rowman & Littlefield: Lanham, MD, USA, 2012; pp. 7–34. [Google Scholar]
- Ryu, J.; Jeong, J. Career Compromise Types Among University Graduates During the School-to-Work Transition. Career Dev. Q. 2021, 69, 19–33. [Google Scholar] [CrossRef]
- Cardador, M.T.; Damian, R.I.; Wiegand, J.P. Does more mean less? Interest surplus and the gender gap in STEM careers. J. Career Assess. 2020, 29, 76–97. [Google Scholar] [CrossRef]
- Cardador, M.T.; Hill, P.L.; Lopez-Alvarez, G. Examining interests and goals as predictors of gender differences in engineers’ pursuit of managerial roles. J. Eng. Educ. 2022, 111, 852–867. [Google Scholar] [CrossRef]
- Schelfhout, S.; Wille, B.; Fonteyne, L.; Roels, E.; Derous, E.; De Fruyt, F.; Duyck, W. How interest fit relates to STEM study choice: Female students fit their choices better. J. Vocat. Behav. 2021, 129, 103614. [Google Scholar] [CrossRef]
- Wicht, A.; Miyamoto, A.; Lechner, C.M. Are girls more ambitious than boys? Vocational interests partly explain gender differences in occupational aspirations. J. Career Dev. 2021, 49, 551–568. [Google Scholar] [CrossRef]
- Wille, E.; Stoll, G.; Gfrörer, T.; Cambria, J.; Nagengast, B.; Trautwein, U. It takes two: Expectancy-value constructs and vocational interests jointly predict STEM major choices. Contemp. Educ. Psychol. 2020, 61, 101858. [Google Scholar] [CrossRef]
- Pfuhl, N. Untersuchung zur Bestimmung von Typischen Merkmalen des Image von Studienfächern; Waxmann: Münster, Germany, 2010. [Google Scholar]
- Athenstaedt, U. Normative Geschlechtsrollenorientierung: Entwicklung und Validierung eines Fragebogens. Z. Differ. Diagn. Psychol. 2000, 21, 91–104. [Google Scholar] [CrossRef]
- Morin, A.J.S.; Bujacz, A.; Gagné, M. Person-centered methodologies in the organizational sciences: Introduction to the feature topic. Organ. Res. Methods 2018, 21, 803–813. [Google Scholar] [CrossRef] [Green Version]
- Blossfeld, H.-P.; Roßbach, H.-G. (Eds.) Education as a Lifelong Process: The German National Educational Panel Study (NEPS), 2nd ed.; Springer VS: Berlin/Heidelberg, Germany, 2019. [Google Scholar]
- FDZ-LIfBi. Data Manual NEPS Starting Cohort 5–First-Year Students, from Higher Education to the Labor Market, Scientific Use File Version 15.0.0; Leibniz Institute for Educational Trajectories, National Educational Panel Study: Bamberg, Germany, 2021. [Google Scholar]
- International Labour Organization. International Standard Classification of Occupations. Structure, group definitions and correspondence tables. Geneva: International Labour Organization (ILO) (1). 2012. Available online: https://www.ilo.org/public/english/bureau/stat/isco/docs/publication08.pdf (accessed on 20 March 2023).
- Bundesagentur für Arbeit, Klassifikation der Berufe 2010—Überarbeitete Fassung 2020, Band 2: Definitorischer und Beschreibender Teil. Nürnberg, November 2021. Available online: https://statistik.arbeitsagentur.de/DE/Statischer-Content/Grundlagen/Klassifikationen/Klassifikation-der-Berufe/KldB2010-Fassung2020/Printausgabe-KldB-2010-Fassung2020/Generische-Publikationen/KldB2010-PDF-Version-Band2-Fassung2020.pdf?__blob=publicationFile&v=20 (accessed on 17 March 2023).
- Treiman, D.J. Occupational Prestige in Comparitive Perspective; Academic Press: New York, NY, USA, 1977. [Google Scholar]
- von Maurice, J. ICA-D. In Deutschsprachige Version des Inventory of Children’s Activities—Revised (ICA-R, Tracey & Ward, 1998); Unpublished Manuscript; Otto-Friedrich-Universität Bamberg: Bamberg, Germany, 2006. [Google Scholar]
- O*Net. O*NET® 22.3 Database. 2018. Available online: https://www.onetcenter.org/dl_files/database/db_22_3_dictionary.pdf (accessed on 17 March 2023).
- Beavis, A. Evidence in Support of Gottfredson’s Common Cognitive Map of Occupations. Aust. J. Career Dev. 2007, 16, 38–44. [Google Scholar] [CrossRef]
- Destatis [Statistisches Bundesamt]. Erwerbstätige ab 15 Jahren nach Beruf (KldB 2010 5-Steller) in Deutschland * [Employed Persons Aged 15 and over by Occupation (KldB 2010 5-Digit) in Germany *] [xlx]. 2022. Available online: https://ergebnisse.zensus2011.de/auswertungsdb/download?xls=11&tableId=BEV_10_31&locale=DE (accessed on 17 March 2023).
- Hartmann, F.G.; Mouton, D.; Ertl, B. The Big Six interests of STEM and non-STEM students inside and outside of teacher education. Teach. Teach. Educ. 2022, 112, 103622. [Google Scholar] [CrossRef]
- Muthén, L.K.; Muthén, B.O. Mplus User’s Guide, 8th ed; Muthén & Muthén: Los Angeles, CA, USA, 2017. [Google Scholar]
- Nylund, K.L.; Asparouhov, T.; Muthén, B.O. Deciding on the Number of Classes in Latent Class Analysis and Growth Mixture Modeling: A Monte Carlo Simulation Study. Struct. Equ. Model. Multidiscip. J. 2007, 14, 535–569. [Google Scholar] [CrossRef]
- Field, A.P.; Miles, J.; Field, Z. Discovering Statistics Using R; Sage: London, UK; Thousand Oaks, CA, USA, 2012. [Google Scholar]
- Bernd, W. Concepts and Measurement of Prestige. Annu. Rev. Sociol. 1992, 18, 253–280. [Google Scholar] [CrossRef]
- Ertl, B.; Csanadi, A.; Tarnai, C. Getting closer to the digital divide: An analysis of impacts on digital competencies based on the German PIAAC sample. Int. J. Educ. Dev. 2020, 78, 102259. [Google Scholar] [CrossRef]
- Nosek, B.A.; Smyth, F.L.; Hansen, J.J.; Devos, T.; Lindner, N.M.; Ranganath, K.A.; Smith, C.T.; Olson, K.R.; Chugh, D.; Greenwald, A.G.; et al. Pervasiveness and correlates of implicit attitudes and stereotypes. Eur. Rev. Soc. Psychol. 2007, 18, 36–88. [Google Scholar] [CrossRef]
- Obioma, I.F.; Hentschel, T.; Hernandez Bark, A.S. Gender stereotypes and self-characterizations in Germany and Nigeria: A cross-cultural comparison. J. Appl. Soc. Psychol. 2022, 52, 764–780. [Google Scholar] [CrossRef]
- Ertl, B.; Hartmann, F.G.; Heine, J.-H. Analyzing Large-Scale Studies: Benefits and Challenges [Opinion]. Front. Psychol. 2020, 11, 577410. [Google Scholar] [CrossRef]
- Sáinz, M.; Martínez-Cantos, J.-L.; Rodó-de-Zárate, M.; Romano, M.J.; Arroyo, L.; Fàbregues, S. Young Spanish People’s Gendered Representations of People Working in STEM. A Qualitative Study. Front. Psychol. 2019, 10, 996. [Google Scholar] [CrossRef] [Green Version]
- Woo, S.E.; Jebb, A.T.; Tay, L.; Parrigon, S. Putting the “Person” in the Center. Review and Synthesis of Person-Centered Approaches and Methods in Organizational Science. Organ. Res. Methods 2018, 21, 814–845. [Google Scholar] [CrossRef]
- Deutsches Jugendinstitut (DJI), München; Technische Universität Chemnitz-Zwickau. DJI Foreigner Survey—Young People; ZA3371 Data File Version 1.0.0; GESIS Data Archive: Cologne, Germany, 2001. [Google Scholar] [CrossRef]
- Esser, H.; Stocké, V. Forschungsprojekt “Bildungsaspirationen, Bezugsgruppen und Bildungsentscheidungen”; Mannheimer Bildungspanel, 2003. [Google Scholar]
- Stocké, V. Statuserhaltsmotiv; ZIS—GESIS Leibniz Institute for the Social Sciences: Mannheim, Germany, 2005. [Google Scholar] [CrossRef]
- Trautwein, U.; Köller, O.; Watermann, R. Transformation des Sekundarschulsystems und akademische Karrieren—Zusammenfassung, Diskussion und ein Ausblick [Transformation of the secondary school system and academic careers—Summary, discussion and outlook]. In Wege zur Hochschulreife in Baden-Württemberg; Köller, O., Watermann, R., Trautwein, U., Lüdtke, O., Eds.; VS Verlag für Sozialwissenschaften: Berlin/Heidelberg, Germany, 2004; pp. 451–471. [Google Scholar] [CrossRef]
- Westermann, R.; Heise, E.; Spies, K.; Trautwein, U. Identifikation und Erfassung von Komponenten der Studienzufriedenheit. Psychol. Erzieh. Unterr. 1996, 43, 1–2. [Google Scholar]
- Steinwede, J.; Aust, F. Methodenbericht NEPS Startkohorte 5: CATI-Haupterhebung. Herbst 2010. B52; Infas: Bonn, Germany, 2012. [Google Scholar]
Figure 1.
The means and confidence intervals of career profiles across the three career choice dimensions. Note: n = 9277. Each dimension is displayed in its full and unstandardized scale. Congruence ranges from 0 (perfect) to ~4 (poor), prestige ranges from ~20 (low) to ~187 (high), SSP in the aspired occupation ranges from 0 (low) to 1 (high).

Figure 2.
Bar graph of the study cluster distribution amongst career profiles with significance based of chi-square test z-scores. Note: n = 9277; χ2 (50) = 12,267.61, p < 0.001. Minimum expected frequency: 9.957961; positive and significant standardized residuals, measured in z-scores, are indicated adjacent to the corresponding group. Significant standardized residuals are indicated as * p < 0.05 if z > ±1.96; ** p < 0.01 if z > ±2.58; *** p < 0.001 if z > ±3.29. STEM-L = STEM studies with a female proportion less than 30%; STEM-M = STEM studies with a sex proportion between 30 and 70%; Med = medicine; Eco = economics; Edu = education; Lang = language.

Figure 3.
Variables for the characterization of the career profiles (full-scale version). Note: sample sizes vary according to availability in the NEPS dataset. Sample means are illustrated as the dotted red line. The effect size (Cohen’s d) is illustrating the range between the highest and the lowest mean score across the career profiles for each variable. For the zoomed-in version, see Supplementary Figure S3.

Figure 4.
Study outcomes of career profiles with significance based on chi-square test z-scores (n = 9144). Note: χ2 (20) = 138.297, p < 0.001. Contingency Coeff = 0.122, Cramer’s V = 0.087; * p < 0.05 if z > +1.96; ** p < 0.01 if z > +2.58; *** p < 0.001 if z > +3.29.
Figure 4.
Study outcomes of career profiles with significance based on chi-square test z-scores (n = 9144). Note: χ2 (20) = 138.297, p < 0.001. Contingency Coeff = 0.122, Cramer’s V = 0.087; * p < 0.05 if z > +1.96; ** p < 0.01 if z > +2.58; *** p < 0.001 if z > +3.29.

Figure 5.
Variables for the validation of the career profiles (full-scale version). Note: sample sizes vary according to availability in the NEPS dataset. Sample means are illustrated as the dotted red line. The effect size (Cohen’s d) is illustrated by the range between the highest and the lowest mean score across the career profiles for each variable. For (5e), lower values indicate better grades. For (5f), lower values indicate traditional gender role attitudes while higher values indicate egalitarian gender role attitudes (see Supplementary Figure S4 for a zoomed-in version).


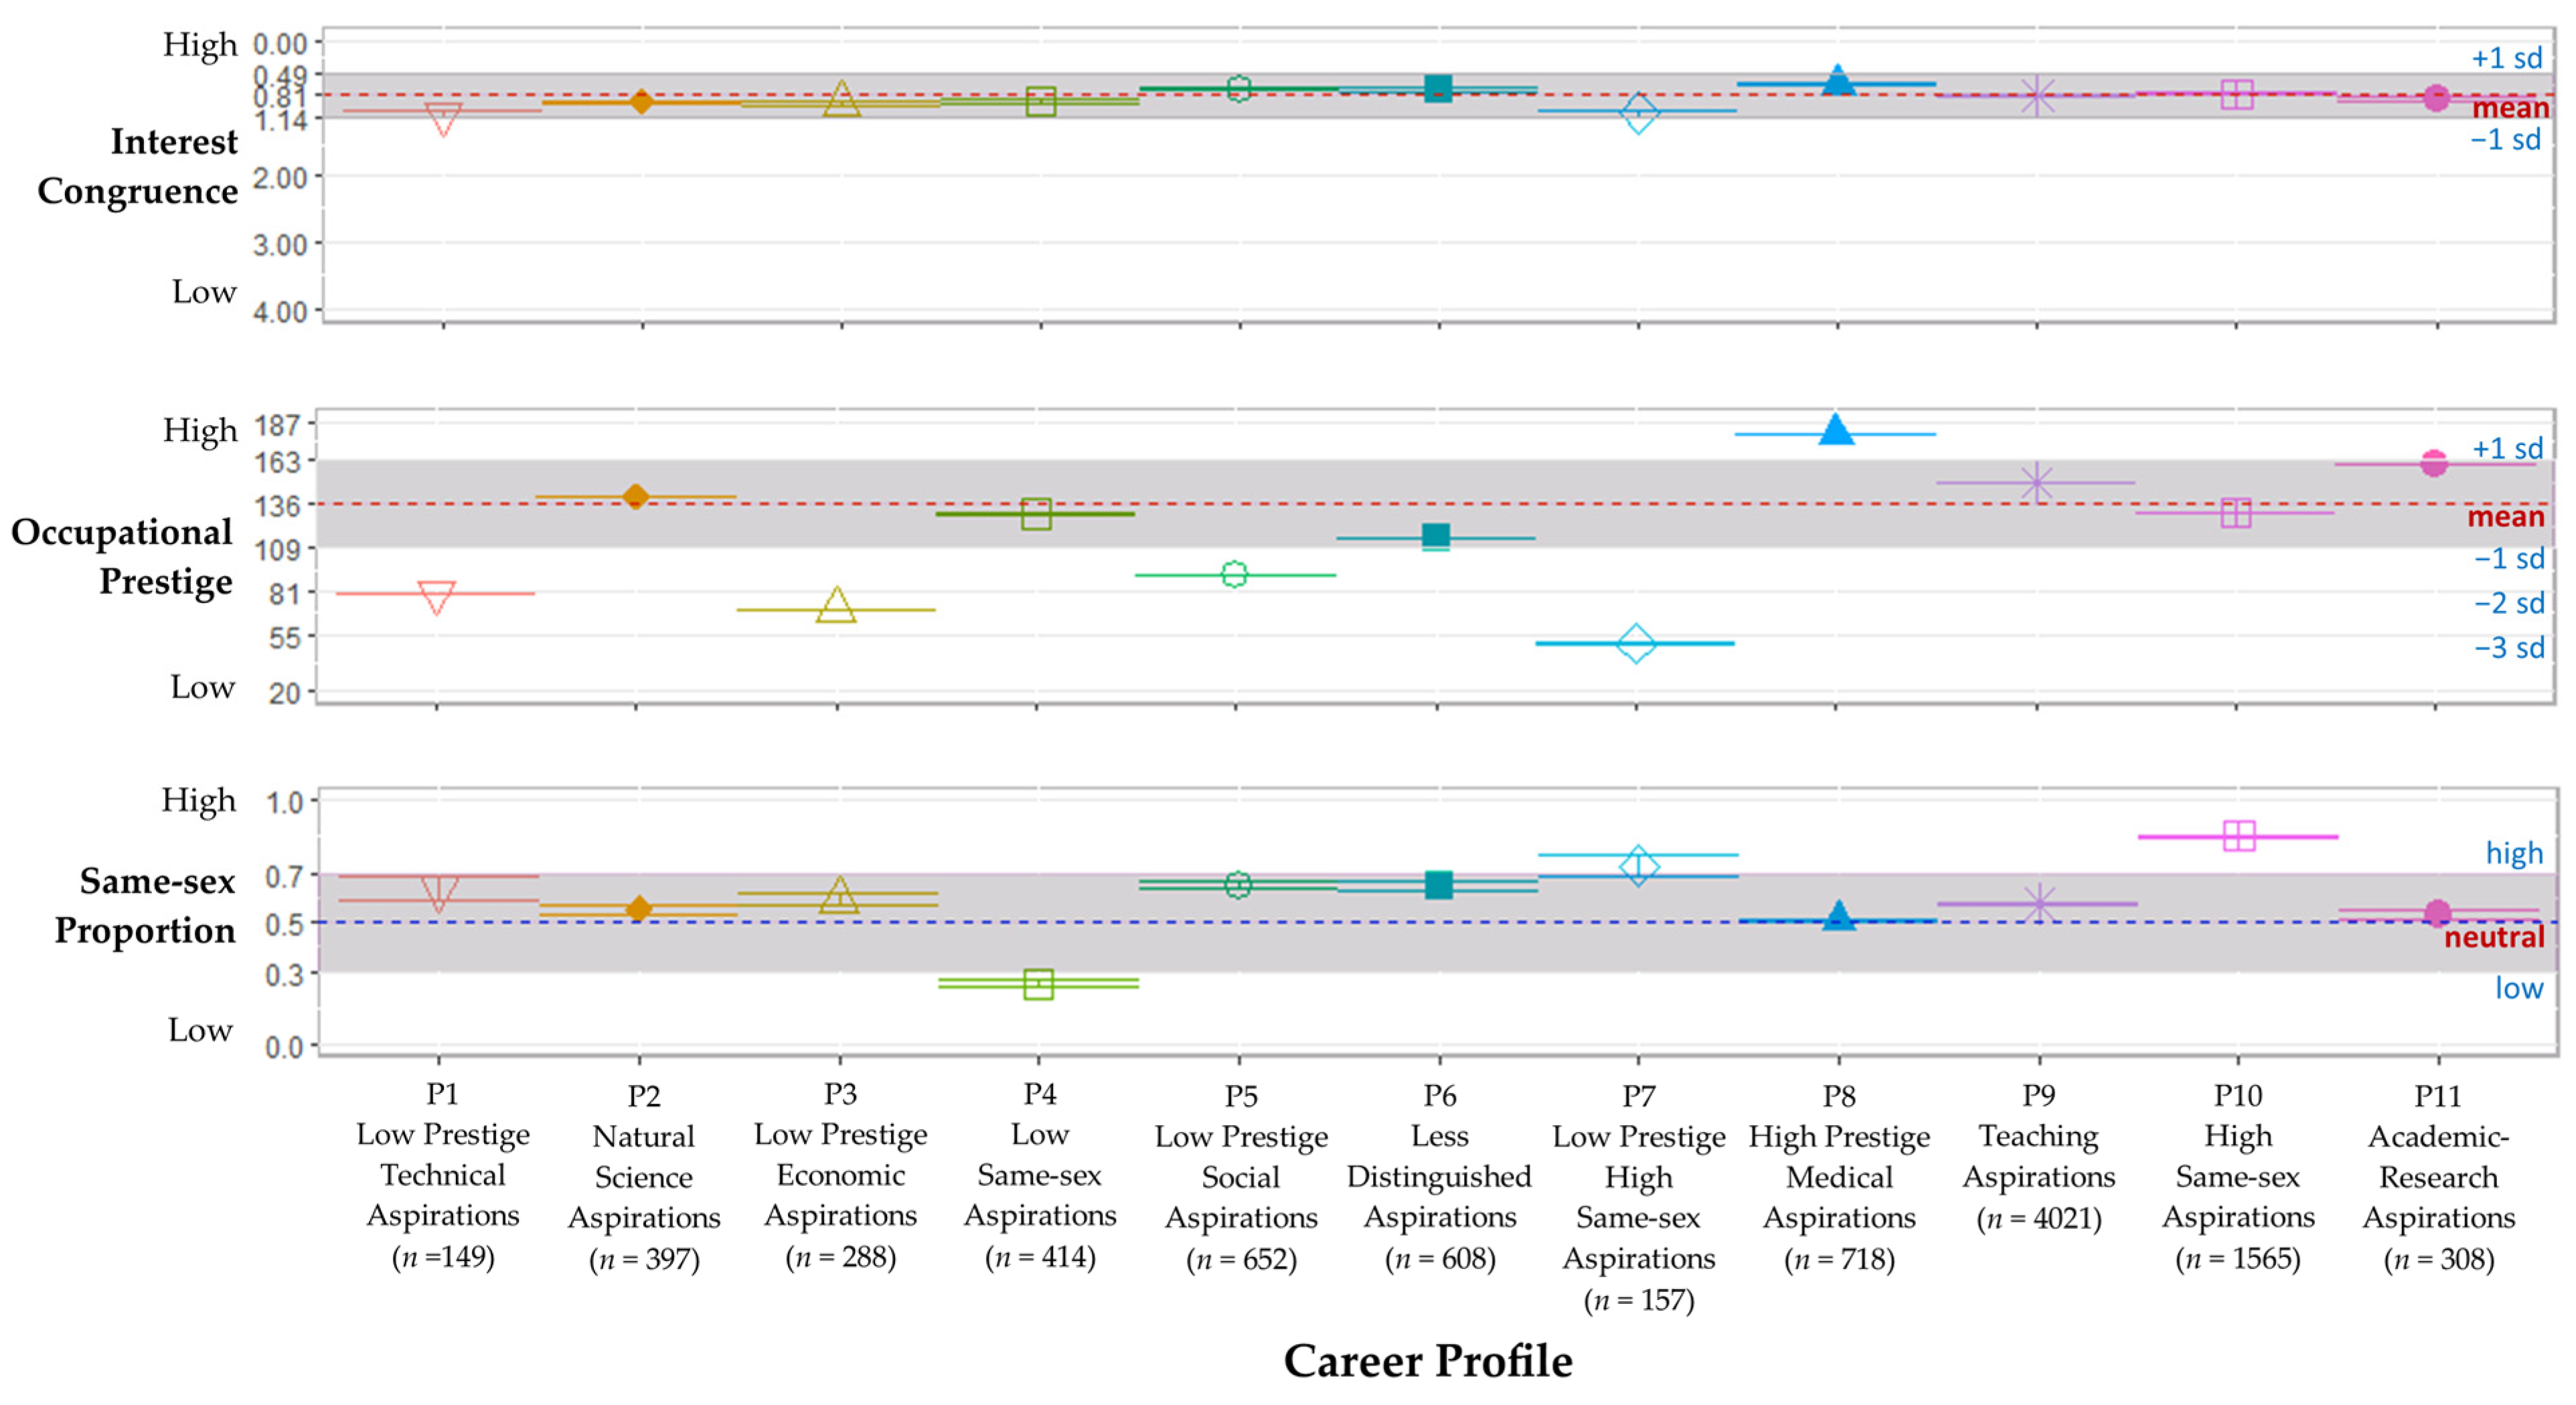
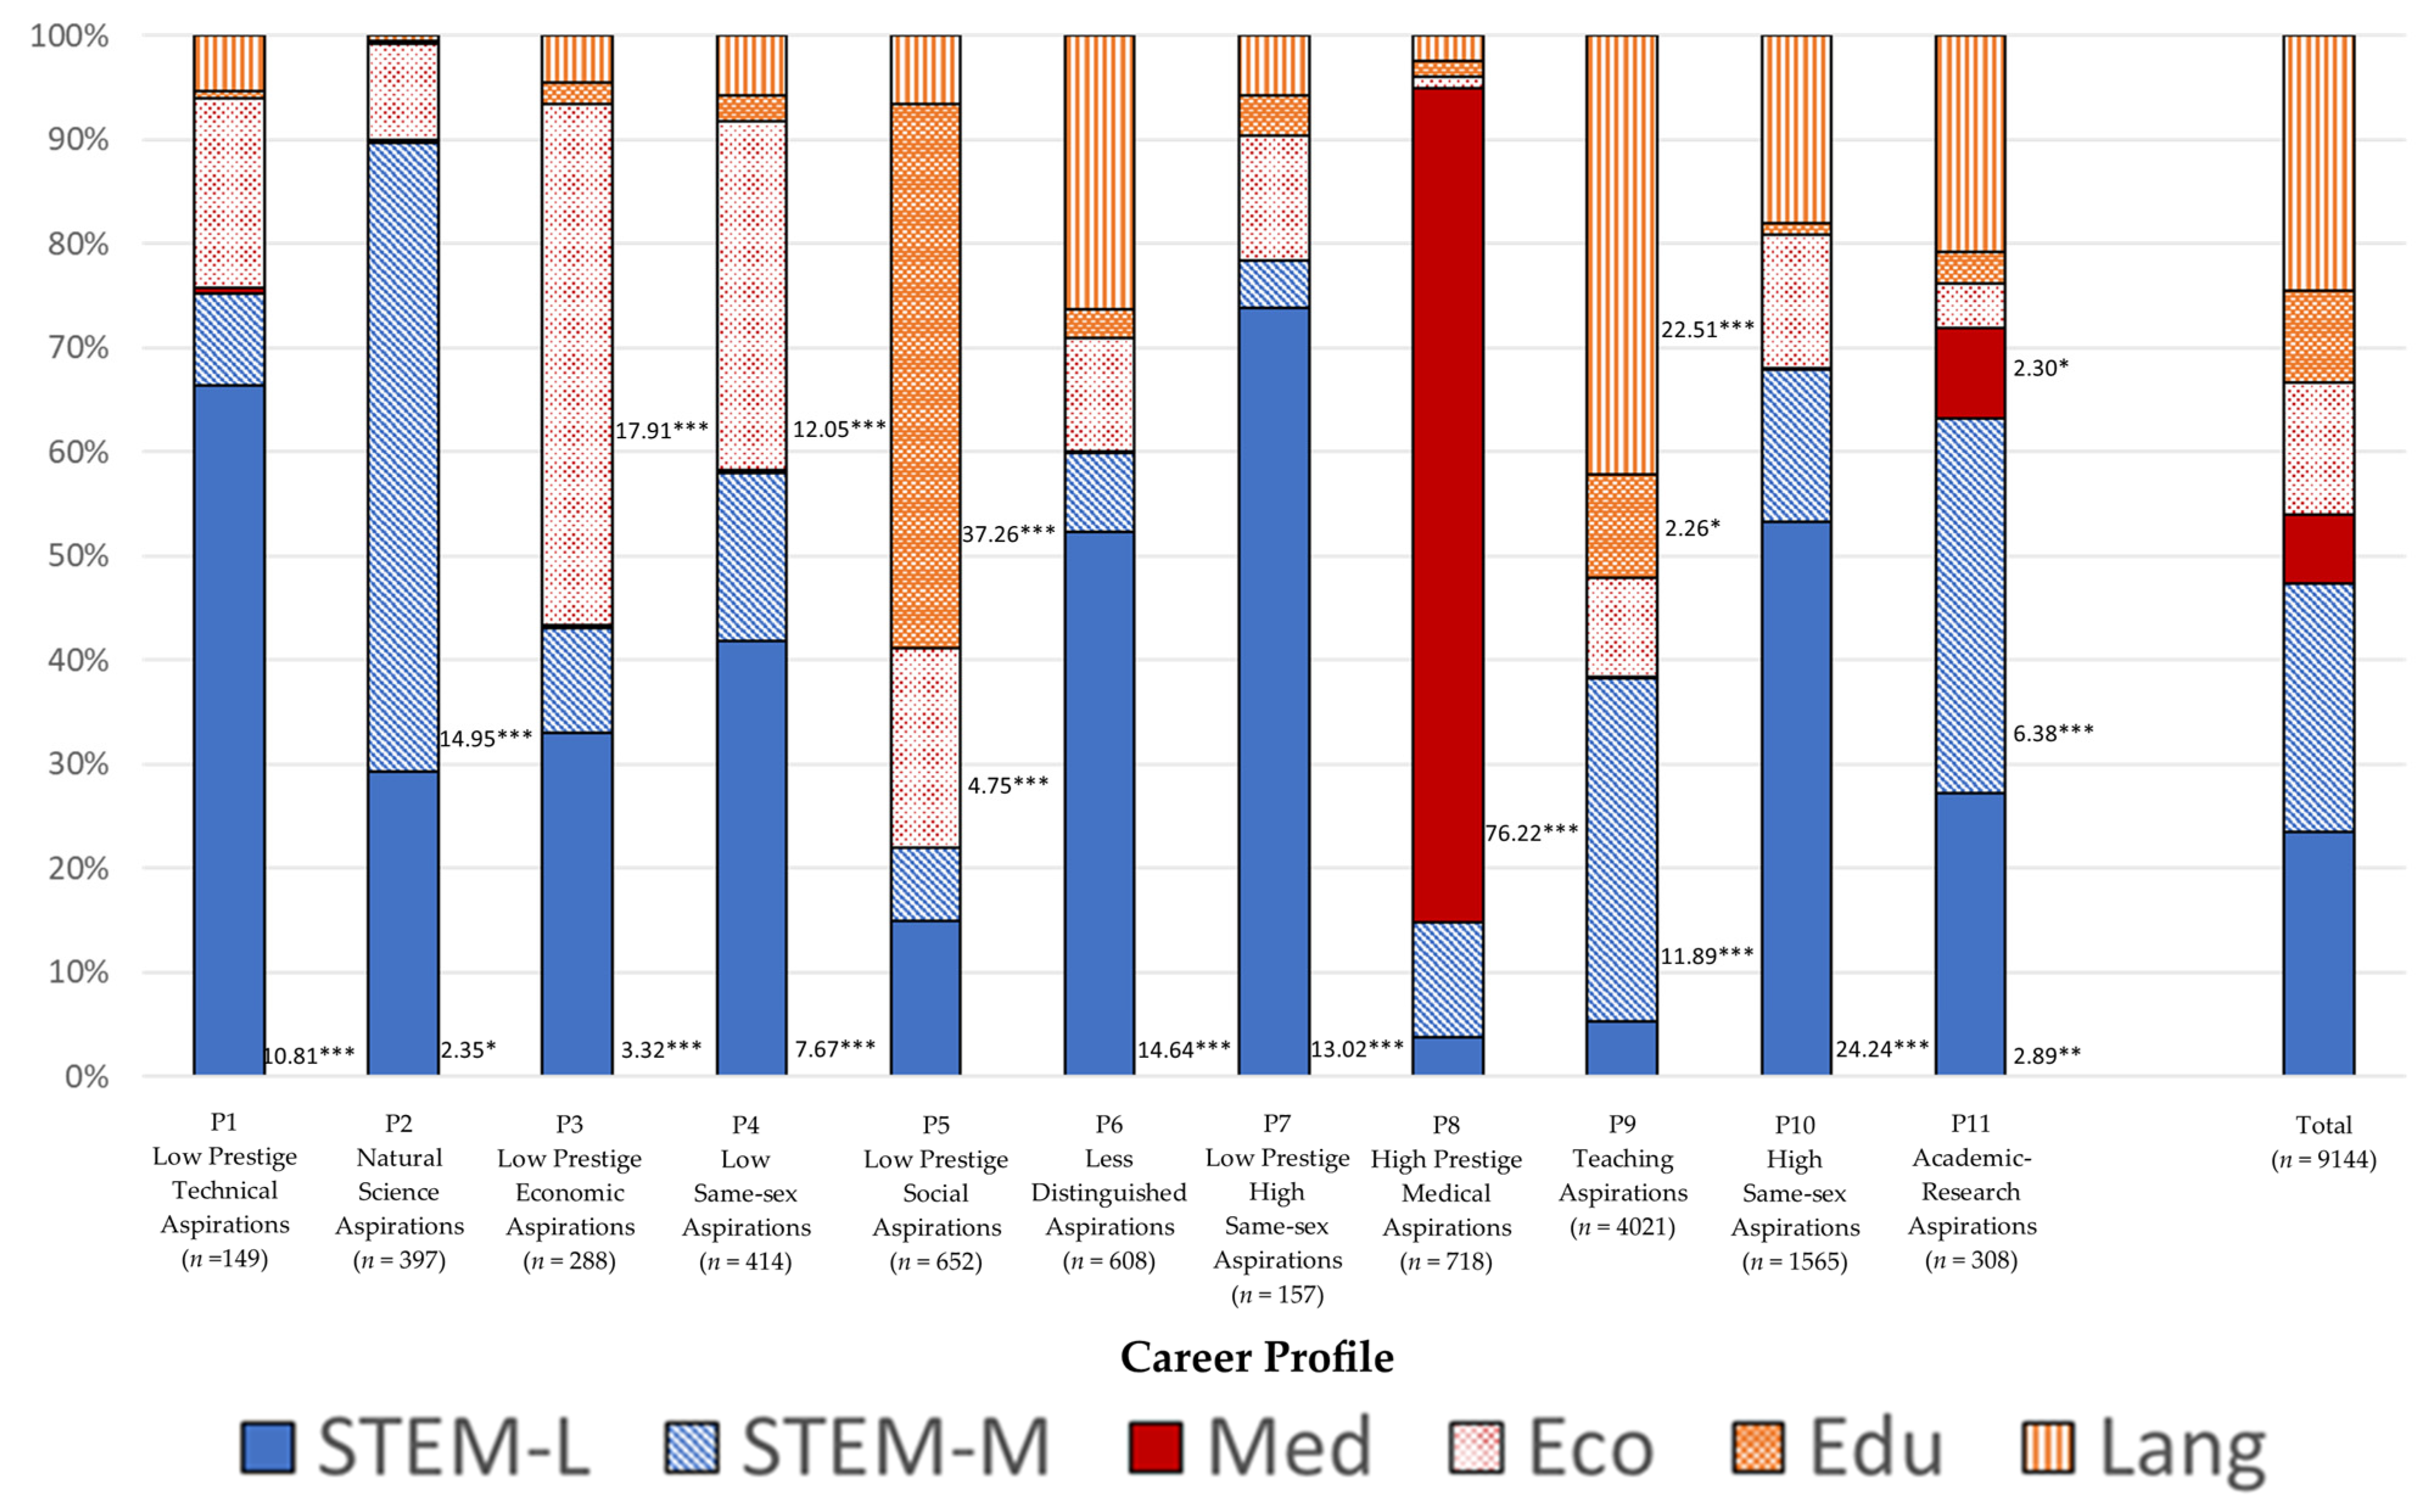
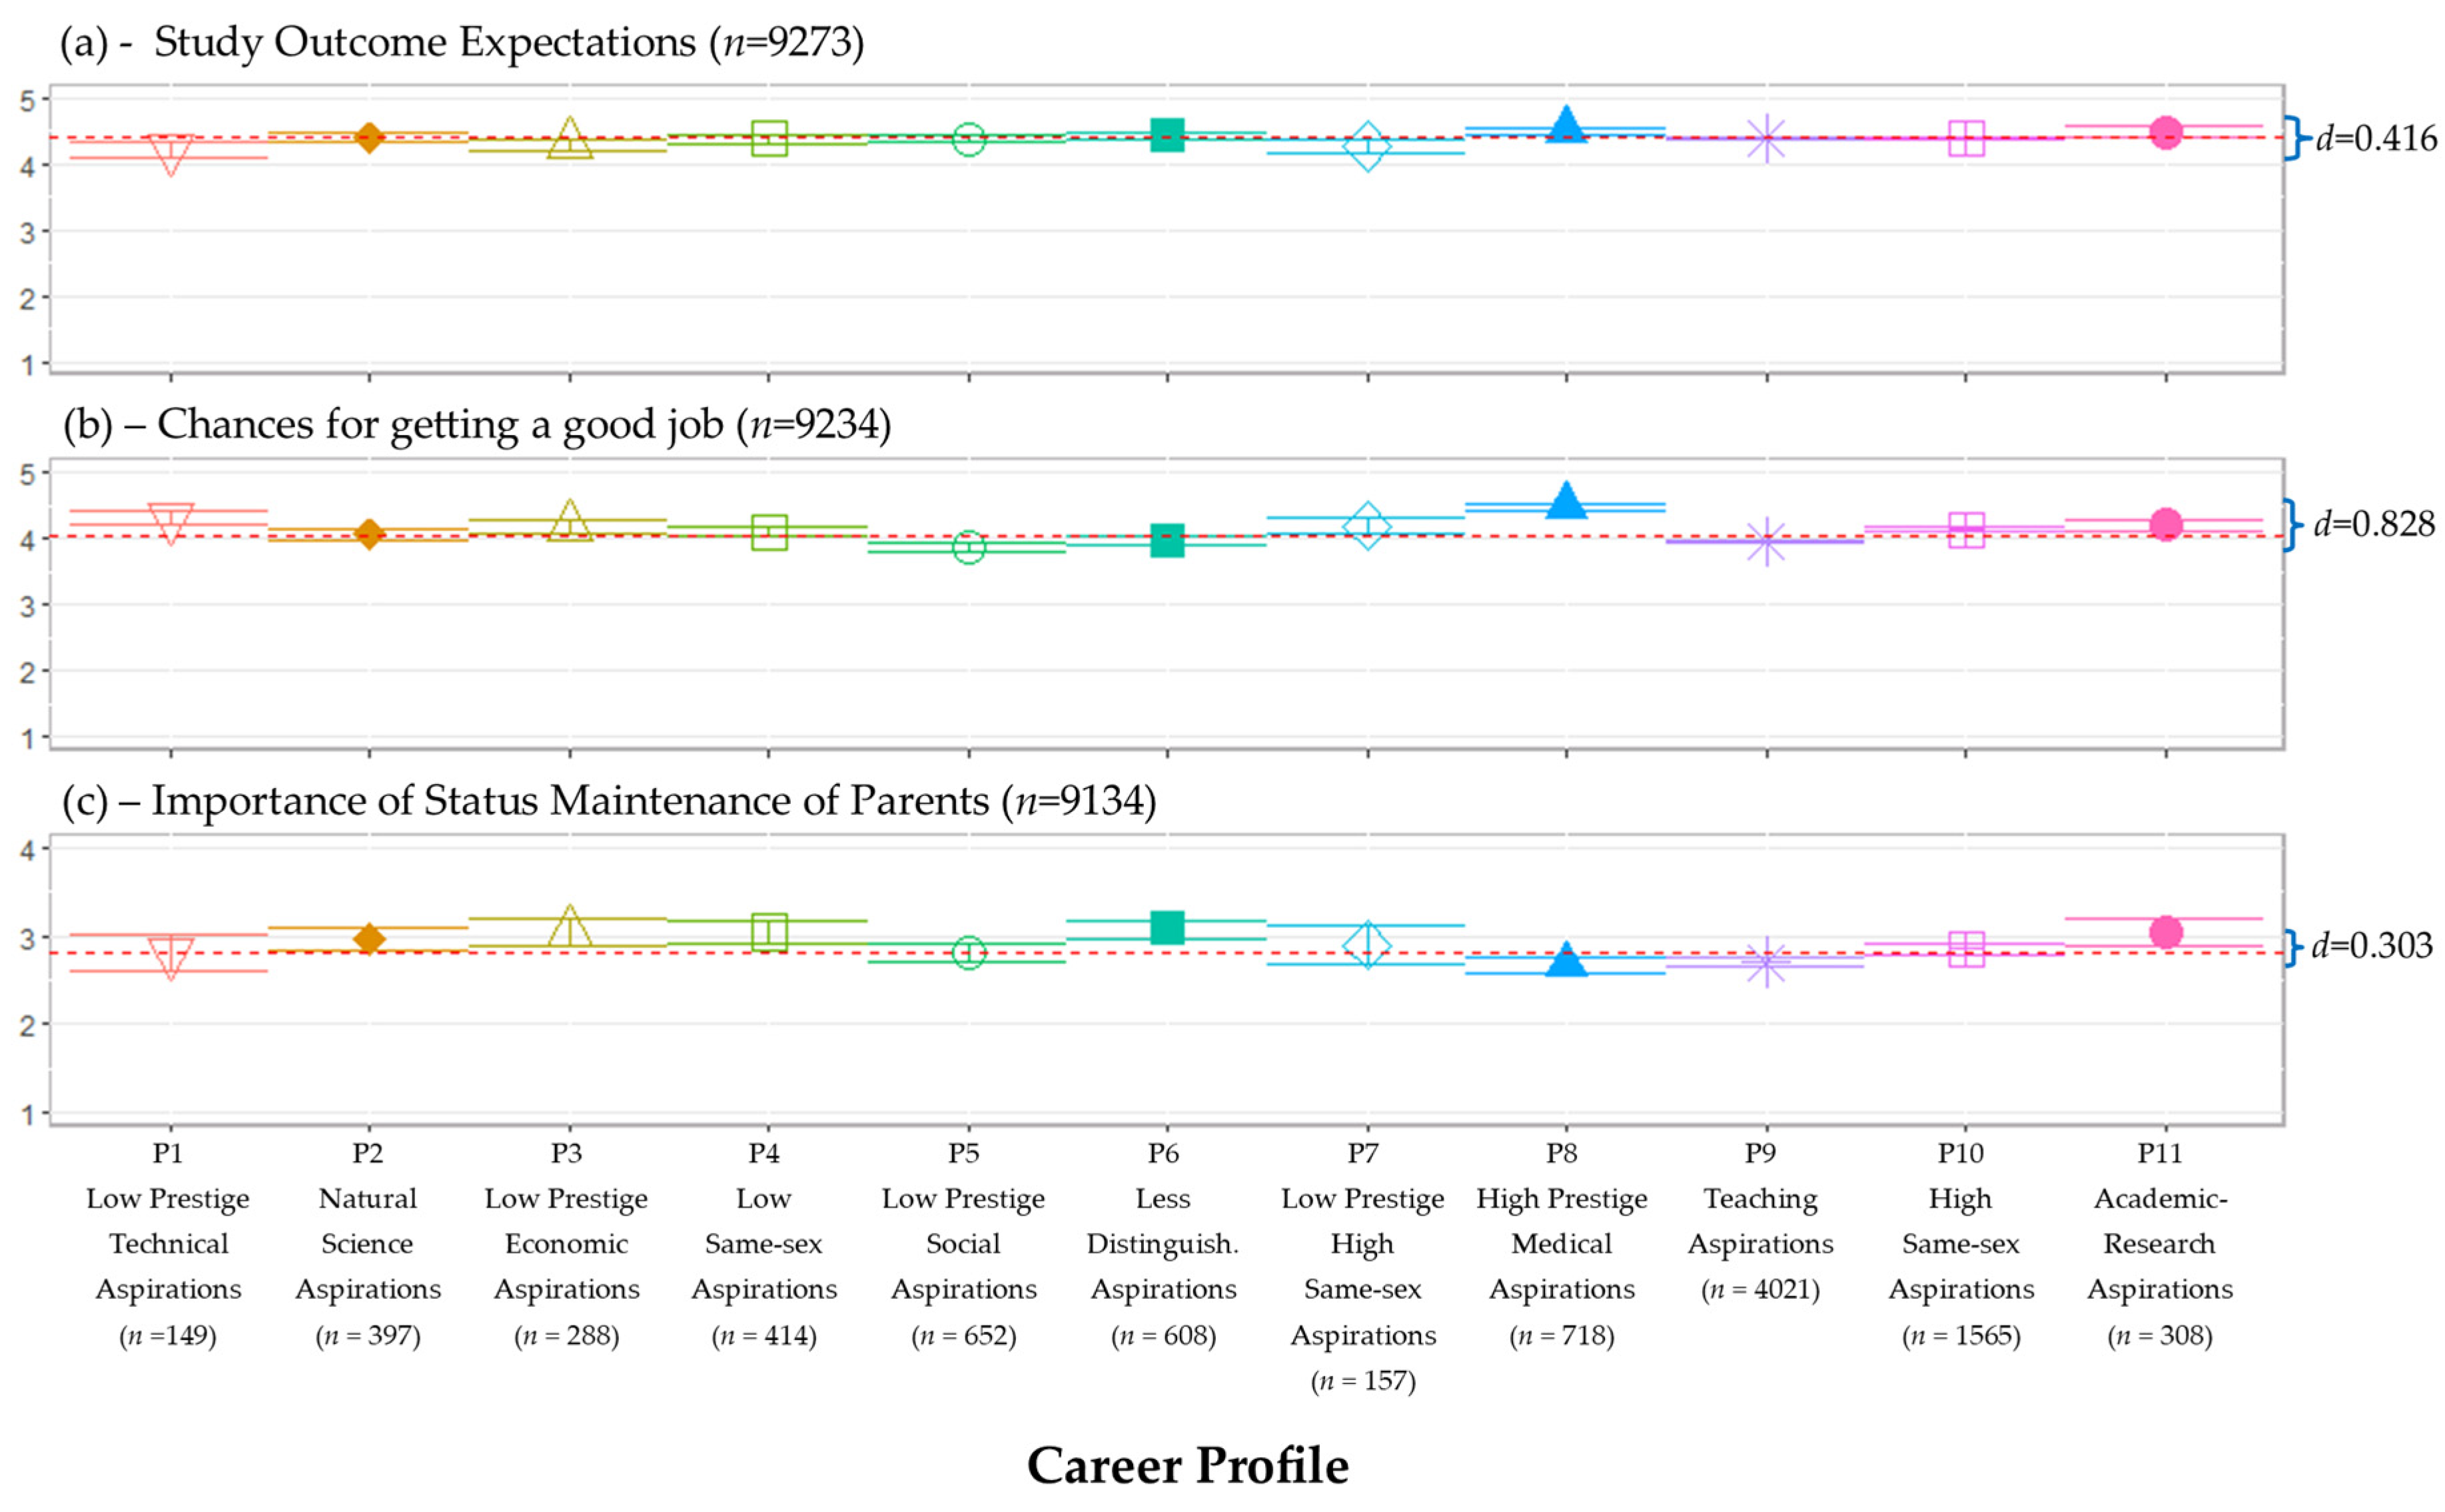
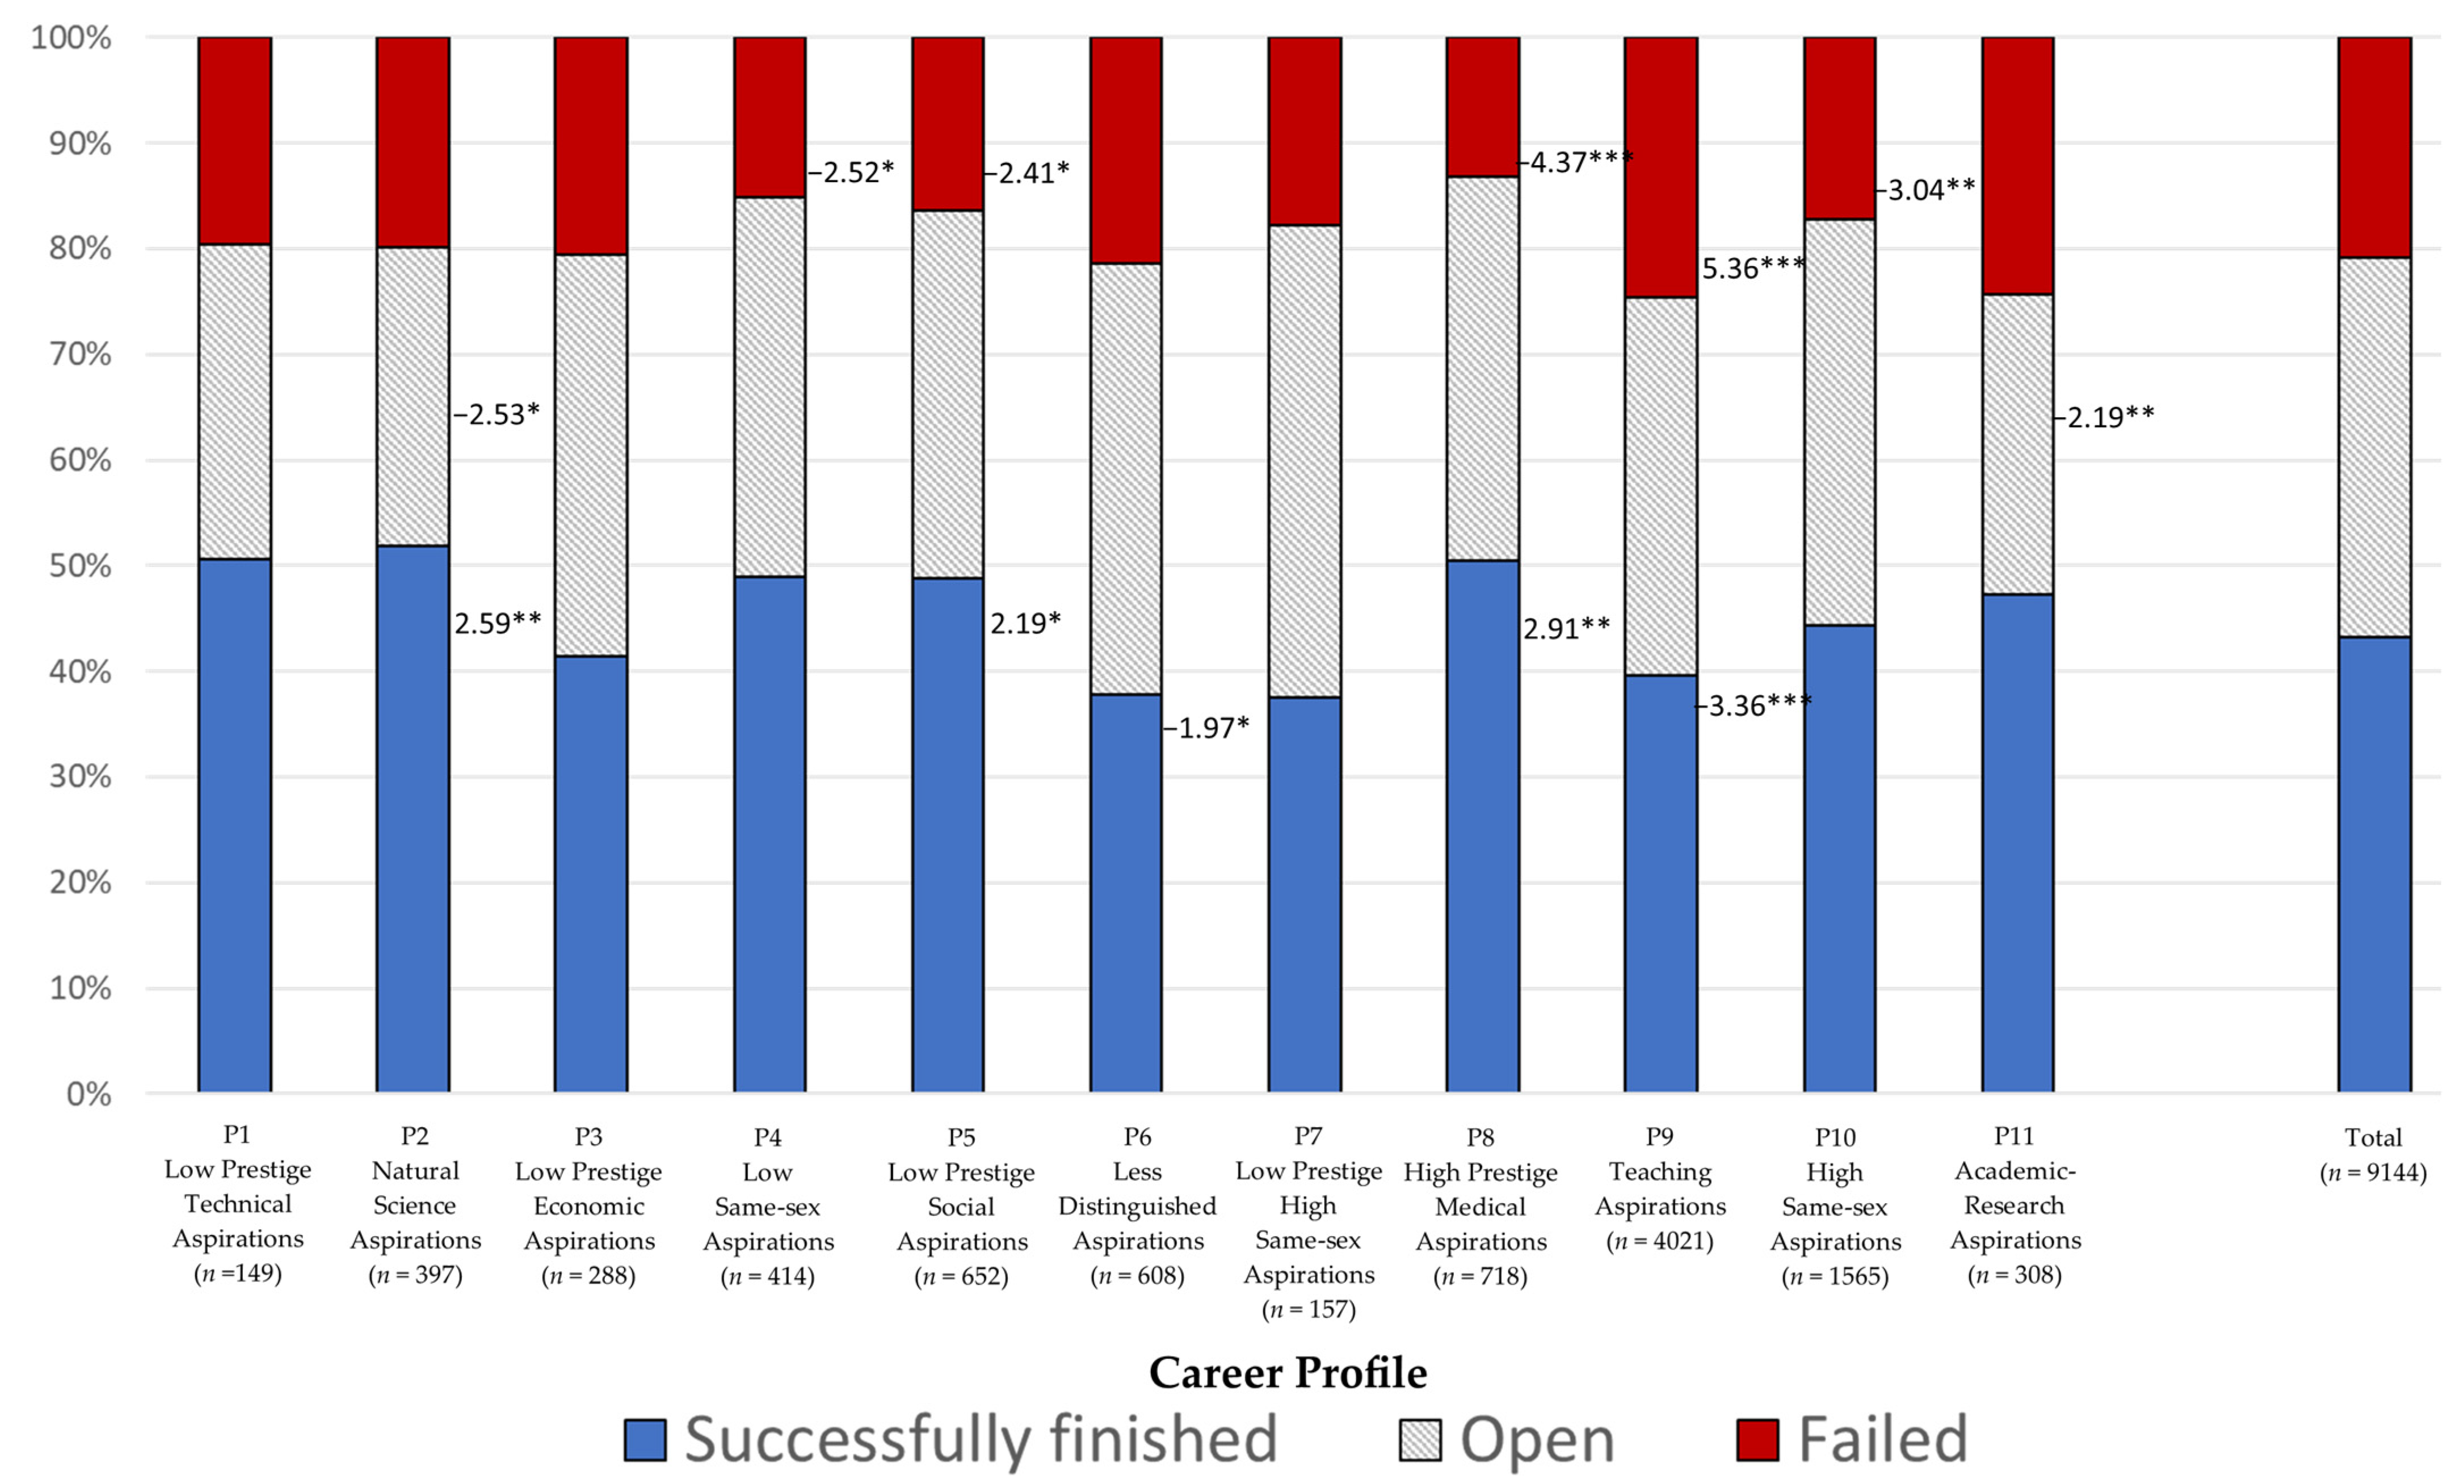
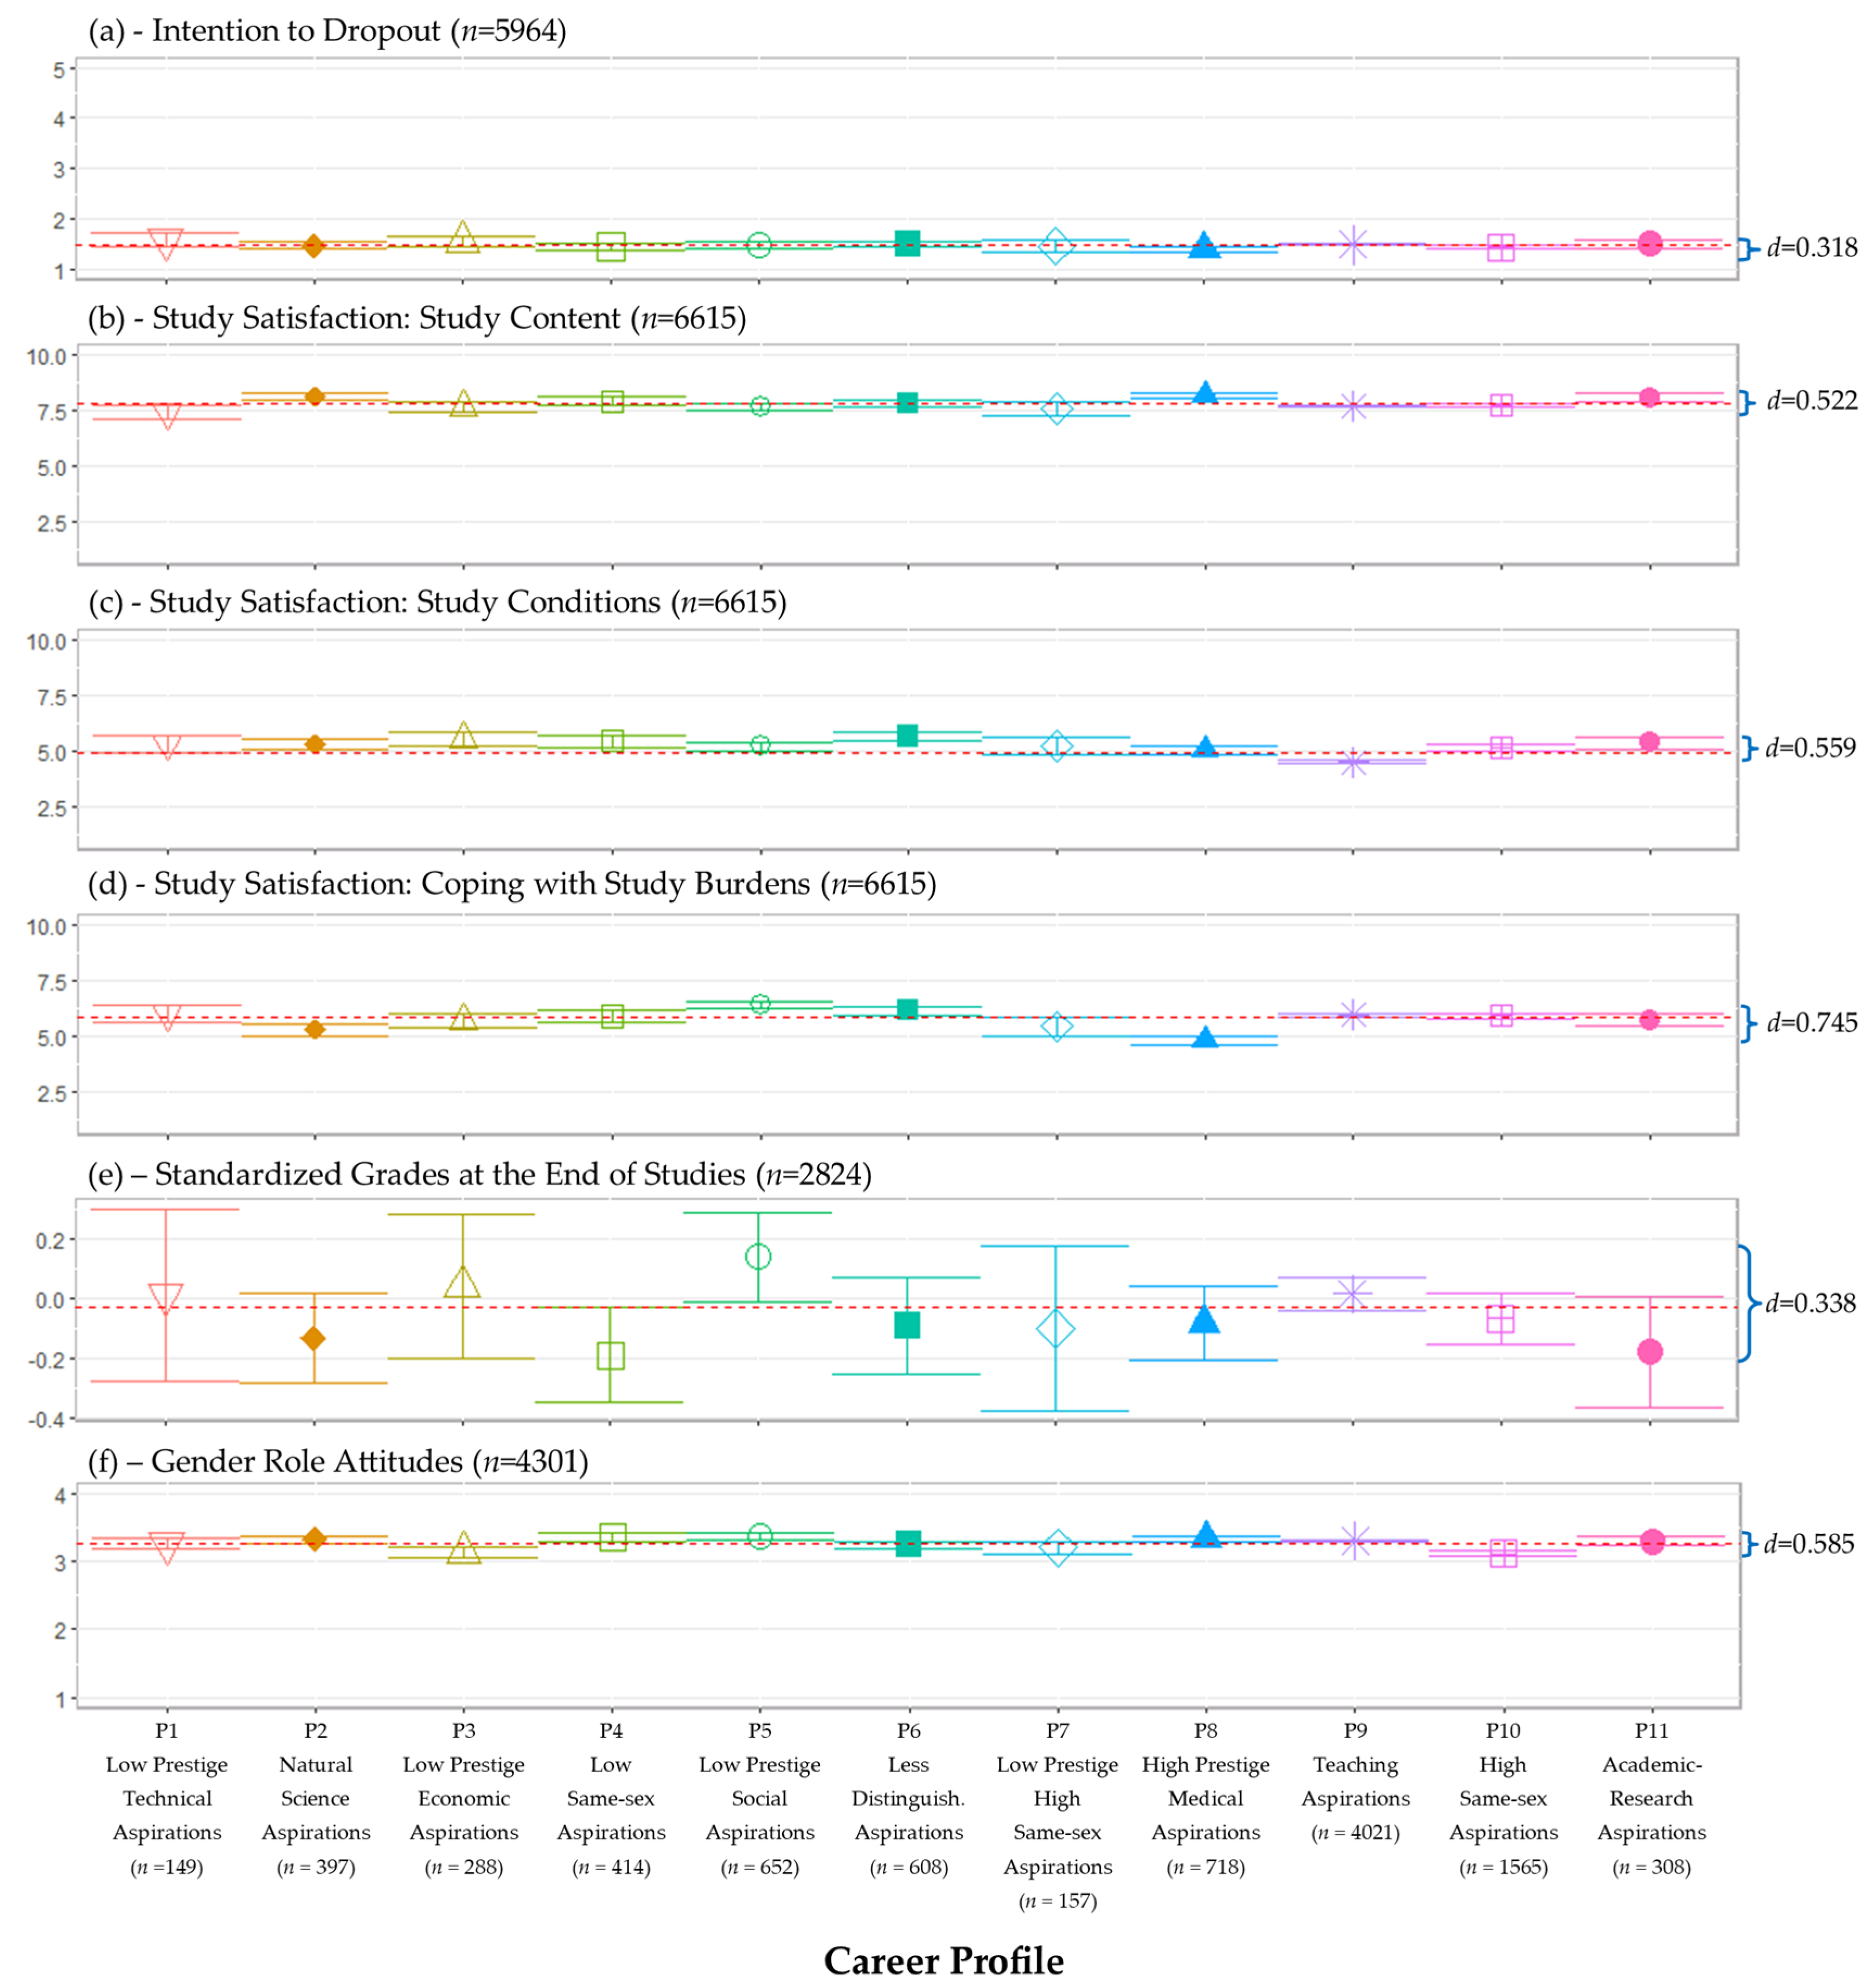
Table 1.
Summary of Career Profiles across Characterization and Validation Variables.
| Demographic Variables | Background Variables at Study Entry | Longitudinal Variables in Later Waves | Study Episode Data | ||||||||||
|---|---|---|---|---|---|---|---|---|---|---|---|---|---|
| Sex * | Study Cluster * | Teach. Orient. * | Study Outcome Expect. | Chances for Getting a Good Job | Status Maint. of Parents | Intention to Dropout | Study Content Satisfact. | Study Cond. Satisfact. | Coping w/Burdens Satisfact. | Gender Role Attitudes | Final Study Grades | Study Outcomes *A | |
| P1—Low Prestige Technical | Male | STEM-L | No | Below | Above | - | - | - | - | - | - | - | - |
| P2—Natural Science | Male | STEM-L STEM-M | No | - | - | Above | - | Above | Above | Below | - | - | +Success |
| P3—Low Prestige Economic | - | STEM-L ECO | No | Below | Above | Above | - | - | Above | - | Trad. | - | - |
| P4—Low Same-sex | Female | STEM-L ECO | No | - | - | Above | - | - | Above | - | Egal. | - | -Fail |
| P5—Low Prestige Social | Female | ECO EDU | No | - | Below | - | - | - | Above | Above | Egal. | Above | +Success -Fail |
| P6—Less Distinguish. | Male | STEM-L | No | - | Below | Above | - | - | Above | Above | - | - | -Fail |
| P7—Low Prestige High Same-sex | Male | STEM-L | No | Below | Above | - | - | - | - | - | - | - | - |
| P8—High Prestige Medical | Female | MED | No | Above | Clearly Above | Below | Below | Above | - | Clearly Below | Egal. | - | +Success -Fail |
| P9—Teaching | Female | STEM-M EDU LANG | Yes | - | Below | Below | Below | Below | Above | Egal. | - | -Success +Fail | |
| P10—High Same-sex | Male | STEM-L | No | - | Above | - | - | - | Above | - | Trad. | - | -Fail |
| P11—Academic-Research | Male | STEM-L STEM-M MED | No | Above | Above | Above | - | Above | Above | - | - | - | - |
Note: * = Variables analysed using chi square tests are only summarized by significant associations. A = Study outcomes also indicate the direction of the association using a ‘+’ for increased and a ‘-’ for a decreased association. Above/Below = Mean scores are indicated as either significantly above or below the sample mean scores. Clearly Above/Below = Mean scores that are indicated as either significantly above or below any other profile’s confidence interval. Gender role attitudes are indicated as either significantly traditional (Trad.) or egalitarian (Egal.). Teach. Orient. = Teaching orientation. Study outcome expect. = Study outcome expectations. Status maint. of parents = Importance of status maintenance with parents. Study content satisfact. = Satisfaction with study content. Study cond. satisfact. = Satisfaction with study conditions. Coping w/ burdens. satisfact. = Satisfaction related to coping with study burdens. * STEM-L = STEM studies with a female proportion less than 30%; STEM-M = STEM studies with a sex proportion between 30–70%, MED = Medicine, ECO = Economics, EDU = Education, LANG = Language. For references regarding significance see the following tables or figures: “Sex” = Supplementary Table S15; “Study Cluster” = Supplementary Table S16; “Teaching Orientation” = Supplementary Table S17; “Study outcome expectations”, “Chances for getting a good job”,” Importance of status maintenance with parents” = Supplementary Table S18 & Supplementary Figure S3; “ Intention to dropout”, “Satisfaction with study content”, “Satisfaction with study conditions”, “Satisfaction related to coping with study burdens”, “ Final study grades” = Supplementary Table S19 & Supplementary Figure S4; “ Study Outcomes” = Supplementary Table S26.
Disclaimer/Publisher’s Note: The statements, opinions and data contained in all publications are solely those of the individual author(s) and contributor(s) and not of MDPI and/or the editor(s). MDPI and/or the editor(s) disclaim responsibility for any injury to people or property resulting from any ideas, methods, instructions or products referred to in the content. |
© 2023 by the authors. Licensee MDPI, Basel, Switzerland. This article is an open access article distributed under the terms and conditions of the Creative Commons Attribution (CC BY) license (https://creativecommons.org/licenses/by/4.0/).
Share and Cite
MDPI and ACS Style
Mouton, D.; Hartmann, F.G.; Ertl, B. Career Profiles of University Students: How STEM Students Distinguish Regarding Interests, Prestige and Sextype. Educ. Sci. 2023, 13, 324. https://doi.org/10.3390/educsci13030324
AMA Style
Mouton D, Hartmann FG, Ertl B. Career Profiles of University Students: How STEM Students Distinguish Regarding Interests, Prestige and Sextype. Education Sciences. 2023; 13(3):324. https://doi.org/10.3390/educsci13030324
Chicago/Turabian StyleMouton, Divan, Florian G. Hartmann, and Bernhard Ertl. 2023. "Career Profiles of University Students: How STEM Students Distinguish Regarding Interests, Prestige and Sextype" Education Sciences 13, no. 3: 324. https://doi.org/10.3390/educsci13030324
Note that from the first issue of 2016, this journal uses article numbers instead of page numbers. See further details here.