
Australian Primary School Students’ Knowledge of the Agricultural Industry


Abstract
:1. Introduction
2. Materials and Methods
2.1. Survey
2.2. Analytic Strategy
3. Results
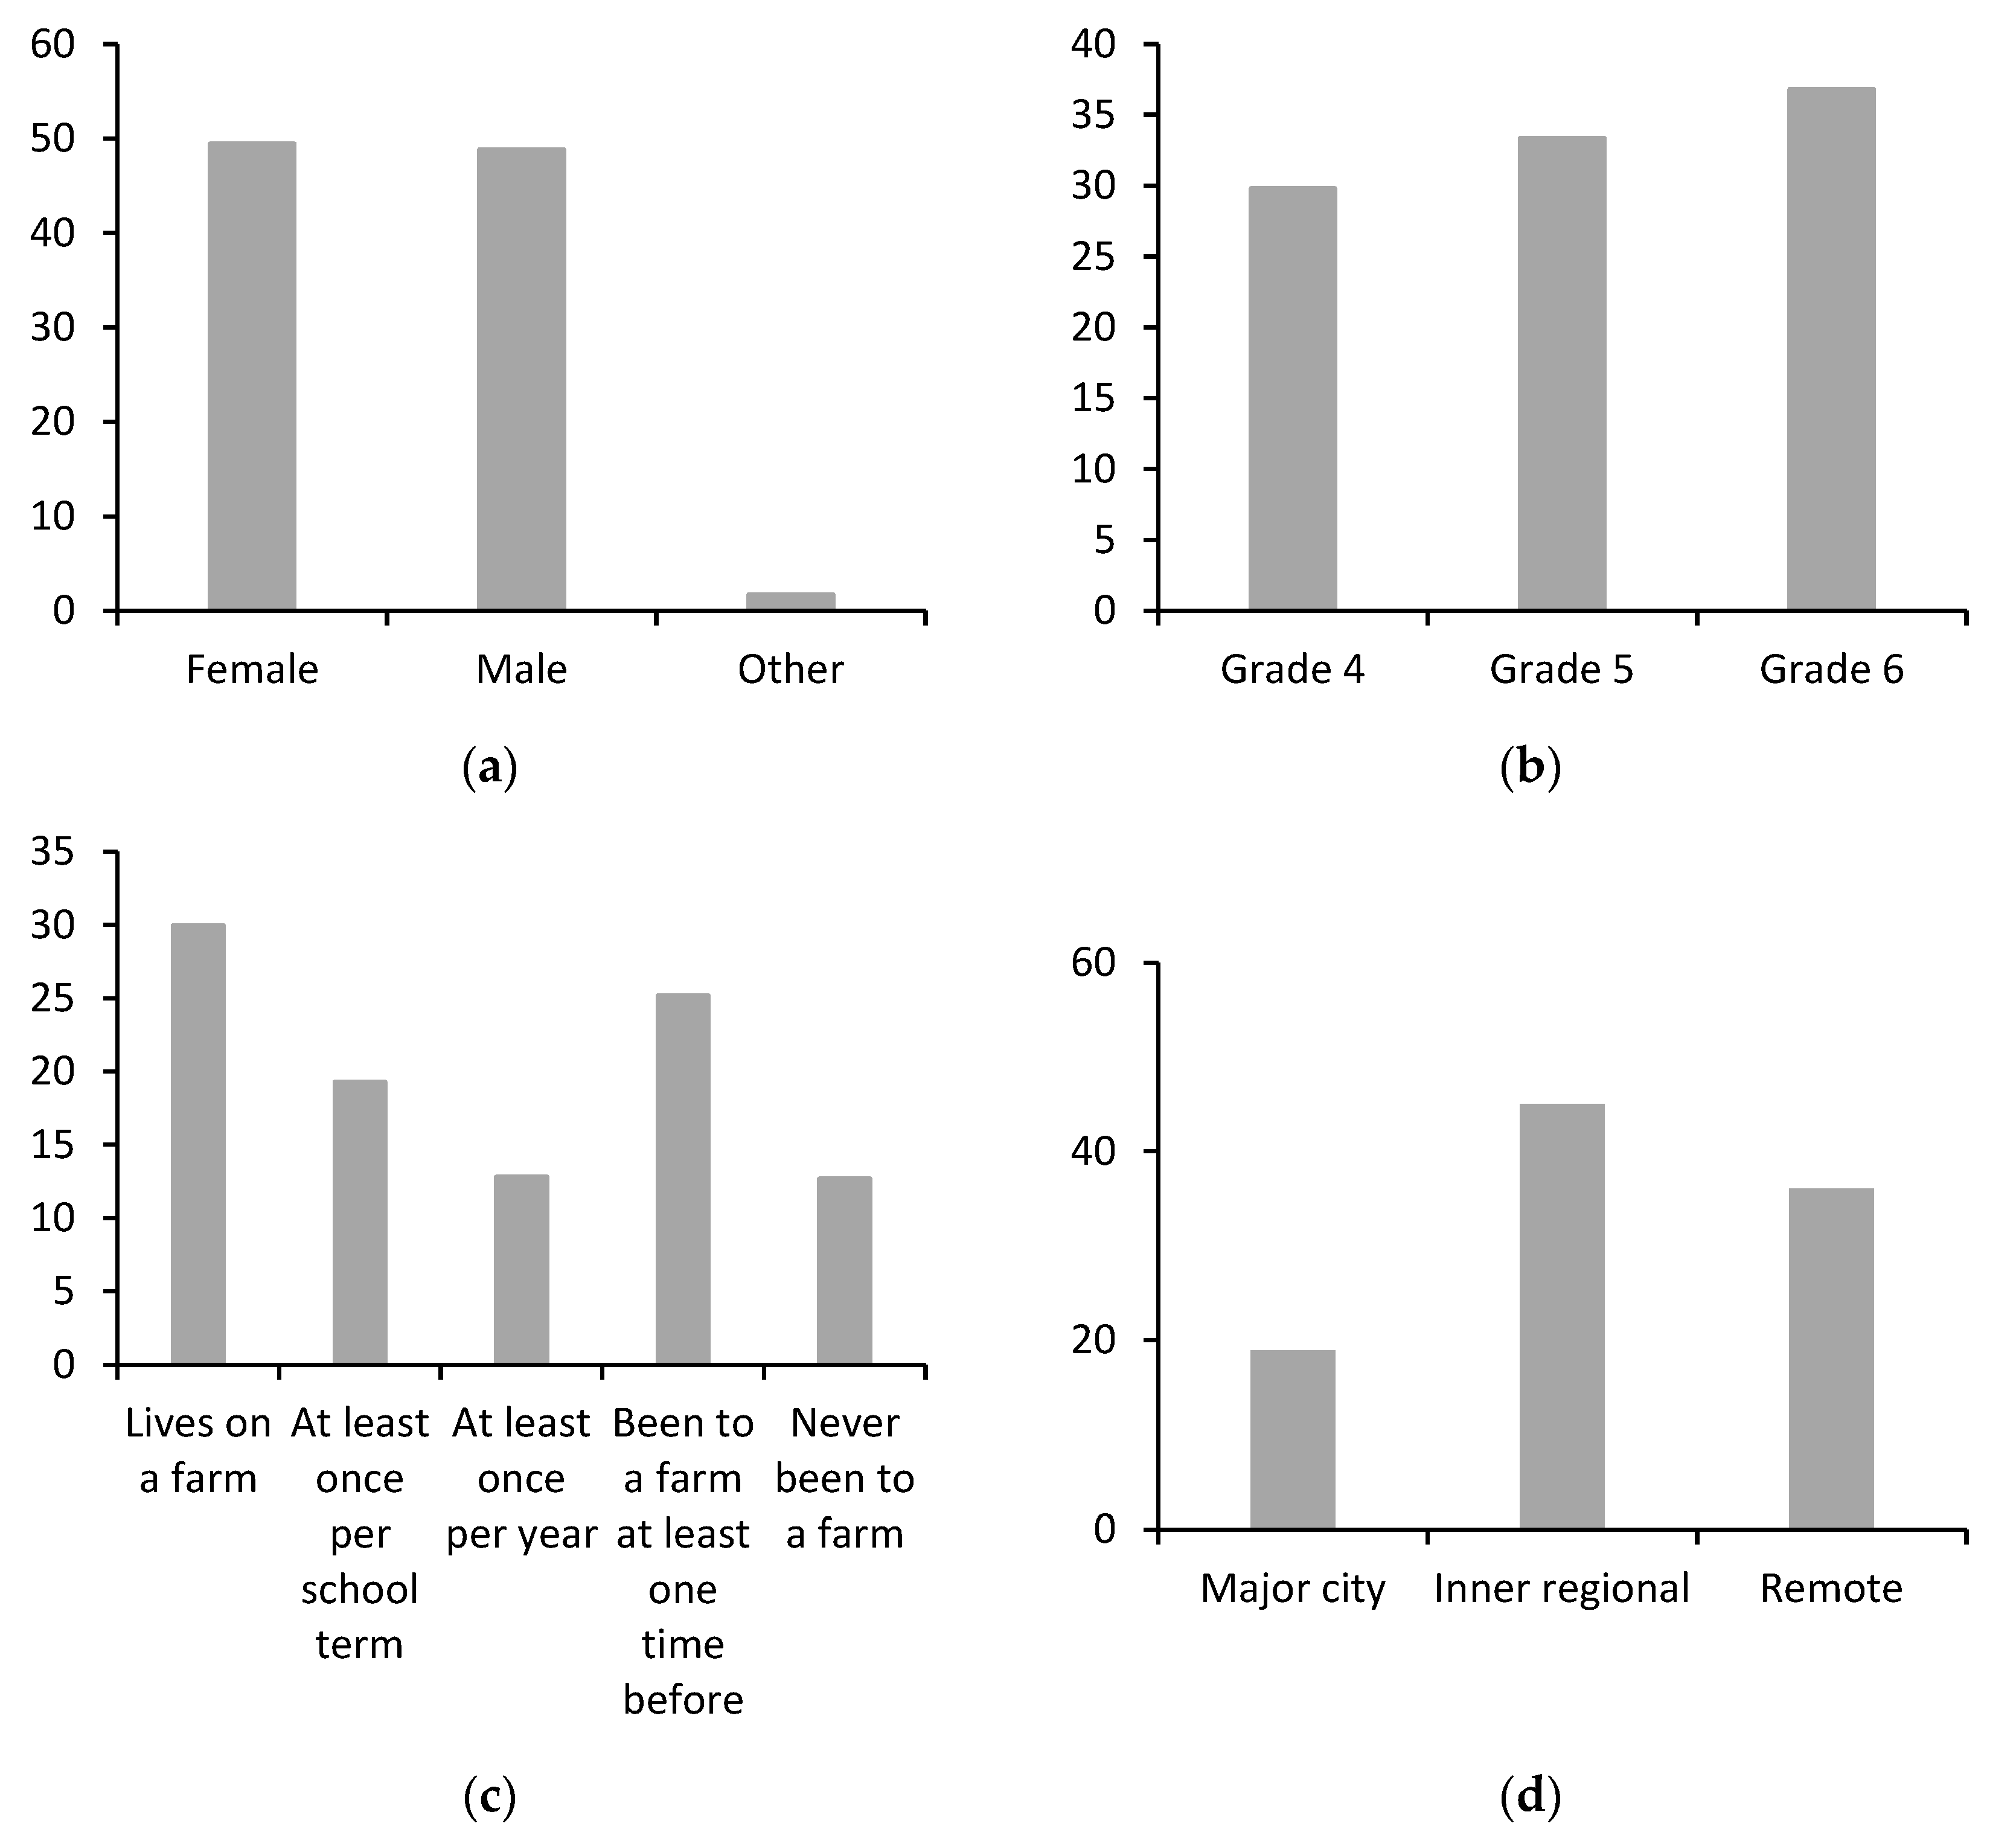
3.1. Participants
3.2. Agricultural Knowledge
4. Discussion
Limitations and Future Research
5. Conclusions
Author Contributions
Funding
Institutional Review Board Statement
Informed Consent Statement
Data Availability Statement
Acknowledgments
Conflicts of Interest
References
- PIEFA. Food, Fibre and Our Future 2020: PIEFA Student Survey Summary Report on Student Knowledge, Understanding and Sentiment About Primary Industries; Primary Industries Education Foundation Australia: Canberra, Australia, 2020. [Google Scholar]
- Brandt, M.; Forbes, C.; Keshwani, J. Exploring Elementary Students’ Scientific Knowledge of Agriculture Using Evidence-Centered Design. J. Agric. Educ. 2017, 58, 134–149. [Google Scholar] [CrossRef]
- ABARES. Snapshot of Australian Agriculture 2022; Australian Bureau of Agricultural and Resource Economics and Sciences: Canberra, Australia, 2022.
- Australia Bureau of Statistics. 2112.0—Census of the Commonwealth of Australia, 1911. Available online: https://www.abs.gov.au/AUSSTATS/abs@.nsf/DetailsPage/2112.01911?OpenDocument (accessed on 28 April 2022).
- Powell, D.V.; Agnew, D.M. Assessing Agricultural Literacy Elements of Project Food Land and People in K-5 using the Food and Fiber Systems Literacy Standards. J. Agric. Educ. 2011, 52, 155–170. [Google Scholar] [CrossRef]
- Jones, A. Help or Hinder? How the Mainstream Media Portrays Farming to the Public; Nuffield Scholar: Taunton, UK, 2017. [Google Scholar]
- FAO; IFAD; UNICEF; WFP; WHO. The State of Food Security and Nutrition in the World 2021. In Transforming Food Systems for Food Security, Improved Nutrition and Affordable Healthy Diets for All; FAO: Rome, Italy, 2021. [Google Scholar]
- Nanayakkara, J.; Margerison, C.; Worsley, A. Importance of food literacy education for senior secondary school students: Food system professionals’ opinions. Int. J. Health Promot. Educ. 2017, 55, 284–295. [Google Scholar] [CrossRef]
- Roth, G. Retaining the Social Licence: The Australian Cotton Industry Case Study. In Defending the Social Licence of Farming: Issues, Challenges and New Directions for Agriculture; Williams, J., Martin, P., Eds.; CSIRO Publishing: Melbourne, Australia, 2011. [Google Scholar]
- Cosby, A.; Manning, J.; Trotter, M. TeachersFX—Building the Capacity of STEM, Agriculture and Digital Technologies Teachers in Western Australia. Int. J. Innov. Sci. 2019, 27, 76–87. [Google Scholar] [CrossRef]
- Kruger, T.; Beilin, R. Lost in transition: Secondary school students’ understanding of landscapes and natural resource management. Youth Stud. Aust. 2012, 31, 43–52. [Google Scholar]
- Matthews, B.; Falvey, L. Year 10 students’ perception of agricultural careers: Victoria (Australia). J. Int. Agric. Ext. Educ. 1999, 6, 55–67. [Google Scholar] [CrossRef]
- Poole, R.; van Delden, B.; Liddell, P. Talking 2030: Growing Agriculture into a $100 Billion Industry. Available online: https://home.kpmg/au/en/home/insights/2018/03/talking-2030-growing-australian-agriculture-industry.html (accessed on 30 December 2021).
- Bassett, K.; Newsome, L.; Sheridan, A.; Azeem, M.M. Characterizing the Changing Profile of Employment in Australian Agriculture. J. Rural Stud. 2022, 89, 316–327. [Google Scholar] [CrossRef]
- Kovar, K.; Ball, A. Two Decades of Agricultural Literacy Research: A Synthesis of the Literature. J. Agric. Educ. 2013, 54, 167–178. [Google Scholar] [CrossRef]
- Cosby, A.; Manning, J.; Power, D.; Harreveld, B. New Decade, Same Concerns: A Systematic Review of Agricultural Literacy of School Students. Educ. Sci. 2022, 12, 235. [Google Scholar] [CrossRef]
- ACARA. Curriculum Connections: Food and Fibre. Available online: https://www.australiancurriculum.edu.au/resources/curriculum-connections/portfolios/food-and-fibre/ (accessed on 28 April 2022).
- Spielmaker, D.M.; Leising, J.G. National Agricultural Literacy Outcomes. Available online: https://www.agliteracy.org/resources/outcomes/ (accessed on 26 May 2022).
- Longhurst, M.L.; Judd-Murray, R.; Coster, D.C.; Spielmaker, D.M. Measuring Agricultural Literacy: Grade 3–5 Instrument Development and Validation. J. Agric. Educ. 2020, 61, 173–192. [Google Scholar] [CrossRef]
- Longhurst, M.L.; Judd-Murray, R.; Spielmaker, D.M. Longhurst Murray Agricultural Literacy Instrument; National Center for Agricultural Literacy, Utah State University: Logan, UT, USA, 2019. [Google Scholar]
- Hillman, K.; Buckley, S. Report on Surveys of Students’ and Teachers’ Knowledge and Understanding of Primary Industries; Australian Council for Educational Research: Canberra, Australia, 2011. [Google Scholar]
- ABS. 1270.0.55.005—Australian Statistical Geography Standard (ASGS): Volume 5—Remoteness Structure, July 2016. Available online: https://www.abs.gov.au/websitedbs/d3310114.nsf/home/remoteness+structure (accessed on 19 July 2022).
- Life Education Australia. How We Deliver Preventative Health Education. Available online: https://lifeed.org.au/what-we-do/how-we-deliver-preventative-health-education/ (accessed on 5 July 2022).
- Australian Chicken Meat Federation. Time to Seperate Fact from Fiction. Available online: https://www.chicken.org.au/time-to-separate-fact-from-fiction/ (accessed on 29 April 2022).
- Umberger, W.J.; Malek, L. Market insights for Australia’s chicken meat industry. In AgriFutures Australia Publication No. 21-015; AgriFutures Australia: Wagga Wagga, Australia, 2021. [Google Scholar]
- Gargiulo, J.I.; Eastwood, C.R.; Garcia, S.C.; Lyons, N.A. Dairy farmers with larger herd sizes adopt more precision dairy technologies. Int. J. Dairy Sci. Process. 2018, 101, 5466–5473. [Google Scholar] [CrossRef] [Green Version]
- Dairy Australia. Strategic Plan 2020–2025; Dairy Australia: Melbourne, Australia, 2021. [Google Scholar]
- Fogarty, E.S.; Swain, D.L.; Cronin, G.M.; Trotter, M. A systematic review of the potential uses of on-animal sensors to monitor the welfare of sheep evaluated using the Five Domains Model as a framework. Anim. Welf. 2019, 28, 407–420. [Google Scholar] [CrossRef]
- Sara Oleiro, A.; Ricardo Silva, P.; José, B.; Fernando, L.; José Cochicho, R. Characterising the Agriculture 4.0 Landscape—Emerging Trends, Challenges and Opportunities. Agronomy 2021, 11, 667. [Google Scholar] [CrossRef]
- YouthInsight Australia. Developing Student Interest in the Agriculture Sector; Department of Primary Industries and Regional Development: Manjimup, Australia, 2017.
- Manning, J.; Cosby, A.; Power, D.; Fogarty, E.S.; Harreveld, B. A Systematic Review of the Emergence and Utilisation of Agricultural Technologies into the Classroom. Agriculture 2022, 12, 818. [Google Scholar] [CrossRef]
- Pratley, J. Workforce Planning in Agriculture: Agricultural Education and Capacity building at the Crossroads. Farm Policy J. 2008, 5, 27–41. [Google Scholar]
- Dodd, J. Sustaining Agriculture in NSW High Schools—An Assessment of the Use of Examples from Alternative Agriculture and Investigation into the Role of High School Agriculture in Meeting The Future Needs of the Industry. Master’s Thesis, Charles Stuart University, Bathurst, Australia, 2011. [Google Scholar]
- ACARA. NAPLAN Achievement in Reading, Writing, Language Conventions and Numeracy: National Report for 2021; ACARA: Sydney, Australia, 2021.
- O’Dea, M.; Cosby, A.; Manning, J.; McDonald, N.; Harreveld, B. Industry perspectives of industry school partnerships: What can agriculture learn? Aust. Int. J. Rural. Educ. 2022, 32, 1–21. [Google Scholar] [CrossRef]


| Simon Got a New Pair of Cotton Socks for Christmas. Cotton Is a Fibre Used in Many Types of Clothing. Where Does Cotton Come From? | n | % |
|---|---|---|
| (a) Animals | 460 | 19.2 |
| (b) Plants | 1288 | 53.8 |
| (c) Animals and plants | 469 | 19.6 |
| (d) It is man made | 77 | 3.2 |
| (e) I don’t know/blank | 98 | 4.1 |
| Ben Has a Cheese Sandwich and an Apple in His Lunchbox. Which Foods in His Lunchbox Are Produced from Ingredients That Came from a Farm? | n | % |
|---|---|---|
| (a) The apple | 241 | 10.1 |
| (b) The cheese | 373 | 15.6 |
| (c) The bread | 82 | 3.4 |
| 1 (b) and (c) | 25 | 1.0 |
| (d) The apple and cheese | 376 | 15.7 |
| (e) The apple and the bread | 147 | 6.2 |
| (f) All of the items came from a farm | 1043 | 43.6 |
| (g) I don’t know | 105 | 4.4 |
| Draw an Arrow to Match the Farm Products to Their End Use | ||||||||
|---|---|---|---|---|---|---|---|---|
| Beef | Orange | Bacon | Wool | |||||
| n | % | n | % | n | % | n | % | |
| (a) Pig | 29 | 1.2 | 5 | 0.2 | 2325 | 97.2 | 8 | 0.3 |
| (b) Cow | 2327 | 97.3 | 6 | 0.3 | 27 | 1.1 | 3 | 0.1 |
| (c) Sheep | 4 | 0.2 | 8 | 0.3 | 8 | 0.3 | 2342 | 97.9 |
| (d) Tree | 3 | 0.1 | 2342 | 97.9 | 6 | 0.3 | 9 | 0.4 |
| Blank | 29 | 1.2 | 31 | 1.3 | 26 | 1.1 | 30 | 1.3 |
| True | False | I Don’t Know/Blank | ||||
|---|---|---|---|---|---|---|
| n | % | n | % | n | % | |
| All farm animals in Australia are kept in cages. | 143 | 6.0 | 2086 | 87.2 | 163 | 6.8 |
| All chickens in Australia are given hormones to grow. | 454 | 19.0 | 912 | 38.1 | 1026 | 42.9 |
| Amy Is a Dairy Farmer. Circle All the Methods That Farmers Use to Collect Milk from Cows on Commercial Dairy Farms in Australia to Sell to Customers (You May Choose More than One Answer). | n |
|---|---|
| (a) With milking machines | 1873 |
| (b) By hand into a bucket | 1865 |
| (c) In a robotic dairy | 638 |
| (d) I don’t know/blank | 76 |
| Farmer Ted Uses His Computer to Keep Track of His Business Records. What Other Kinds of New Technology Can a Farmer Use? Circle All That Apply (You May Choose More than One Answer). | n |
|---|---|
| (a) Tap and hose | 777 |
| (b) iPad | 1305 |
| (c) Cattle yards | 1147 |
| (d) Drones | 1514 |
| (e) I don’t know/blank | 161 |
| Farah Lives in Malaysia and Takes Starfruit to School. Jane Lives in Australia and Takes an Apple to School. Why Do People in Different Parts of the World Eat Different Fruits and Vegetables? | n | % |
|---|---|---|
| (a) Because Farah likes star fruits and Jane likes apples | 255 | 10.7 |
| (b) Because some fruits and vegetables grow better in certain areas of the world | 1887 | 78.9 |
| (c) Because their school tells them what fruit they can bring | 44 | 1.8 |
| (d) I don’t know/blank | 206 | 8.6 |
Disclaimer/Publisher’s Note: The statements, opinions and data contained in all publications are solely those of the individual author(s) and contributor(s) and not of MDPI and/or the editor(s). MDPI and/or the editor(s) disclaim responsibility for any injury to people or property resulting from any ideas, methods, instructions or products referred to in the content. |
© 2023 by the authors. Licensee MDPI, Basel, Switzerland. This article is an open access article distributed under the terms and conditions of the Creative Commons Attribution (CC BY) license (https://creativecommons.org/licenses/by/4.0/).
Share and Cite
Cosby, A.; Fogarty, E.S.; Manning, J. Australian Primary School Students’ Knowledge of the Agricultural Industry. Educ. Sci. 2023, 13, 206. https://doi.org/10.3390/educsci13020206
Cosby A, Fogarty ES, Manning J. Australian Primary School Students’ Knowledge of the Agricultural Industry. Education Sciences. 2023; 13(2):206. https://doi.org/10.3390/educsci13020206
Chicago/Turabian StyleCosby, Amy, Eloise S. Fogarty, and Jaime Manning. 2023. "Australian Primary School Students’ Knowledge of the Agricultural Industry" Education Sciences 13, no. 2: 206. https://doi.org/10.3390/educsci13020206