Article

Design and Assessment of Survey in a 360-Degree Feedback Environment for Student Satisfaction Analysis Applied to Industrial Engineering Degrees in Spain

by
Francisco-Javier Granados-Ortiz
1,2,*,
Ana Isabel Gómez-Merino
2,
Jesús Javier Jiménez-Galea
2,
Isidro María Santos-Ráez
2,
Juan Jesús Fernandez-Lozano
2,
Jesús Manuel Gómez-de-Gabriel
2 and
Joaquín Ortega-Casanova
2
1
Department of Engineering, University of Almería, 04120 Almeria, Spain
2
School of Industrial Engineering, University of Málaga, 29071 Málaga, Spain
*
Author to whom correspondence should be addressed.
Educ. Sci. 2023, 13(2), 199; https://doi.org/10.3390/educsci13020199
Submission received: 11 January 2023 / Revised: 2 February 2023 / Accepted: 8 February 2023 / Published: 13 February 2023
(This article belongs to the Special Issue Contemporary Trends and Issues in Engineering Education)

Abstract

:
The number of students enrolled in engineering studies in Spain is in decline, mainly due to the difficulty in passing the subjects, whose factors may be linked to the science-related content of the subject, a very demanding evaluation system or a lack of active participation of students. The main objective of this study is to provide the student with a 360-degree feedback tool and a survey, from which lecturers can extract the degree of satisfaction of students in its application in a standardized way in scientific-technological activities of BSc/MSc in industrial engineering to quantify learning and motivation. The involvement of students in the assessment process was carried out in three phases: peer-assessment (among students), self-assessment (student himself) and hetero-assessment (teaching staff). After that, a survey was designed, which was validated through confirmatory factor analysis. Ninety-nine percent of the students valued this evaluation experience very positively with respect to the objectivity of the criteria used in the methodology and the material provided by the teaching staff. The fact that only 37.5% of the students considered this experience very favorable for their learning and self-training shows the importance of the teaching staff in their learning process and suggests a need to find complementary improvements to this evaluation system in industrial engineering degrees.

1. Introduction

In recent years, a worrisome decrease in the number of students enrolled in engineering in Spain has been observed, as reported by numerous media [1,2,3], reaching a drop of 30% in the number of students enrolled in the last 20 years [1]. On many occasions, this drop in the number of students is attributed to the fact that jobs after higher education are not capable of paying off the difficulty implicit in engineering degrees [3]. This has motivated research studies focused on determining the level of efficiency in engineering in Spain [4], efficiency meaning the combination of terms of profitability (employability, salary, satisfaction and engagement) and effort (average years of study, student loans and average grades). The greatest effort spent in this type of degree is also observed in key indicators such as the high dropout rate, which is usually higher in Engineering and Architecture [5]. In order to provide a quantification of this scenario, the Conference of Spanish Universities Chancellors published that the dropout rate in Engineering and Architecture was 22% in the 2017–2018 academic year [6].
This lack of interest in engineering studies is starting to generate some social concern, with the university dropout rate being higher in Spain than in other neighboring countries [5]. In our current technology-oriented society, having fewer engineers can produce technological dependency from abroad, with higher costs for technological import [1], as well as the exile of Spanish engineers (often trained with public money) due to lack of local technology start-ups and companies.
All the above-mentioned reasons highlight the necessity to find alternatives that make engineering studies more attractive to students but without losing high quality standards in education. In fact, it is not new in the field that student satisfaction is a claim for enrolment, reduced absenteeism and retention of students in higher education institutions [7,8]. Moreover, López-Cózar-Navarro et al. [5] state that in order to reduce student dropout, mentoring and orientation work must be carried out to determine the needs of students from the very beginning (when entering the university) of their career until the end of the degree; as well as involving them in active and innovative learning in the classroom. It is, therefore, reasonable to think that an assessment process in which the evaluated person is also involved and given a voice will be well accepted by the student body since the increase in class participation, interaction with the teaching staff and carrying out alternative activities have a positive impact on the dropout rate decrease [9]. The evaluation method of a subject (or part of it) that is proposed in this work involves students in the said process. In addition to their own assessment, they carry out a peer-assessment, which means that the evaluation process will have a 360-degree view of all the characters participating in the entire teaching-learning process. This is known as “360-degree evaluation feedback”. In Jiménez Galán et al. [10], this methodology is applied to the evaluation by competencies. Figure 1 shows a diagram of the two types of evaluation: the classic evaluation and the 360-degree evaluation, in which all the actors involved in the evaluation process are displayed.
Prior to the development of the evaluation, criteria and levels of achievement (rubrics) must be established that set how the evaluation will be quantified. According to Lévy-Leboyer [11], Bizquerra et al. [12] or Alles [13], the evaluation of skills is based on different sources and it is divided into three well differentiated phases, carried out in the following order:
Peer-assessment (among students). The student assesses the task of another classmate by following the evaluation criteria and established levels of achievement in the rubric. The success of this phase lies in the development of critical thinking to analyze the work of peers [14], also promoting learning during the development of peer assessment, moving away from individualized work and learning [15] and providing an indication of their degree of satisfaction with the activity carried out. This type of strategy increases student motivation: according to Vivanco-Álvarez and Pinto-Vilca [16]; performance evaluation moves from being a control tool to being a useful information tool, thus, motivating the self-learning process.
Self-assessment (student themself). It is based on knowing and valuing their own learning to judge and improve student’s performance. Students assess their own task under the same rubric guidelines in which they performed the peer-assessment. It was observed by previous authors that this process usually has a great impact on student learning [17].
Hetero-assessment (teaching staff). Traditional method in which the teaching staff evaluates the task under the same criteria as the peer- and self-assessment. This equality of criteria is achieved with the publication and use of the corresponding rubric with the evaluation criteria by all the participants in the process [18]. As outlined by Basurto-Mendoza et al. [19], this type of assessment “supports, directs, accompanies and reinforces” other evaluation methods. In addition, a large deviation between the hetero and peer/self-assessment may indicate subjectivity in the evaluation carried out by the students.
The process ends by establishing a weighted average on said evaluation methods. In this work, a specific evaluation methodology and a suitable survey is proposed under the premise of evaluation by competencies and blended teaching and tested in scientific-technological practices based on the 360-degree evaluation method. This method was implemented in different degrees belonging to Bachelor and Master of Science (BSc/MSc) in the School of Industrial Engineering of the University of Malaga, which is a fair representative of engineering in Spain.

2. Literature Review

Student satisfaction was identified in other studies as an important aspect to assess the involvement of students in engineering degrees. Several investigations in the literature were focused on engineering student satisfaction in general, for instance, from social-cognitive factors, as seen in Lent et al. [20]; from the teaching approach (traditional face-to-face versus blended), as seen in Martinez and Campuzano [21]; from the implementation of gamification, as seen in Kim et al. [22]; or from the identification of influential variables by regression analysis, as seen in Gonzalez et al. [23]. Although all these studies provided relevant outcomes for improvement in engineering student satisfaction, the effect of making students participate in a 360-degree evaluation feedback has not been investigated to date in engineering.
In Martinez and Campuzano [21], collaboration with classmates and collaboration was identified as an important factor for engineering student satisfaction. Actually, it was suggested that encouraging cooperative group work and designing activities to enhance student engagement would have a positive impact. Special connection programs were even deployed in some universities with the aim of making students interact with each other, as studied in Olds and Miller [24]. The immersive learning students experienced by creating study groups with frequent Q & A among them was shown to be a powerful learning tool, and this increased their long-term performance in their engineering degrees. This also shows that peer-assessment is also a valuable tool for students to know how well they are carrying out their studies. In this sense, previous studies such as Basurto-Mendoza et al. [19] demonstrated that the use of peer-, self- and teacher-assessment (360-degree feedback) was a very relevant tool to better understand the learning process of students by increasing their criticism, their sense of responsibility and developing their capability to suggest improvements to assessed peers. Similarly, Vivanco-Álvarez and Pinto-Vilca [16] identified in their analysis that specifically peer-review assessment was an important tool to measure the motivation of students in arts and enterprise design degrees by observing an important increase in self-conscience and motivation when implementing this tool in class. This is an important motivation to the present work in order to assess its impact in engineering degrees, together with teacher and self-evaluation. For the student to be aware of his lacks and to transmit them to teachers links very well with the ideas proposed in López-Cózar-Navarro et al. [5], who point out that determining the needs of students as early as possible could help the teaching staff to orientate their mentoring work to satisfy them. As suggested in their work, this would have an important contribution to decrease student dropout.
Although these aspects may evoke that the role of the teaching staff can become superfluous at a certain point, other studies such as García et al. [9] also outlined that student dedication and interaction with teaching staff is influential in decreasing student drop-out. Thus, teaching staff should control appropriately not only how the assessment is being developed but also how their learning is evolving. García et al. [9] also outlined this by reflecting that the way teachers transmit their knowledge to students makes an important impact in motivation to persevere in their studies. One of the main purposes of teaching staff is to maintain student motivation during lectures, so the implementation of innovative activities in classroom is also important [5,15], and the 360-degree feedback evaluation is a good candidate for this. As outlined in these studies, peer-assessment and learning also improve student understanding of the role of the evaluator and how items are assessed, which can be helpful in engineering subjects where the teacher may be considered too demanding by students. For this outcome, the rubrics employed in the evaluation should be a clear, transverse, open and dynamic tool so that they could be also a boost for self-learning, as outlined in several resources [17,25,26].

3. Methods

Motivation and Objectives

The implementation of the here proposed 360-degree evaluation methodology has several objectives from a didactic point of view and from a research point of view. The didactic pursued objectives are the following:
  • To increase the active participation of students in their own assessment, thus, seeking to motivate the excessively monotonous and individualistic study in engineering, through an innovative action in the classroom [5,15]. To increase student understanding of the role of the evaluator and how items are assessed in engineering subjects.
  • To motivate students in their learning process by providing them with tools that allow them to compare their performance with their classmates, thus, making of this evaluation a useful information tool and not merely a control tool [16].
  • To improve the student learning process in a peer-assessment environment, as reported in Martínez-Figueira et al. [17].
  • To transform the evaluation of rubrics into a “transverse, useful, open, dynamic and flexible instrument”, as well as “agile and coherent”, to improve learning [17,25,26].
On the other hand, from a more research and innovative point of view, the objectives pursued are:
o
To know the degree of satisfaction of students on how the evaluation is being carried out and to observe if there are discrepancies between the evaluation of the hetero-, peer- and self-assessment of students. To obtain feedback concerning the impartial and anonymous assessment experience by the students.
o
To validate the satisfaction survey used in the 360-degree feedback evaluation through a formal statistical process (confirmatory factor analysis) to assess its potential standardized use in other subjects in industrial engineering degrees in Spain/outside Spain.
Both objectives end up complementing each other in order to find if: (i) this methodology makes it possible to ascertain the degree of student satisfaction, (ii) it increases motivation and/or their learning performance, and (iii) this can be used as a standard tool in more subjects as an element to increase the degree of general satisfaction in the student body in engineering careers.

4. Participants

The subjects in which this methodology was tested were taught in the academic years 19/20 and 20/21. All of them belong to either a bachelor’s or master’s degree program in industrial engineering. The subject and degree in which it was taught, as well as the number of students enrolled in each course, are shown in Table 1.
The participants build up a sample of a total of 153 rows. The distribution of the sample is shown in Table 2. Two variables were established: sex (male/female) and degree (bachelor’s and master’s), observing (unfortunately) a realistic distribution of cases in terms of approximately 30% of women in class compared to 70% of men (similar to the statistics reported in the Ministerio de Universidades [27] and a ratio of 1/10 of master’s students with respect to bachelor’s students (similar to the statistics reported by the Ministerio de Universidades [27], where in Engineering and Architecture studies during the 2019/2020 academic year, only 208,188 students enrolled in the bachelor’s (86.2%) and 33,432 in the master’s (13.8%) degrees.

4.1. Design of the Survey

The preparation of the questionnaire aims to evaluate different aspects related to adaptation [28], motivation [29], student satisfaction [30] and gaining of skills/learning [31]. Several potential groups of items (groups of questions) were proposed, which are similar to the ones established by Santos-Pastor et al. [32]. Since the final objective of the present work is to test the adequacy of a survey to verify the degree of satisfaction of students with the 360-degree feedback methodology in subjects from industrial engineering degrees, it is, therefore, important to create different groups of interest for this type of survey.
One of the main objectives in a student satisfaction survey about a methodology is to know how useful the method was and the personal satisfaction of the student. These personal evaluation questions are present in a large number of questionnaires, which collect reliable student satisfaction feedback [32,33]. For this reason, it was decided to group the items related to the quality of the teaching method and the benefits for the student in a group of personal perception of the individual’s training (1-Personal evaluation). On the other hand, since the 360-degree method is an evaluation methodology, it is important to know the opinion of students with the criteria adopted in the evaluation methodology. These questions are key, because if the criteria are not fair for students, the evaluation is not interesting for the person evaluated, and therefore, the methodology is not effective to increase student satisfaction in engineering studies. In fact, as reported in Casero-Martínez [33], fairness in the assessment is a relevant fact for students, as well as the possibility of participating in the creation of the rubric guidelines (this participation is key particularly if they do not consider the criteria acceptable). For this reason, asking about the evaluation criteria is a recurring question in method evaluation questionnaires [33,34]. In our survey design, related questions are grouped into a specific block (2-Criteria).
The peer-assessment process has an important characteristic, which is that the friendship/non-friendship among students can bias the results of the assessment. This aspect was already pointed out, among others, by López-Pastor [35]. This scenario can be also possibly noticed in the relationship of certain students with the teaching staff, which eventually could somehow be reflected in the hetero-assessment. All these questions related to objectivity of the method are grouped in the dimension 3-Objectivity of evaluation.
Finally, it is also important to know whether or not students have raised their awareness on how the 360-degree assessment is carried out according to a rubric. This is a relevant aspect, since this action allows the student to better understand the role of an evaluator and can influence the learning–teaching process, the development of critical attitudes and the assumption of responsibilities, as highlighted by other authors [19]. It must also be highlighted that a 360-degree evaluation can be “surprising” for students accustomed to a traditional evaluation, thus, becoming a very rewarding and exciting experience [35]. These learning aspects acquired by the student are condensed in a set of questions in a dimension called 4-Learning from the experience. All the items mentioned in this section are shown in Table 3.

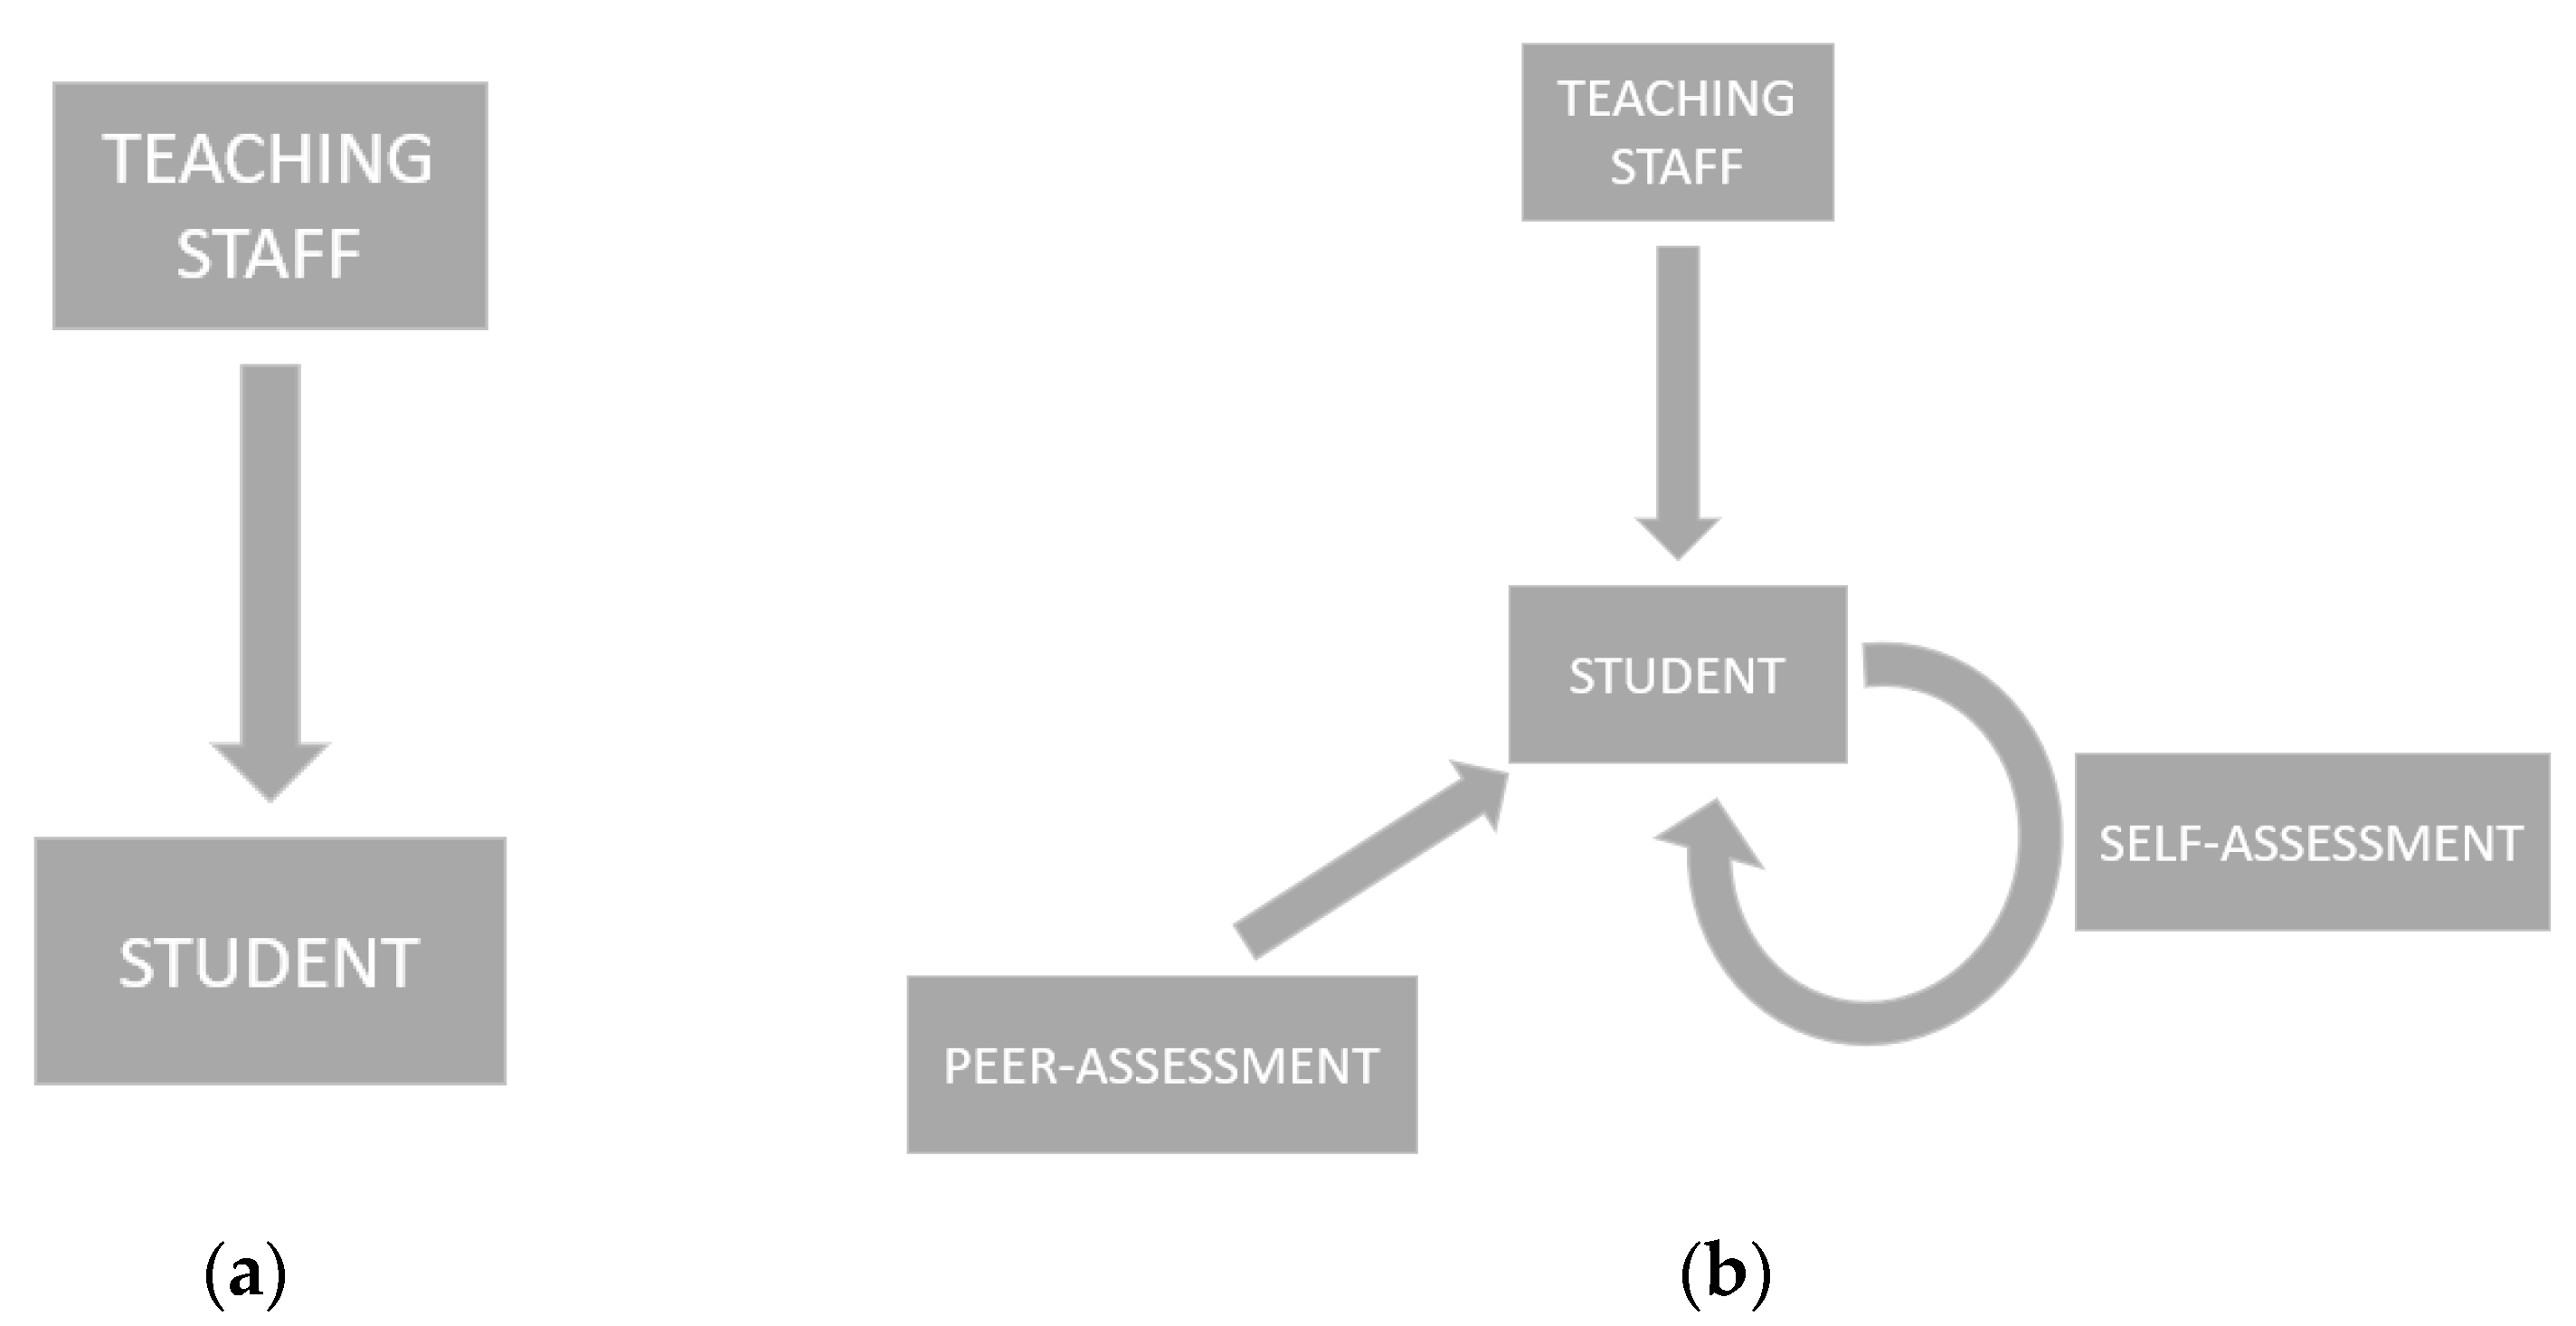
4.2. Description of the 360-Degree Evaluation Method

The 360-degree evaluation was applied in three different teaching modalities typical in the subjects of the industrial branch:
Report document. Each student had to evaluate anonymously (peer-assessment or single-blinded peer-assessment) the report from another classmate. After the peer-assessment, the self-assessment was carried out. Finally, all of them were reviewed by the teaching staff. The estimated weighting to obtain the final grade was: 50% from the hetero-assessment, 30% from the peer-assessment and 20% from the self-assessment. If the dispersion between the teaching staff grade and the self-assessment or peer-assessment grade is very high (greater than 50%), the teaching staff grade prevails as the final grade. The subjects involved in this methodology were the subjects: #1, #2, #4 and #5 (see Table 1).
Gamification. It consisted of forming teams that elaborated on a set of questions to be asked to another team. Once the game was over, the teams evaluated each other and themselves. The subject involved in this methodology was #7 (see Table 1).
Oral presentation. Students had to complete a practical study over several sessions in order to carry out a small project, together with a descriptive report. This study was later defended through an oral presentation of the project with the possibility of a demo. The work was evaluated, both by the teaching staff and by the student, according to several dimensions: design and implementation (70%), presentation (15%) and discussion (15%). The subjects involved in this methodology were #3 and #6 (see Table 1).
The reason behind establishing these three different modalities is that each subject has a different nature. For instance, report-based subjects are very classic engineering subjects (fluid mechanics, physics, project engineering), which are more fairly assessed by means of standard project report documentation submissions. The oral presentation modality was more suitable for telerobotics/mechatronic systems, because these subjects are traditionally taught in the MSc degree as an approach to deliver mechatronic solutions to client queries. Thus, the best way to evaluate the development of the student would be by generating virtual discussions about designs with customers and receiving their feedback. Finally, there is only one subject evaluated in a gamification environment, which is related to industrial processes. This subject has very extensive content, from foundry to welding, as well as additive manufacturing lecture notes. To study the subject in a relatively short time is very complicated and demanding for the student. The teaching staff found out that a gamification environment is ideal for their learning process. Previous authors outlined the benefits of this approach in engineering subjects, which include improvements in motivation, learning and engagement [22].
Despite the different modalities, the feedback from each subject can be merged without major issues. This can be implemented because each subject has the most suitable evaluation modality, thus, the marking becomes homogeneous. In other words, if the same modality was applied to all subjects, students would obtain a higher mark and satisfaction in subjects in line with the selected modality and vice versa. This would make the results from the survey useless. The only remarkable difference among modalities is the existence of anonymous and non-anonymous peer-review. Thus, in order to make a fair analysis in the present work, an analysis of the survey was also developed by grouping the responses of students by attendance and anonymity, as will be shown in the following section.

5. Results

The sample from the application of the 360-degree evaluation methodology was made up of two major groups: attendance and anonymity in the evaluation and engineering degree (BSc and MSc). First, a confirmatory factor analysis (CFA) was carried out to evaluate the structure of the theoretical dimensions proposed and to assess the validity of the survey and scale proposed for the 360-degree evaluation. Subsequently, the distribution of responses by group or dimension was obtained, as well as by considering the characteristics of the sample.

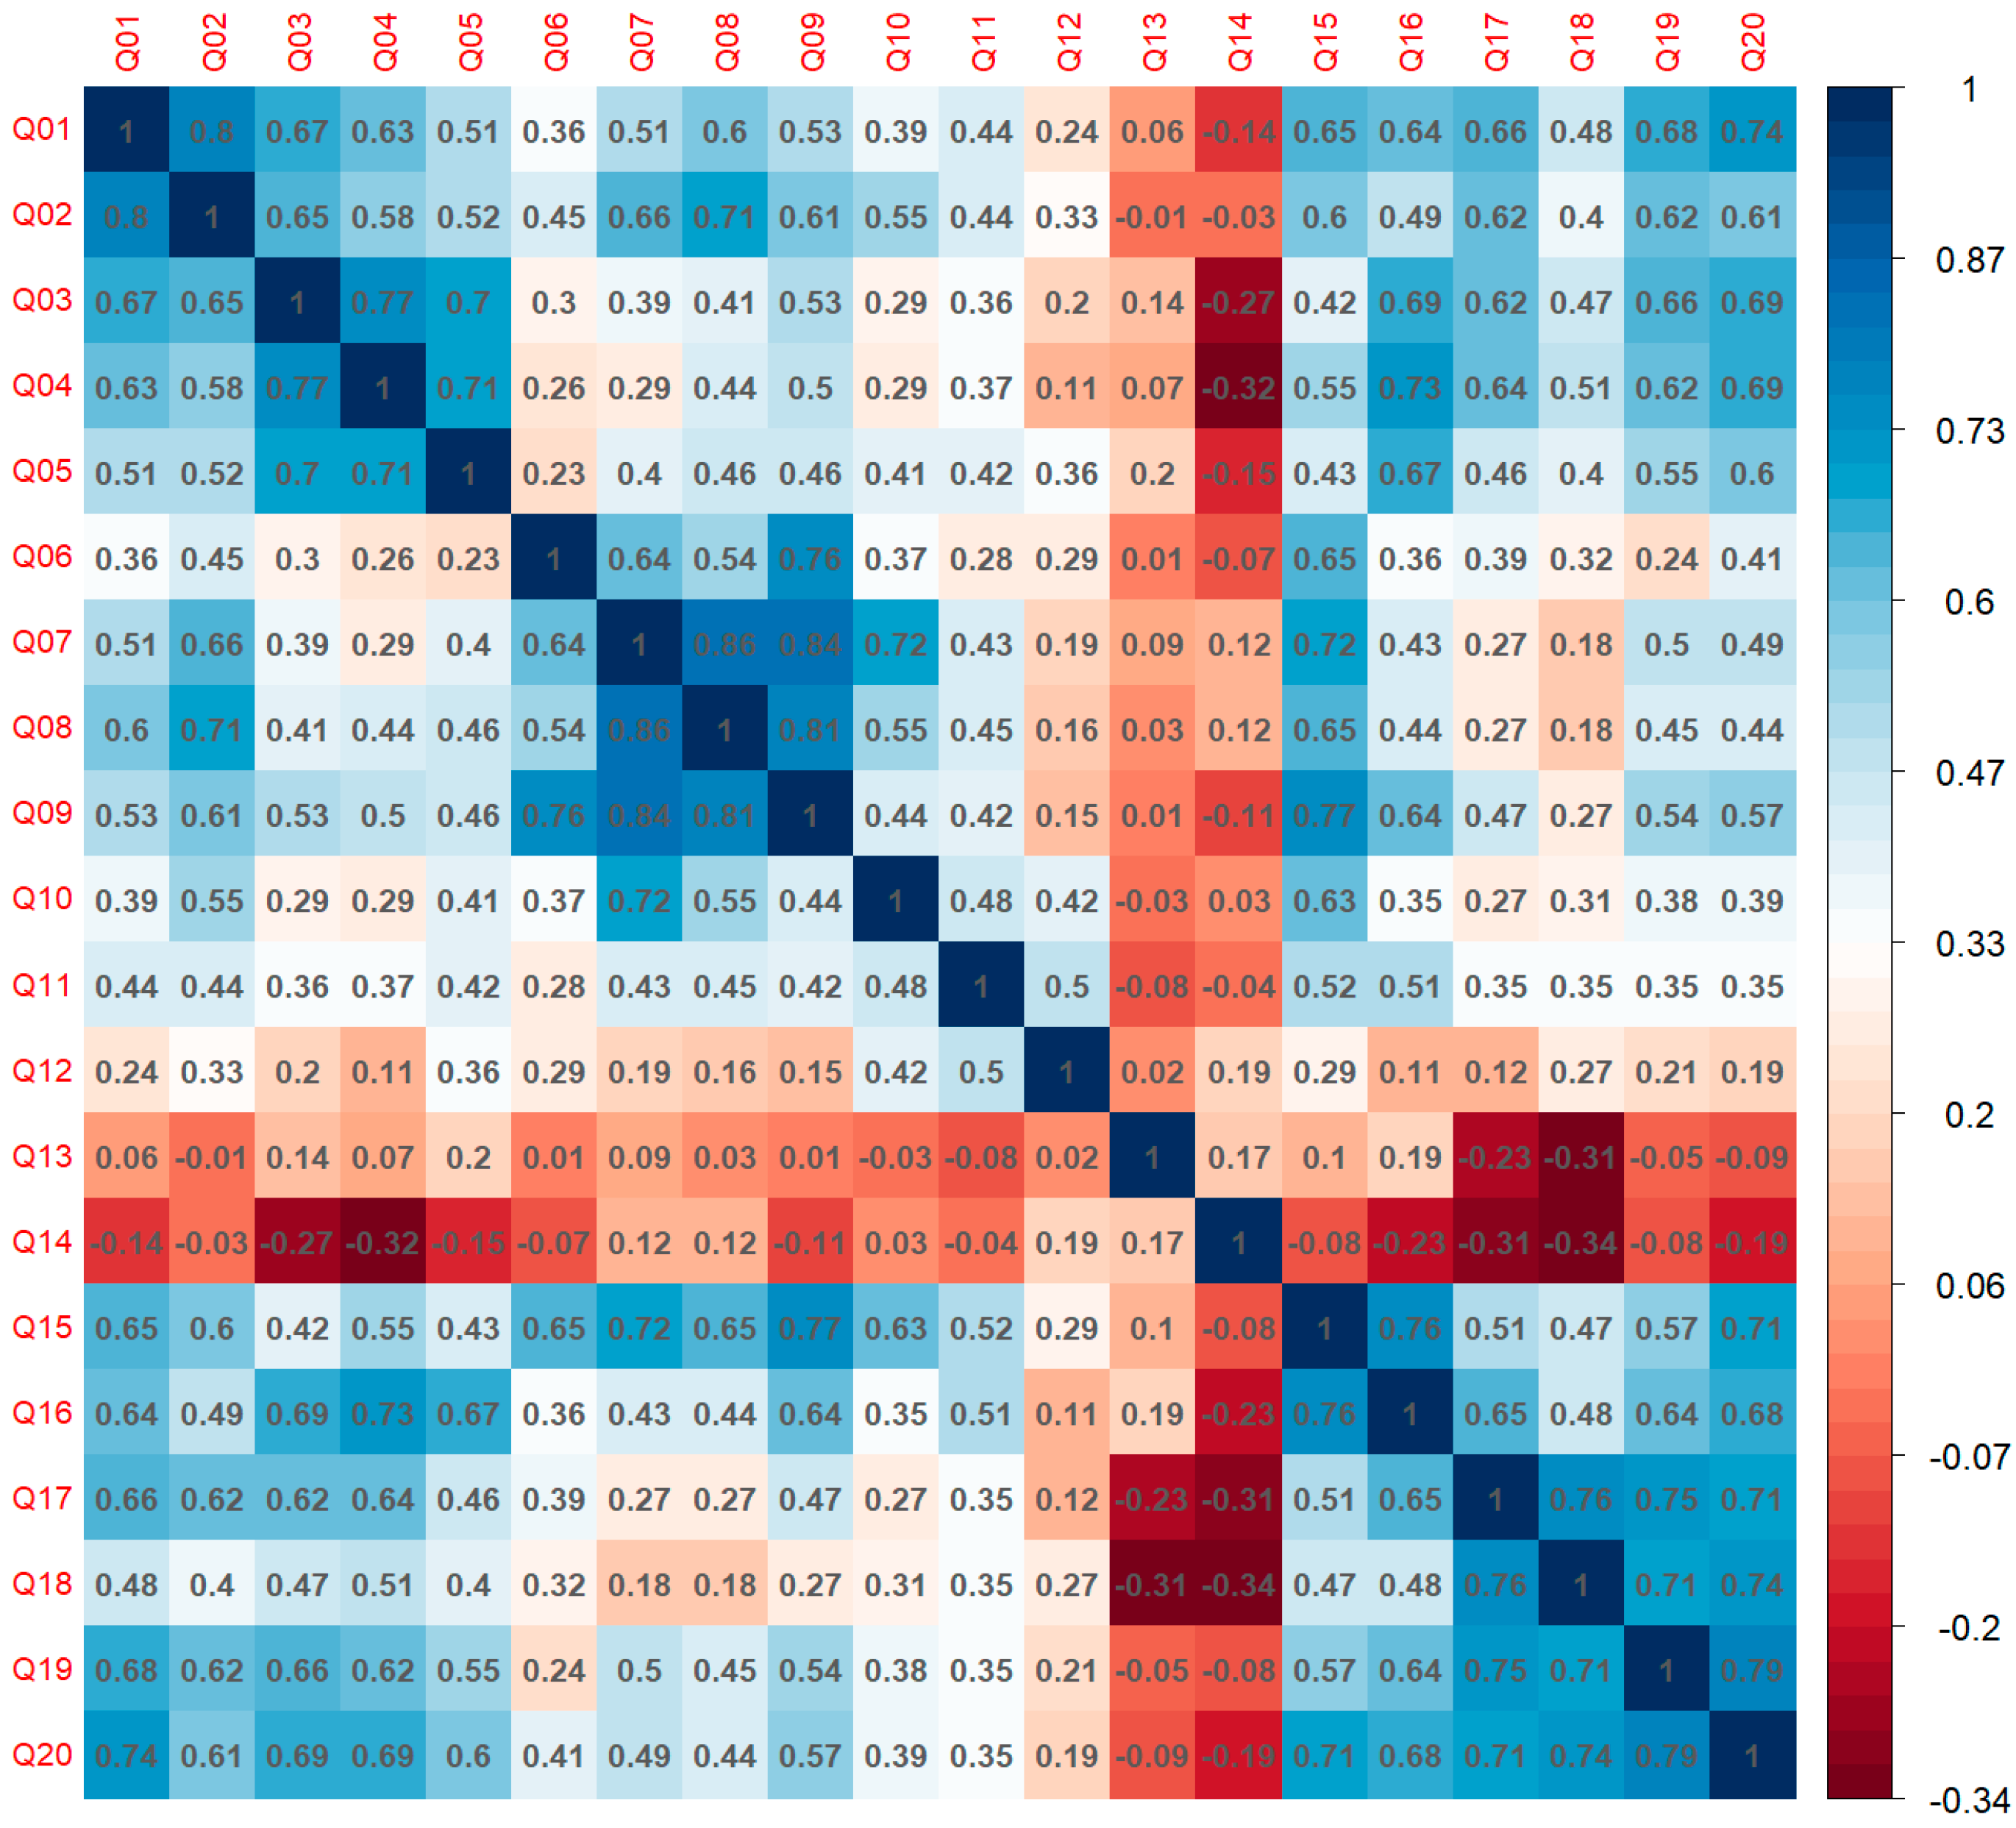
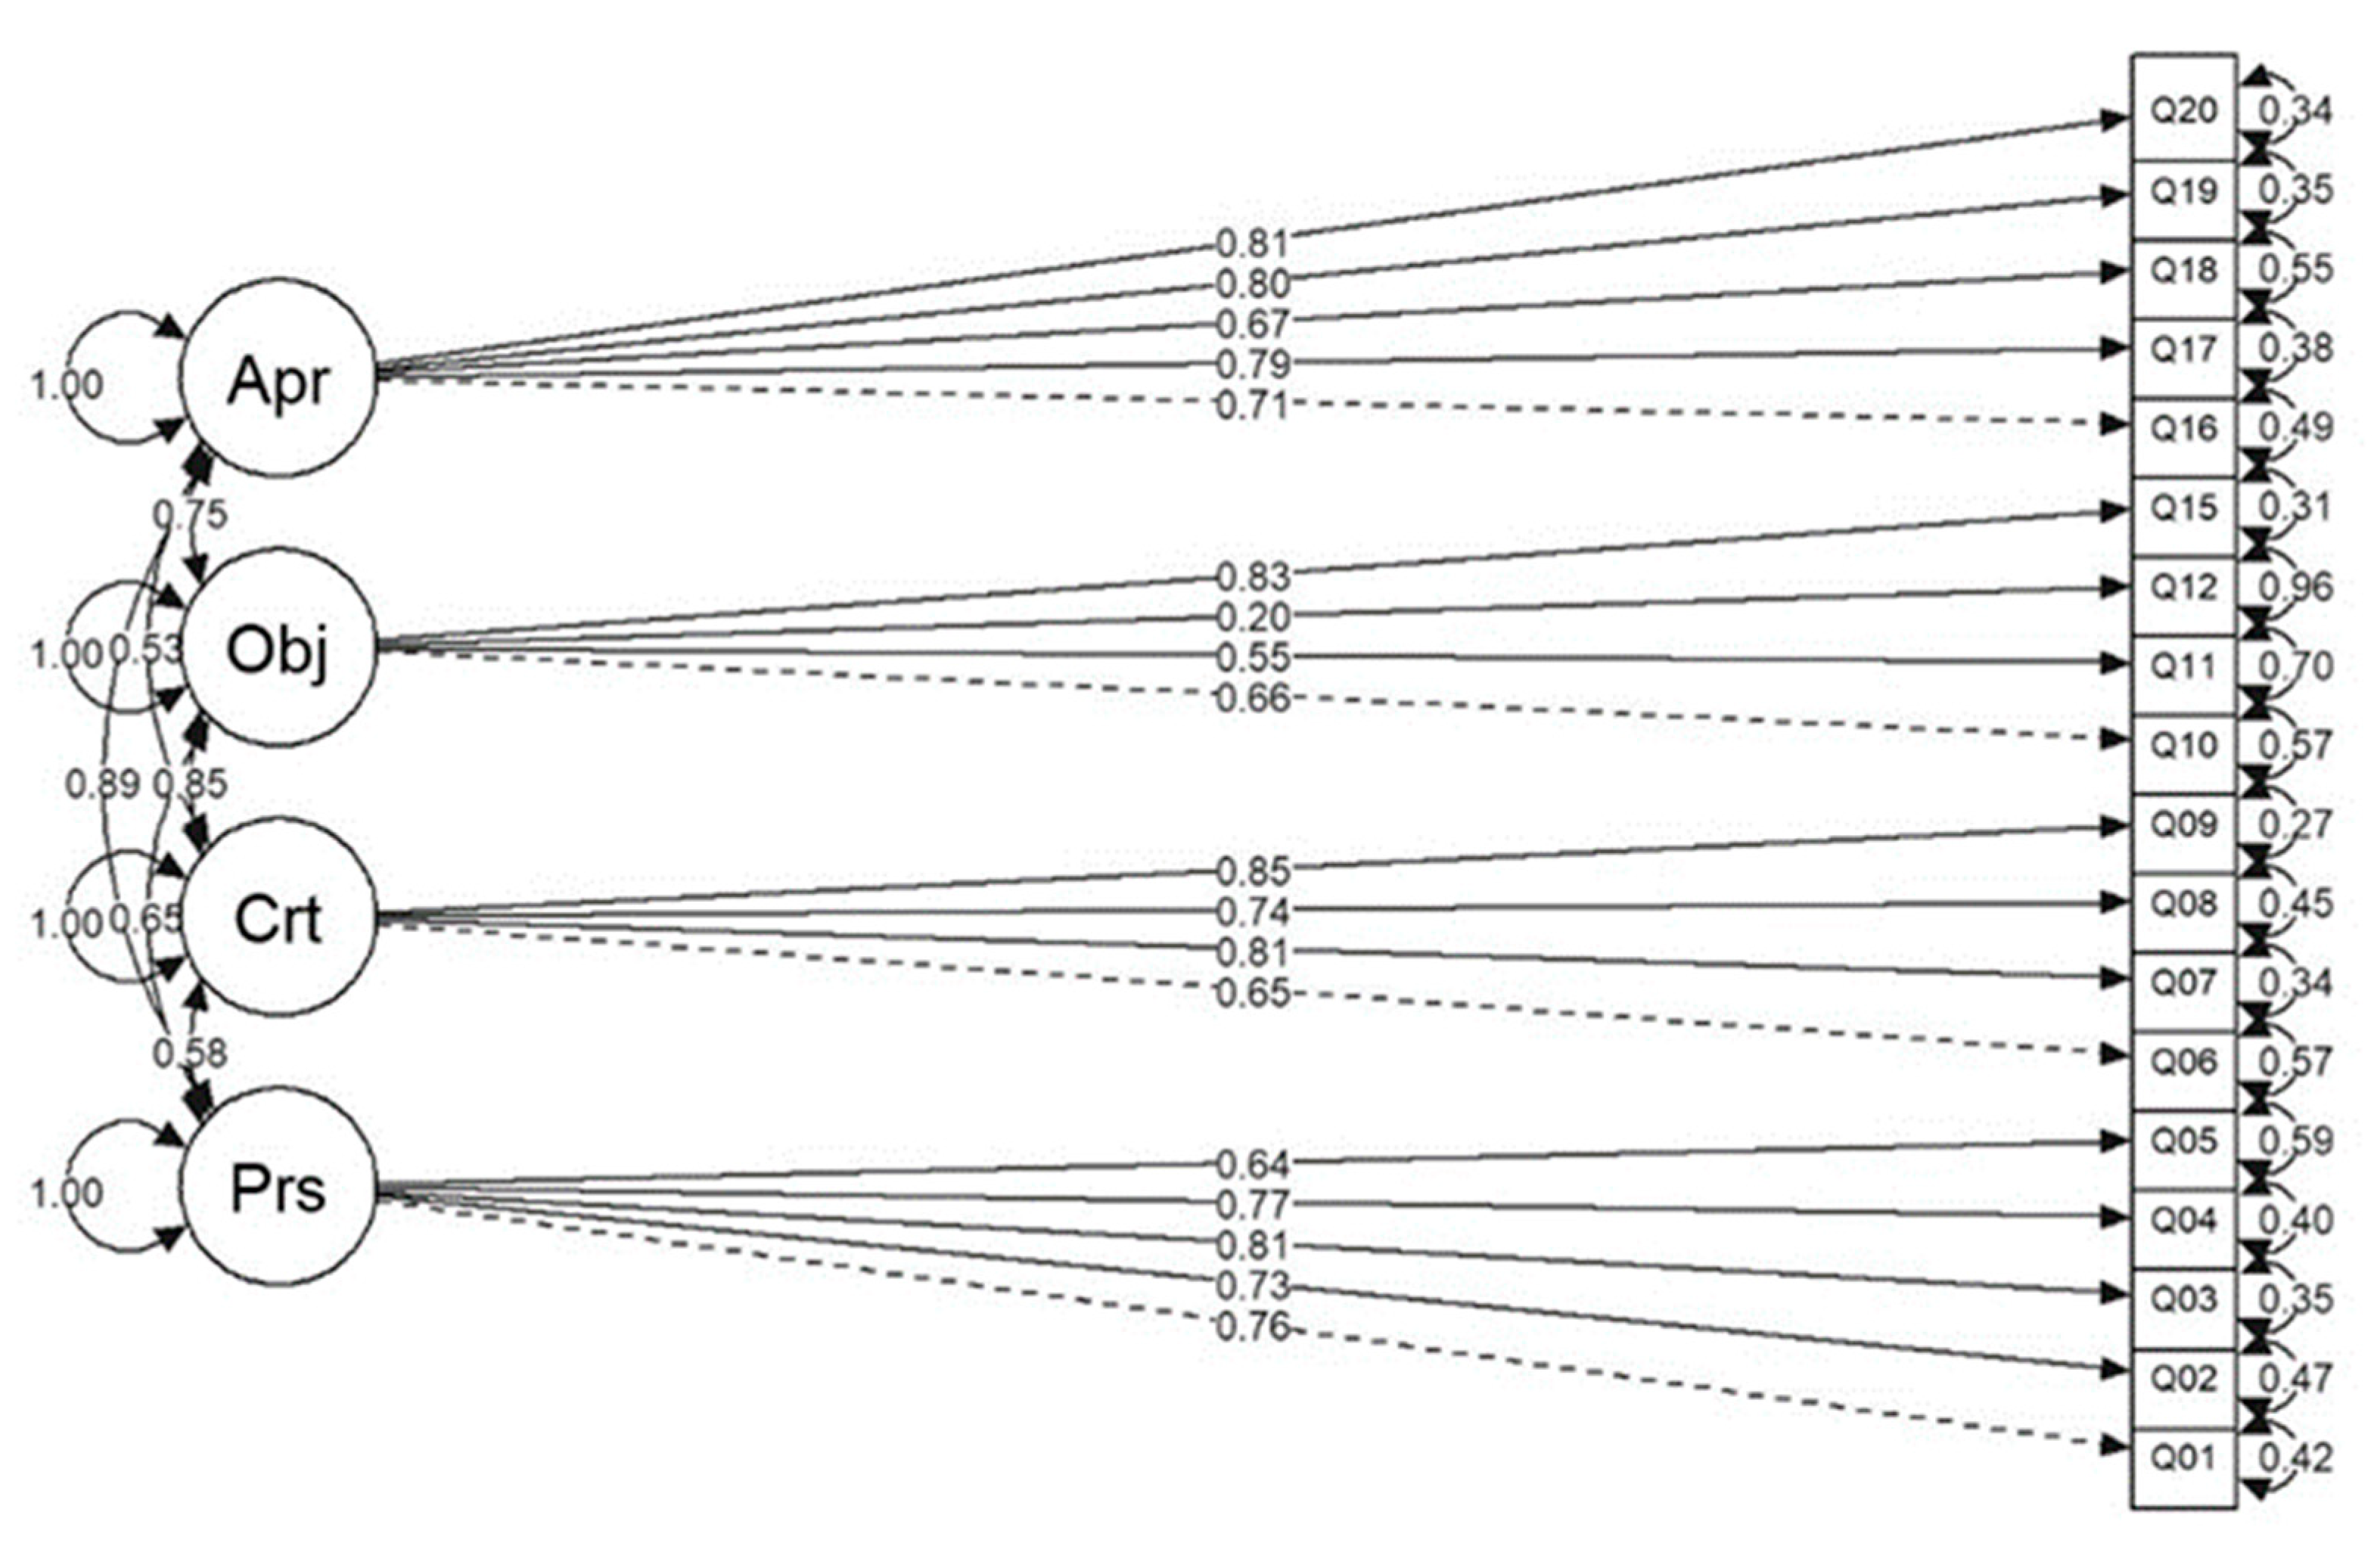
5.1. Confirmatory Factor Analysis

A CFA was carried out to analyze whether the structure of dimensions or groups for each block of questions can be considered adequate. For the quantification of the responses, the Likert scale was used [36,37]. One of the great benefits of using a Likert scale is that responses become an ordinal numerical value so that satisfaction can be quantified mathematically with statistical methods. Likert scales are very common in surveys, and in order to be consistent, they have to include at least five response categories [38]. The scale is easy to understand, so students have no problem interpreting how to respond to the questionnaire. For each question of our survey, students answered with their degree of agreement (5) or disagreement (1) with the statement. The format of a typical five-level Likert scale was established as: 1 = Totally disagree, 2 = Disagree, 3 = Mid, 4 = Agree and 5 = Totally agree. As defined in Table 3, the structure of the survey consists of four clearly differentiated groups. Question Q11 (Has the peer-assessment that I have received from my classmates been objective and fair?) has the option to be answered with “missing information”, which is a response not included in the Likert scale. For this reason, a response with 0 (do not know/not available) was given for such a lack of information. From a statistical point of view, the mean of the variable is input to these answers so that the distribution of the variable is not perturbed.
Prior to the CFA, the correlation matrix was calculated. As the survey is made of ordinal categorical variables from 1 to 5, polychoric correlations are the most correct to measure correlation [39]. Figure 2 shows the correlation matrix, where it can be seen that all the variables (items or questions) have a positive correlation, except questions Q13 and Q14, shown as dark in the figure due to negative correlations. These two questions do not have the same consistency as the rest of the items, thus, they should be removed from the set of questions. This is because they are prone to create discrepancies in the survey. This can be consequence of a conflict of interest of students in deciding whether or not friendship with the colleague influences the evaluation.
On the other hand, Figure 3 shows the model proposed in the CFA. The four dimensions (also called latent variables) are represented by circles: Personal evaluation (Prs), Criteria (Crt), Objectivity of evaluation (Obj) and Learning from the experience (Apr). The squares stand for each question (item or observed variable) in the survey. The arrows that join latent and observed variables are the weights of the multivariate model (generally called “estimates” in statistical software). The bidirectional arrows on the circular elements (dimensions) indicate the covariances among the said dimensions. The bidirectional arrows on the square elements (observed variables) indicate the variances of the residuals.
The goodness of fit of the model was analyzed by using the significant chi-square ( χ 2 = 288.554 ,     d f = 129 ,     p v a l = 0.0 ), with d f the degrees of freedom and p v a l the p-value [40]. Regarding the root mean squared error of approximation (RMSEA) and the standardized squared error of the residuals (SRMR) as absolute indicators, a RMSEA = 0.1 was obtained. This indicates a good fit between the model and the data [41], whereas the SRMR presents a value of 0.08, which shows a very reasonable adjustment [42]. As relative indicators, the comparative fit index (CFI) and the Tucker–Lewis index (TLI) were determined. The results were CFI = 0.83 and TLI = 0.8 , respectively, showing a very acceptable goodness of fit between the model and the data. From the analysis of fit, it was concluded that the proposed model is very good for the scale expressed in the survey of the 360-degree evaluation method.

5.2. Internal Consistency of the Survey

To analyze the internal consistency of the survey, the Cronbach’s alpha value was used ( α ). This parameter is a measure of the reliability of an instrument (survey) in which the answers are presented with several option values, in this case, a Likert-type scale [43]. An α = 0.919 was obtained, which reveals a very high degree of reliability [44,45]. Likewise, the Guttman’s λ 6 was calculated by obtaining a λ 6 = 0.952 . The λ 6 is another consistency measure that is quite similar to α but less sensitive to the number of elements in the scale. Both are actually considered very good when they are greater than 0.9 . Table 4 shows the results of the consistency analysis on all items, in addition to the item-scale correlation, r . From the results of the table, it is observed that none of the items produces a relevant impact on the consistency of the survey if removed. The only item that could be questionable is Q12 (this question is related to the assessment of whether students have carried out a fair and objective peer-assessment of their classmates), which presents a fairly low correlation. It was decided to keep it as is because it was considered of informational relevance in the survey.

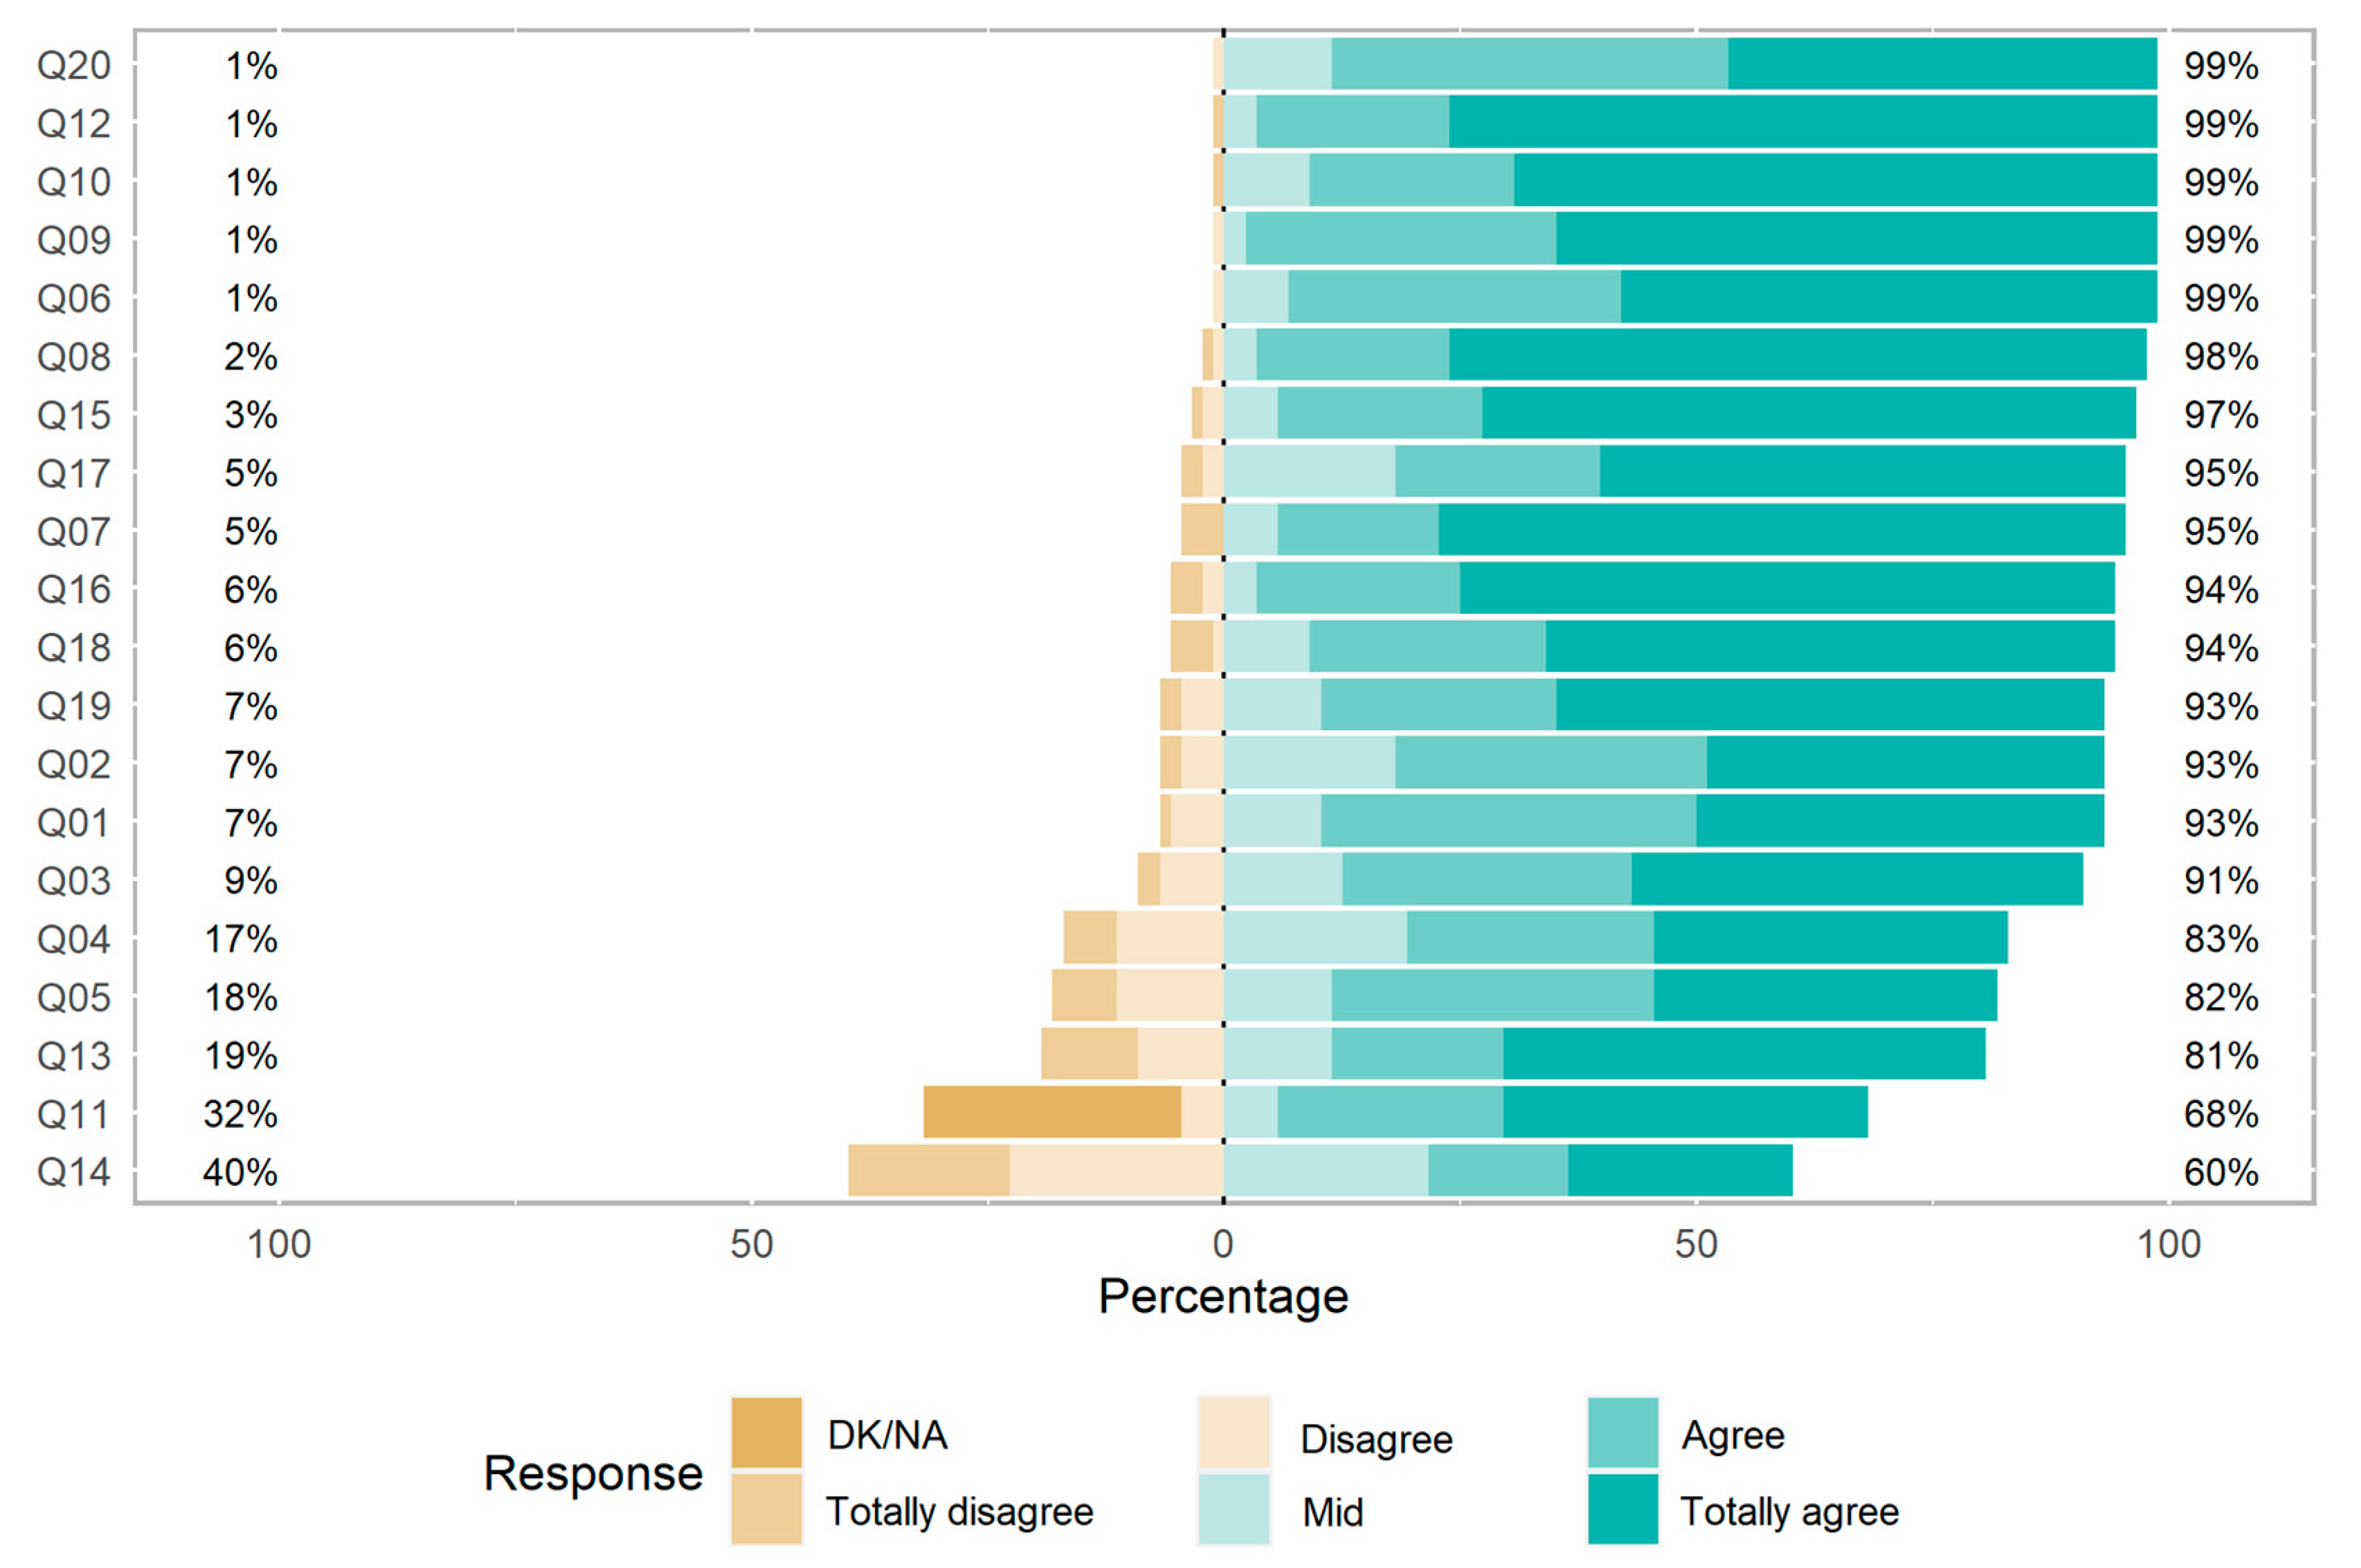
5.3. Overall Analysis of the Sample

First, the distribution of the responses according to the Likert scale was analyzed. Figure 4 shows the distribution of the responses ordered in scale decreasing order. As stated before, question Q11 is the only one that has DK/NA, just as it was collected in the original survey (recalling that, in the CFA, the mean of the distribution was imputed to these DK/NA values, so that the statistical distribution is not perturbed).
From the analysis of the responses to the questionnaire, in general, a high satisfaction of students with the 360-degree evaluation method was observed. The responses to the questions of the dimension personal evaluation: Q01 (…understand the contents…); Q02 (…detect misconceptions…); Q03 (…protagonist of my own learning…) showed a very high agreement, greater than 90% of positive responses. Within this group, questions Q04 (…improve my study system…) and Q05 (…“extra” motivation…) revealed a more moderate satisfaction in the response. The questions of the criteria group: Q06 (…documentation… from the teaching staff for… the evaluation…); Q08(…point marks…) and Q09 (…documentation provided by the teaching staff…) also presented a very high level of agreement. An overwhelming majority of students agreed with the 360-degree evaluation criteria for their subjects. The objectivity of the evaluation group is the one that presented the lowest satisfaction. A notable percentage of students stated that knowing the identity of the evaluated peer influenced them in the peer-assessment. This fact agrees with Gong [46], who suggests that “in peer review, it is inevitable to be influenced by human feelings” and sees confidentiality as a necessity. The learning from the experience group presented a high degree of satisfaction, comparable to that of the first group. It is worth highlighting the agreement in questions Q18 (…interesting…other subjects…) and Q19 (…would you recommend the subject…). It can be concluded that students are willing to use this method again, and they valued positively this teaching action compared to the classic assessment methodologies, as other authors have pointed out already [47]. The fact that only 37.5% of the students considered this experience very favorable for their study system (Q04) highlights the importance of teaching staff in transmitting learning in class, whose close relationship with the student is also an influential factor to the decrease in the dropout rate [9]. Considering the responses to questions Q01, Q02, Q03 and Q04, all of them rated as “totally agree” by fewer than 50% of the students and directly related to the teaching–learning process, it is worth reflecting that there is a need to find innovative elements in the classroom to complement this approach. This would improve the study capacity of students and may be a necessary future work. An example of improvement could be to create virtual working groups in order to train them on the subject under evaluation, which would be tutored by the teaching staff, and can be later evaluated via 360-degree evaluation. Thus, students would benefit more from this methodology by maintaining close contact with the teaching staff and enhancing self-study, self-training and motivation [9]. In general, from the analysis of responses from the Likert scale, it is found that the highest rated questions by the respondents were: Q09 from the criteria group; Q12 and Q10 of the objectivity of evaluation group. The highest rated item was Q20 (…rate of this experience…). This result allowed us to conclude that there is a high degree of satisfaction by the students, since they valued the most relevant aspects of the 360-degree evaluation highly.

5.4. Analysis of the Sample by Groups

The sample was also analyzed by groups: filtered by attendance and anonymity in the evaluation, as well as according to whether the degree is a bachelor’s or master’s degree. This was implemented in order to have a full picture of the opinion classified by important groupings.

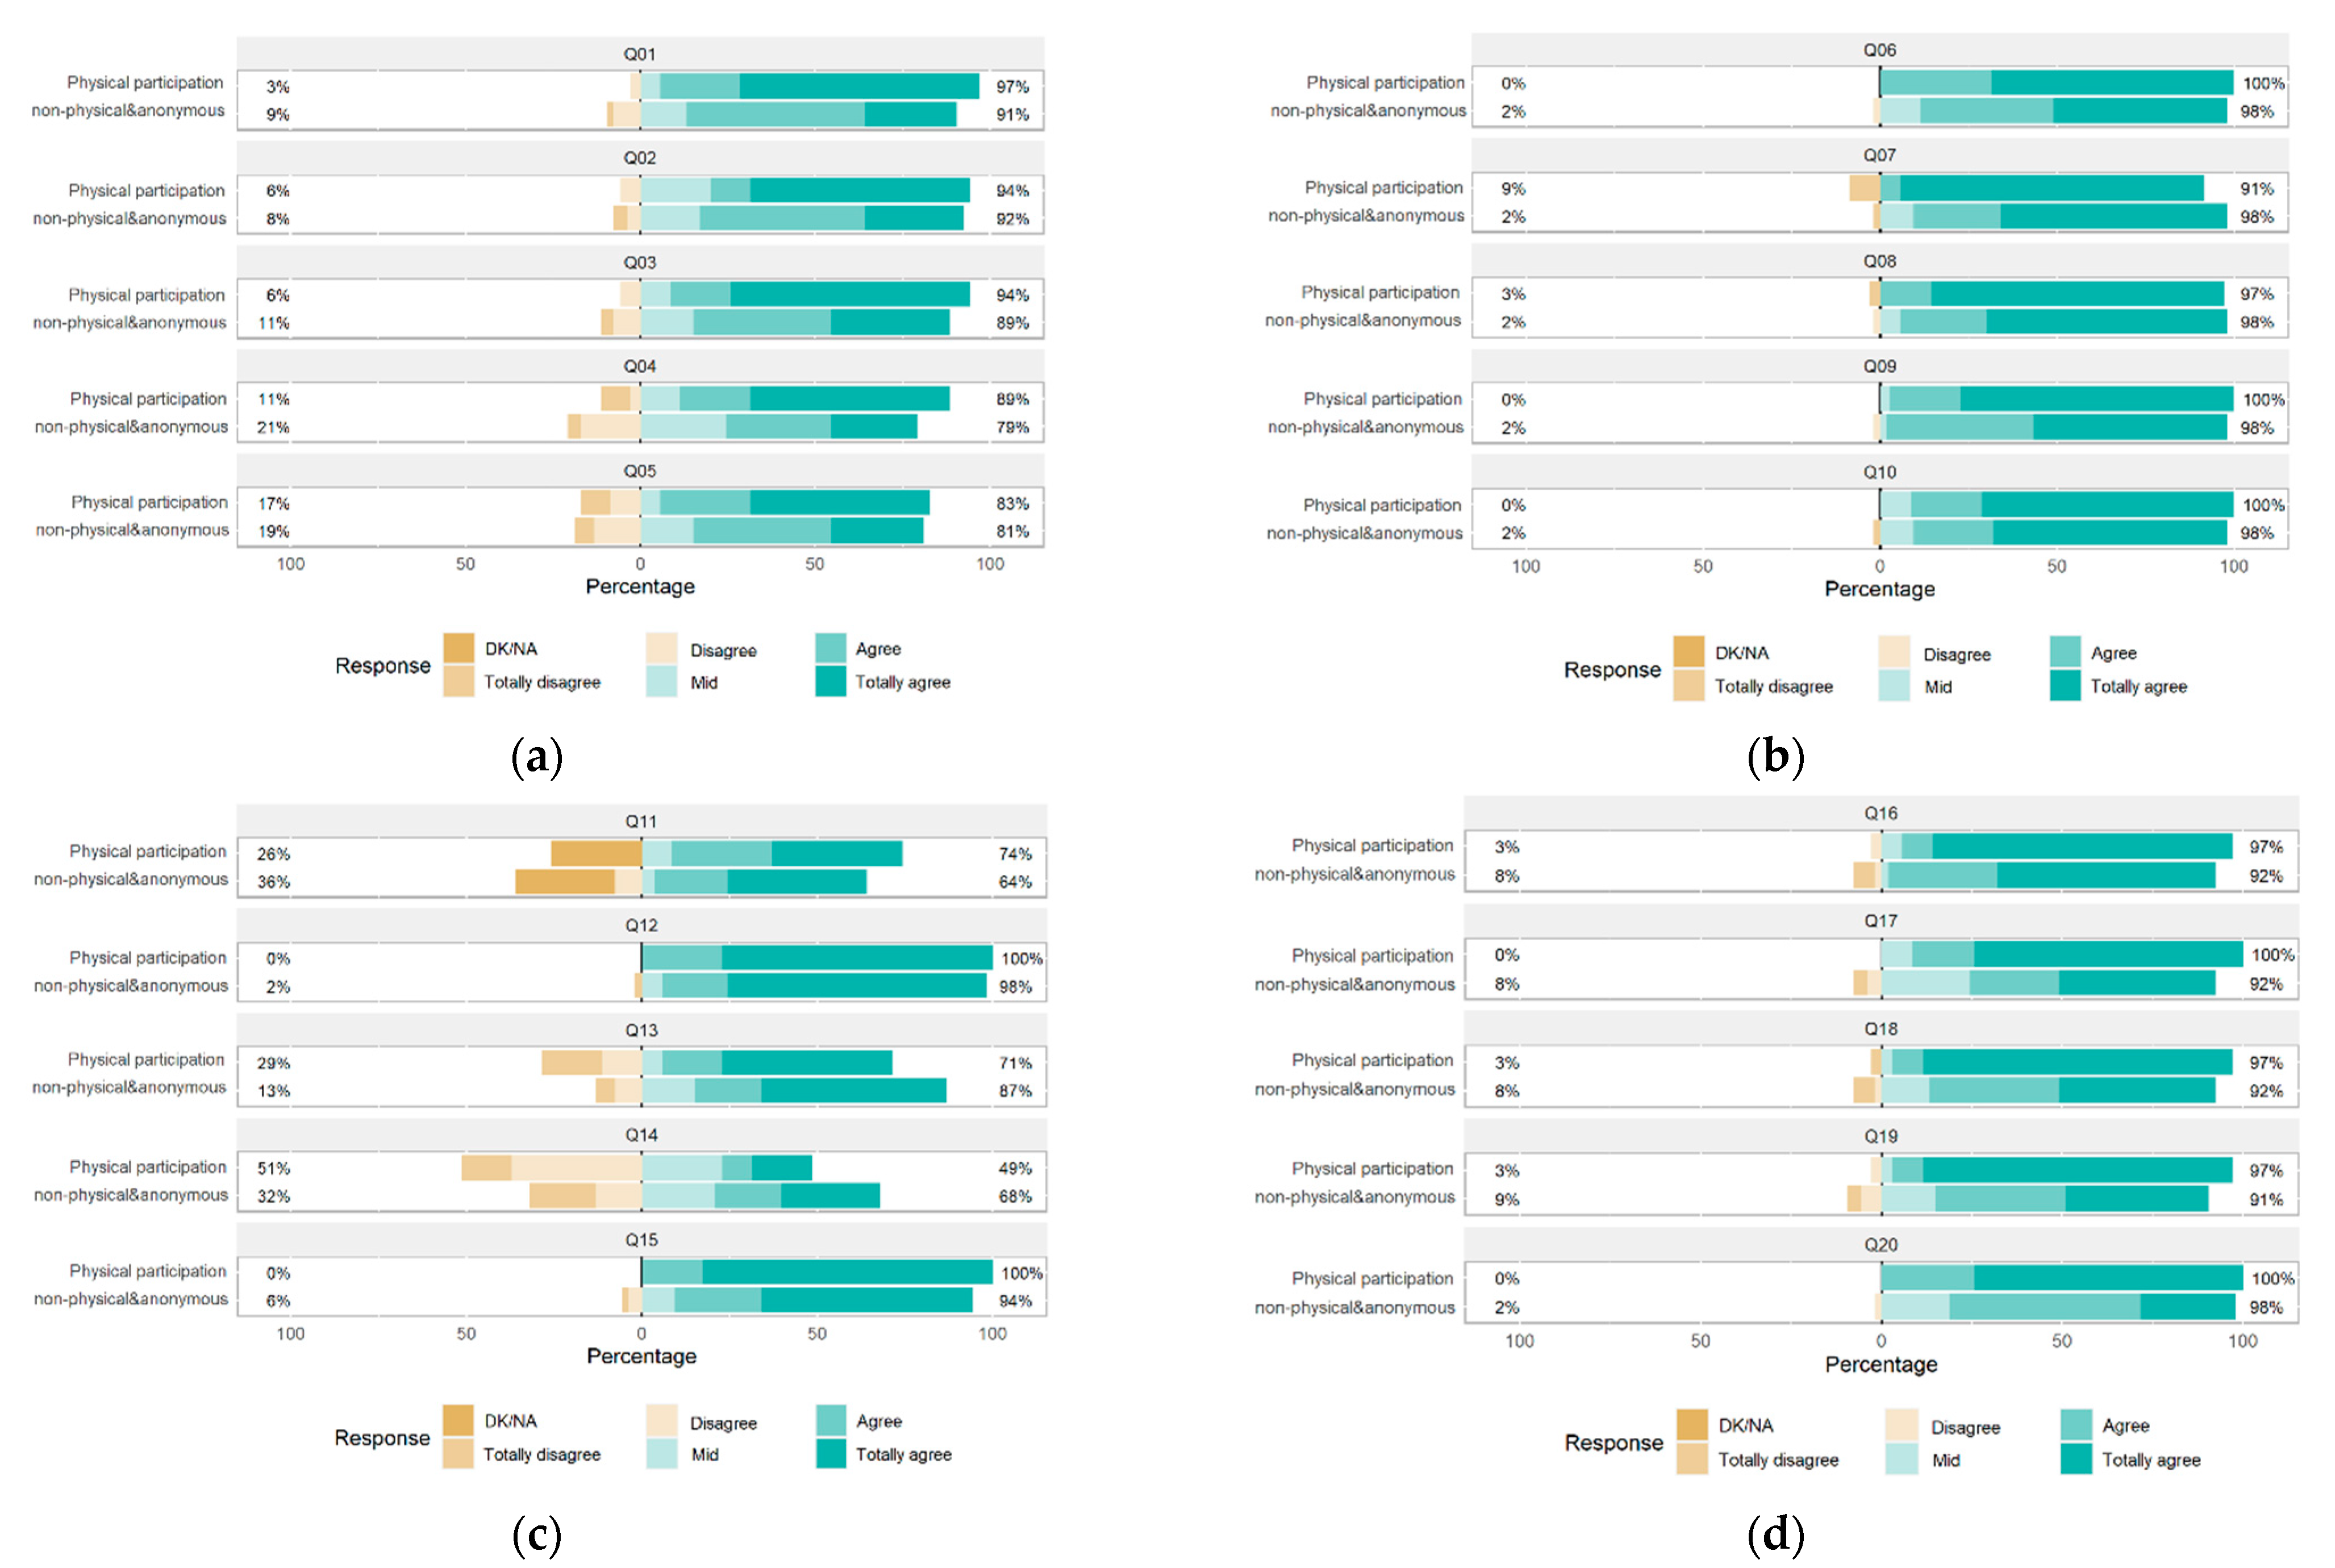
5.5. Analysis Due to Attendance and Anonymity

The term attendance and anonymity refers to analyzing the results of the survey based on whether the assessment in the subject was carried out in person with participation in class (horizontal evaluation among students, which is not anonymous) or without attendance in person and with anonymous evaluation (mainly, by means of a traditional report submission). Subjects #3, #6, and #7 belong to the first physical participation evaluation group; while subjects #1, #2, #4 and #5 belong to the second non-physical and anonymous group. The results from the survey for these attendance and anonymity items are shown in Figure 5.
It is not surprising that this teaching activity also has disadvantages. Gong (2016) [46] points out that confidentiality must be paramount and proposes that the peer review method should lead to a process of mutual learning and common improvement. Gong [46] even insists on the need to prepare students to assess other students. From Figure 5, it stands out that the questions with the greatest discrepancy in the answers are those referring to the anonymity of the evaluation, questions Q13 and Q14. In question Q13, which refers to whether anonymity is an important factor in peer-assessment among students, this factor was given greater importance. It is, actually, observed that students involved in the physical participative environment give less importance to anonymity, whereas those students involved in a non-physical and anonymous assessment environment give more importance to this aspect. These results highlight that the students feel satisfied with the way of evaluating their subject, since those exposed to anonymous evaluation give importance to anonymity and vice versa.

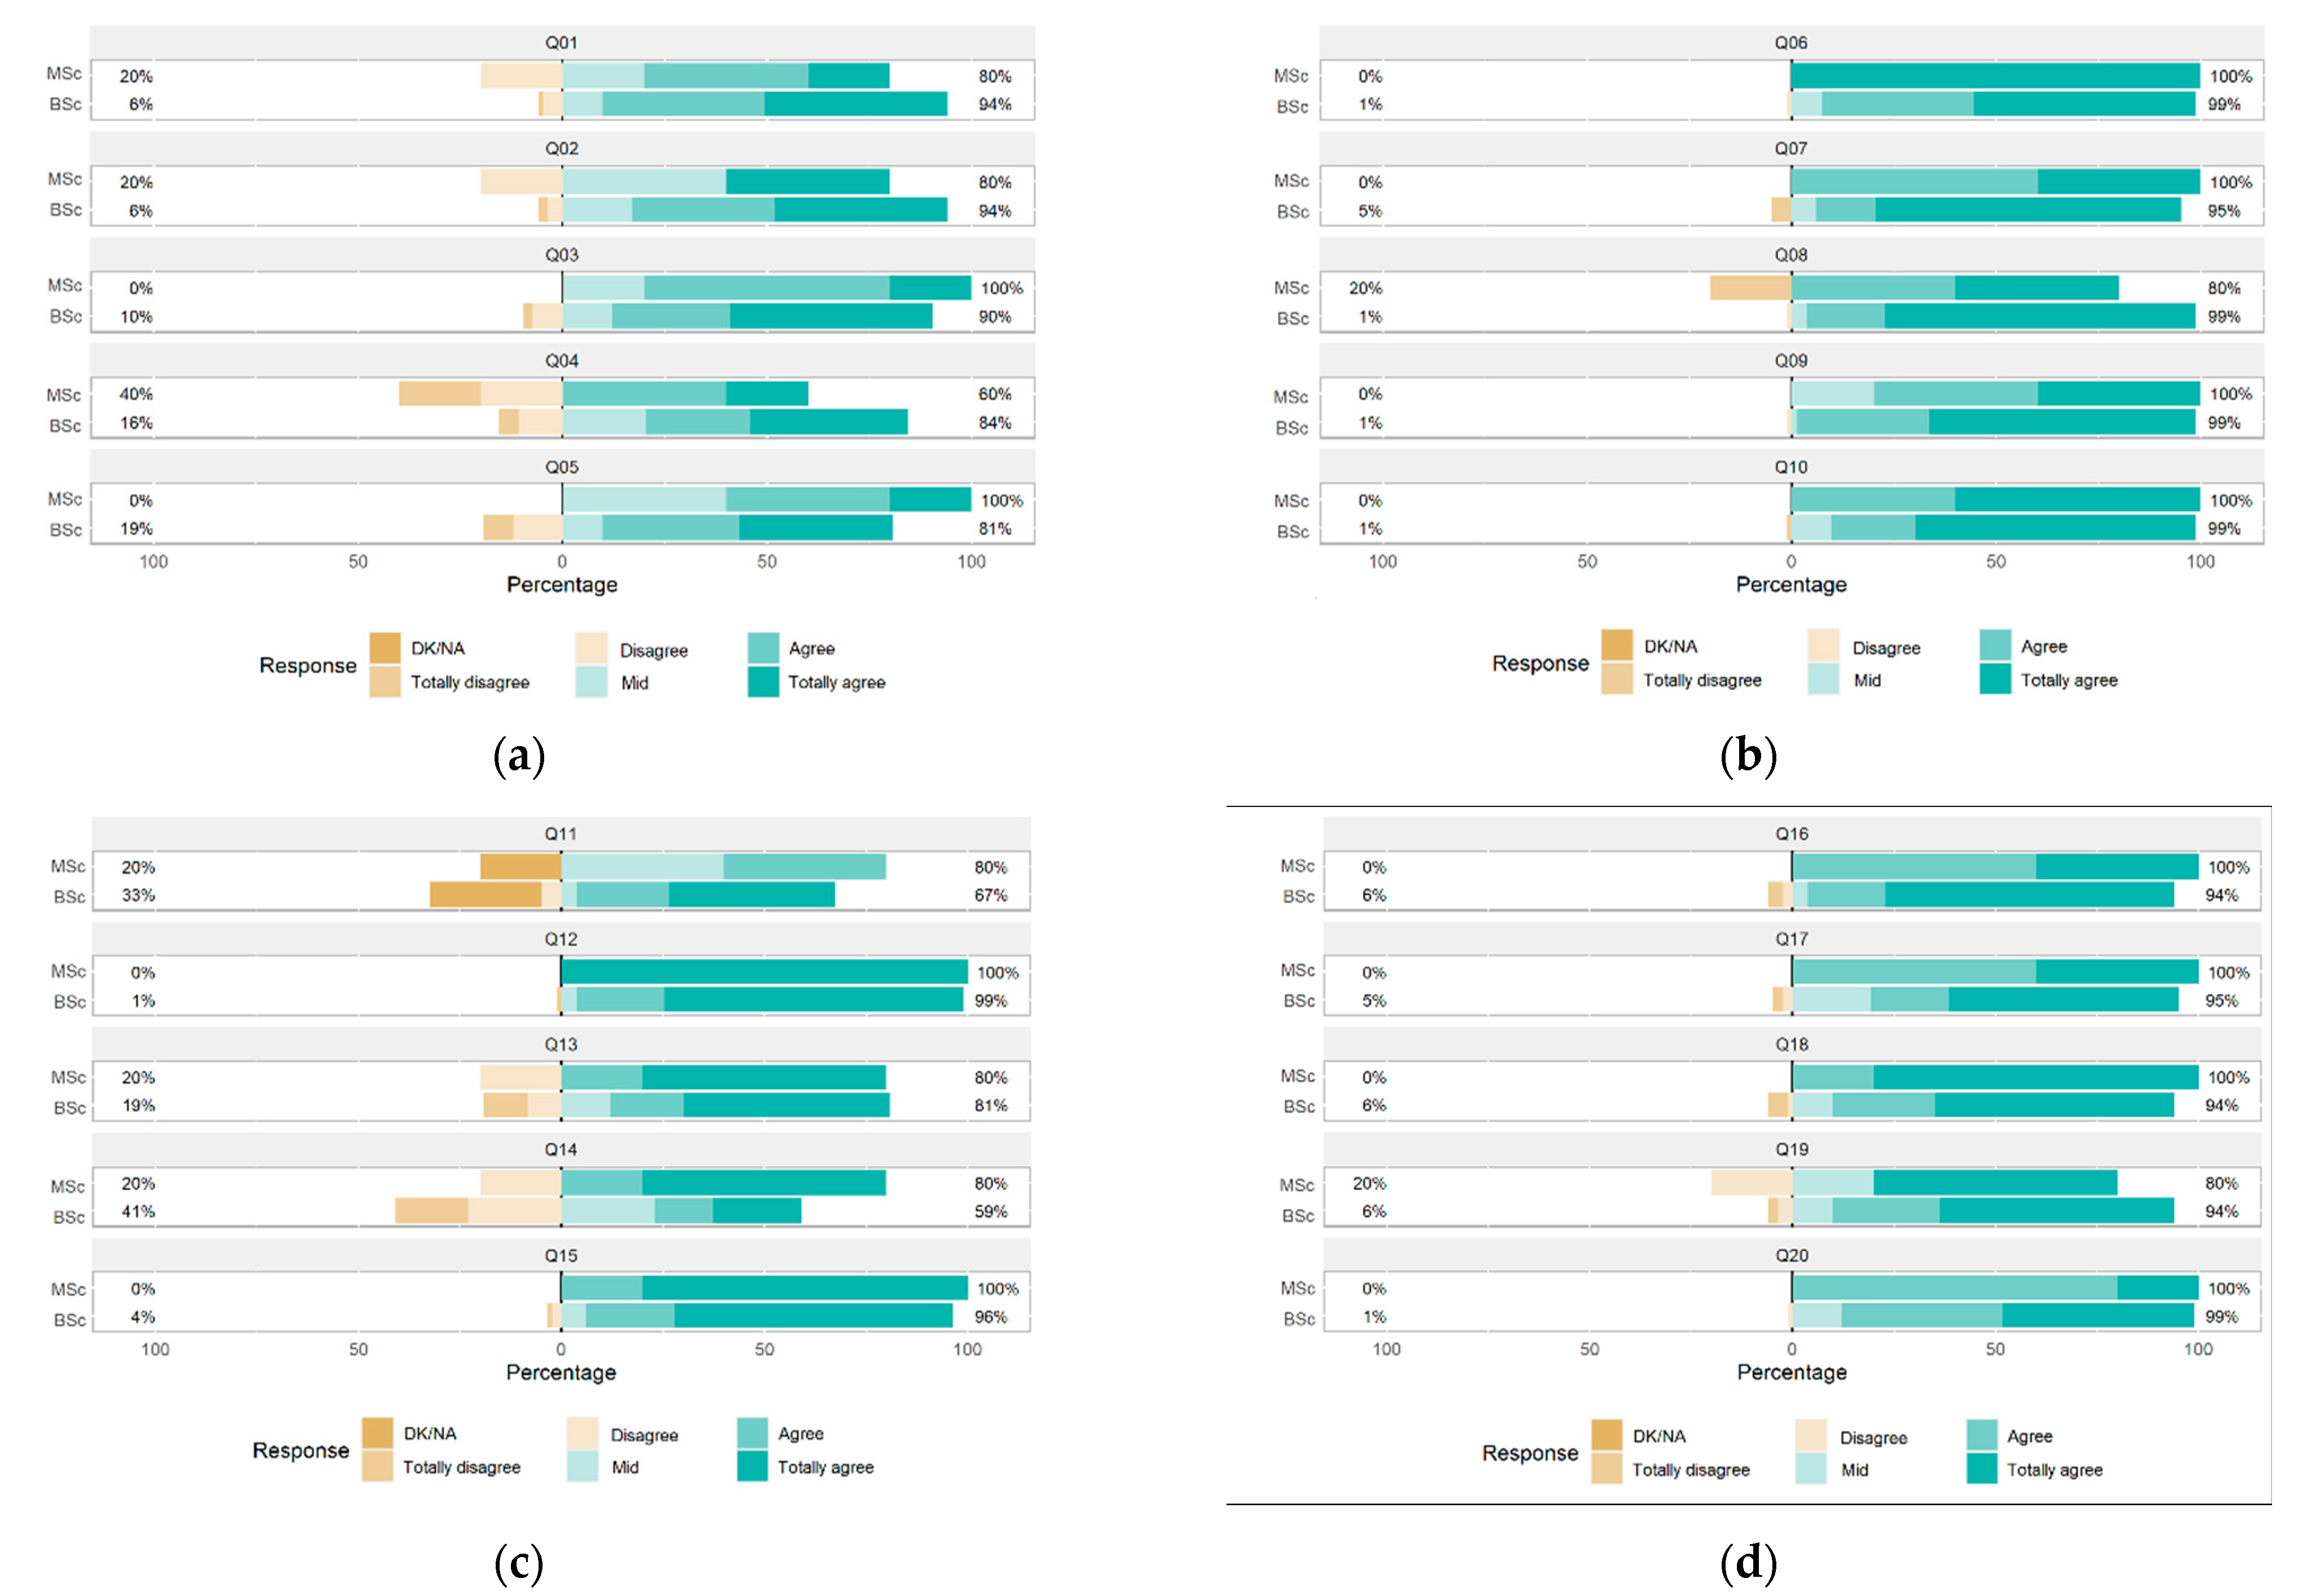
5.6. Analysis Grouped by Bachelor (BSc) and Master (MSc) Degrees

The results from this analysis are shown in Figure 6. In the personal evaluation group of questions, undergraduate students rated items Q01, Q02 and Q04 higher, while postgraduate students rated items Q03 and Q05 higher. This shows that the MSc students felt more responsible for their learning, Q03, by showing a higher degree of maturity than BSc students. They have also valued the completion of the self-assessment and peer-assessment processes as an “extra” motivation, Q05. In the criteria dimension, items Q06–Q09, the responses are very positive in both cases, with the MSc student rating slightly higher, except for question Q09 (…documentation provided by the teaching staff…). This may be likely due to the fact that experience accumulated during undergraduate studies makes them more critical with the material. In the dimensions objectivity of evaluation (Q10–Q15) and learning from the experience (Q16–Q20), the MSc students valued the corresponding items more positively than the bachelor’s students, denoting again more independence.

6. Discussion

The present investigation was focused on the implementation of a 360-degree feedback assessment in BSc/MSc engineering degrees and the evaluation of student satisfaction with the experience. The results from analyzing the survey reveal that, in general, the satisfaction is high and the conclusions extracted from the analysis are consistent with other investigations in the literature.
The personal evaluation group evinced that MSc students showed more degree of maturity than BSc, as they were more critical with the documentation given by teaching staff, as well as demonstrating more concern for their learning. This statement was also mentioned in Abadía et al. [48], where it was observed that last-year students were more critic with the teaching actions and their development. Moreover, it was also observed more with MSc students in the criteria group, as they showed stronger criticism on teaching staff evaluation criteria. It is also very relevant that the aspect in question Q04 (… this experience helped me to improve my study system?), the difference between MSc and BSc student satisfaction was quite different. MSc students rated this question considerably worse, and this makes sense: MSc students are usually more autonomous and independent (they are often working while studying) so they do not need to create study groups or collaborate with fellow students. On the contrary, BSc students are more willing to create study groups. As pointed out in Martinez and Campuzano [21], collaboration with classmates and collaboration were identified as an important factor for engineering student satisfaction. In their work, it is suggested to encourage cooperative groups to engage more of the student body. This aspect was also outlined in Olds and Miller [24], where the creation of group immersive learning strategies increased long-term performance.
It is not surprising from the analysis of the survey that the objectivity of evaluation group obtained the lower satisfaction, since previous authors outlined that in peer-assessment, there is a human feeling component, Gong [46]. Question Q13 also remarks on this scenario, since students involved in face-to-face participation gave less importance to anonymity and vice versa. Thus, students are satisfied with peer interaction according to the on-site/not on-site modality. Some authors also found it interesting to carry out both types of assessment (anonymous assessment and detailed oral assessment, as in Topping [49]) in order to obtain the most of each, so these actions could be also tested in the future application of 360-degree feedback.
Finally, in the learning from experience dimension, it was observed that most students were happy to apply the novel methodology in their subjects, as seen mainly in responses to questions Q18 (…interesting…other subjects…) and Q19 (…would you recommend the subject…), which reflect the interest in these novel assessment methodologies in class, as originally reported by Sotelo and Arevalo [47]. Moreover, Vivanco-Álvarez and Pinto-Vilca [16] identified peer-review assessment as a highly relevant tool to quantify motivation of students in arts and enterprise design degrees, which seems to happen also in engineering degrees as a result from our study.
Unfortunately, no discussion can be developed in the present work regarding the impact in academic success by deploying this methodology and assessment of student satisfaction. However, according to the positive feedback from our survey on the 360-degree environment, and according to the experiences with similar teacher-, self-, and peer-assessment strategies reported by other authors [16,19,47], we strongly believe that the work introduced in the present manuscript can have a strong positive impact in engineering academic success, which would eventually decrease the current dropout rate.

7. Conclusions

In this work, an experimental study was carried out on the implementation of a 360-degree evaluation for students in subjects of BSc and MSc engineering degrees in a Spanish university during academic years 19/20 and 20/21. Their satisfaction with the implementation of this system was analyzed, in order to consider using it in a standardized way. The survey was analyzed as a whole and grouped by attendance and anonymity, and BSc/MSc degrees. This study has shown the degree of student satisfaction with this methodology with no remarkable discrepancy between the evaluation criteria of students (peer- and self-assessment) and teaching staff (hetero-assessment). The validity of the items of the survey provided was confirmed formally through a confirmatory factor analysis and its internal consistency analysis through the Cronbach’s alpha and Guttman’s lambda, which were both very high.
The worst rated questions were those related to the impact of anonymity in the evaluation. However, when analyzing the answers by group according to attendance and anonymity in the assessment, it was observed that the relevance of anonymity in the responses made sense based on the nature of the evaluation itself. To use a fair and consistent evaluation system was one of the central objectives of this study, which seems to have been accomplished with this methodology. To raise awareness of their self-learning was another side objective. The MSc student body felt more responsible than the bachelor’s student body for their own learning, although they were more demanding with the documentation provided by the teaching staff.
In general, there was a high degree of satisfaction of students, since they valued high the most relevant aspects of the 360-degree evaluation with no disagreement. This methodology was a positive proactive element in their own evaluation through participation, and it was an important motivation for most students.
In summary, the designed survey and its analysis on the application of the 360-degree methodology in industrial engineering studies has demonstrated to be a reliable and consistent means to assess student satisfaction. Thus, to use this methodology on a regular and standardized basis in most subjects could have a very positive feedback in engineering degrees. This is because providing students with fairer evaluation tools can increase student motivation, which could eventually reduce the dropout rate and/or increase the number of new registrations. As a limitation of the present study, it was not possible to correlate quantitatively this satisfaction with an improvement in academic success, although previous studies support the positive impact of these methodologies on student learning performance [16,19]. To find complementary innovative actions in class to enhance the (self)learning potential of students could be relevant future work. An example of improvement could be to create virtual working groups to gain knowledge in the subject to be assessed, being tutored by the teaching staff and assessed via the suggested 360-degree methodology.

Author Contributions

Conceptualization: F.-J.G.-O., A.I.G.-M., J.J.J.-G., I.M.S.-R., J.J.F.-L., J.M.G.-d.-G. and J.O.-C.; Data curation: A.I.G.-M., J.J.J.-G., I.M.S.-R., J.J.F.-L., J.M.G.-d.-G. and J.O.-C.; Methodology: F.-J.G.-O. and J.O.-C.; Software: F.-J.G.-O.; Validation: F.-J.G.-O.; Formal analysis: F.-J.G.-O.; Investigation: F.-J.G.-O. and J.O.-C.; Visualization: F.-J.G.-O.; Writing—original draft: F.-J.G.-O., A.I.G.-M. and J.O.-C.; Writing—review & editing: F.-J.G.-O., J.J.J.-G., I.M.S.-R., J.J.F.-L. and J.M.G.-d.-G.; Supervision: J.O.-C., A.I.G.-M., J.J.J.-G., I.M.S.-R., J.J.F.-L. and J.M.G.-d.-G.; Project administration: J.O.-C.; Resources: J.O.-C.; Funding acquisition: J.O.-C. All authors have read and agreed to the published version of the manuscript.

Funding

This research received no external funding.

Institutional Review Board Statement

Not applicable.

Informed Consent Statement

Patient consent was waived due to participants cannot be identified as the survey was anonym.

Data Availability Statement

Data can be provided upon reasonable request.

Acknowledgments

The authors want to thank lecturer Daniel Cebrián-Robles for his suggestions and comments that have helped us to improve the manuscript. This study was developed under an Educative Innovation Project of the Vicerrectorado de Personal Docente e Investigador of the Universidad de Málaga, Ref. PIE19-032.

Conflicts of Interest

The authors declare no conflict of interest.

References

  1. Silió, E. (18 de diciembre de 2019). La revolución 4.0 peligra: Los estudiantes de ingeniería caen un 30% en 20 años. El País. Available online: https://elpais.com/sociedad/2019/12/17/actualidad/1576612459_205974.html (accessed on 10 June 2022).
  2. Stegmann, J.G. (18 de diciembre de 2019). En España nadie quiere estudiar ingenierías y el país se dirige a la «dependencia tecnológica». ABC. Available online: https://www.abc.es/sociedad/abci-espana-nadie-quiere-estudiar-ingenierias-y-pais-dirige-dependencia-tecnologica-201912181146_noticia.html (accessed on 10 June 2022).
  3. Servimedia. (18 de diciembre de 2019). Los Estudiantes de Ciencias e Ingenierías caen un 30% desde 2.000 Porque el Mercado Laboral no Recompensa “el esfuerzo”. El Economista. Available online: https://www.eleconomista.es/ecoaula/noticias/10260885/12/19/Los-estudiantes-de-ciencias-e-ingenierias-caen-un-30-desde-2000-porque-el-mercado-laboral-no-recompensa-el-esfuerzo.html (accessed on 10 June 2022).
  4. Castillo-Martín, C. Análisis de la Eficiencia de los Estudios de Ingeniería. [Tesis Fin de Grado Ingeniería de Organización Industrial]. Bachelor’s thesis, Universidad de Sevilla, Sevilla, Spain, 2021.
  5. López-Cózar-Navarro, C.; Benito-Hernández, S.; Priede-Bergamini, T. Un análisis exploratorio de los factores que inciden en el abandono universitario en titulaciones de ingeniería. REDU Rev. Docencia Univ. 2020, 18, 81–96. [Google Scholar] [CrossRef]
  6. Hernández, J.; Pérez, J.A. (dir.). La Universidad Española en Cifras. Información Académica, Productiva y Financiera de las Universidades Públicas de España. Indicadores Universitarios Curso académico 2017–2018. CRUE. 2019. Available online: http://www.crue.org/Boletin_SG/2020/UEC%202020/UEC%20WEB.pdf (accessed on 10 June 2022).
  7. Schertzer, C.B.; Schertzer, S.M. Student satisfaction and retention: A conceptual model. J. Mark. High. Educ. 2004, 14, 79–91. [Google Scholar] [CrossRef]
  8. Rodríguez González, R.; Hernández García, J.; Alonso Gutiérrez, A.M.; Díez Itza, E. El absentismo en la Universidad: Resultados de una encuesta sobre motivos que señalan los estudiantes para no asistir a clase. Aula Abierta 2003, 82, 2003. [Google Scholar]
  9. García, M.E.; Gutiérrez, A.B.B.; Rodríguez-Muñiz, L.J. Permanencia en la universidad: La importancia de un buen comienzo. Aula Abierta 2016, 44, 1–6. [Google Scholar] [CrossRef]
  10. Jiménez Galán, Y.I.; González Ramírez, M.A.; Hernández Jaime, J. Modelo 360 para la evaluación por competencias (enseñanza-aprendizaje). Innovación Educ. 2010, 10, 43–53. Available online: https://www.redalyc.org/pdf/1794/179420770003.pdf (accessed on 10 June 2022).
  11. Lévy-Leboyer, C. Feedback de 360; Grupo Planeta (GBS): Barcelona, Spain, 2004. [Google Scholar]
  12. Bisquerra Alzina, R.; Martínez Olmo, F.; Obiols Soler, M.; Pérez Escoda, N. Evaluación de 360°: Una aplicación a la educación emocional. Rev. Investig. Educ. 2006, 24, 187–203. Available online: https://revistas.um.es/rie/article/view/97371 (accessed on 10 June 2022).
  13. Alles, M.A. Desempeño por Competencias: Evaluación de 360; Ediciones Granica SA: Buenos Aires, Argentina, 2002. [Google Scholar]
  14. Hanrahan, S.J.; Isaacs, G. Assessing Self- and Peer-assessment: The students’ views. High. Educ. Res. Dev. 2001, 20, 53–70. [Google Scholar] [CrossRef]
  15. Boud, D.; Cohen, R.; Sampson, J. Peer Learning and Assessment. Assess. Eval. High. Educ. 1999, 24, 413–426. [Google Scholar] [CrossRef]
  16. Vivanco-Álvarez, R.V.; Pinto-Vilca, S.A. Efecto de la aplicación de coevaluación sobre la motivación de logro en estudiantes de nivel universitario. Paid. XXI 2018, 8, 57–78. [Google Scholar] [CrossRef]
  17. Martínez-Figueira, E.; Tellado-González, F.; Raposo-Rivas, M. La rúbrica como instrumento para la autoevaluación: Un estudio piloto. REDU Rev. Docencia Univ. 2013, 11, 373–390. [Google Scholar] [CrossRef]
  18. Mertler, C.A. Designing scoring rubrics for your classroom. Pract. Assess. Res. Eval. 2001, 7, 25. [Google Scholar] [CrossRef]
  19. Basurto-Mendoza, S.T.; Cedeño, J.A.M.; Espinales, A.N.V.; Gámez, M.R. Autoevaluación, Coevaluación y Heteroevaluación como enfoque innovador en la práctica pedagógica y su efecto en el proceso de enseñanza-aprendizaje. Polo Del Conoc. Rev. Científico Prof. 2021, 6, 828–845. [Google Scholar] [CrossRef]
  20. Lent, R.W.; Singley, D.; Sheu, H.B.; Schmidt, J.A.; Schmidt, L.C. Relation of social-cognitive factors to academic satisfaction in engineering students. J. Career Assess. 2007, 15, 87–97. [Google Scholar] [CrossRef]
  21. Martínez-Caro, E.; Campuzano-Bolarín, F. Factors affecting students’ satisfaction in engineering disciplines: Traditional vs. blended approaches. Eur. J. Eng. Educ. 2011, 36, 473–483. [Google Scholar] [CrossRef]
  22. Kim, E.; Rothrock, L.; Freivalds, A. An empirical study on the impact of lab gamification on engineering students’ satisfaction and learning. Int. J. Eng. Educ. 2018, 34, 201–216. [Google Scholar]
  23. González Rogado, A.B.; Rodríguez Conde, M.J.; Olmos Migueláñez, S.; Borham-Puyal, M.; García-Peñalvo, F.J. Key factors for determining student satisfaction in engineering: A regression study. Int. J. Eng. Educ. IJEE 2014, 30, 576–584. [Google Scholar]
  24. Olds, B.M.; Miller, R.L. The effect of a first-year integrated engineering curriculum on graduation rates and student satisfaction: A longitudinal study. J. Eng. Educ. 2004, 93, 23–35. [Google Scholar] [CrossRef]
  25. Blanco, A. Las rúbricas: Un instrumento útil para la evaluación de competencias, In La Enseñanza Universitaria Centrada en el Aprendizaje: Estrategias Útiles para el Profesorado; Prieto, L., Ed.; Octaedro-ICE de la Universidad de Barcelona: Barcelona, Spain, 2008; pp. 171–188. [Google Scholar]
  26. Urbieta, J.M.E.; Garayalde, K.A.; Losada, D. Diseño de rúbricas en la formación inicial de maestros/as. Rev. Form. Innovación Educ. Univ. 2011, 4, 156–169. [Google Scholar]
  27. Ministerio de Universidades. Datos y Cifras del Sistema Universitario Español. 2019. Publicación 2020–2021. Available online: https://www.universidades.gob.es/stfls/universidades/Estadisticas/ficheros/Datos_y_Cifras_2020-21.pdf (accessed on 1 July 2022).
  28. Baker, R.W.; Siryk, B. Student Adaptation to College Questionnaire (SACQ); Western Psychological Services: Worcester, MA, USA, 1984. [Google Scholar] [CrossRef]
  29. Tuan, H.L.; Chin, C.C.; Shieh, S.H. The development of a questionnaire to measure students’ motivation towards science learning. Int. J. Sci. Educ. 2005, 27, 639–654. [Google Scholar] [CrossRef]
  30. Douglas, J.; Douglas, A.; Barnes, B. Measuring student satisfaction at a UK university. Qual. Assur. Educ. 2006, 14, 251–267. [Google Scholar] [CrossRef]
  31. Alarcón, R.; Blanca, M.J.; Bendayan, R. Student satisfaction with educational podcasts questionnaire. Escr. De Psicol.Psychol. Writ. 2017, 10, 126–133. [Google Scholar] [CrossRef]
  32. Santos-Pastor, M.L.; Cañadas, L.; Martínez-Muñoz, L.F.; García-Rico, L. Diseño y validación de una escala para evaluar el aprendizaje-servicio universitario en actividad física y deporte. Educ. XX1 2020, 23, 67–93. [Google Scholar] [CrossRef]
  33. Casero-Martínez, A. Propuesta de un cuestionario de evaluación de la calidad docente universitaria consensuado entre alumnos y profesores. Rev. Investig. Educ. 2008, 26, 25–44. Available online: https://revistas.um.es/rie/article/view/94091 (accessed on 10 June 2022).
  34. González López, I.; López Cámara, A.B. Sentando las bases para la construcción de un modelo de evaluación a las competencias docentes del profesorado universitario. Rev. Investig. Educ. 2010, 28, 403–423. Available online: https://revistas.um.es/rie/article/view/109431 (accessed on 10 June 2022).
  35. López Pastor, V.M.L.; Pascual, M.G.; Martín, J.B. La participación del alumnado en la evaluación: La autoevaluación, la coevaluación y la evaluación compartida. Rev. Tándem: Didáctica Educ. Física 2005, 17, 21–37. Available online: http://hdl.handle.net/11162/21846 (accessed on 10 June 2022).
  36. Likert, R. A technique for the measurement of attitudes. Arch. Psychol. 1932, 22, 55. [Google Scholar]
  37. Albaum, G. The Likert scale revisited: An alternate version. Mark. Res. Society. J. 1997, 39, 331–348. [Google Scholar] [CrossRef]
  38. Allen, I.E.; Seaman, C.A. Likert scales and data analyses. Qual. Prog. 2007, 40, 64–65. [Google Scholar]
  39. Jöreskog, K.G. On the estimation of polychoric correlations and their asymptotic covariance matrix. Psychometrika 1994, 59, 381–389. [Google Scholar] [CrossRef]
  40. García Cueto, E.; Gallo Álvaro, P.M.; Miranda García, R. Bondad de ajuste en el análisis factorial confirmatorio. Psicothema 1998, 10, 717–724. Available online: http://hdl.handle.net/10651/29218 (accessed on 10 June 2022).
  41. González-Montesinos, M.J.; Backhoff, E. Validación de un cuestionario de contexto para evaluar sistemas educativos con modelos de ecuaciones estructurales. Relieve 2010, 16, 1–17. [Google Scholar] [CrossRef] [Green Version]
  42. Rojas-Torres, L. Robustez de los índices de ajuste del Análisis Factorial Confirmatorio a los valores extremos. Rev. De Matemática: Teoría Y Apl. 2020, 27, 403–424. [Google Scholar] [CrossRef]
  43. Rodríguez-Rodríguez, J.; Reguant-Álvarez, M. Calcular la fiabilidad de un cuestionario o escala mediante el SPSS: El coeficiente alfa de Cronbach. REIRE Rev. D’innovació I Recer. En Educ. 2020, 13, 1–13. [Google Scholar] [CrossRef]
  44. Cronbach, L.J. Coefficient alpha and the internal structure of tests. Psychometrika 1951, 16, 297–334. [Google Scholar] [CrossRef]
  45. Nunnally, J.C.; Bernstein, I. Psychometric Theory McGraw-Hill New York, the role of university in the development of entrepreneurial vocations: A Spanish study. J. Technol. Transf. 1978, 37, 387–405. [Google Scholar] [CrossRef]
  46. Gong, G. Consideration of evaluation of teaching at colleges. Open J. Soc. Sci. 2016, 4, 82. [Google Scholar] [CrossRef]
  47. Sotelo, A.F.; Arévalo, M.G.V. Proceso de autoevaluación, coevaluación y heteroevaluación para caracterizar el comportamiento estudiantil y mejorar su desempeño. Rev. San Gregor. 2015, 1, 6–15. [Google Scholar]
  48. Abadía Valle, A.R.; Bueno García, C.; Ubieto-Artur, M.I.; Márquez Cebrián, M.D.; Sabaté Díaz, S.; Jorba Noguera, H. Competencias del buen docente universitario. Opinión de los estudiantes. REDU. Rev. De Docencia Univ. 2015, 13, 363–390. [Google Scholar] [CrossRef]
  49. Topping, K. Peer assessment between students in colleges and universities. Rev. Educ. Res. 1998, 68, 249–276. [Google Scholar] [CrossRef]
Figure 1. (a) Classic assessment; (b) 360-degree evaluation.
Education 13 00199 g001
Figure 2. Polychoric correlation matrix.
Education 13 00199 g002
Figure 3. Confirmatory Factor Analysis Model.
Education 13 00199 g003
Figure 4. Distribution of responses to the 360-degree evaluation survey in descending order of positive rating.
Education 13 00199 g004
Figure 5. Distribution of the responses to the 360-degree evaluation, classified according to attendance and anonymity. The responses are grouped by: (a) from Q01 to Q05, (b) from Q06 to Q10, (c) from Q11 to Q15, and (d) from Q16 to Q20.
Education 13 00199 g005
Figure 6. Distribution of the responses to the 360-degree evaluation survey, classified according to degree. The responses are grouped by: (a) from Q01 to Q05, (b) from Q06 to Q10, (c) from Q11 to Q15, and (d) from Q16 to Q20.
Education 13 00199 g006
Table 1. Scheme 360-degree feedback evaluation.
NumberSubjectCourse DegreeN. Participants/Total
#1Computational simulation of fluid flows over vehicles1° Master7/8
#2Fluid mechanics over vehicles1° Master3/4
#3Teleoperations and telerobotics1° Master2/4
#4Physics I1° BSc63/64
#5Photovoltaic facilities4° BSc15/20
#6Fault-tolerant mechatronic systems1° Master3/4
#7Industrial processes3° BSc60/63
TOTAL: 153/167
Table 2. Distribution of the sample.
SexMen70.45%
Women 29.55%
DegreeBSc90.2%
MSc9.8%
SubjectPhysics I41.2%
Industrial processes39.22%
Photovoltaic facilities9.8%
Computational simulation of fluid flows over vehicles4.57%
Fault-tolerant mechatronic systems1.96%
Fluid mechanics over vehicles1.96%
Teleoperations and telerobotics1.31%
Table 3. Dimensions and items in the 360-degree evaluation survey.
Group or DimensionItem NumberingItem
Personal evaluationQ01Has participation in the evaluation experience helped me to better understand the contents of the subject?
Q02Has participation in this experience helped me to detect misconceptions about the content of the subject?
Q03Has participation in this experience helped me to be more responsible and leader of my own learning?
Q04Has participation in this experience helped me to improve my study system?
Q05To know that self-assessment is part of the process: Has this given me an “extra” motivation to carry out the activity?
CriteriaQ06Is the evaluation documentation provided by the teaching staff intuitive and easily interpretable?
Q07Do I think the evaluation criteria have been adequate?
Q08Do I think that the point marks of the sections to be evaluated is adequate?
Q09Documentation provided by the teaching staff is valuable to carry out the evaluation (rubric, evaluation criteria, point marks and correction, etc.).
Objectivity of evaluationQ10Has the self-assessment been objective and fair?
Q11If you do not know, please answer 0: has the peer-assessment that I have received from my classmates been objective and fair?
Q12Have I carried out a fair and objective peer-assessment of my peers?
Q13Do you think that ensuring anonymity would be an important factor for peer-assessment among students?
Q14Can I assure that friendship with evaluated peers has not influenced my peer-assessment carried out (positively or negatively)?
Q15Has the evaluation carried out by your teaching staff been objective and fair?
Learning from the experienceQ16Has participation in this experience allowed me to better understand the evaluative role of teaching staff?
Q17Do I consider that I have learned more with this experience than with the traditional method?
Q18Do you think it would be interesting to apply this experience to other subjects?
Q19Would you recommend the subject because of the experience you had with this evaluation method?
Q20Objectively, how would you rate this experience?
Table 4. Item-scale correlation and reliability indices if an item is removed.
Item r α λ 6   after   Removing   Item
Q010.7570.9110.947
Q020.7610.9110.947
Q030.7300.9120.948
Q040.7180.9130.948
Q050.6550.9160.949
Q060.4860.9180.950
Q070.5730.9170.946
Q080.5980.9160.949
Q090.6820.9140.947
Q100.6030.9160.949
Q110.5790.9160.951
Q120.2720.9220.954
Q150.7160.9130.945
Q160.7290.9120.945
Q170.7210.9120.947
Q180.6040.9160.950
Q190.7570.9110.947
Q200.7740.9120.946
Disclaimer/Publisher’s Note: The statements, opinions and data contained in all publications are solely those of the individual author(s) and contributor(s) and not of MDPI and/or the editor(s). MDPI and/or the editor(s) disclaim responsibility for any injury to people or property resulting from any ideas, methods, instructions or products referred to in the content.

