Article

The Correlation between Budgets and Matriculation Exams: The Case of Jewish and Arab Schools in Israel

by
Rami Zeedan
1,* and
Rachel Elizabeth Hogan
2,3
1
Jewish Studies Program, The University of Kansas, Lawrence, KS 66045, USA
2
Center for Global & International Studies, The University of Kansas, Lawrence, KS 66045, USA
3
Office of Assessment and Quality Improvement, University of Missouri-Kansas City School of Medicine, Kansas City, MO 64108, USA
*
Author to whom correspondence should be addressed.
Educ. Sci. 2022, 12(8), 545; https://doi.org/10.3390/educsci12080545
Submission received: 13 March 2022 / Revised: 14 July 2022 / Accepted: 9 August 2022 / Published: 12 August 2022

Abstract

:
Standardized testing in the Israeli education system presents a cavernous achievement gap between the dominant Jewish and Arab student populaces. This paper assesses the role of one major factor contributing to this discrepancy in test scores: budget allocation. Specifically, we evaluate the relationship between test scores and budget in Israel proper while controlling for Arab and Jewish school systems. The findings from the 2008 to 2018 data demonstrate the increased allocation of budgets and higher test scores in Arab schools. The statistical analysis confirmed a positive correlation between budgets and test scores. Overall, budget factors were found to have a much higher impact on Arab schools than Jewish schools. This was even more significant in Druze schools, which received the higher increase in budget and achieved the most significant improvements in Bagrut scores. As a result, this research challenges previous findings within the educational literature, identifies significant implications as byproducts of this variable relationship, and proposes future policy adjustments and research expansion.

1. Introduction

The formation of Israel as the nation-state of the Jewish people has dominated governmental actions in favor of the Jewish majority in the state [1]. This has dramatically affected its Palestinian–Arab citizens, a national minority, since the state’s inception [2]. The Palestinian citizens in Israel proper (“Israel proper” refers to Israel according to the pre-1967 borders, which excludes the West Bank and the Gaza Strip) have long been the focus of scholarship covering a variety of topics, including the evolution of their standing as a national minority [3], their status as part of the Israeli–Palestinian conflict [4], their religious affairs and identity [5], the status of the Palestinians as an indigenous minority in the Jewish State [6], majority–minority relations [7], or internal and local social and political characteristics [8].
A considerable body of research has focused on the interaction of Palestinian society in Israel proper in specific aspects of life, such as language, the economy, or sports [9,10,11]. This also includes Arab education in Israel [12], which has been documented as another manifestation of power imbalances in the discrepancy of standardized test scores across ethnic divides, i.e., Jews vs. Arabs. Though the numbers continue to fluctuate depending on which religious group, municipality, or ethnicity is under scrutiny, inequity is the most persistent pattern.
This paper focuses on education disparities between Jewish and Arab citizens in Israel and evaluates one of the factors possibly contributing to discrepancy in test scores: budget allocation. Specifically, it will evaluate the relationship between test scores and budget while controlling for Arab and Jewish school systems in Israel. Israel serves as a unique case for this examination because it is a nation-state with segregated education systems for Arabs and Jews, along with further geographic, ethnic, and religious divisions.

1.1. The Modern Israeli Education System

In modern times, the education system in Israel proper is mostly centralized, but supports multiple ethnically segregated systems. There are almost two million students nation-wide, each attending schools in one of many categories [13,14]. The Ministry of Education operates four separate education streams: the Hebrew public education stream (43% of Israel’s students as of 2016 [15], the Hebrew public education religious stream (13%), the Haredi stream (18%), and the Arabic public education stream (26%). The Hebrew public education stream is the mainstream education in Israel. Most secular Ashkenazi Jews, Mizrahi traditional Jews, Russian Jews, and Ethiopian Jews are enrolled in the Hebrew public schools [16]. The Hebrew public education religious stream includes public schools and private and independent schools with varying state funding levels. The Haredi stream is made up of two major parts: The Independent Education system for Haredi Ashkenazi students [17] and the Ma’ayan HaChinuch HaTorani for Haredi Mizrahi students [18]. The Arab education stream has four separate sections: Arab (mainly for non-Bedouin Muslims), Bedouin, Druze, and Circassians [12]. This is in addition to private and independent Church schools for Christian Arabs [19].
Despite the different schools for Arabs and Jews within the public system, the progression of grades, the amount of compulsory education, the major exams, and the teacher salaries are all similar [20] (p. 712). With all of the above factors being standardized, one would assume that educational outcomes would be equal. But is there a noticeable achievement gap based on ethnic factors in Israel?
The data from the past ten years indicate existing achievement gaps between Jewish and Arab students. As test scores in Israel comprise a significant portion of measured achievements, simply looking at the trends in these data demonstrates this same pattern. It is perhaps most well known in recent studies that Israel’s performance on the 2012 PISA exam, which focuses on 15-year-old students, demonstrated the most outstanding achievement gap between high-performing Jewish and low-performing Arab students out of all of the Organization for Economic Co-operation and Development (OECD) countries [21]. Furthermore, Dadon-Golan et al. [22] found that Arab students were 30% less likely to be eligible for a matriculation certificate (Bagrut) than Jewish students—a consistent finding across 7 of the 11 years in the study. With such a substantial achievement gap evident throughout Israel’s major exams, the question becomes: why is there a noticeable achievement gap based on ethnic factors?
The historical division of Israeli schools based on ethnicity draws much attention for local, political debate surrounding equity in education. There seems to be a disagreement within the debate between personalization and discrimination. According to Abu-Saad [14] (p. 63), there is a connection between the education outcomes and the status of the Arabs as an ethnic minority. Furthermore, though the system allows Arab schools to teach in Arabic, the Jewish-dominated government authorities still monopolize decision-making and curriculum development [14] (p. 71). Moreover, from the perspective of the Arabs in the system, their schools and opportunities in education are not held to the same quality standard as those within the Jewish schools—a valid sentiment considering that Arab schools have fewer classrooms, libraries, laboratories, and qualified teachers [13,23].

1.2. Education Budgets in Israel

Education budgets in Israel are usually decided by the central government and distributed to the municipalities. In such a centralized system, discrimination in the allocation of budgets is a common theme. However, in 1998, the Ministry of Education approved Resolution No. 3292, which implemented a budgeting system for education based on national priority. The Resolution focused entirely on national strategic advancement, as opposed to equity. According to Adalah [24], under Resolution No. 3292, the government defined a new way of categorizing localities as National Priority Areas (NPAs) without prioritizing Arab schools. Though 33% of Israeli localities are Arab majority, of the 553 areas classified as NPAs, only four were Arab [24]. The Resolution and controversy proved that budget allocation is a potential factor for inequity in the education system.
The Israeli government reconsidered this policy multiple times. However, it was only after 2006 that an Israeli court determined that the 1998 decision allowed for illegal discrimination against Arabs. In 2009, the government approved Resolution No. 1060, which extended the NPAs such that 40% of the recipients were Arab citizens [24]. While the NPA expansion seems to mark a significant improvement, the new Resolution still allowed further discrimination and marginalization. Additionally, the Israeli Ministry of Finance began the implementation of Resolution 922 in 2016. It was a five-year plan for the economic development of Arabs in Israel, including, among other aspects, investments in infrastructure for education, the promotion of informal education, and higher education [25]. The question that arises here is whether this additional budget improved the Arab educational achievements in Israel.

1.3. Exams in Israel

One of the primary goals of Israeli education is directed towards a unique exam: the matriculation examination, known in Hebrew as the Bagrut. As a necessary component for university admission, program admission, and even highly competitive employment, the Bagrut exam is a primary indicator of student achievement in Israel. Ayalon and Shavit [26] outlined the requirements of the exam. First, the Bagrut evaluates proficiency in seven areas of study: English, Mathematics, Civic Education, Literature, History, the Bible, and Hebrew/Arabic. Based on a student’s performance in these areas, they receive no certificate, a basic matriculation certificate, or a university-qualifying certificate to accompany their high school diploma. Universities weigh Bagrut scores with the high school GPA and the results on another exam, known as the Psychometric Entrance Test, to calculate the student’s university admission score [27,28].
Thus, with the Bagrut playing such a vital role in a student’s opportunities and life trajectory, this research uses matriculation certifications as the dependent unit of measurement to explore how budgets affect student achievement. Therefore, based on this introduction, the research questions are: Are there differences in the Bagrut achievements between Arab and Jewish students in Israel? Are different budget allocations the reasons for the achievement differences? Did the additional budget improve the Arab educational achievements in Israel? And in general, is there a connection between budgets and educational achievements? In order to answer these questions, the paper is divided into five major parts. After this Introduction, we will introduce the relevant Literature Review. The third part will be the Materials and Methods, followed by the fourth part, Results. The fifth part is the Discussion.

2. Literature Review

Within the specific study of standardized testing, scholars debate which of the varying socioeconomic, social, cultural, or political conditions cause discrepancies in test scores, and to what extent. There are many factors to explore, but some infiltrate the literature more frequently. For example, much of the academic dialogue narrows in on the status of a student’s individual economic environment, rather than picking apart the existing education system. According to Eagle [29] (p. 13), the most concrete discovery was the uncontested importance of a family’s financial state. Most of the current research validates socioeconomic factors as having the most significant effect on the achievement gap in racially diverse school systems [30,31,32,33,34]. While we do not discount the importance of socioeconomic factors in influencing individual student achievement, this paper seeks to critically evaluate systemic shortcomings and policy pertaining to the systemic nature of local socioeconomic conditions, rather than the individual.
In addition to this factor, the literature extends to other potential causes for the discrepancy in standardized test scores, including the cultural or master narrative. Particularly in the study of Israeli education, cultural/master narratives are a very common causational variable, considering how the Israeli–Palestinian conflict permanently impacted Israel’s national history. Bigelow [35] (pp. 128, 132) states that master narratives in standardized testing dictate “truth, knowledge, and learning”, which misrepresents complex social processes. Specific to Israel, as Rotberg [36] (p. 2) points out, the Israeli and the Palestinian narratives often wholly oppose each other, as they see the same events from two different angles. Research designs focus on such narratives differing between the Jewish and Arab education systems by viewing textbooks, sitting in on lessons, and observing students’ reactions to the unfamiliar opposing narrative [37]. This approach is more system-focused than previous literature, as it evaluates the subliminal narrative in government-sanctioned testing content. Therefore, the research again does not disprove the validity of this approach in qualifying inequity in standardized testing. Nevertheless, as the narrative is already a very common vein of discourse in Israeli testing, this study will highlight less popular systemic criticism approaches.
Another factor which the existing literature briefly explores is test preparation. While the consensus seems to implicate test preparation as an influential primary agent for test scores, the scope of the discourse is not wide enough to stake a solid claim. Within this somewhat smaller body of literature, scholars focus on the varying types of preparation (public vs. private) and how they directly correlate to the scores each student receives [38]. Other scholars acknowledge how the types of test prep that a student uses demonstrate inequality or favor advantaged students [38,39]. Regarding existing Israeli literature, one author briefly mentions a lack of preparation for Arab students in schools, and another focuses on the way Israeli teachers teach the material [40,41]. This smaller subcategory of discourse holds a lot of potential for the implication of inequity in the Israeli education system, as preparation for testing is subject to variation in an array of factors: teacher preparation, the cost of resources (i.e., extra classes, practice books), the availability of resources, the language of the resources, cultural compatibility with the test material, and the amount of time required to prepare. However, considering the somewhat-lacking discussion concerning Israeli testing in general, by understanding budget and funding more fully in Israel, future research may expand into accompanying testing resources.
Additionally, few scholars focus on individual choice as a leading factor behind test inequity. This narrow focus populated the discourse from the 1980s and 1990s. For example, Brookover [30] (p. 267) discusses the role of teachers’ perspectives, given that they might think of some of their students as slow to learn the objectives set for others. Furthermore, Eagle [29] and Zuzovsky [40] (p. 13) introduce parental involvement in their kid’s education as a significant variable. Lastly, Jencks and Phillips [33] consider age, home environments, and test biases. Thus, this older discourse surrounding test accomplishment holds the individual’s circumstance rather than the system accountable for general test performance. In contrast, we will examine systemic factors in order to validate the role of society and government in inequity instead of the individual role, as is consistent with previously discussed theoretical frameworks.
Lastly, in opposition to general trends, some scholars choose not to focus on a single cause that may lead to discrimination but simply identify factors that do not play a role. Several academic works assert that money or schooling alone cannot be the source of the inequity problem for various reasons. For example, Jencks and Phillips [33] argue that research in testing gaps places far too much emphasis on economic disparity. Consequently, having a financial focus will not yield a successful policy. Additionally, other academics mention various rebuttals: the achievement gap exists before and after someone is in school, educational reform is more symbolic rather than legislative, and change may be better brought about by tackling poverty, health, or employment [32,33]. Meanwhile, others argued that an adverse effect could arise if the allocation of resources to schools is solely based on equity [41]. There is merit to tackling broader issues and considering variables outside of financial allocation. However, our research argues that there is also merit in examining the financial effect on educational performance and then using the findings in policy formulation, as part of a more holistic approach.

2.1. Budgets and Resource Allocation

Within the realm of budgets, funding, and resources, various scholars tailor their studies using specific definitions for “resource allocation”. Likewise, this research clarifies a specific definition that will serve as the basis for language in this paper from here on out. For example, Eisikovitz [42] (p. 403), who studies immigrant and minority education in Israel, found evidence demonstrating discrimination in the allocation of resources, the teacher–student ratio, facilities, and equipment. Likewise, Lavy [43] looks at resource allocation in Israel and how variation affects student performance, using the assumption that “resource allocation” refers to teacher availability. For this study, “resource allocation” or “budget”, the primary term used in this paper, will encompass incoming and outgoing uses of financial resources in education. Thus, “budget” will include both sources of funding and expenditure, a dichotomy which the literature often separates for individual focus.
On the one hand, a select group of scholars explores the importance of government funding in creating policies and programs to aid test scores. Most of this scholarship focuses on the United States. For example, Garcia et al. [44] created a study that explores the effects of funding on third- to eighth-grade test scores, specifically through the presence or lack of arts programs after the “No Child Left Behind” initiative. Additionally, Ladd et al. [45] consider specific third-grade policies where the government focused funds on disadvantaged students. Both researchers found that the presence or lack of federal funding in these scenarios impacted student achievement. Cobb-Clark and Jha [46] (p. 260) found the opposite. A study of Australian schools suggested treating with caution the potential of increased funding levels to lift student achievement. While these studies focus on federal funding in America and Australia, this research will examine Israeli central government funding as a potential source for different testing achievement levels. Thus, this paper will expand the importance of this variable into a new location and to a different age of students in order to further develop the validity of the different sides to this argument.
Additionally, some research engages specifically with the role of expenditure instead of funding. The literature concerning the way in which expenditures affect test scores seems to show a united front: there is no relationship. Lee and Polachek [47] examined New York districts over five years and found that while budget did decrease the dropout rate in schools, there was no apparent effect on test scores. Cobb-Clark and Jha [46] also weigh in on this debate, concluding that there was no correlation between expenditure per student and standardized test scores. As both incoming and outgoing finances in education constitute the budget elements, expenditure will be a significant area of focus in this research. Similarly to government funding, this study will evaluate whether the consensus regarding expenditure is valid in Israel.

2.2. Locations and Methods

The existing literature explores standardized testing in several area studies across the globe, using case-specific methodologies. This type of research, logically, gravitates to centers of racial tension. As such, most of the scholarship has focused on black–white differences in America. These locations included Virginia, North Carolina, New York, and the Midwest [31,34,38,39,44,45,47,48]. Ball [32] observed schools in England, Cobb-Clark and Jha [45] studied Australia, and several scholars focused on Israel [28,40,42,43,49,50]. However, in these Israeli studies, the focuses were on other causes for test score outcomes, such as immigration, pollution, and language bias. Only three mentioned budget or resource allocation while studying an Israeli case. While studies in standardized testing have somewhat spread into Israeli scholarship, the number of sources available for reference is minimal. This research will expand the exploration of the Israeli budget and test scores that qualify the previous research claims.
Across the entire body of research, researchers logically explore the relationship between resources and achievement using different methodologies. The most common methods in the current research were policy content analyses and longitudinal analysis [32,33,42,49]. Aside from these standard methods, Lewis-McCoy [31] used an ethnographic approach, Bar-Tal and Salomon [37] used narrative analysis and ethnography, and Boger [48] looked at court decisions. Brunn-Bevel et al. [34] used a mixed-method that first examined state and district level test scores, and then used those conclusions to direct future progressions within the study. Garcia et al. [44] used a quantitative framework and statistics, controlled for ethnic factors, and used an ANOVA test to assess variation. We followed this method and used quantitative foundations to establish correlation while controlling for ethnic factors. Overall, the existing studies on this topic employ a stark variety of methodologies, with few providing methodological inspiration for the research design in this study.
Overall, this research pulls in existing theoretical frameworks, expands the literature on budget and test scores, qualifies the relationships from previous research, further develops Israel as a locational focus, and employs previously existing methods for analysis. While the components of this unique research do exist for the most part in preexisting bodies of scholarship, this paper encapsulates a tailored blend of ideas to create something unique and address gaps in the literature.

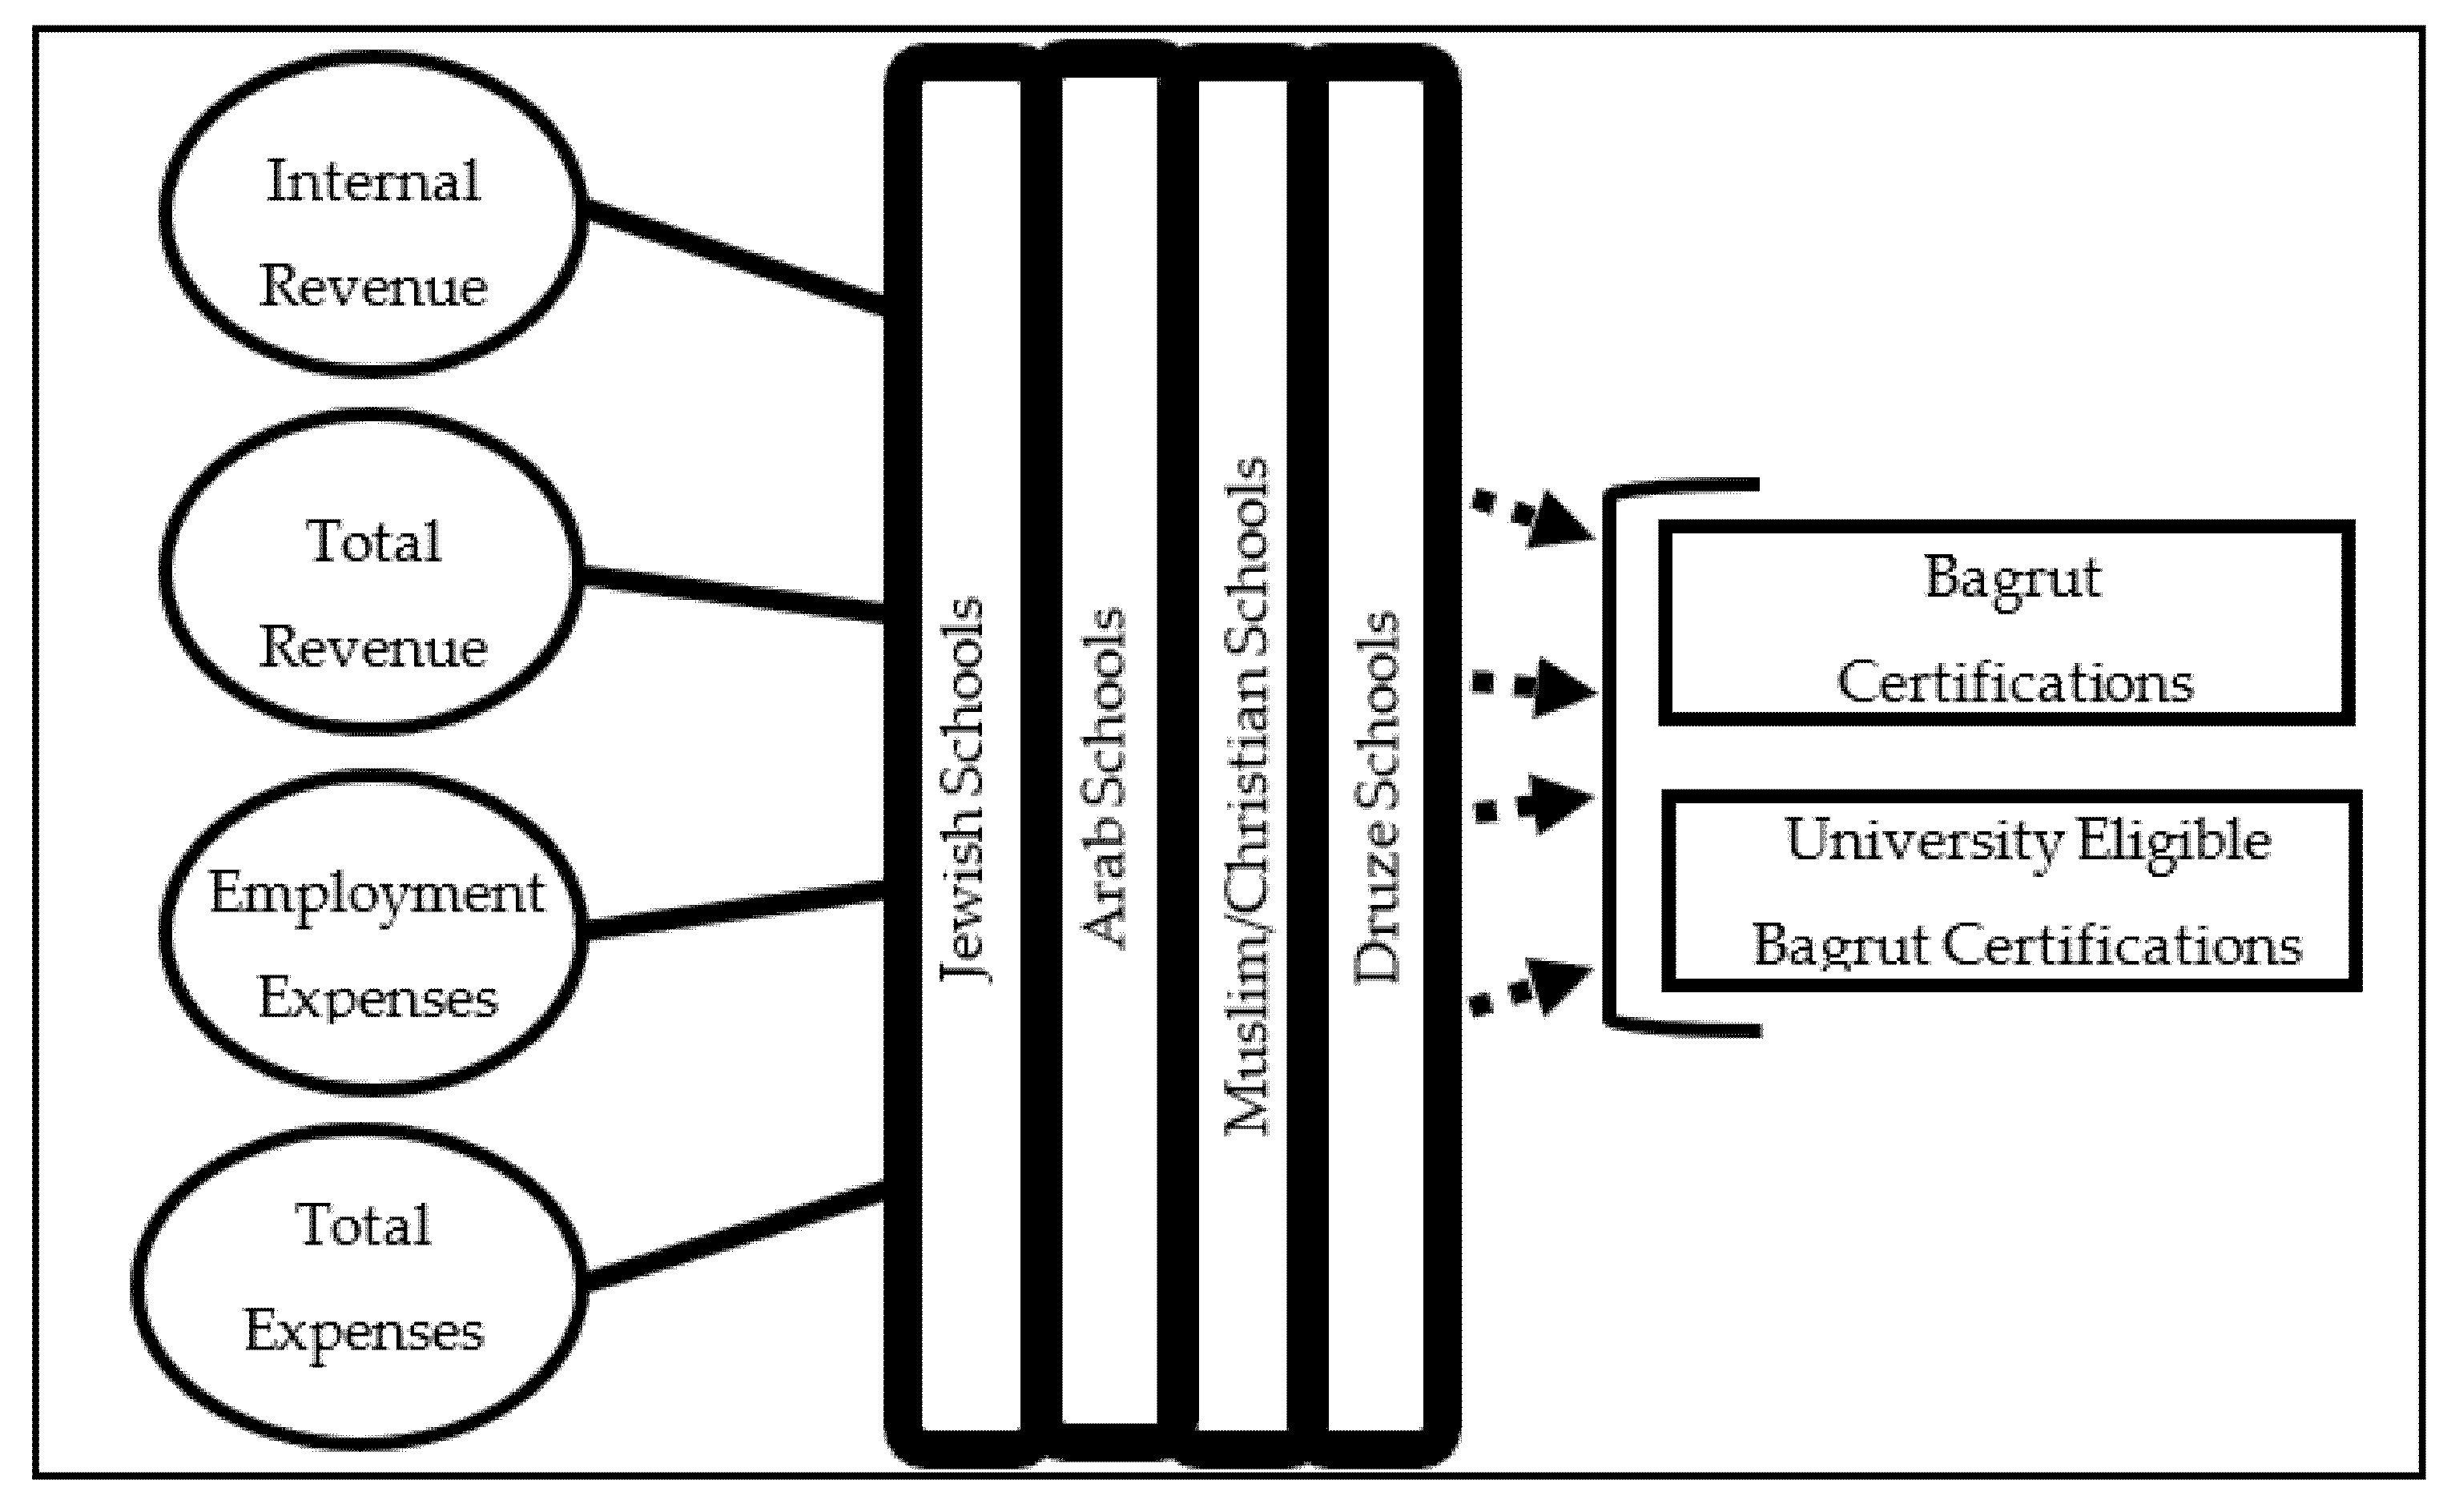
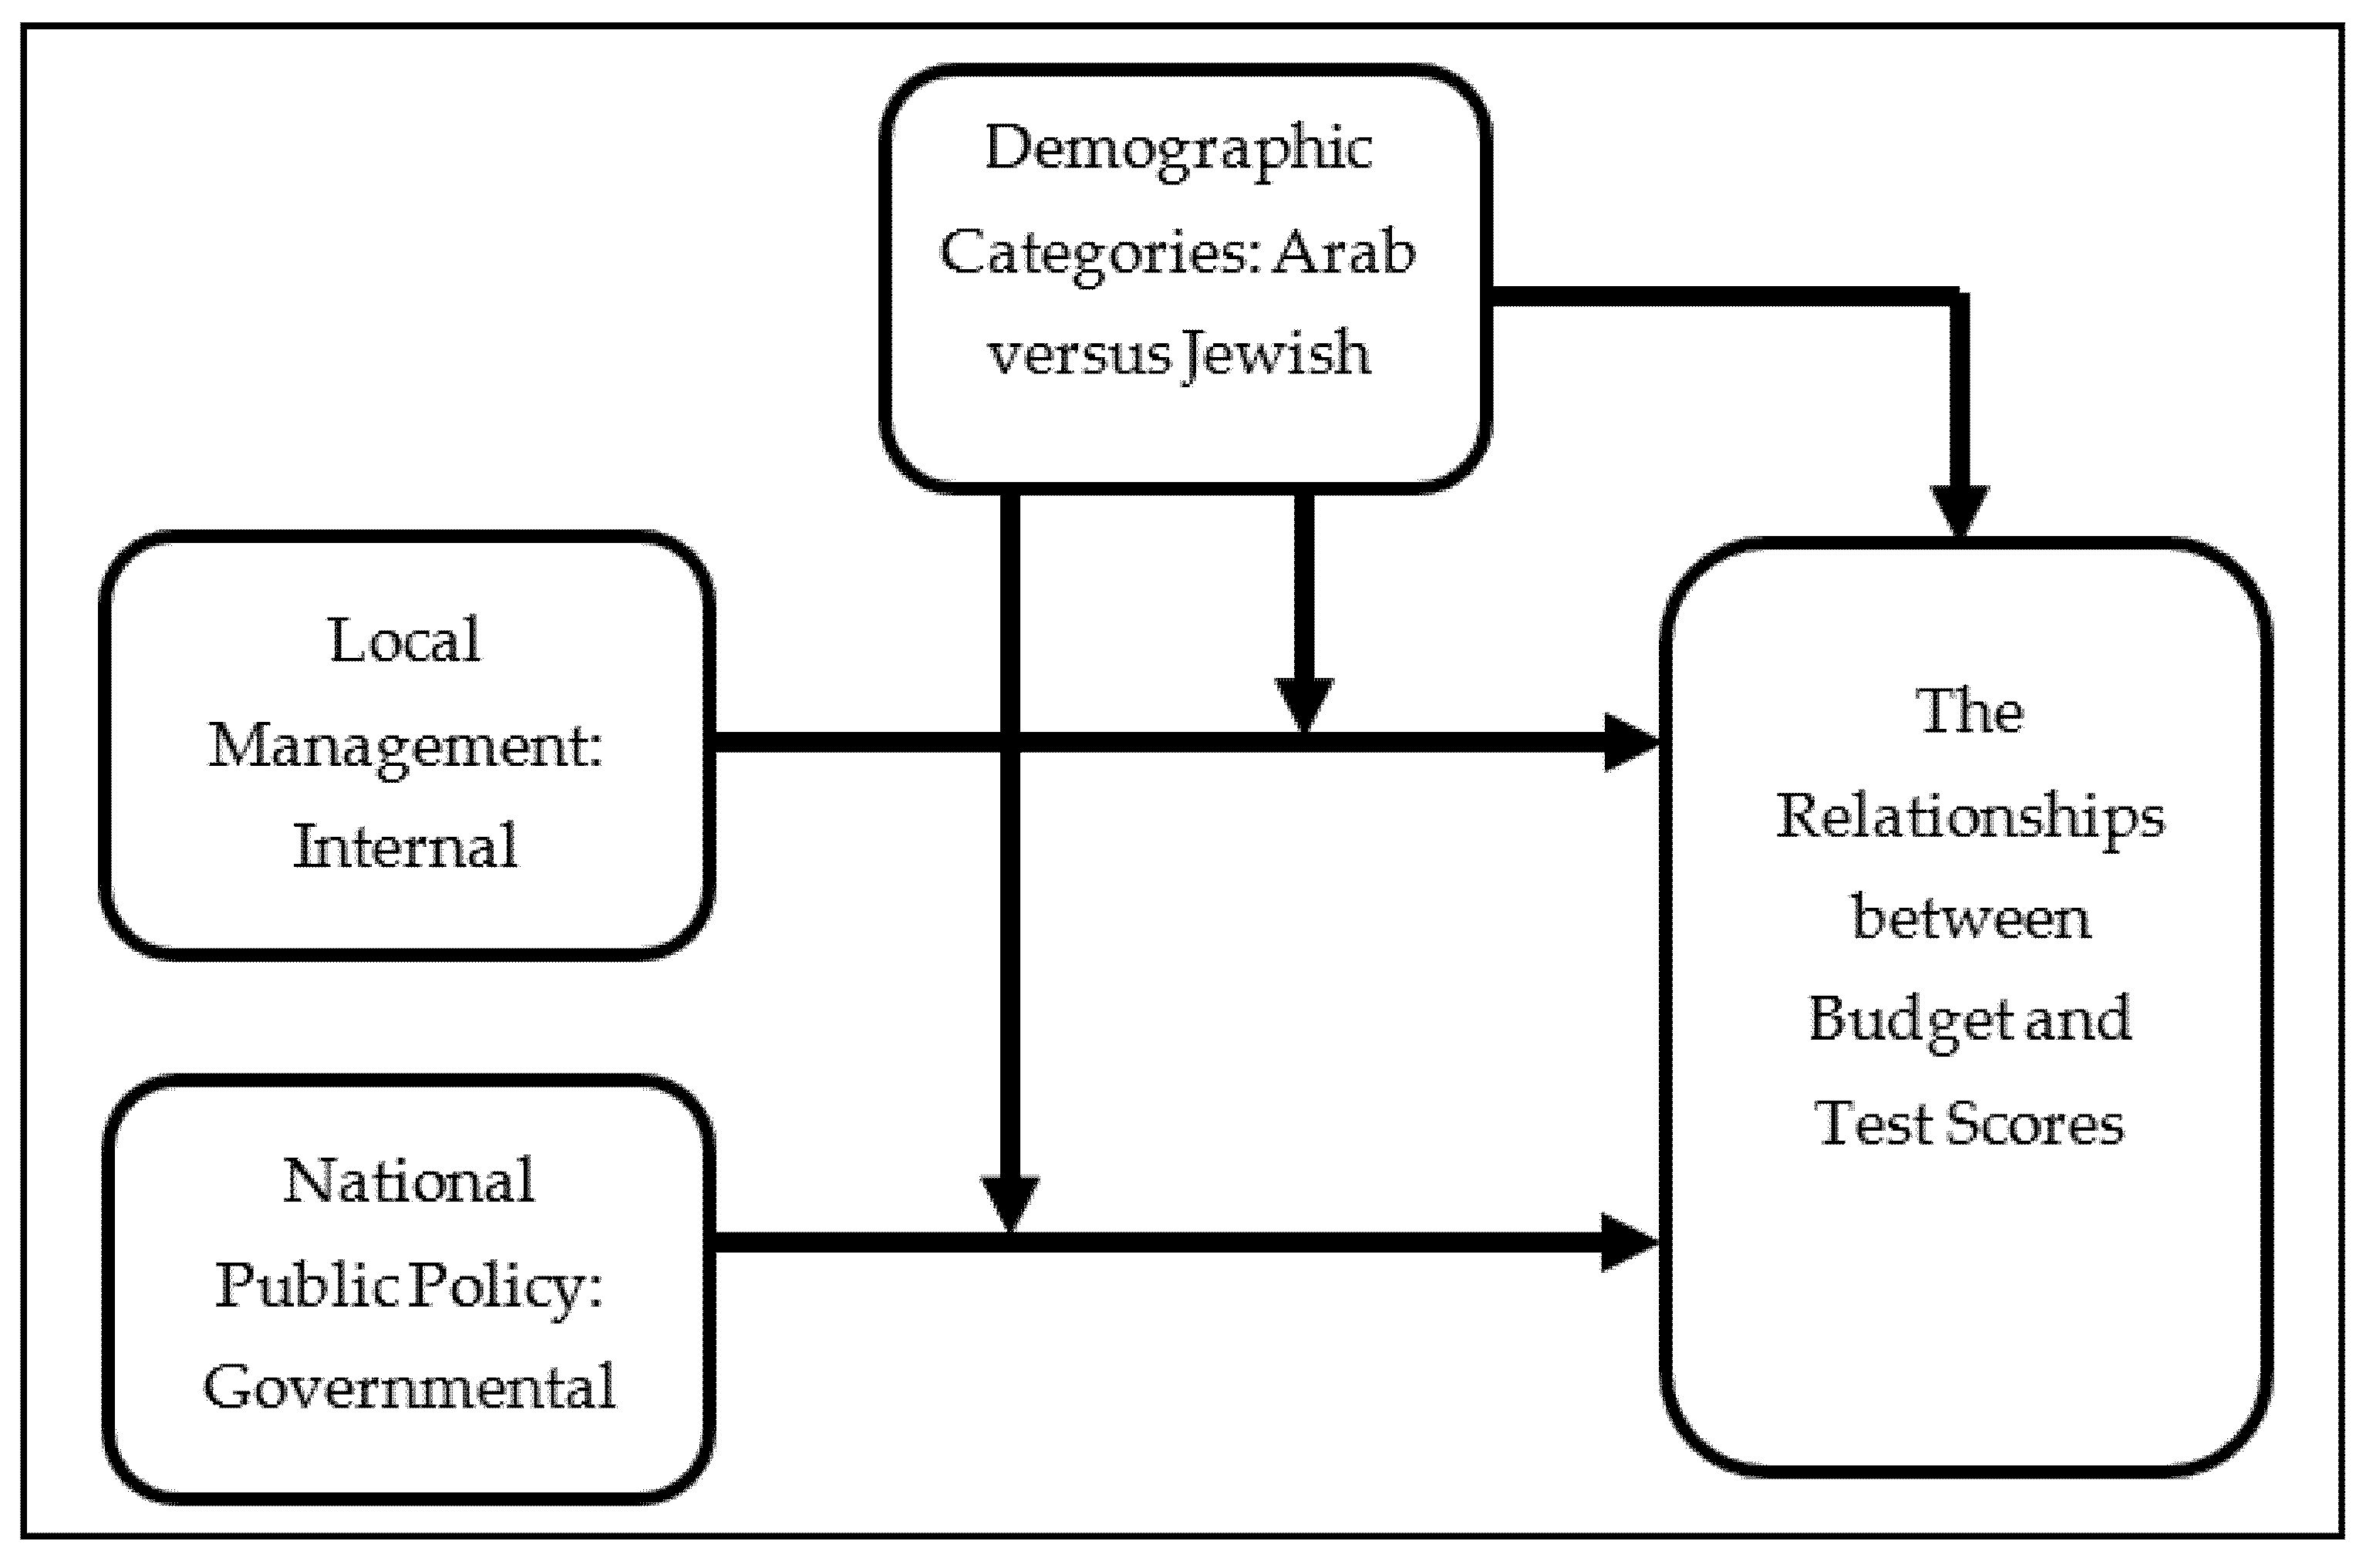
3. Materials and Methods

3.1. Model and Hypothesis

The research model for this paper will consist of three levels of analysis to answer the primary research questions. In doing so, the paper establishes a variable relationship, uncovers the effects of a control variable, and evaluates the relevance of the different categories within independent and control variables. First, this research identifies the potential for an existing correlation between budget (expenses and revenue) and test scores (Bagrut) in Israel. Second, within that established relationship, the research will examine whether demographic categories (by ethnicity and religion) have an impact. Third, this research will directly compare different types of budget allocation and the different demographic categories against each other in order to identify nuance and variation within the overarching variable relationship. Both the research model and the hypotheses represent the various levels through which the variable relationship is examined in this research. In doing so, this paper will explore the research question on a multi-tiered level.
Figure 1 and the hypotheses from Appendix A, Table A1, represent the model and predictions for the first level of analysis: the establishment of a relationship. We argue for an existence of a positive relationship between budget and test scores in Israel, which originates from the previous research findings in the literature review section.
Hypothesis 1.
If you increase the budget variable in a particular municipality, then the test score data in that municipality will increase as well.
Figure 1 and the hypotheses in Table A1 also demonstrate the second tier of analysis: the influence of ethnicity and religion on the primary independent and dependent variable relationship. The model asserts that controlling for demographic classification will uncover alterations in the original relationship. In Figure 1, the different types of school systems based on ethnicity act as a filter through which the budget and test score relationship passes, ultimately creating variation within the umbrella relationship. The second hypothesis echoes the change resulting from ethnicity as a control variable:
Hypothesis 2.
Arab results, on the relationship between budget and test scores, will be more correlated than Jewish results.
This model asserts the control variable’s power to alter the outcome of the relationship between budget and test scores.
Lastly, Figure 2 and the organization of Table A1 show the third level of analysis: exploring the different categories of budget allocation and how they affect test scores while controlling for demographic variables. The model adds to the discussion the internal vs. external financial factors. Previous scholarship discussed the budget in underserved communities and explored whether internal or external financial factors impact Arab communities more substantially [51] (p. 1080). We adopted this model in order to demonstrate how local financial management (internal) holds greater weight for the wellbeing of Arab systems than central government grants (external) as the foundation for this research’s set of hypotheses.
Furthermore, this work found a significant deficit for internal revenue in Arab communities, which is a finding supported by other scholars [52]. This research will expand the theory to a new educational context, examine whether internal or external budget factors affect general financial performance in a locality and the services provided, and directly examine the effect on educational achievement. Examining different manifestations of the Israeli education budget as “internal” or “external” supports predictions about which budget factors and ethnic communities have the most decisive influence on the relationship between the independent and dependent variables.
In Figure 2, this research predicts that internal factors will have more of an impact in areas of the financial crisis, with the following assumptions: (1) internal budget factors will include internal revenue and all spending data, as local influences are more likely to impact these financial measures than the central governmental influences; (2) external budget factors include governmental budget allotment; (3) as Arab localities are more likely to be in a state of financial crisis, internal factors will have more weight on their student achievement compared to Jewish counterparts. In examining this model with these assumptions, our research will expand the local management approach model into the realm of education.

3.2. Data

This paper explores the differences in budget between the different school systems as a possible factor in test score outcomes. To this end, this research employs comparative quantitative methods to observe the effects of different budgeting factors on test scores while controlling for Arab and Jewish populations. Israeli Central Bureau of Statistics (CBS) [53] data from each year from 2008 to 2018 will comprise the foundation of the research. This includes population data, financial data, and education outcomes on the municipality level.

3.2.1. Test Scores: Dependent Variables

Table A2 lists the dependent and independent used in this research. For dependent variables, we chose two that focused on student achievements in the form of the Bagrut certificate. Students can receive either a standard Bagrut certification (A1) or a university-eligible Bagrut certificate (A2), depending on their scores in certain areas and the inclusion of certain levels of required subjects. The data for these measures are the percentages of the twelfth-grade population in each locality to receive either of these certificates. As the dependent variable, the variation in these test scores relative to changes in the independent variable will evaluate the role of budget in Israeli education. Likewise, by looking both at standard and university certificates, this research can test this variable relationship on different levels of achievement, thereby evaluating whether a relationship would impact minority career paths and higher education.

3.2.2. Budget: Independent Variable

As for the independent variables, we chose to focus on the budget. This was divided into income and expenses. For income, we used two factors: the internal revenue for education per student (R1) and the total revenue for education per student (R2). These data points quantify the amount of money that each municipality receives to fund education. Specifically, this total encompasses two numbers: the revenue acquired from internal, local payments (from residents), and the amount of money each municipality receives from the Ministry of Education. By examining this data point’s effect on test scores, the project concludes the central government’s role in equitable budgeting allotment, and therefore, where financial inequality establishes its roots. On their own, internal revenue data embody all income that does not come from the central government. This variable can include fees, donations, and local taxes. Internal revenue is a known source of disparity in Israel between Jewish and Arab localities, as discussed in the literature review section. Consequently, examining these data not only exposes a known internal gap in educational equity but is also a factor in calculating the aforementioned external factor of funding.
For expenses, we used two factors: Expenses in educational employment per student (E1) and the total educational expenses per student (E2). These data points detail two different quantities: the total expenses for education in each municipality, and how much of those expenses are paid for employment. Similarly to the revenue data, using a total value and a subcategory within that total indicates the apportionment of locality expenses. The data include teacher wages, overtime, travel allowances, and training for employment expenses. The total expenses data encompass everything else: maintenance, transportation, housekeeping, and security. These data points further solidify the discussion of internal budget management vs. external allocation by studying where the money goes once it reaches a locality. By tracking the direction of education expenses in conjunction with test score achievement, the research can establish a correlation between the independent and dependent variables while also understanding how different measures within the variable relationships create variation.

3.2.3. Demographic Factors: Control Variable

As a control variable, the research uses ethnicity to control for demographic variation. The categories within this variable are Jewish and Arab, which have further subcategories for Muslim, Christian, and Druze. This project does not delve into the different social affiliations within the Jewish majority. The data for Jews (D1), Arabs (D2), Muslims (D3), Christians (D4), and Druze (D5) according to each municipality are based on the annual CBS data. The unit of measurement is the percentage within the entire population of the locality. Using these data, each municipality received a primary Jewish or Arab categorization. Thus, these data contribute to this research’s central academic assumption, and support a primary function: to track variable relationship variation within ethnic categories.

3.3. Analysis

The first element we needed to establish was whether these prospective variables exhibited variation within each ethnic community. In order to do this, averages were calculated for each independent and dependent variable by the community each year. The ethnic communities included Israel proper (the entire country), Jewish, Arab, Muslim, Christian, and Druze. We visualized the general relationship between budgets and test scores in order to establish a correlation following this process. We considered all data pairs irrespective of year and ethnic community in order to do this.
We calculated correlations for each variable relationship for the statistical analysis and controlled for ethnic communities: Israeli, Jewish, Arab, Muslim/Christian, and Druze. For the statistical analysis, we combined the Muslim and Christian cases, as the numbers of Christian majority localities are not substantial enough for individual statistical consideration. Furthermore, in order to assess the statistical significance of each correlation coefficient, we calculated the p-value using n, the T-statistic, and the degrees of freedom. Thus, this quantitative method will exhaustively examine the relationship between the Israeli educational budget and Bagrut exam scores regarding various ethnic groups in Israel.

4. Results

4.1. Variable Trends over Time

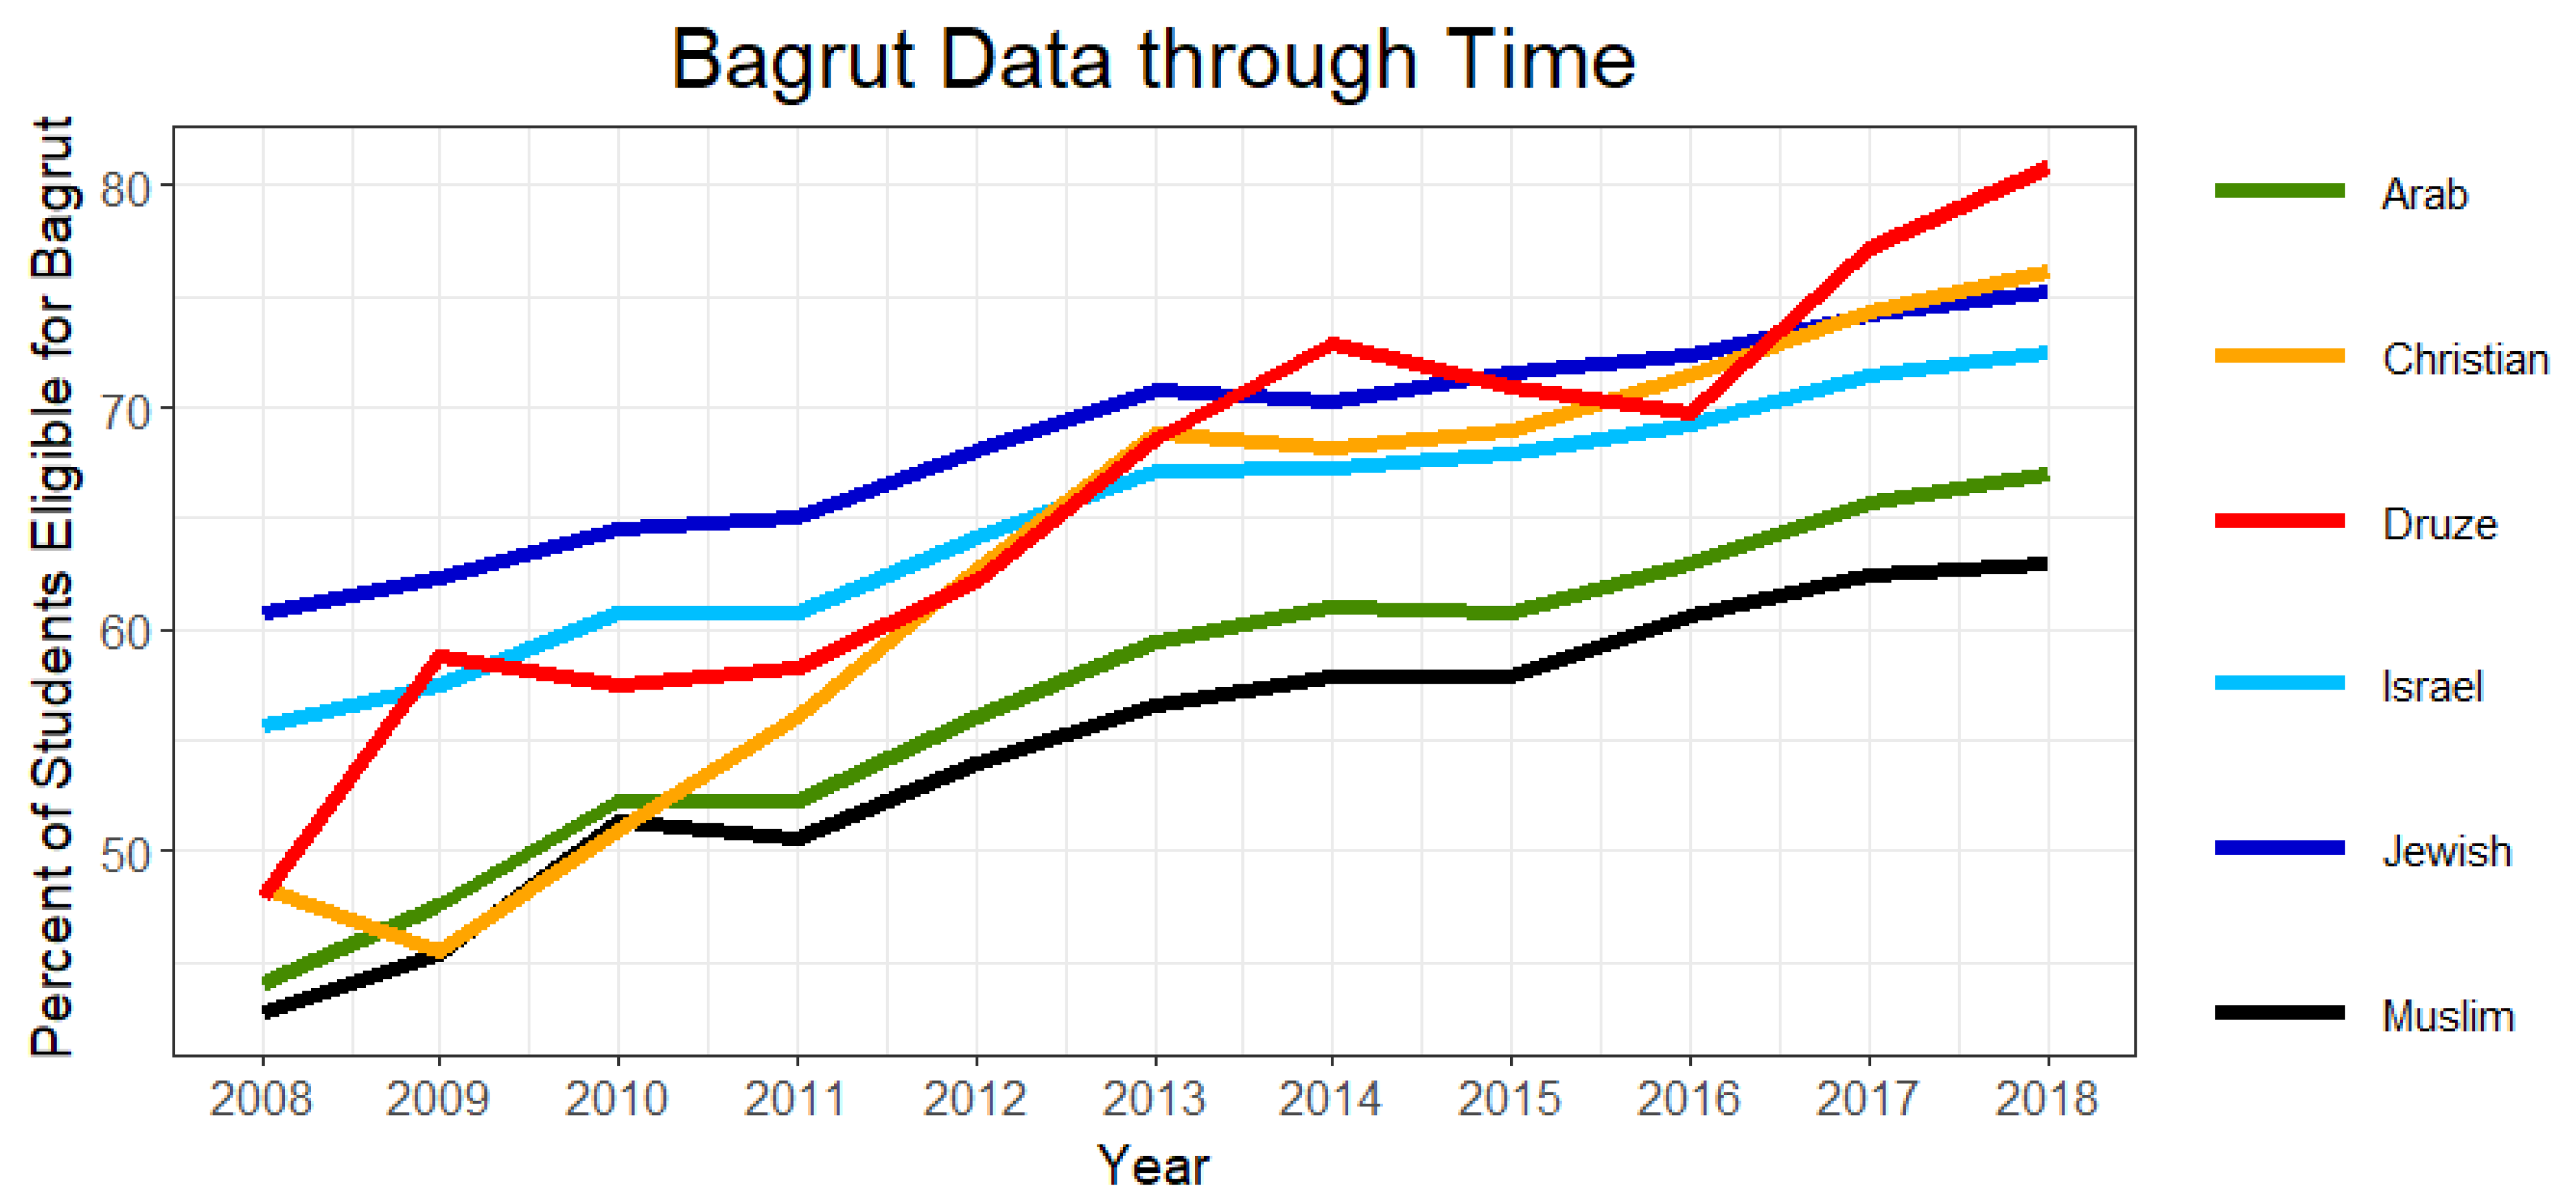
4.1.1. Bagrut Data through Time

Since 2008, test scores in Israel have steadily increased across all demographic categories. The data in Figure 3 indicate that the most significant increase has been in Arab communities. However, despite the evidence for improvement in some Arab Israeli communities, the majority still trail behind their Jewish counterparts. From 2008 to 2018, Jewish schools increased from 60.8% to 75.2%, a percentage increase of about 19%, while Arab schools increased from 44.1% to 67.0%, an increase of about 34%. Within Arab society, however, there is a disparity in the extent of that increase. Muslim communities grew the least, with an increase of 48%, while the Druze surged upward with 67%. With the range of growth across Arab communities, Muslims, who occupy most Arab localities in Israel, have just recently passed average Jewish test scores from 2008. However, the Druze communities surpassed the Jewish test scores in 2018. In summary, advancement in test scores presents a positive prognosis for equity in Israel. However, when examining separate demographic groups, inconsistency within Arab subgroups suggests that educational achievement is complex beyond the Jewish/Arab binary.

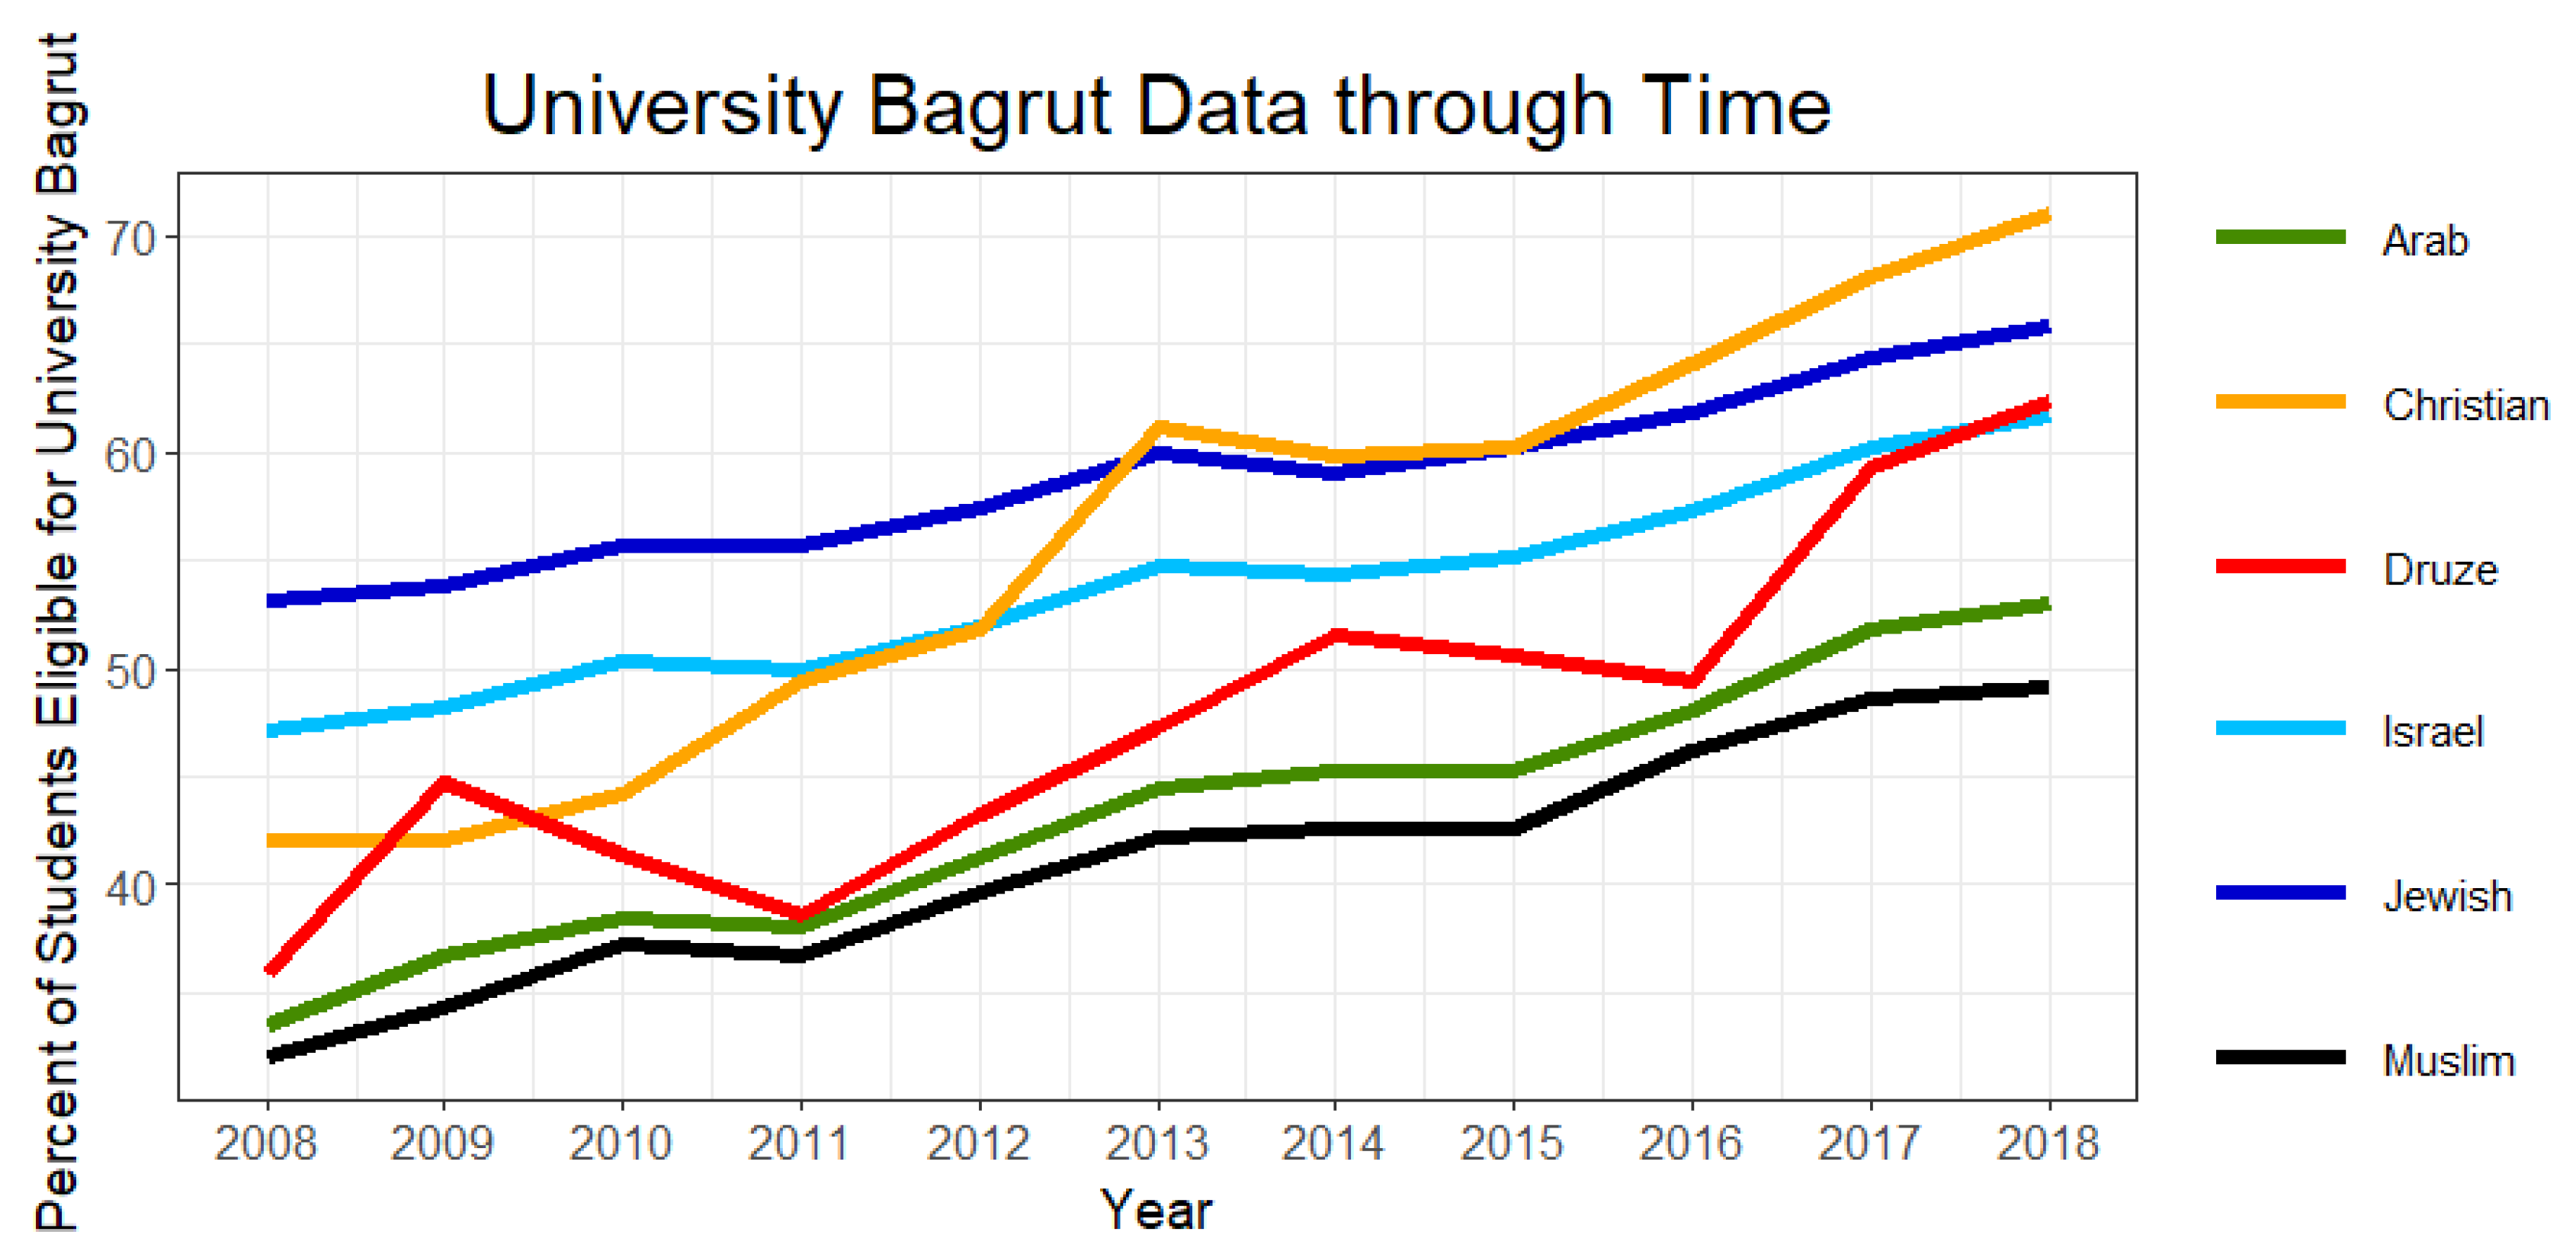
4.1.2. University-Eligible Bagrut Data through Time

Similar to the trends for general Bagrut data, the percentage of matriculation certifications eligible for university acceptance has also increased across all Israeli communities (Figure 4). However, once again, there were different trends amongst the subgroups of Arab localities. Within the Jewish/Arab binary, the percentage of university-eligible matriculation certificates increased by 24% (53.1% to 65.9%) in Jewish localities and 58% (33.5% to 53.0%) in Arab localities. Interestingly, the Jewish percent increase is close to the increase for the standard Bagrut results, while the Arab increase was higher at the university level. The drastic incline appears to be evenly attributed to increased test scores across all Arab subgroups. Muslim localities increased by 53%, and Druze localities increased by 73%, which are both higher than the previous increases.
Nevertheless, even with these massive improvements, the Druze community still lagged behind the Jewish average in 2018. The Muslim community has yet to hit the average for Jewish schools from 2008 (53%). Overall, the university Bagrut scores exhibit a similar increase to the standard Bagrut, except for the Druze community, who have extended their upward reach even more. However, unlike the standard Bagrut, no Muslim community has caught up with Jewish averages in the same way. Thus, while improvement in achievement appears exhaustive, these data indicate that there are still notable achievement gaps between Arab and Jewish schools, particularly between Muslims and Jews.

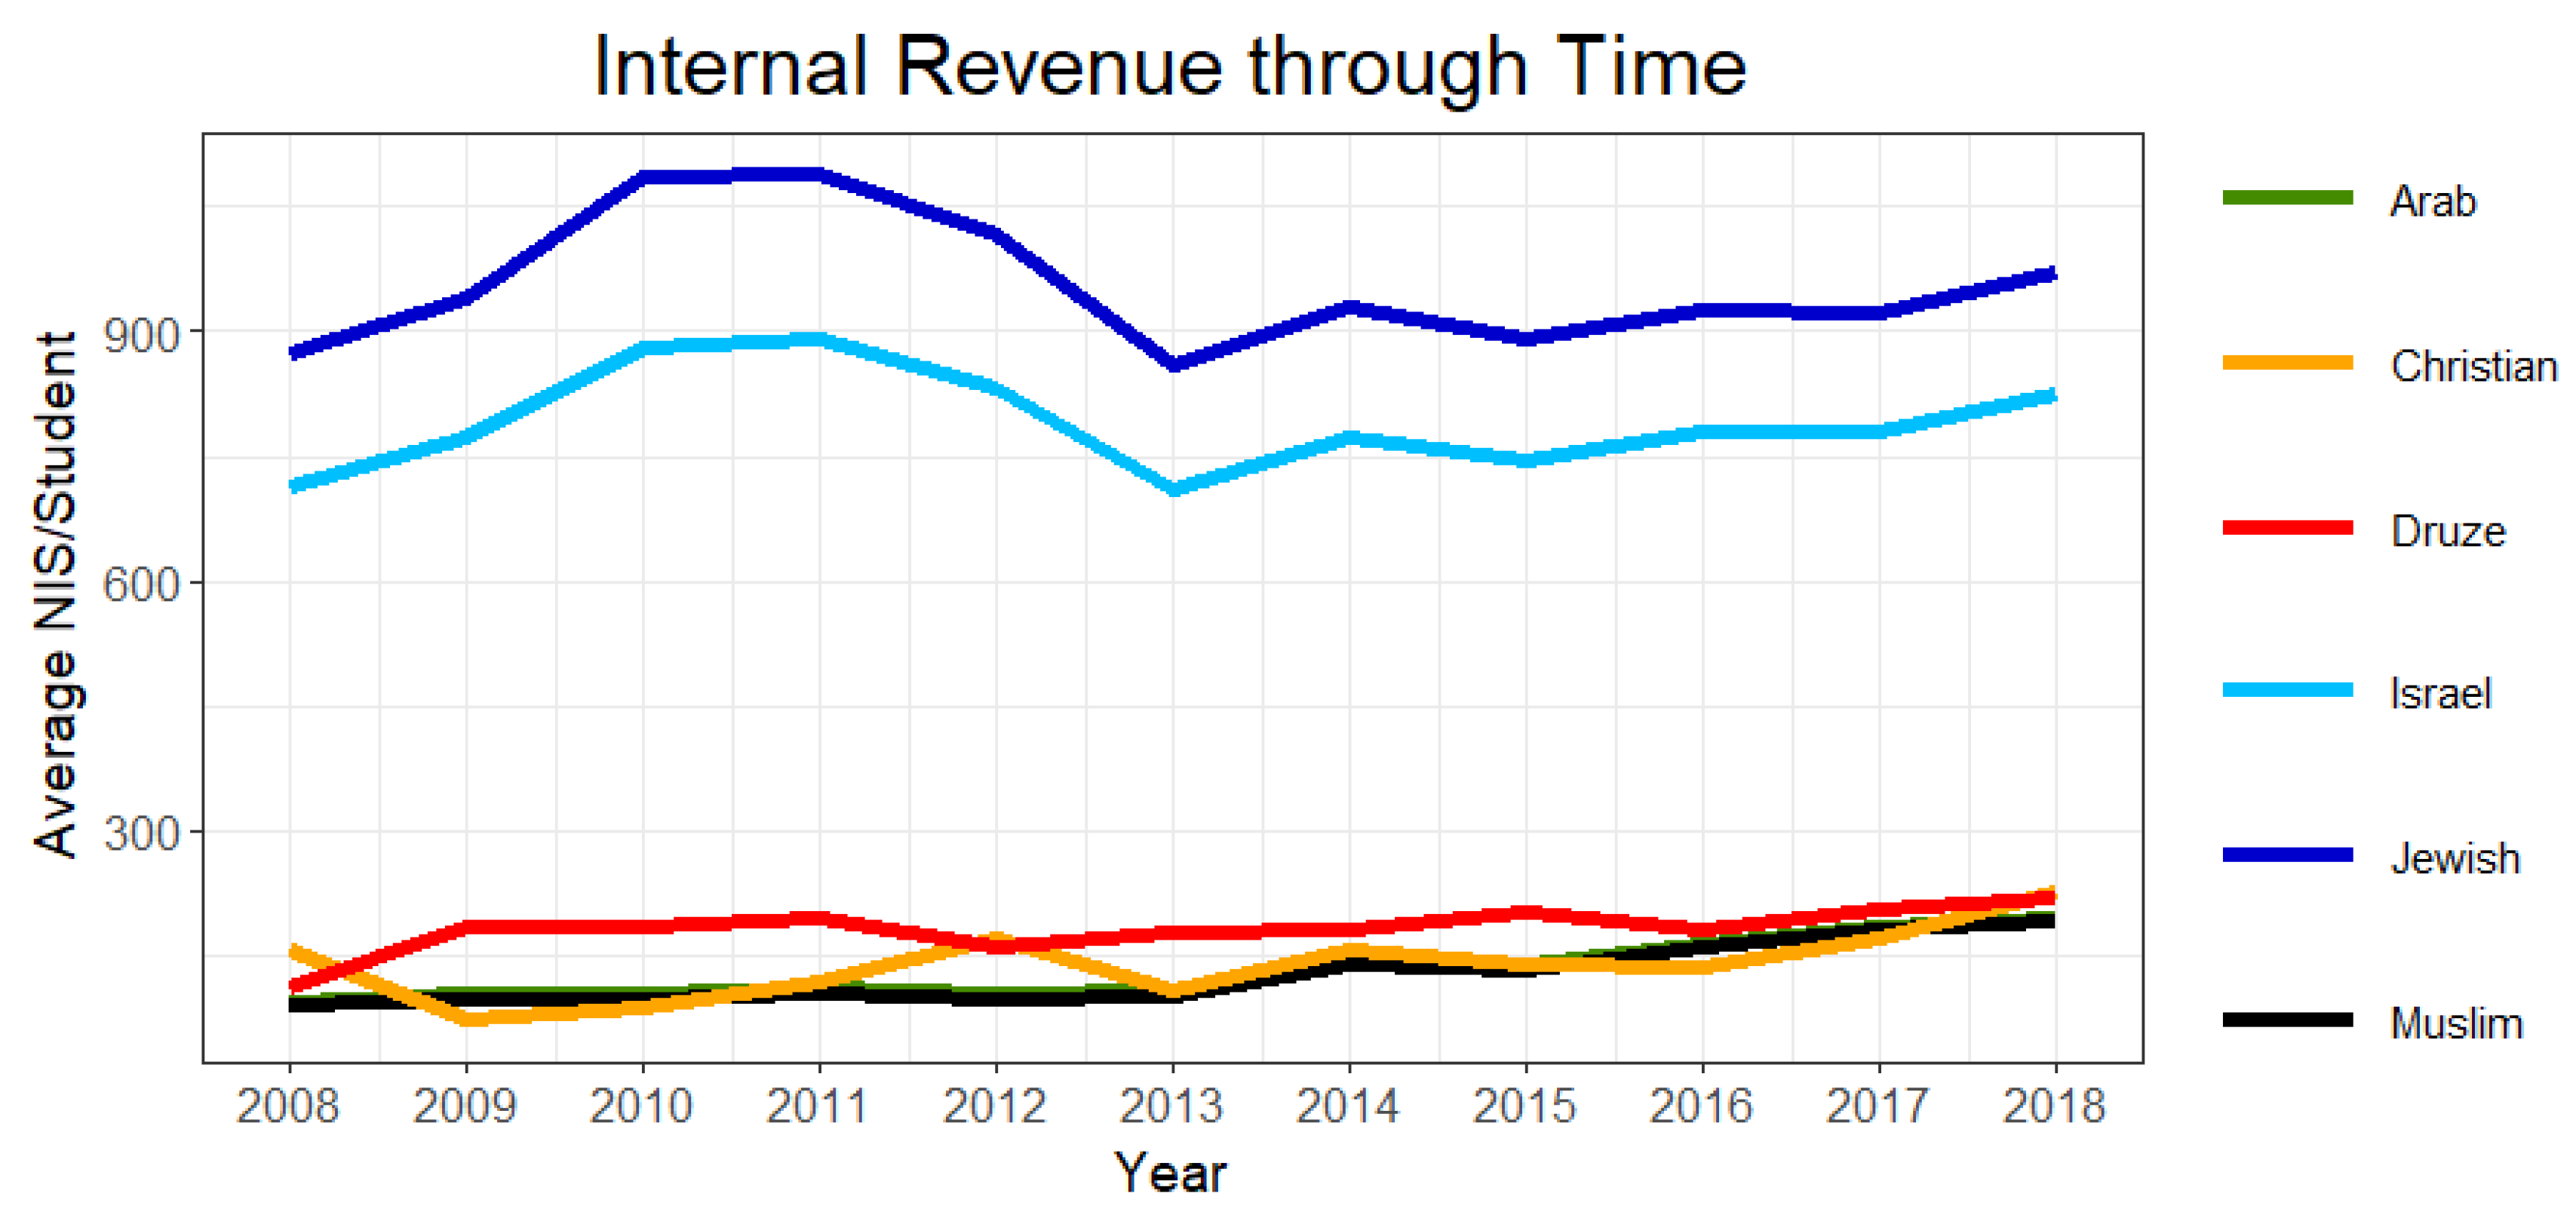
4.1.3. Internal Revenue for Education through Time

Among all of the variables for this research, internal revenue was the only one that did not demonstrate a general upward trend or exhaustive percentage increase from 2008 to 2018. In addition to this time-series flatline, the graph for these data (Figure 5) also very clearly demonstrates a chasm between the internal revenue of Jewish and Arab localities. Across the demographic controls, all of the categories had a net positive increase from 2008 to 2018. The most severe increases in internal educational revenue included +106% in the general Arab category, +111% in the Muslim category, and +97% in the Druze category. While these trend lines represent only constant uncertainty, the most distinct pattern is the difference between Arab and Jewish communities. No Arab subgroup acquires even half of what Jewish communities collected in 2008 (873.7 NIS/student). This collection of budget observations demonstrates the most extreme levels of stagnation over eleven years. Furthermore, internal revenue indicates one area where Arab and Jewish communities diverge extremely.

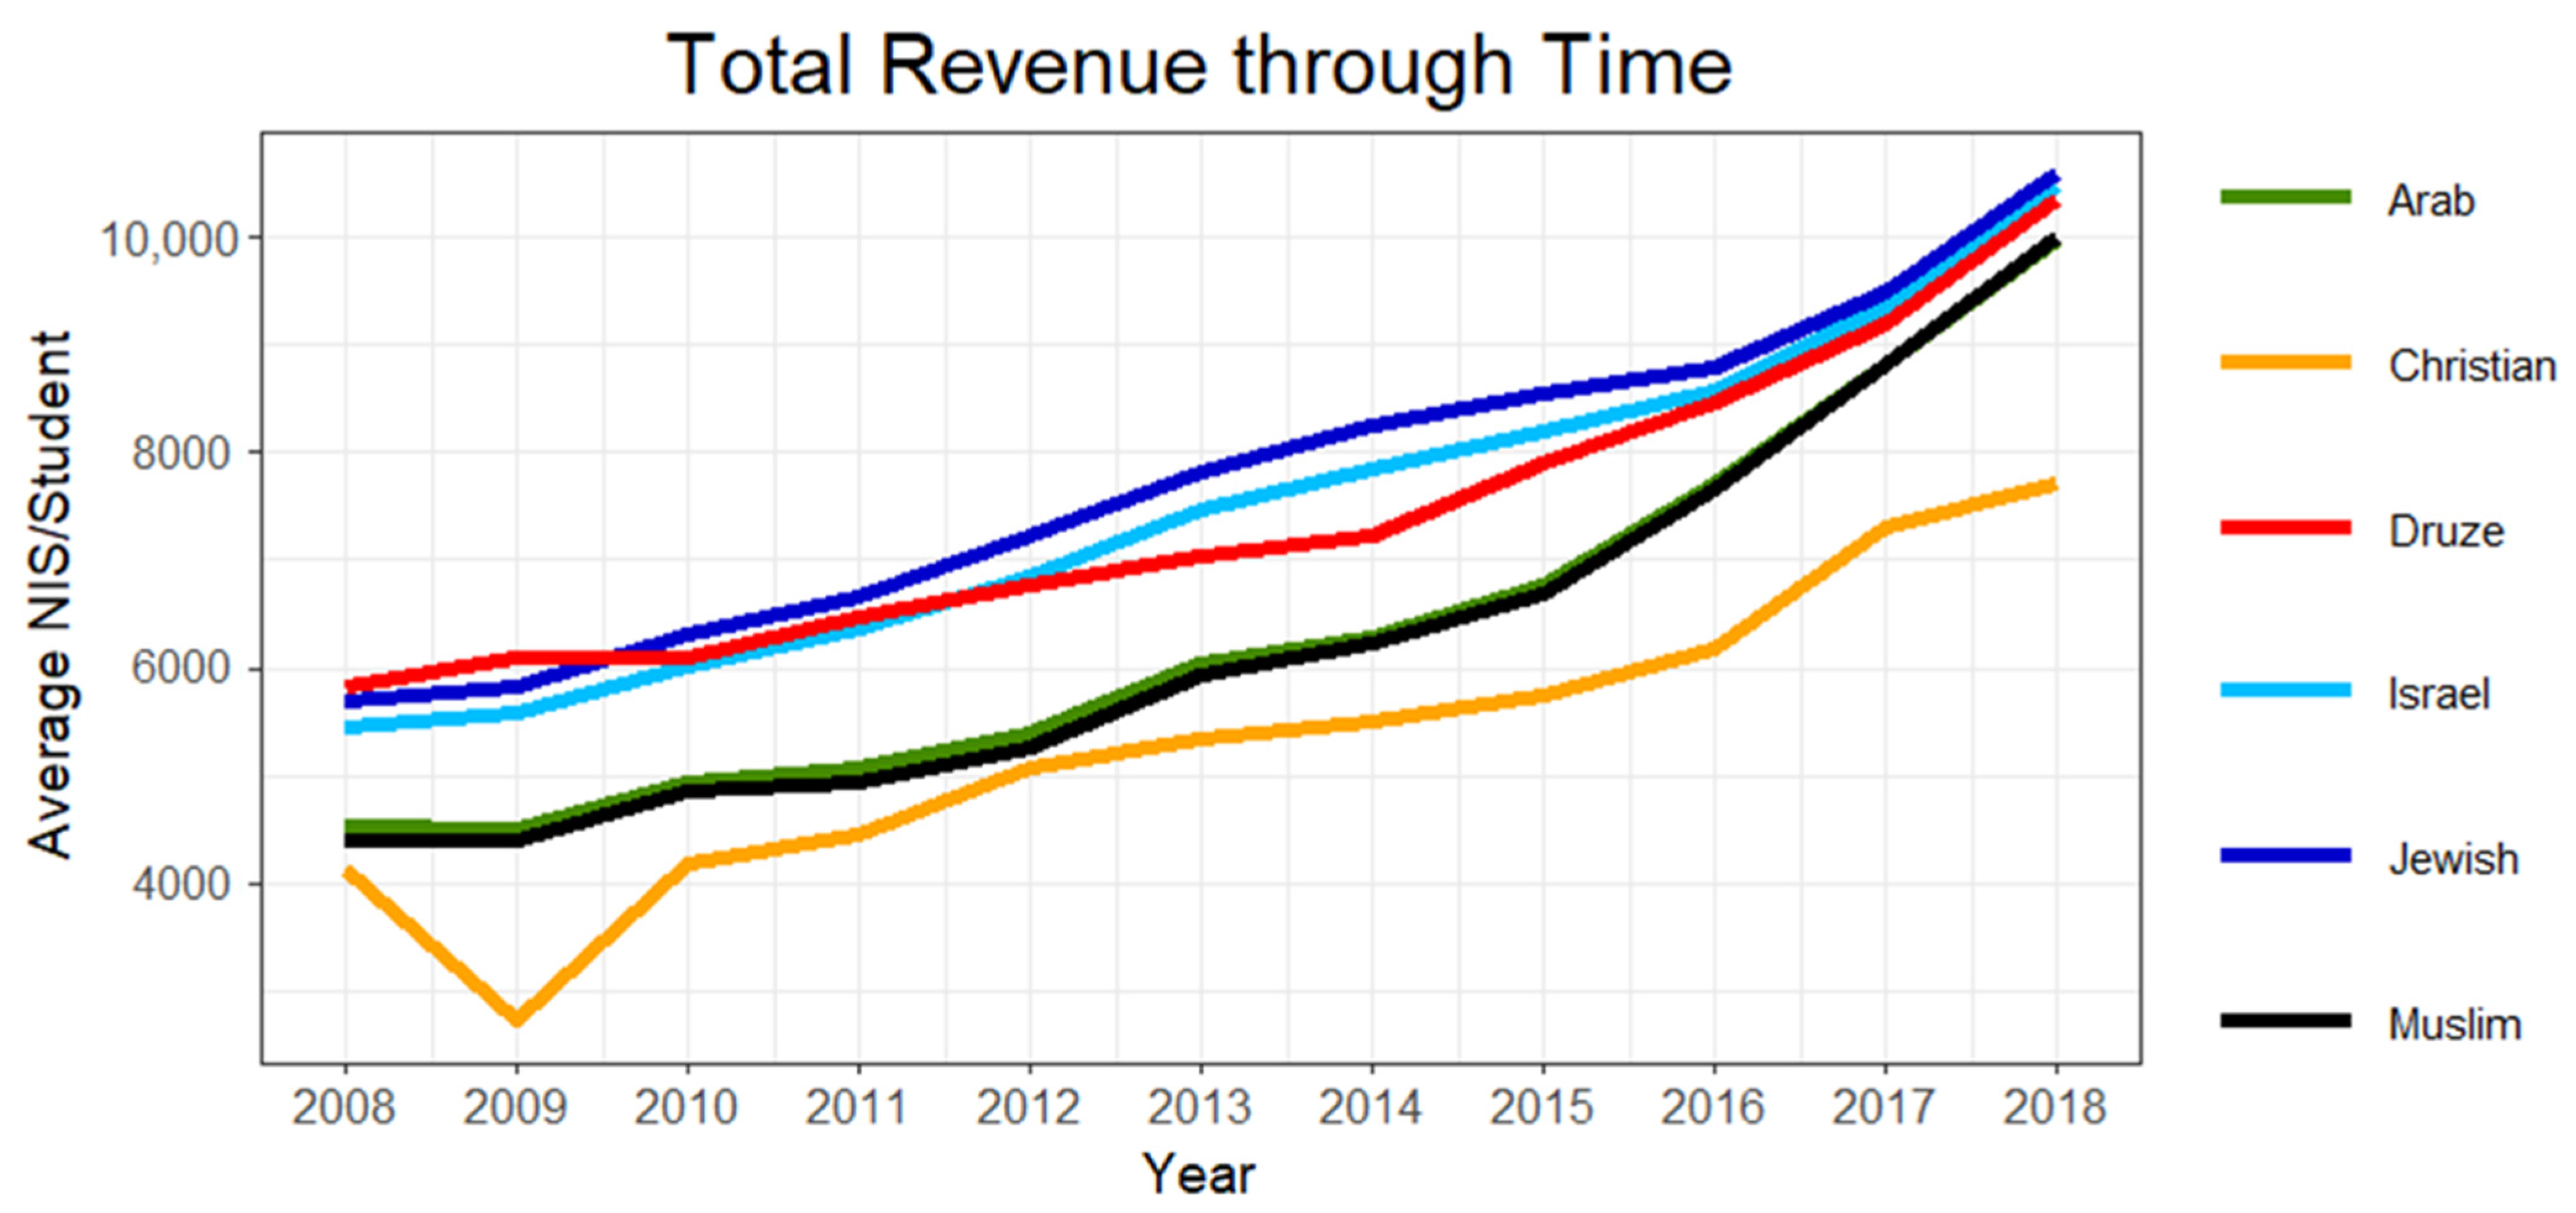
4.1.4. Total Revenue for Education through Time

Straightaway, the data for total revenue return to a more consistent upward trend than that for internal revenue (Figure 6). Except for Christian communities, by 2018, nearly all demographic categories converged into the same level of revenue per student. The most significant increases from 2008 to 2018 were in the general Arab and Muslim communities, who more than doubled their total revenue (119% and 126% increases, respectively). The smallest increase was in Druze localities, with a 77% increase. As the smallest demographic representation shown in the graph has the lowest average total revenue per student, the Christian trend hardly affected general Israeli and Arab trends, with all of the other five categories settling closely to 10,000 NIS/student. The total revenue demonstrates a very different trend than the local revenue, with tangible evidence of growing equality across demographic variables. Considering the previous discussion on internal revenue and the persisting divide between demographic communities, the equalizing trend is likely attributed to the other factor in calculating total revenue: The Ministry of Education.
Considering the lower internal revenue in Arab communities and the equalized total revenue across all categories, reasoning suggests a potential equitable strategy within governmental budget allocation over the last 11 years. In 2008, Jewish and Arab revenue sourced about 15% and 2% of their revenue within their own communities, respectively. In 2018, the numbers dropped to 9% and 2%, allowing governmental funds to occupy a greater majority of the total revenue. Specifically, in 2008, the Ministry contributed slightly less money to Arab localities than Jewish localities per student (4810.4 NIS/student vs. 4447.4 NIS/student). In 2018, the Ministry contributed slightly more to Arab schools than Jewish schools (9608.0 NIS/student vs. 9764.0 NIS/student). By comparing internal to total revenue over time, the variation indicates positive attention towards Arab communities.

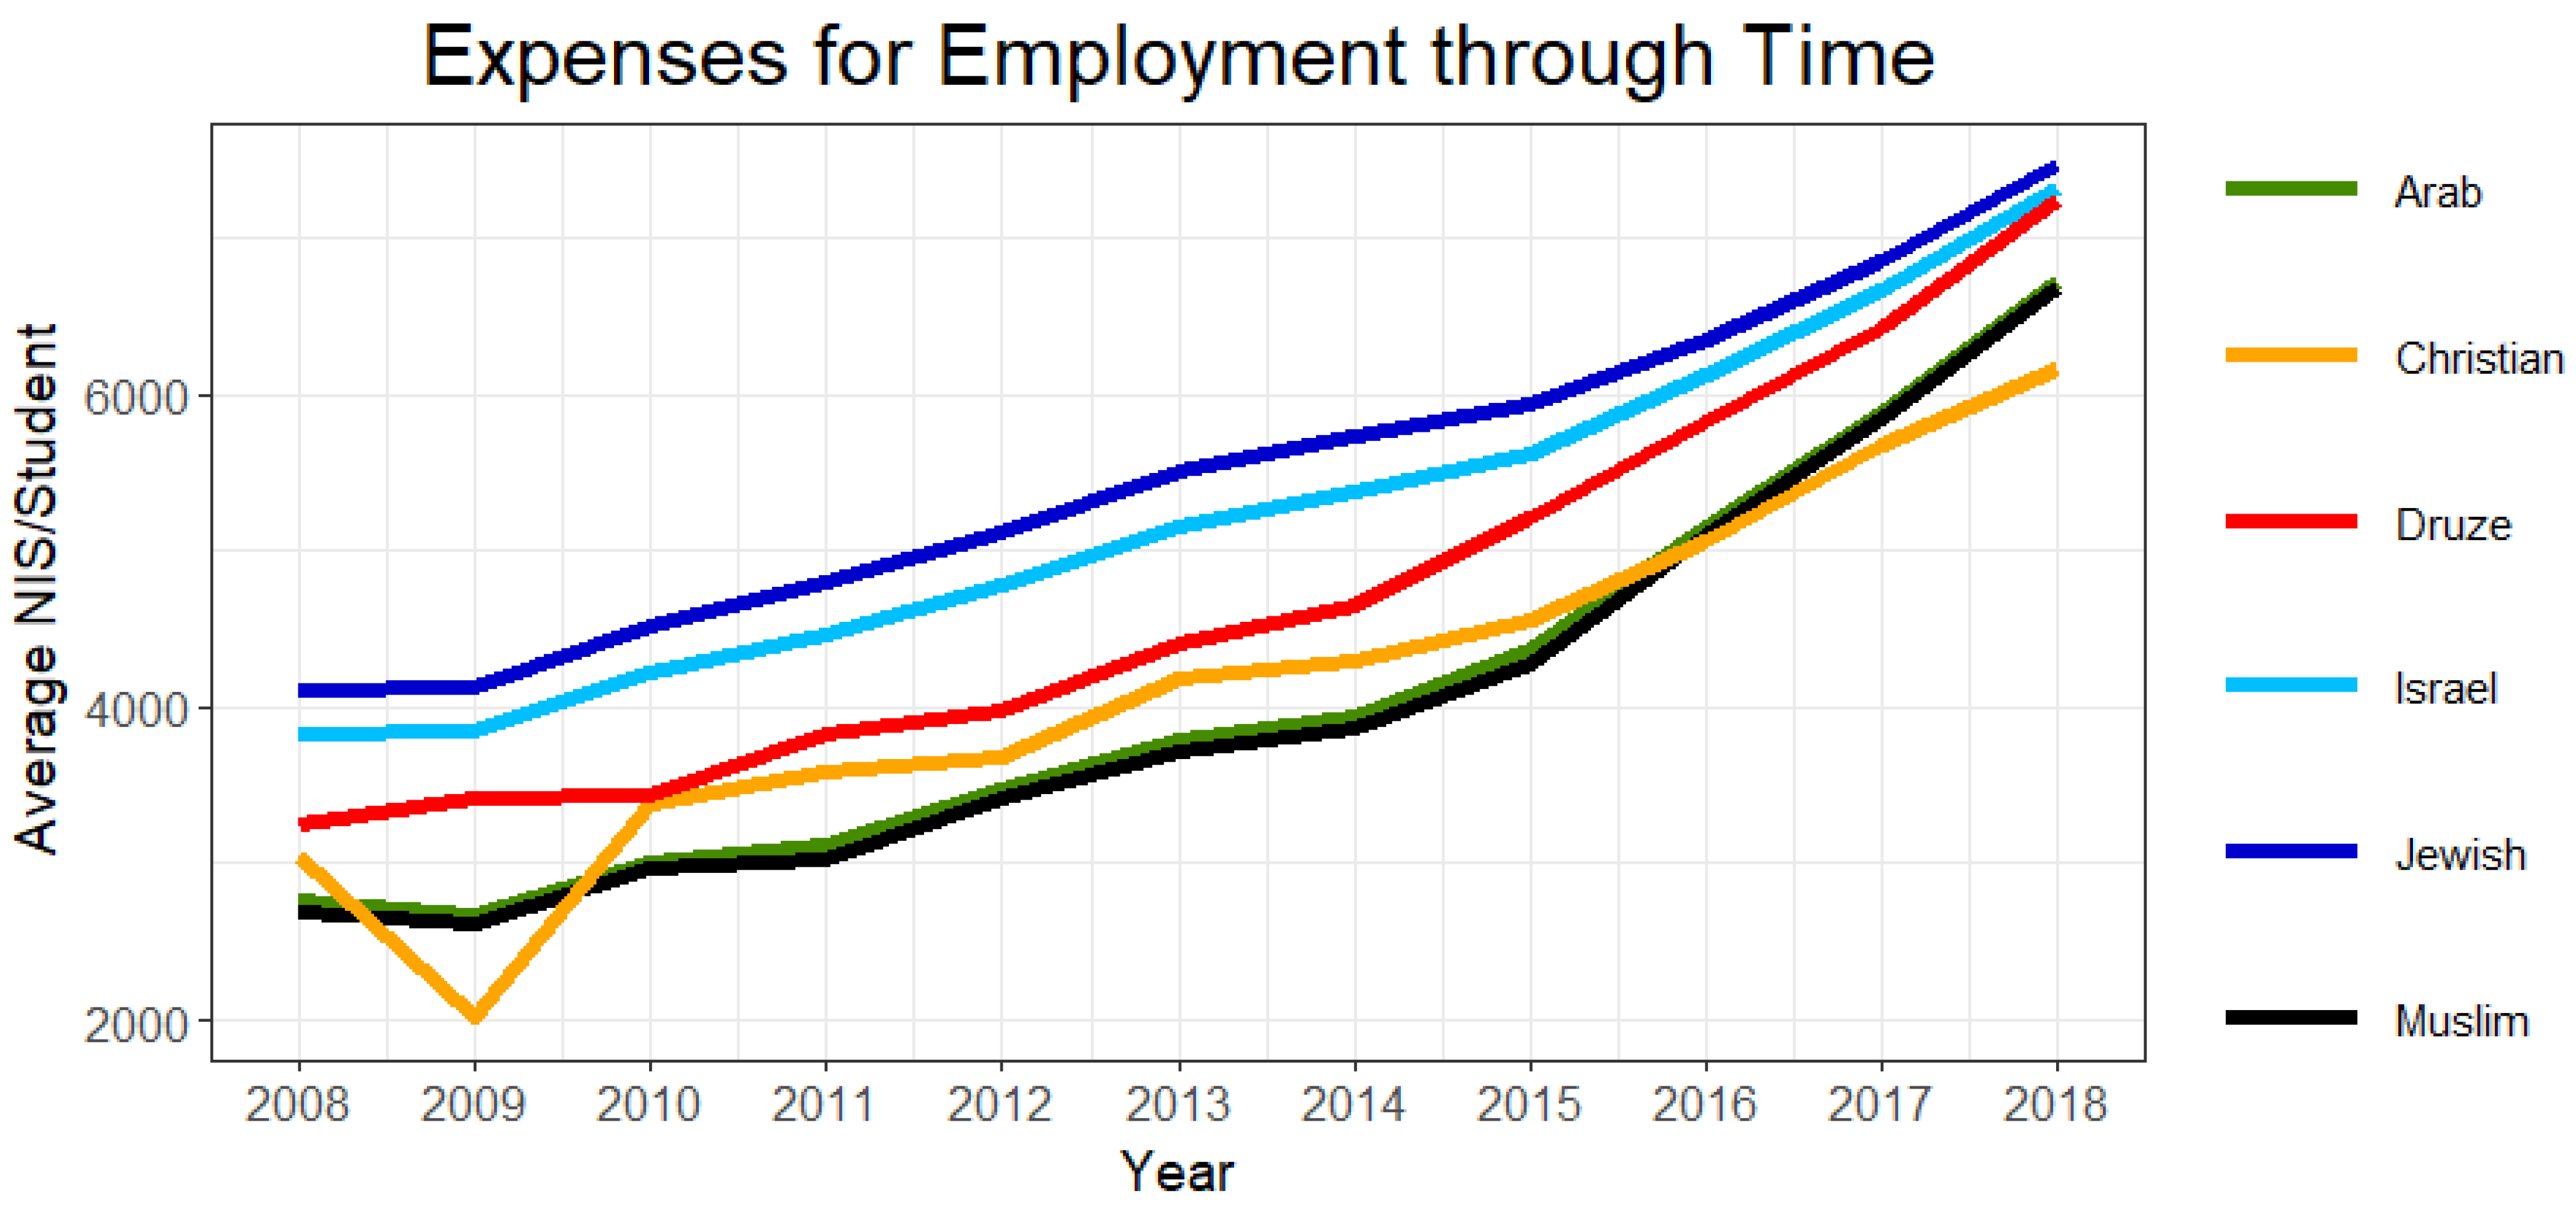
4.1.5. Expenses for Employment in Education through Time

Expenses for employment within education showed the most consistency across all demographics, with a steep upward trend (Figure 7). By 2018, though some Arab communities still trailed below the Jewish trend, the Druze again exceeded it. Across the 11 years, the greatest increase in employment expenses was in Arab communities, with +148% (Muslim), +103% (Christian), and +122% (Druze) rivaling the Jewish +82% increase. In the most recent year of measurement, Druze and Jewish schools now spend the most on employment per child, and all other Arab communities have far exceeded the Jewish averages from 2008. This budget variable demonstrated another element of substantial variation over time. More importantly, these data highlight another instance wherein the Druze community has differentiated themselves from other Arab groups, even going as far as to dwarf Jewish averages.

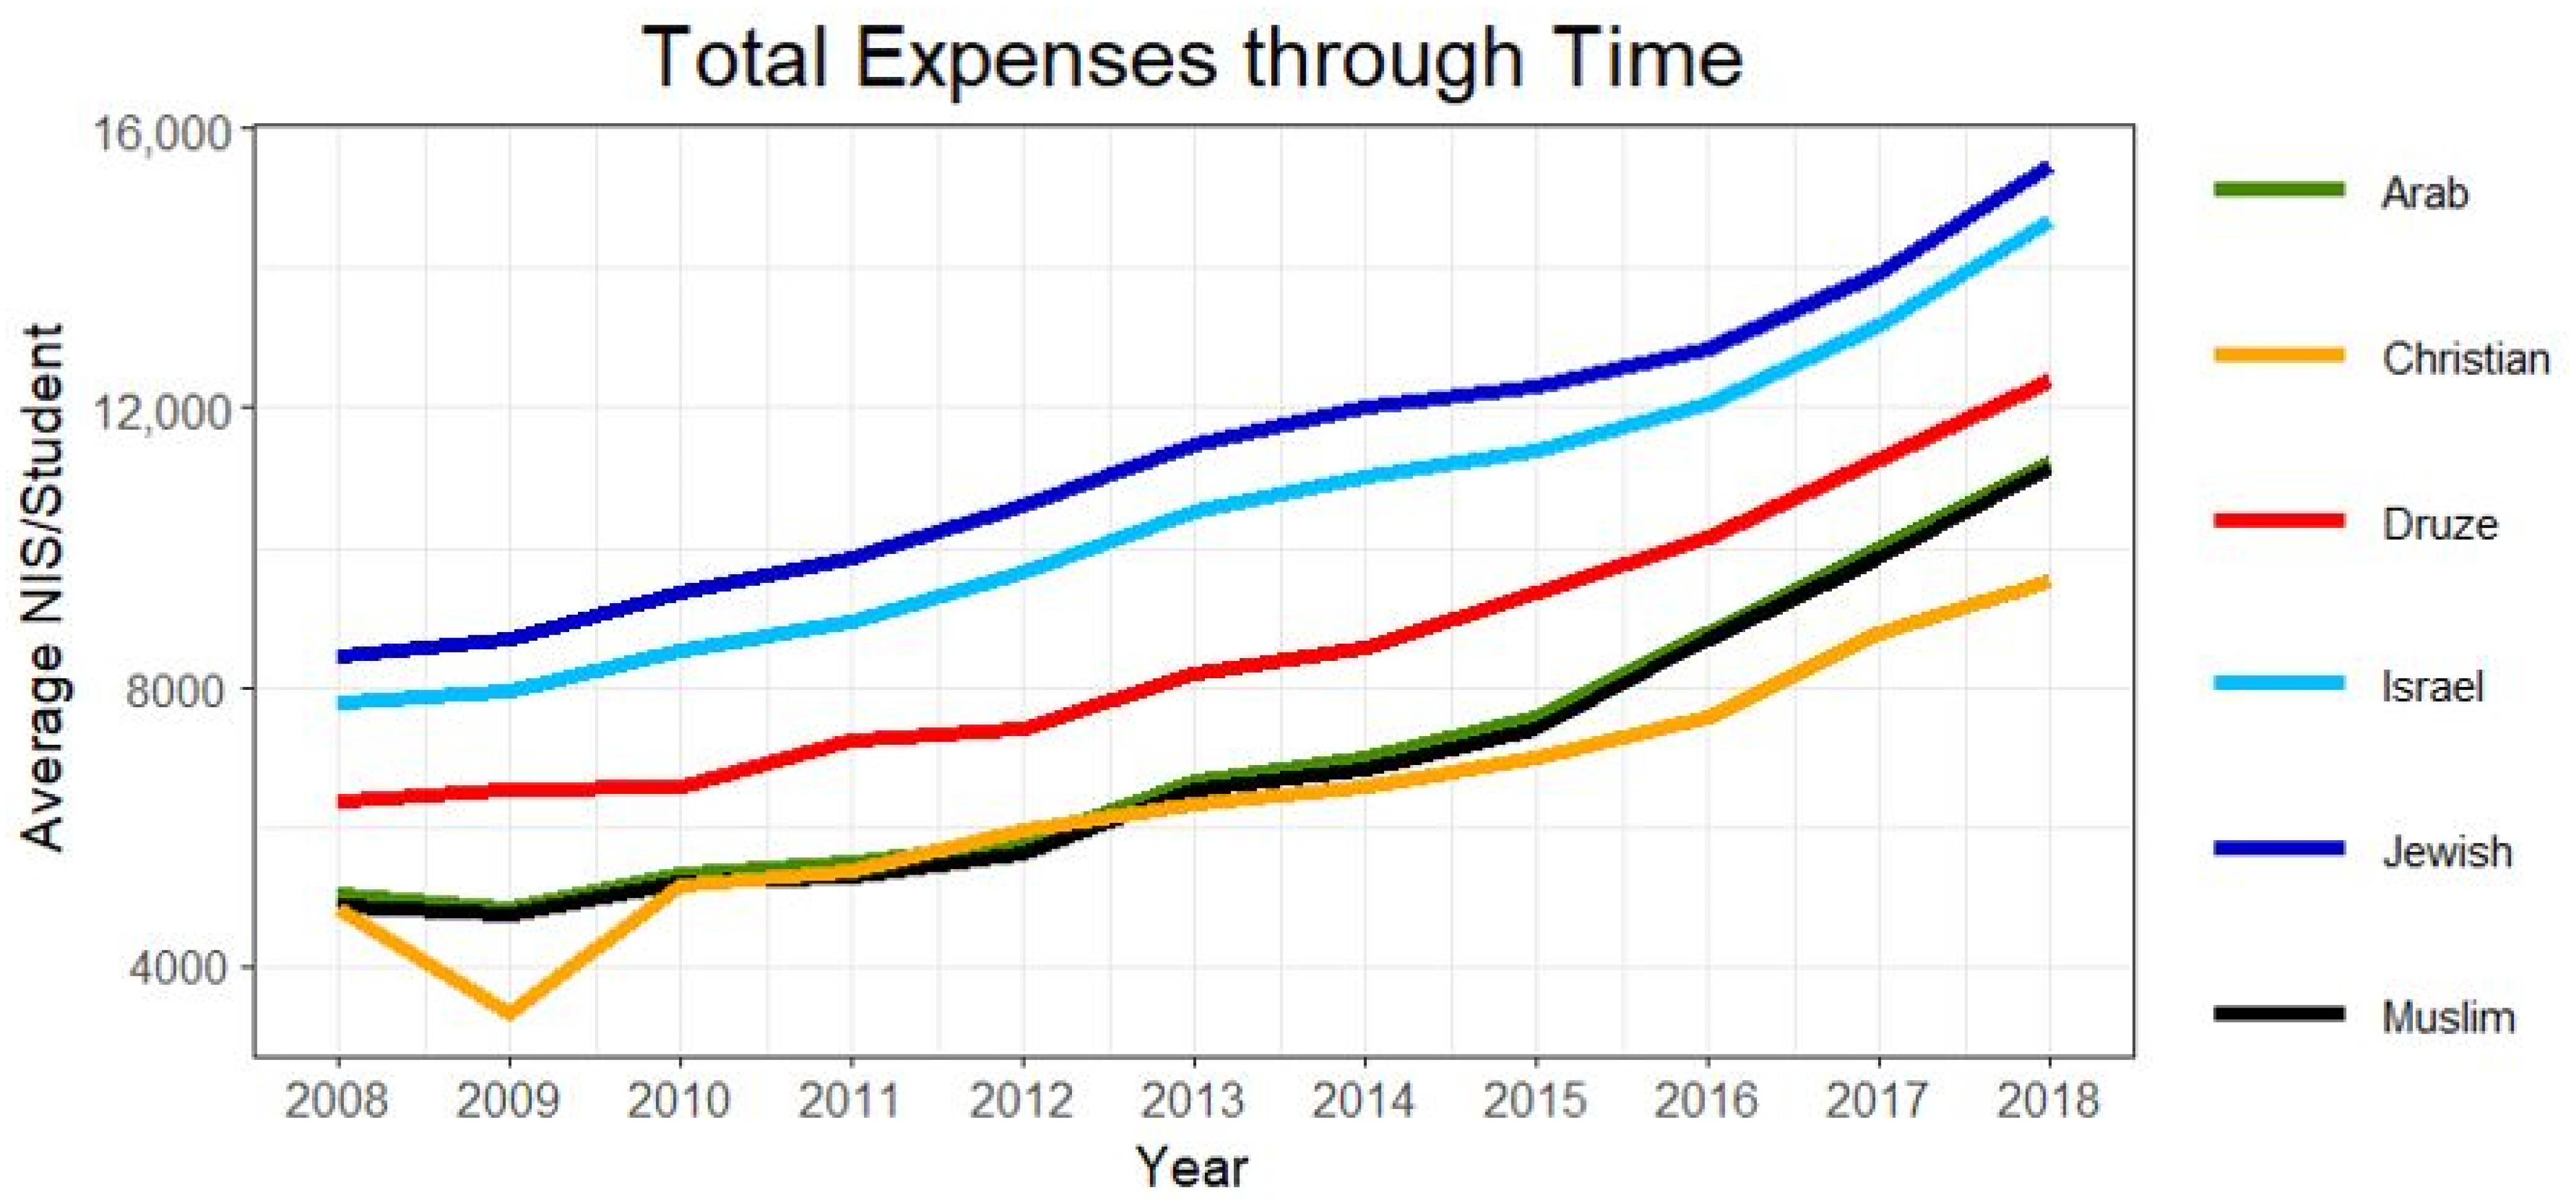
4.1.6. Total Expenses for Education through Time

Similarly to employment expenses, the total expenses also exhibit an upward trend across all communities (Figure 8). However, even with the Arab increase, there continues to be a significant difference between the spending of the majority and minority demographic populations. Once again, Muslim and Druze localities doubled expenses from 2008 to 2018, whereas Jewish localities increased by 83%. All three subgroups of Arab populations exceeded the Jewish starting point in 2008 (8459.6 NIS/student), but none were close to catching up with average Jewish spending in 2018. The expense averages reveal new trends, such as general upward momentum and a hearty Arab increase. However, when comparing total spending to employment spending, Druze and Jewish localities appear to spend the budget allotments differently.
These trends are partially explained by the professionalization of teachers in Arabic teaching schools. Here is a comparison between school years 2009–2010 and 2019–2020: the number of teachers without an academic degree decreased from 15.7% to 2.9%, the number of teachers with a BA decreased from 67.5% to 60.9%, and the number of teachers with an MA increased from 13.7% to 34.8% in 2019–2020. The gaps with teachers in Hebrew teaching schools has narrowed (6.8% with no degree, 55.1% with a BA, and 37.4% with an MA) [54]. The professionalization of teachers among Arab schools helped teachers get higher salaries, as per the Israeli Ministry of Education policies. As we will show in the next section, the higher salaries are for teachers with higher education compared with the previous cohort of less-educated teachers. The more-educated teachers are helping their students succeed better than the less-educated teachers.
On average, Jews use a smaller portion of their expenses for employment compared to Arab populations. Additionally, Jewish communities have used about the same proportion between employment and other expenses over time, whereas Arab communities have significantly increased the portion allotted for employment. In 2008, Jewish communities focused about 49% of their expenses on employment, and in 2018, about 48%. For the Druze population, chosen because of their tremendous increase in Figure 7, the expenses channeled into education rose from 51% to 59%. Prioritizing employment in Arab communities makes sense, as minority districts have infamously been prevented from bare-minimum educational amenities. In other words, Jewish communities do not focus the majority of spending on employment because they already have those needs met, whereas Arab areas historically do not. Thus, the Jewish budget likely can fund other projects and resources outside of the necessities (i.e., teachers).
Overall, observing test scores and budget variables over time yields a notable amount of variation—this is the first step in the process to determine whether the two factors unveil an interesting relationship. In organizing the data by demographic information, the research establishes the similarities and differences across ethnic communities. Regarding the Bagrut, certifications are increasing across the board, but achievement gaps still exist for most Arabs on the standard Bagrut and all Arabs on the university-eligible Bagrut. Furthermore, within the expenses section, comparing total values to employment values revealed that the two communities appear to spend money differently, even with similar rising patterns between Jewish and Arab localities. Lastly, comparing each of the ethnic groups, in summary, the data suggested that, across most variables, the Druze show the most consistent growth, even to the point of surpassing Jewish averages. Ascertaining variation through this time series opens up the following analysis stage: visualizing correlation.

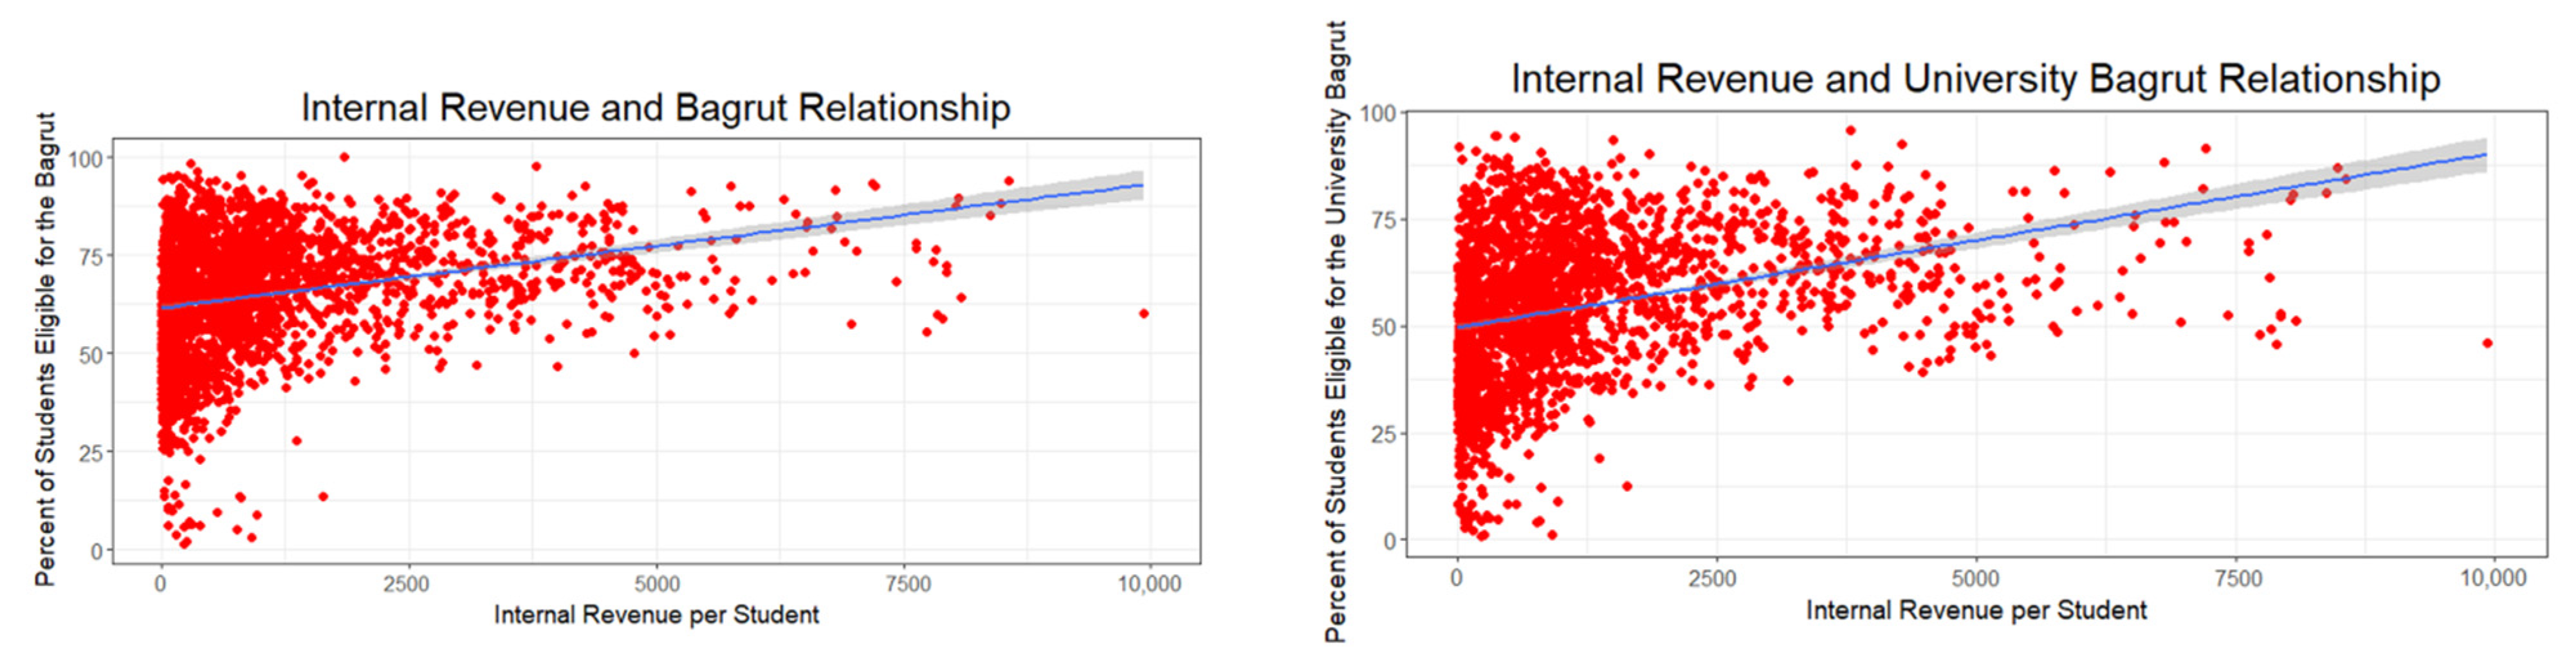
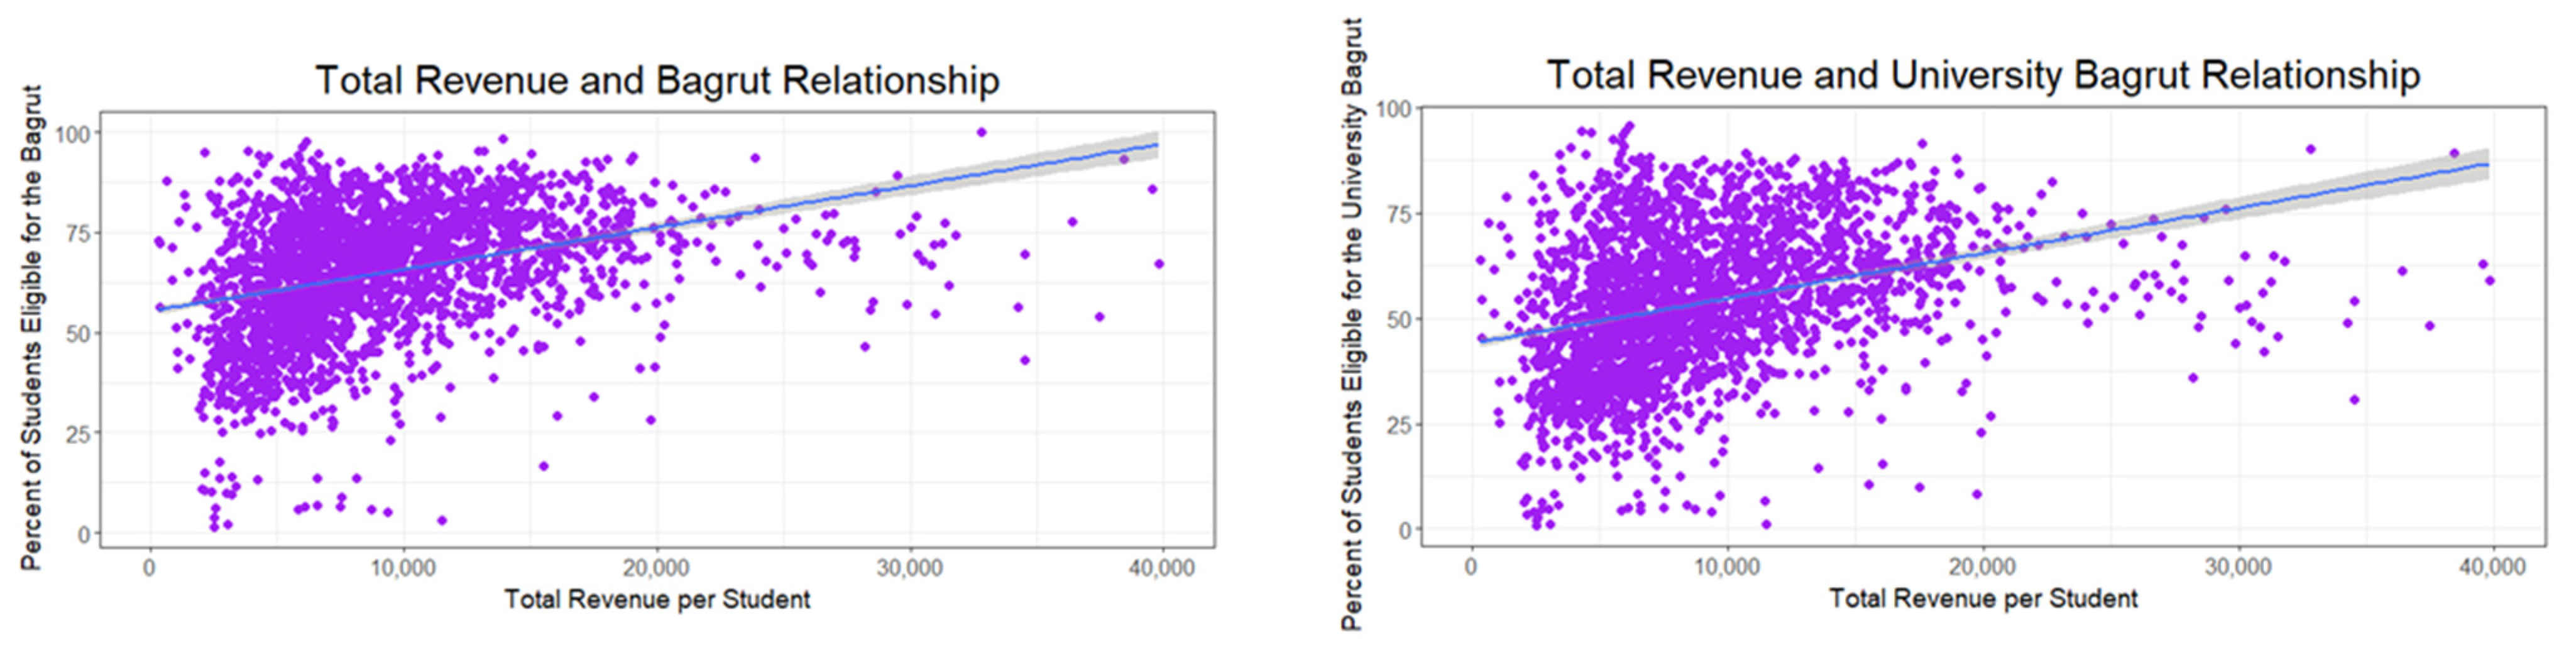
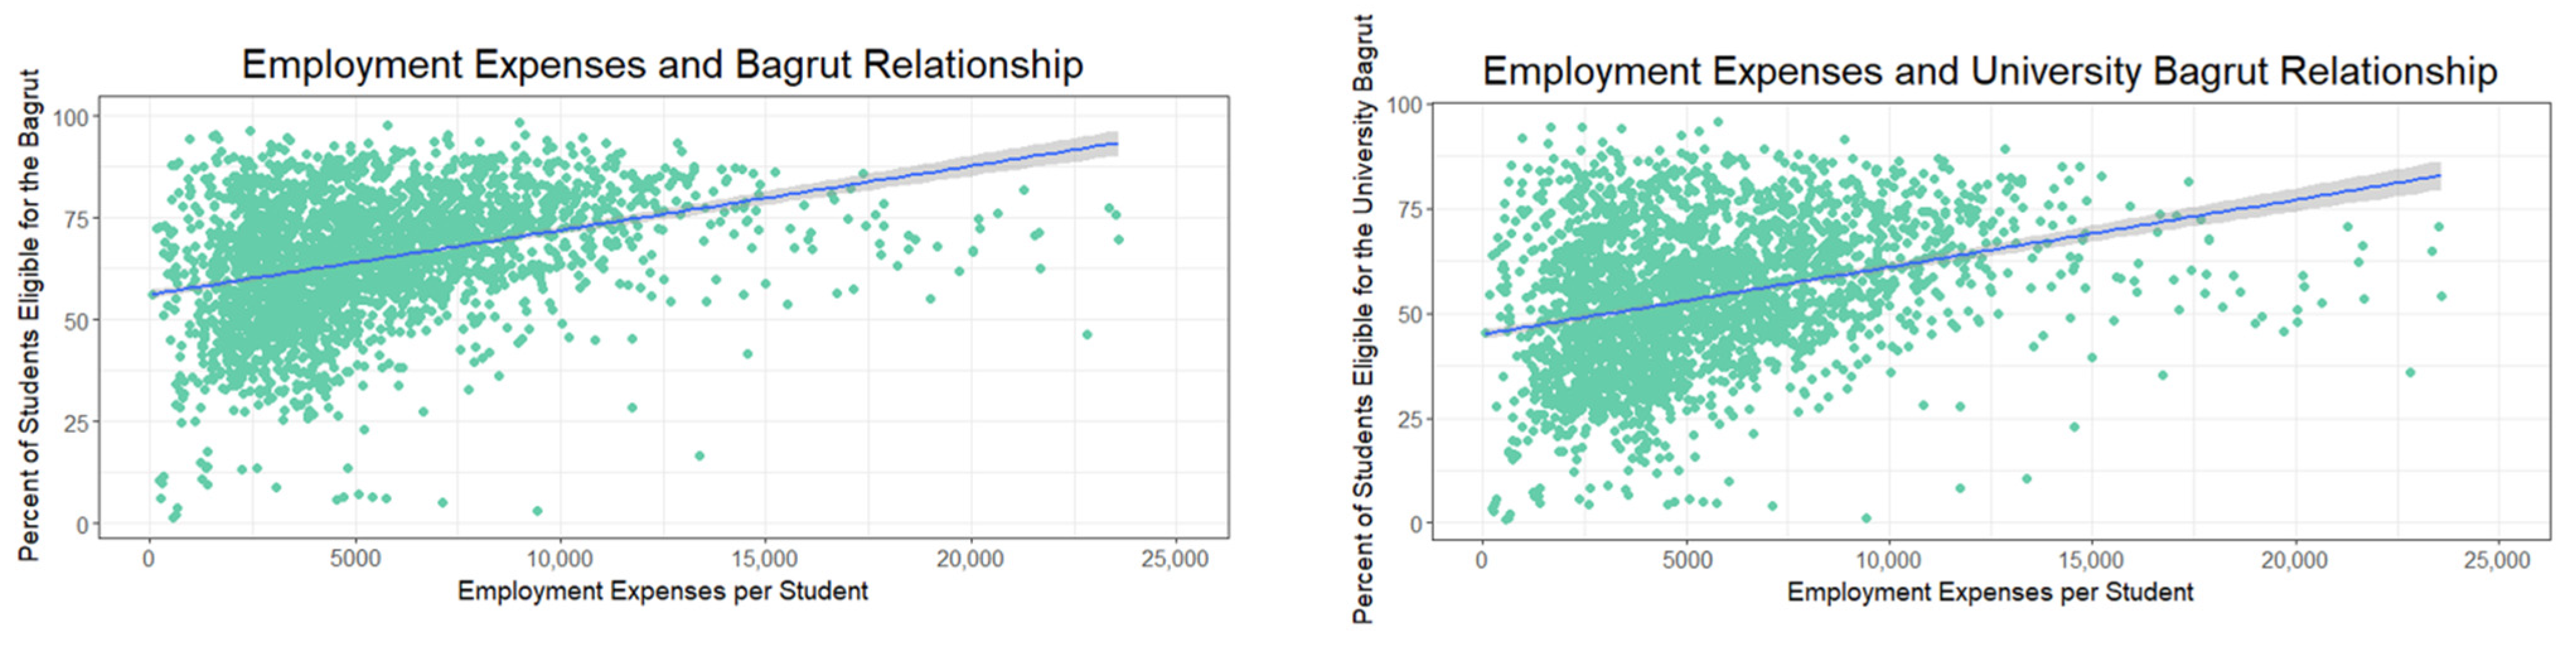
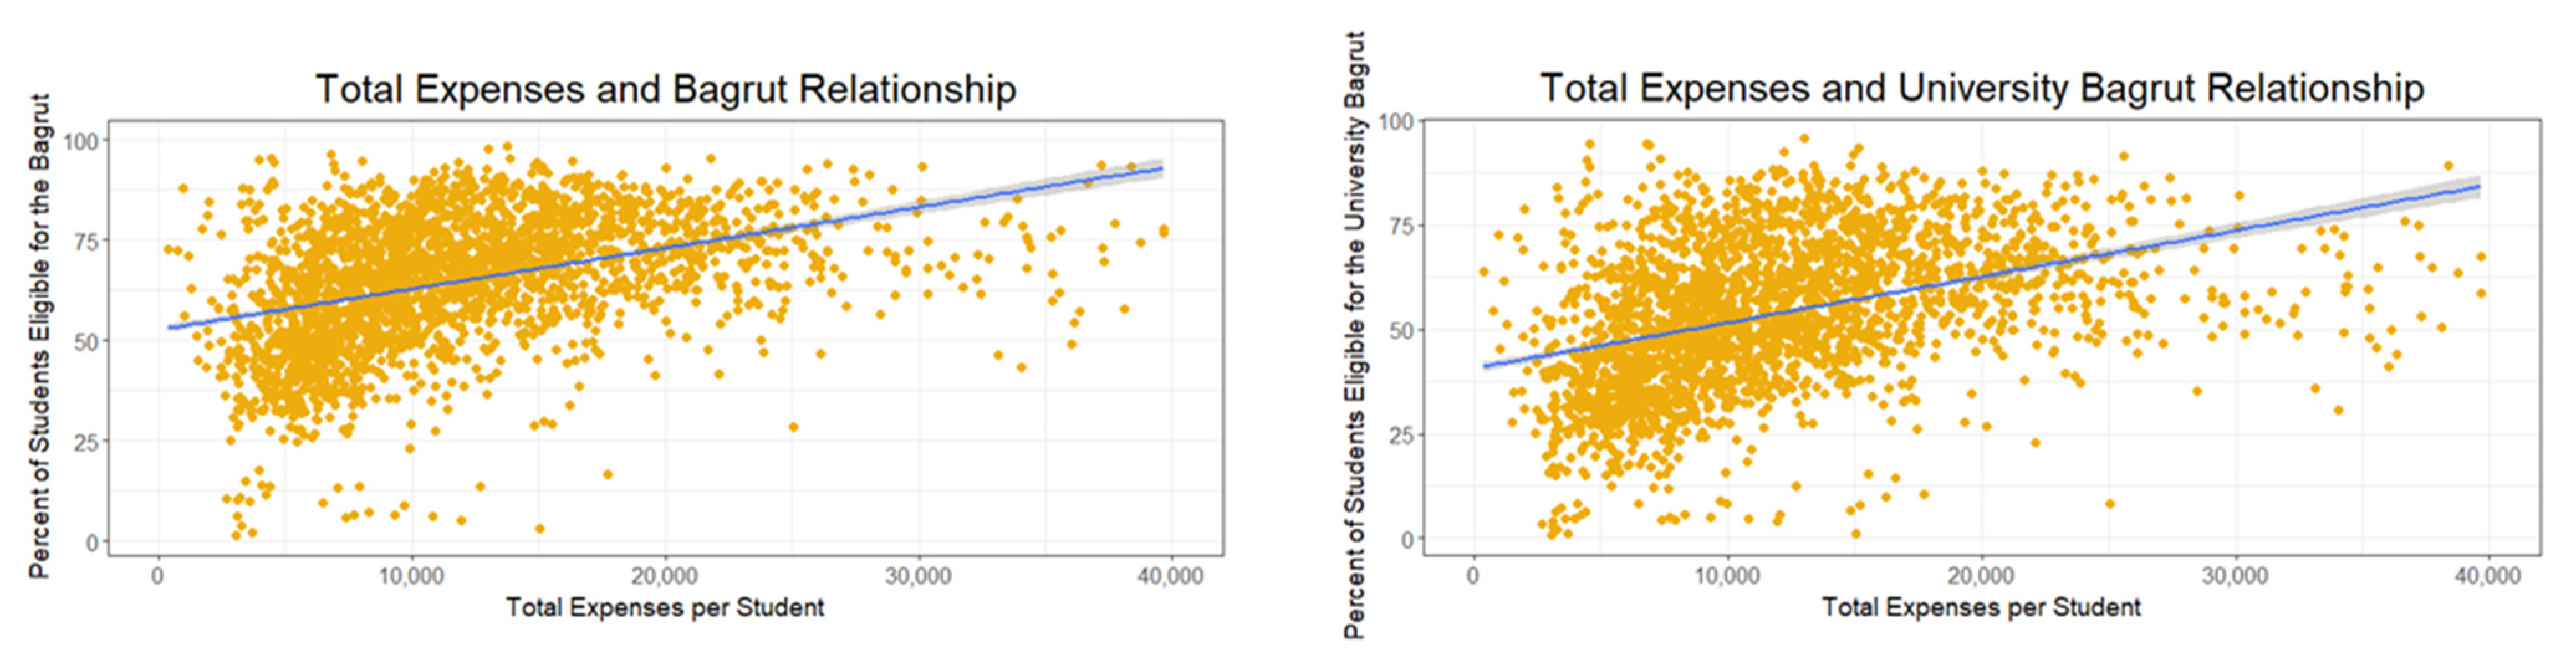
4.2. Relationships between Budget and Bagrut Test Scores

The following graphs (Figure 9, Figure 10, Figure 11 and Figure 12) visually indicate the existence of a possible positive correlation between the budget and the test score, irrespective of year and demographics. The positive correlation is represented by the upward-sloping regression line, indicating that as the budget increases, so do test scores. This remained true for all of the following relationships: internal revenue for education and standard Bagrut certificates, internal revenue for education and university Bagrut certificates, total revenue for education and standard Bagrut certificates, total revenue for education and university Bagrut certificates, employment expenses for education and standard Bagrut certificates, employment expenses for education and university Bagrut certificates, total expenses for education and standard Bagrut certificates, and total expenses for education and university Bagrut certificates. These graphs suggest that the hypotheses have merit—budget and test scores have a positive relationship through surface-level observation on correlation.

4.3. Statistical Analysis

4.3.1. Correlation Significance

Figure 9, Figure 10, Figure 11 and Figure 12 show us the potential merit of our hypotheses. Therefore, we proceeded towards the statistical analysis. As is clearly displayed in Table 1, the relationships between the budget and standard Bagrut results have positive correlations, representing a relationship between the variables. This conclusion is consistent with one of the elements present in each of the eight alternative hypotheses (Table A1). Furthermore, with a critical value corresponding to α ≤ 0.01, 17 of the coefficients qualify as being statistically significant while ranging between the r = +0.23 to r = +0.61 range.
The three coefficients with lower values were all related to the internal revenue per student in the Arab localities. The changes in this factor did not correspond with the high Bagrut results. It did explain that only in Jewish localities would r = +0.23.
Consequently, all of the correlations represent the positive relationship seen earlier in the scatter plots. All of the calculated p-values fell below p ≤ 0.01, except for internal revenue with Arab schools (p ≤ 0.05) and internal revenue with Muslim, Christian, and Druze schools (p ≤ 0.1).
All elements considered, the results between budget and standard Bagrut scores yield a statistically significant, positive correlation. Therefore, we comfortably reject the null hypothesis, and argue that the two variables have a positive relationship: if you increase the budget, then the Bagrut scores will increase.
Similarly, the relationships between budget and university-eligible test scores also seem positively correlated across the board (Table 2). This conclusion is also consistent with the hypotheses regarding university Bagrut results (Table A1). Additionally, like the previous set of statistics, all but three coefficients exhibited statistical significance (α ≤ 0.01). In these results, the correlation coefficient range was slightly higher than the standard Bagrut, ranging from +0.25 to +0.63. Once again, this range is consistent with the visualized data from the previous section. For the p-values, only the relationships between internal revenue and the general Arab, Muslim/Christian (both p ≤ 0.05), and Druze (p ≤ 0.1) populations were not below 0.01, which coordinated with the findings in the previous paragraph.
As a result of these conclusions, the relationship between budget and university-eligible Bagrut scores also has a positive, statistically significant correlation. Consequently, with confidence, we reject the null hypothesis. We argue these two variables also have a positive relationship: if you increase the budget, then the university-eligible Bagrut scores will increase.

4.3.2. Varying Effects of Budget on Test Scores

When directly comparing the independent variables against each other, educational expenses seemed to hold much stronger correlations with standard Bagrut certificates than educational revenue (Table 1). Specifically, the data show that expenses for employment have the most impact on the rate of standard Bagrut achievement (r = +0.37, +0.32, +0.40, +0.34, and +0.58), followed by the total expenses in education (r = +0.36, +0.26, +0.39, +0.31, and +0.61). Nearly exhaustively (in models 1–4), expenses for employment had the highest coefficient of correlation, followed by total expenses, total revenue, and, much further below, internal revenue. In Model 5, for the Druze schools, however, total revenue (r = +0.61) and total education expenses (r = +0.61) had the highest correlations, followed by employment expenses (r = +0.58) and then internal revenue (r = +0.15). Consistent with previous findings, the Druze communities’ data indicate divergence from the other Arabs. Overall, when comparing the correlation coefficients against the internal vs. external financial source model, two of the three internal management measures had a stronger impact on standard Bagrut scores than the measure of external aid.
Comparing the results across budget variables yielded slightly different results in the university-eligible data (Table 2): expenses for the employment of education staff hold the most influence, but there was much less consistency across the models. With all of the categories in consideration, expenses for employment had the highest correlation (r = +0.34, +0.29, +0.35, +0.27, and +0.58), followed by total education expenses (r = +0.35, +0.23, +0.31, +0.22, and +0.63). The Arab and Muslim/Christian models showed the same trends as the standard Bagrut data, while the Jewish and Druze models differed. For Jewish university-eligible Bagrut scores, employment expenses were the highest coefficient (r = +0.29). For Druze communities, similarly to the standard Bagrut, the highest was the total expenses (r = +0.63). Perhaps most interesting, when looking at Model 1, representing all Israeli data, internal revenue had the highest correlation (r = +0.36). Overall, when looking at these levels of the independent variable as internal vs. external, the three internal management variables had stronger correlations to university-eligible Bagrut scores than the external aid variable.
Furthermore, compared to the standard Bagrut data, the university test scores demonstrate that Israel as a whole and Jewish and Druze communities follow different patterns of correlation, suggesting different implications for test score improvement.

4.3.3. Controlling for Demographics

Looking individually into each demographic category (control variables) in this research project demonstrates that each group had different correlations with the independent variables. Additionally, the data demonstrated changes in these rankings between standard and university-eligible Bagrut certificates. For example, the highest Druze coefficient was for total expenses and total revenue. The highest Muslim/Christian and Jewish coefficients were employment expenses in standard and university Bagrut relationships. Additionally, general Israel had high coefficients in expenses for employment for the standard Bagrut, and in internal revenue for the university certificate. Both Arab and Jewish communities exhaustively had their individual highest correlations in expense categories. Meanwhile, Israel at large had higher coefficients for both internal revenue in the university-eligible Bagrut scores—a finding that indicates perhaps that expense allotment can only take student achievement so far.
Directly comparing and contrasting across all communities suggests that the Druze community had the strongest correlation between the independent and dependent variables. Not only were those coefficients the strongest across all of the statistically significant independent variables, but they also extended through both standard and university-eligible Bagrut data. With coefficients between +0.58 and +0.63 at all times, the Druze demographic category was the only one to exhibit a high level of correlation; all other ethnic communities had moderate or low correlation. In order of correlation strength, the Druze followed general Israeli, Jewish, general Arab, and Muslim/Christian communities in descending order. Considering the order of correlation strength, the Druze communities are more likely to see consistent increases in test scores as budget factors increase. While they stand apart from other communities with higher correlation coefficients, considering the entire Arab community addresses the predictions from the original hypotheses.
In the second half of each hypothesis in Appendix A, Table A1, we discussed the correlations with potential prevalence in the final data; four of the eight were incorrect post-analysis. Under the umbrella of standard Bagrut results, we predicted that Jewish communities would have higher correlations in total revenue (external financial factors), and Arab communities would have higher correlations in internal revenue, employment expenses, and total expenses (internal financial factors). However, the correlations were higher for Jews only for internal revenue, while the total revenue and expense categories were higher for Arab schools. The gaps between the Arab and Jewish coefficients extended across the board: for internal revenue, Jewish schools lead Arab schools +0.23 to +0.09, and Arab categories exceeded Jewish coefficients in total revenue (+0.33 to +0.25), expenses for employment (+0.40 to +0.32), and total expenses (+0.39 to +0.26). Overall, it appears that budget factors generally make a more considerable difference for Arab schools as a whole than Jewish schools, except for internal revenue. This is perhaps due to the lack of variation exhibited within Arab internal revenue—a finding that deserves further examination.
Likewise, half of the hypotheses were incorrect for the university-eligible certificate. We predicted that the total revenue would be a more significant indicator for Jewish localities than Arab localities, while the others would be more significant indicators for Arabs. However, like the standard Bagrut, the Jewish coefficient was only higher in internal revenue. For this budget measure, Jewish schools showed a +0.25 correlation to university-eligible test scores, whereas Arab schools only had +0.08. Elsewhere, however, Arab schools barely exceeded Jewish schools in total revenue (+0.24 vs. +0.22), and had more significant scores in expenses for employment (+0.35 vs. +0.29) and total expenses (+0.31 vs. +0.23). These results solidify the findings from the standard Bagrut scores, suggesting that Arab university-eligible test scores rely more heavily on budget measures except for internal revenue.
Overall, this research has identified a positive relationship between budget allocation and test scores. Therefore, based on a statistically significant correlation, we approve the hypothesis. Additionally, the correlation strength in expense data vs. revenue data demonstrates that internal variables have the strongest correlations. While internal revenue is also considered an “internal” measure, this variable seems to require further investigation due to the drastically lower and less statistically significant correlations in the Arab categories. Controlling for Jewish and Arab correlations did not manifest a distinction between the internal and external model, highlighting the nuance of internal revenue instead of as a variable, and showcasing a solid relationship between Arab budget factors and test scores. Nevertheless, within a ranking system between the actual measures of dependent variables, the findings open up significant discussion for the model (Figure 2).

5. Discussion

An established, positive relationship between budget and test scores is not a claim that is free from disagreement or controversy. The academic community and the general population regard this relationship with caution, recognizing the inconsistent findings across many school systems in the developed world. Nevertheless, our model argued for an existing, positive relationship between budget and test scores in Israel. Using this approach, we contributed to the existing academic literature by showing that money does improve test scores, in the case of matriculation exams, i.e., the Bagrut. Examining different scenarios, using four different measures of budget variables, controlling for five different demographic classifications, including two tiers of test scores, and spanning 11 years of data, this research found positive, statistically significant correlations between budget and test scores. Therefore, this project uncovered a systematic relationship between monetary resources and educational outcomes, in contrast to Hanushek [55].
Additionally, this project contributes to the government funding and expenses debate on improving student achievement. For the most part, the conclusions drawn above challenge previous findings. First, Garcia et al. [44] and Ladd et al. [45] ruled in favor of government support as a variable making a sizable difference in student achievement; while the data from Israel confirm a positive correlation with central governmental allocation, this measure of the budget was far from being the most impactful factor. Furthermore, Cobb-Clark and Jha [46] found that funding did not make a notable difference on test scores, which is another conclusion our findings challenge. Lastly, regarding expenses, both Lee and Polachek [47] and Cobb-Clark and Jha [46] concluded that this measure of financial data did not make a difference on test scores; however, this research argues that, in the case of Israel, these conclusions do not hold. Thus, expanding this research question into a new geographic location recontextualizes funding and expenses. Future research can further explore the role of budget in test scores before too-hastily discounting it solely based on studies from the Anglosphere.
Moving to the second tier of analysis at the basis of our model, we examined the influence of ethnicity on the primary independent and dependent variable relationship. Our model asserted that controlling for demographic classification will uncover alterations in the original relationship.
Our results provide an up-to-date view of the level of disparity in Jewish and Arab education. First, test scores and budget allocation continue to increase for Arab communities over time, which does reflect at least surface-level positivity on the current efforts of the Ministry of Education to decrease the achievement gap. Along the same line, the increase in focus from the Ministry of Education does imply that Resolution 1060 and Resolution 922 are doing what they intended to do: they are increasing funding to Arab localities.
However, a substantial disparity exists between Arabs and Jews in internal revenue and university-eligible Bagrut scores. This corresponds with the third tier in our analysis, exploring the different categories of budget allocation and how they affect test scores while controlling for demographic variables. The literature recognizes internal revenue differences between Jewish and Arab localities [51,52], but academia has not discussed university-eligible Bagrut scores. While these trends are only two of the eight examined in this research, they pose important questions: is the gap in internal revenue a representation of neglect for Arab communities in other areas such as socioeconomics, employment, and sense of belonging and community? Suppose the education system still has a substantial achievement gap in university-eligible Bagrut certificates. Why is it so infrequently addressed, considering these outcomes have the power to bar minority groups from higher education and, therefore, higher employment and salary opportunities? Appropriately, this study also found that internal revenue is the highest correlating budget factor for university-eligible test scores across all Israeli data. Evidently, amongst the improvement and apparent governmental effort, Israeli education still has inequalities running deeply through the system, possibly representing more significant Arab neglect or discrimination issues in Israel.
In addition to these more nefarious implications and potential inequity, this research also found patterns for budget factors that may make a difference for an unjust system: educational expenses. By examining the budget variables with a stronger correlation, further research will soon have room to verify factors for positive change within Israeli education. Consistently across budget factors and tiers of testing data, expenses for employment within education had the highest correlations. This was most notable within the Druze community, which undoubtedly made the most astonishing improvements and had the highest correlations of all ethnic categories in Israel; they seemed to have made effective use of expenditures. Not surprisingly, the Druze also yielded the most substantial increases in Bagrut test scores, even eventually exceeding Jewish standard Bagrut averages. Because expenses correlated so significantly with test scores for the Druze who had the highest educational expenditures per student out of all of the other Arab groups, policy and future research may consider examining expenditure, mainly when used for employment. As we reported in the results, it is worth noting that the higher salaries went mainly to better-educated teachers; this is a phenomenon which is worth exploring in further research.
Our findings are important outside of Israel for several reasons. First, we have added a clear example of a correlation between budgets and academic achievement, where some scholars have disputed that before. We suggest using these results in policy making to improve academic achievement among under-funded and under-performing school systems. Second, we have added a detailed account of the discrimination in the allocation of education budgets in a nation-state toward an ethnic and religious minority. We have showed that the increased funding in recent years has helped close the gaps of academic achievements. This further contributes to our policy recommendations as for the relations between the nation-state and the ethnic minority, not just in Israel. Third, after solving all external under-funding, there remains the problem of local management. Funding from the central government is helpful (manifested by a positive correlation) and should continue to account for local inequity. However, in order to close the gap in high-quality academic achievements, there needs to be an improvement in the local management. It seems that the biggest effect comes from where the money goes once it reaches a locality. Using educational expenses as the primary influence over student achievement implies that government policy should be tailored to enrich and support local education, rather than central control and permanent dependability. As such, policy should encourage continued central funding to promote sustainability and equity while using training for local administration as a replacement for incentives and supervision. Therefore, by providing ample resources to local management and continually providing equitable governmental aid, struggling localities would have the best chance at improving the apportionment of their expenditures, which should highly correspond with growth in test scores.
Future research along this topic of discovery can correct the current limits within the data and further scrutinize the findings within Israel (including expanding the focus on test preparation). Furthermore, projects stemming from this paper could expand the findings to other locations in order to ascertain whether the structure of education systems within a nation can alter the conclusion. First, exploring the role of expenses within Israeli education would be a worthwhile expansion of this project, particularly for policy implications. In order to circumvent this paper’s limits, future research could add additional measures of budget variables, enriching the conclusions from this paper for the role of expenditure by adding more internal/external distinction and retrieving Bagrut data with existing averages or moldable raw data. One of the major contributions of a future research could be to delve into the specifics of the budget data we have used to more specific cases, when the Ministry of Education funds special programs such as technological trends. Second, research should look further into the role of internal revenue on Arab education. The surprisingly low and statistically insignificant coefficients in Arab communities suggest that more is going on with internal revenue and Arab education. Third, as previously mentioned, research on test preparation and resources is a growing dialogue; understanding that the local management of resources could be a vital factor in test scores, tracking money in test prep (materials, teacher training, the availability of extra classes) would contribute to that body of literature. Lastly, different nations have different structures of educational systems. Israel has a small geographic size, and the division of power falls between only central and local powers. However, there could be different results for the expenditure data in places like the United States, where there is vast variation across immense geographic size, and the division of power falls to federal, state, and local influences. Looking further into the role of expenditure could open a new dialogue within academia on how the community views budget to influence educational achievement.
In addition to the limits mentioned above, it is worth noting an additional limit regarding the budget variables. We used them as general variables, without considering the specifics of what might be included in them on a various case-by-case basis. For example, the Ministry of Education might fund educational trends in one school system but not in others. This was not taken into consideration, as we were concerned with the general outlook of the education streams and establishing the correlation with general education achievements, in the form of Bagrut certification and university-level Bagrut certification. Future research could target more specific trends within the various education streams, and could examine “salaries”, for example, as a simple variable. Another important limitation is found with regard to the external vs. internal debate. Note that we focused only on one internal variable—the internal revenue. This is a narrowed examination that deserves further explanation for more variables.

Author Contributions

Conceptualization, R.Z. and R.E.H.; methodology, R.Z.; software, R.E.H.; validation, R.Z.; formal analysis, R.E.H.; investigation, R.E.H.; resources, R.Z. and R.E.H.; data curation, R.E.H.; writing—original draft preparation, R.E.H.; writing—review and editing, R.Z.; visualization, R.E.H.; supervision, R.Z.; project administration, R.Z.; funding acquisition, Not applicable. All authors have read and agreed to the published version of the manuscript.

Funding

This research received no external funding.

Institutional Review Board Statement

Not applicable.

Informed Consent Statement

Not applicable.

Data Availability Statement

The data presented in this study are available on request from the corresponding author. The data are not publicly available in part due to being published in a language other than English.

Conflicts of Interest

The authors declare no conflict of interest.

Appendix A

Table A1. Hypotheses.
Level of Independent Variable Level of Dependent VariableHypothesis
Internal Revenue
(Internal)
Bagrut CertificatesIf you increase the internal revenue in a particular municipality, then the Bagrut scores in that municipality will increase as well, with Arab results being more correlated than Jewish results.
University Eligible Bagrut CertificatesIf you increase the internal revenue in a particular municipality, then the university eligible Bagrut scores in that municipality will increase as well, with Arab results being more correlated than Jewish results.
Total Revenue
(External)
Bagrut CertificatesIf you increase the total revenue in a particular municipality, then the Bagrut scores in that municipality will increase as well, with Jewish results being more correlated than Arab results.
University Eligible Bagrut CertificatesIf you increase the total revenue in a particular municipality, then the university eligible Bagrut scores in that municipality will increase as well, with Jewish results being more correlated than Arab results.
Employment Expenses
(Internal)
Bagrut CertificatesIf you increase the expenses for employment in a particular municipality, then the Bagrut scores in that municipality will increase as well, with Arab results being more correlated than Jewish results.
University Eligible Bagrut CertificatesIf you increase the expenses for employment in a particular municipality, then the university eligible Bagrut scores in that municipality will increase as well, with Arab results being more correlated than Jewish results.
Total Expenses
(Internal)
Bagrut CertificatesIf you increase the total expenses in a particular municipality, then the Bagrut scores in that municipality will increase as well, with Arab results being more correlated than Jewish results.
University Eligible Bagrut CertificatesIf you increase the total expenses in a particular municipality, then the university eligible Bagrut scores in that municipality will increase as well, with Arab results being more correlated than Jewish results.
Table A2. Variables.
Dependent/
Independent
Variables
The VariablesExplanation
Dependent Variables: Student AchievementA1: Bagrut Certificates (percentage)
A2: Bagrut Certificates Eligible for University (percentage)
A1: Percentage of 12th-grade students who receive 20 units and pass the matriculation exam
A2: Percentage of 12th-grade students who pass matriculation exam and receive additional credits, qualifying for university enrollment
Independent Variables: Budget Revenue in Education R1: Internal Revenue per student
R2: Total Education Allotment per student
R1: Educational income from the local authority does not come from the national government. Includes all educational fees and donations from local residents. Raw data were transformed using the number of students in each locality.
R2: Educational income from the Israeli Central Government. Raw data transformed using the number of students in each locality
Independent Variables: Budget Expenses in Education E1: Expenses in Educational Employment per student
E2: Total Educational Expenses per student
E1: Based on financial statements from authorities. Includes wages, overtime, pension, travel allowance, training, etc. Raw data transformed using the number of students in each locality
E2: Based on financial statements from authorities. Could include teacher salaries, building and equipment maintenance, housekeeping, transportation, security, etc. Raw data transformed using the number of students in each locality
Control Variables: DemographicsD1: Jewish Population (percentage)
D2: Arab Population (percentage)
D3: Muslim Population (percentage)
D4: Christian Population (percentage)
D5: Druze Population (percentage)
D1: Percentage of Jews in total locality population.
D2: Percentage of Arabs in total locality population.
D3: Percentage of Muslims in total locality population.
D4: Percentage of Arab Christians in total locality population.
D5: Percentage of Druze in total locality population.
Note: Explanations by the CBS [56].

References

  1. Reiter, Y. National Minority, Regional Majority: Palestinian Arabs Versus Jews in Israel; Syracuse University Press: Syracus, NY, USA, 2009. [Google Scholar]
  2. Haklai, O. Palestinian Ethnonationalism in Israel; University of Pennsylvania Press: Philadelphia, PA, USA, 2011. [Google Scholar]
  3. Rekhess, E. The evolvement of an Arab-Palestinian national minority in Israel. Isr. Stud. 2007, 12, 1–28. [Google Scholar] [CrossRef]
  4. Peleg, I.; Waxman, D. Israel’s Palestinians: The Conflict Within; Cambridge University Press: Cambridge, UK, 2011. [Google Scholar]
  5. Al-Atawneh, M.; Ali, N. Islam in Israel: Muslim Communities in Non-Muslim States; Cambridge University Press: Cambridge, UK, 2018. [Google Scholar]
  6. Jamal, A. The Arab Public Sphere in Israel: Media Space and Cultural Resistance; Indiana University Press: Bloomington, IN, USA, 2009. [Google Scholar]
  7. Smooha, S. The model of ethnic democracy: Israel as a Jewish and democratic state. Nations Natl. 2002, 8, 475–503. [Google Scholar] [CrossRef]
  8. Ghanem, A. Palestinian-Arab Minority in Israel, 1948-2000, The: A Political Study; State University of New York Press: New York, NY, USA, 2001. [Google Scholar]
  9. Amara, M. Arabic in Israel: Language, Identity and Conflict; Routledge: London, UK, 2017. [Google Scholar]
  10. Lewin-Epstein, N.; Semyonov, M. The Arab Minority in Israel’s Economy: Patterns of Ethnic Inequality; Routledge: New York, NY, USA, 2019. [Google Scholar]
  11. Sorek, T. Arab football in Israel as an ‘integrative enclave’. Ethn. Racial Stud. 2003, 26, 422–450. [Google Scholar] [CrossRef]
  12. Abu-Saad, I. Separate and unequal: The role of the state educational system in maintaining the subordination of Israel’s Palestinian Arab citizens. Soc. Identities 2004, 10, 101–127. [Google Scholar] [CrossRef]
  13. Katz, Y. Education for peaceful coexistence in the Israeli State Jewish school system. In Peace or Violence: The Ends of Religion and Education? University of Wales Press: Cardiff, UK, 2007; pp. 195–207. [Google Scholar]
  14. Abu-Saad, I. The role of education in minority identity formation in an ethnic state: The case of Palestinian Arab youth in Southern Israel. Arab. Stud. J. 2003, 11, 57–75. [Google Scholar]
  15. Central Bureau of Statistics (CBS). (2018). Society in Israel, Report No. 10, June 2018. Jerusalem. Available online: https://www.cbs.gov.il/he/publications/doclib/2018/rep_10/part05_h.pdf (accessed on 14 July 2022). (In Hebrew)
  16. Konstantinov, V. Patterns of Integration into Israeli Society among Immigrants from the Former Soviet Union over the Past Two Decades. Myers-JDC-Brookdale Institute, Research Report RR-674-15. 2015. Available online: https://brookdale.jdc.org.il/publication/patterns-integration-israeli-society-among-immigrants-former-soviet-union-past-two-decades/ (accessed on 22 March 2022). (In Hebrew).
  17. Bekerman, Z. Israel: Unsuccessful and limited multicultural education. In Education and Ethnicity: Comparative Perspectives; Platinum Press: Fort Worth, TX, USA, 2010; pp. 100–118. [Google Scholar]
  18. Feldman, A. The Determination of Educational Policy: Shas, Politics, and Religion. Isr. Stud. Rev. 2017, 32, 89–109. [Google Scholar]
  19. Shavit, Y. Segregation, tracking, and the educational attainment of minorities: Arabs and Oriental Jews in Israel. Am. Sociol. Rev. 1990, 55, 115–126. [Google Scholar] [CrossRef]
  20. Parker, F. The problems of educating Israel’s Arabs. Phi Delta Kappan 1981, 62, 712–713. [Google Scholar]
  21. National Authority of Measurement and Estimation in Education. PISA 2012—An Israeli View, Ministry of Education. Jerusalem. [Hebrew]. 2013. Available online: https://meyda.education.gov.il/files/Rama/PISA_2012_Report_ed_f_nh.pdf (accessed on 14 July 2022).
  22. Dadon-Golan, Z.; BenDavid-Hadar, I.; Klein, J. Equity in education: The Israeli case. Int. J. Educ. Manag. 2019, 33, 1670–1685. [Google Scholar] [CrossRef]
  23. Katz, Y. The state approach to Jewish and non-Jewish education in Israel. Comp. Educ. 2010, 46, 325–338. [Google Scholar] [CrossRef]
  24. Adalah. On the Israel Government’s New Decision Classifying Communities as National Priority Areas. 2010. Available online: https://www.adalah.org (accessed on 13 March 2022).
  25. Elran, M.; Nasra, M.A.; Yashiv, E.; Abu, M. INSS Insight No. 993, November 22, 2017 Two Years into the Five-Year Plan for Economic Development of the Arabs in Israel. 2017. Available online: https://www.inss.org.il/publication/two-years-five-year-plan-economic-development-arabs-israel/ (accessed on 14 July 2022).
  26. Ayalon, H.; Shavit, Y. Educational reforms and inequalities in Israel: The MMI Hypothesis revisited. Sociol. Educ. 2004, 77, 103–120. [Google Scholar] [CrossRef]
  27. Azen, R.; Bronner, S.; Gafni, N. Examination of gender bias in university admissions. Appl. Meas. Educ. 2002, 15, 75–94. [Google Scholar] [CrossRef]
  28. Ebenstein, A.; Lavy, V.; Roth, S. The long-run economic consequences of high-stakes examinations: Evidence from transitory variation in pollution. American Economic Journal. Appl. Econ. 2016, 8, 36–65. [Google Scholar]
  29. Eagle, E. Socioeconomic status, family structure, and parental involvement: Correlates of achievement. In Proceedings of the Annual Meeting of the American Education Research Association, San Francisco, CA, USA, 27–31 March 1989. [Google Scholar]
  30. Brookover, W.B. Can we make schools effective for minority students? J. Negro Educ. 1985, 53, 257–268. [Google Scholar] [CrossRef]
  31. Lewis-McCoy, R.L. Inequality in the Promised Land: Race, Resources, and Suburban Schooling; Stanford University Press: Redwood, CA, USA, 2014. [Google Scholar]
  32. Ball, S.J. The Education Debate, 4th ed.; Policy Press: Bristol, UK, 2021. [Google Scholar]
  33. Jencks, C.; Phillips, M. The Black-White Test Score Gap; Brookings Institution Press: Washington, DC, USA, 2011. [Google Scholar]
  34. Brunn-Bevel, R.; Byrd, W.; Seamster, L.; Henricks, K. The foundation of racial disparities in the standardized testing era: The impact of school segregation and the assault on public education in Virginia. Humanit. Soc. 2015, 39, 419–448. [Google Scholar] [CrossRef]
  35. Bigelow, B. Chapter 17: Standards and tests attack multiculturalism. In Rethinking Multicultural Education, 2nd ed.; Au, W., Ed.; Rethinking Schools: Milwaukee, WI, USA, 2014; pp. 127–134. [Google Scholar]
  36. Rotberg, R. Israeli and Palestinian Narratives of Conflict: History’s Double Helix; Indiana University Press: Bloomington, IN, USA, 2006. [Google Scholar]
  37. Bar-Tal, D.; Salomon, G. Israeli-Jewish narratives of the Israeli Palestinian Conflict: Evolvement, contents, functions and consequences. In Israeli and Palestinian Narratives of Conflict: History’s Double Helix; Rotberg, R.I., Ed.; Indiana University Press: Bloomington, IN, USA, 2006; pp. 19–46. [Google Scholar]
  38. Alon, S. Racial differences in test preparation strategies. Soc. Forces 2010, 89, 463–474. Available online: https://www.jstor.org/stable/40984541 (accessed on 13 March 2022). [CrossRef]
  39. Grodsky, E. Learning in the shadows and in the light of day. Soc. Forces 2010, 89, 475–481. [Google Scholar] [CrossRef]
  40. Zuzovsky, R. Closing achievement gaps between Hebrew-speaking and Arabic-speaking students in Israel: Findings from TIMSS-2003. Stud. Educ. Eval. 2008, 34, 105–117. [Google Scholar] [CrossRef]
  41. BenDavid-Hadar, I. Funding education: Developing a method of allocation for improvement. Int. J. Educ. Manag. 2018, 32, 2–26. [Google Scholar] [CrossRef]
  42. Eisikovitz, R. The educational experience and performance of immigrant and minority students in Israel. Anthropol. Educ. Q. 1997, 28, 394–410. [Google Scholar] [CrossRef]
  43. Lavy, V. Disparities between Arabs and Jews in school resources and student achievement in Israel. Econ. Dev. Cult. Change 1998, 47, 175–192. [Google Scholar] [CrossRef]
  44. Garcia, C.; Jones, D.; Isaacson, C. Comparing state mandated test scores for students in programs with and without fine arts in the curriculum. J. Case Stud. Educ. 2015, 7, 1. [Google Scholar]
  45. Ladd, H.; Muschkin, C.; Dodge, K. From birth to school: Early childhood initiatives and third-grade outcomes in North Carolina. J. Policy Anal. Manag. 2014, 33, 162–187. [Google Scholar] [CrossRef]
  46. Cobb-Clark, D.A.; Jha, N. Educational achievement and the allocation of school resources. Aust. Econ. Rev. 2016, 49, 251–271. [Google Scholar] [CrossRef]
  47. Lee, K.G.; Polachek, S.W. Do school budgets matter? The effect of budget referenda on student dropout rates. Educ. Econ. 2018, 26, 129–144. [Google Scholar] [CrossRef]
  48. Boger, J.C. Education’s “perfect storm”? Racial resegregation, high stakes testing, and school resource inequities: The case of North Carolina. North Carol. Law Rev. 2003, 81, 1375–1462. [Google Scholar]
  49. Arar, K.; Haj-Yehia, K.; Badarneh, A. Barriers impeding access to higher education: The effects of government education policy for disadvantaged Palestinian Arab and Jewish citizens. In Widening Higher Education Participation; Chandos Publishing: Waltham, MA, USA, 2016; pp. 81–98. [Google Scholar]
  50. Shohamy, E. Language Policy: Hidden Agendas and New Approaches; Routledge: Oxford, UK, 2006. [Google Scholar]
  51. Zeedan, R.; Vigoda-Gadot, E.; Ben-Artzi, Y. Causes of (and solutions for?) financial crises in local governments: Insights from local Arab authorities in Israel. Adm. Soc. 2017, 49, 1065–1083. [Google Scholar] [CrossRef]
  52. Halabi, Y. Democracy, Clan Politics and Weak Governance: The Case of the Arab Municipalities in Israel. Isr. Stud. 2014, 19, 98–125. [Google Scholar] [CrossRef]
  53. Central Bureau of Statistics (CBS). (2018). Local Authority Data [Excel Spreadsheet]. Available online: https://www.cbs.gov.il/he/publications/Pages/2020/%D7%94%D7%A8%D7%A9%D7%95%D7%99%D7%95%D7%AA-%D7%94%D7%9E%D7%A7%D7%95%D7%9E%D7%99%D7%95%D7%AA-D7%91%D7%99%D7%A9%D7%A8%D7%90%D7%9C-2018.aspx (accessed on 22 March 2022).
  54. Central Bureau of Statistics (CBS). (2020) Teaching Staff, 2019/20. 31 March 2020. Available online: https://www.cbs.gov.il/en/mediarelease/Pages/2020/Teaching-Staff-2019-20.aspx (accessed on 14 July 2022).
  55. Hanushek, E.A. Education production functions: Developed country evidence. In International Encyclopedia of Education; Brewer, D.J., McEwan, P.J., Eds.; Elsevier: Amsterdam, The Netherlands, 2010. [Google Scholar]
  56. Central Bureau of Statistics (CBS). (2018). Introduction—General; main findings; terms; definitions and explanations; sources; methods. In Local Authorities in Israel; Central Bureau of Statistics: Jerusalem, Israel, 2018; pp. 9–86. Available online: https://www.cbs.gov.il/he/publications/doclib/2020/local_authorities18_1797/intro_h.pdf (accessed on 22 March 2022).
Figure 1. The model of the relationship between budget, test scores, and demographics.
Education 12 00545 g001
Figure 2. Model of the relationship between the levels of the independent and control variables.
Education 12 00545 g002
Figure 3. Bagrut data through time.
Education 12 00545 g003
Figure 4. University bagrut data through time.
Education 12 00545 g004
Figure 5. Internal revenue for education through time.
Education 12 00545 g005
Figure 6. Total revenue for education through time.
Education 12 00545 g006
Figure 7. Expenses for employment in education through time.
Education 12 00545 g007
Figure 8. Total expenses for education through time.
Education 12 00545 g008
Figure 9. Internal revenue in education and Bagrut relationships.
Education 12 00545 g009
Figure 10. Total revenue in education and Bagrut relationships.
Education 12 00545 g010
Figure 11. Employment expenses in education and Bagrut relationships.
Education 12 00545 g011
Figure 12. Total expenses in education and Bagrut relationships.
Education 12 00545 g012
Table 1. Analysis of the correlation between budgets and Bagrut certificates.
Independent VariableModel 1Model 2Model 3Model 4Model 5
R1: Internal Revenue per student+0.31+0.23+0.09 *+0.07 **+0.15 **
R2: Total Education Allotment per student+0.32+0.25+0.33+0.25+0.61
E1: Expenses in Educational Employment per student+0.37+0.32+0.40+0.34+0.58
E2: Total Educational Expenses per student+0.36+0.26+0.39+0.31+0.61
* Notes. n = 2457–2566; significance was calculated at p ≤ 0.01. *—p < 0.05. **—p < 0.1. Model 1: Israel; Model 2: Jewish schools; Model 3: Arab schools; Model 4: Muslim and Christian schools; Model 5: Druze schools.
Table 2. Analysis of the correlation between budgets and university-eligible Bagrut certificates.
Independent VariableModel 1Model 2Model 3Model 4Model 5
R1: Internal Revenue per student+0.36+0.25+0.08 *+0.09 *..
R2: Total Education Allotment per student+0.30+0.22+0.24+0.15+0.60
E1: Expenses in Educational Employment per student+0.34+0.29+0.35+0.27+0.58
E2: Total Educational Expenses per student+0.35+0.23+0.31+0.22+0.63
* Notes. n = 2455–2563; significance was calculated at p ≤ 0.01. *—p < 0.05.. Model 1: Israel; Model 2: Jewish schools; Model 3: Arab schools; Model 4: Muslim and Christian schools; Model 5: Druze schools.
Publisher’s Note: MDPI stays neutral with regard to jurisdictional claims in published maps and institutional affiliations.

