Article

Design and Evaluation among Young Adults of a Financial Literacy Scale Focused on Key Financial Decisions

by
Silvia Mariela Méndez Prado
1,*,
Katherine Chiluiza
2,
Patricia Everaert
3 and
Martin Valcke
4
1
Facultad de Ciencias Sociales y Humanísticas, Escuela Superior Politécnica del Litoral (ESPOL), Campus Gustavo Galindo Km. 30.5 Vía Perimetral, P.O. Box 09-01-5863, Guayaquil 090902, Ecuador
2
Information Technologies Center, Escuela Superior Politécnica del Litoral (ESPOL), Campus Gustavo Galindo Km. 30.5 Vía Perimetral, P.O. Box 09-01-5863, Guayaquil 090902, Ecuador
3
Faculty of Economics and Business Administration, Ghent University, EB22, Sint-Pietersplein 7, 9000 Ghent, Belgium
4
Department of Educational Studies, Faculty of Psychology and Educational Sciences, Ghent University, Henri Dunantlaan 2, 9000 Ghent, Belgium
*
Author to whom correspondence should be addressed.
Educ. Sci. 2022, 12(7), 460; https://doi.org/10.3390/educsci12070460
Submission received: 9 June 2022 / Accepted: 30 June 2022 / Published: 1 July 2022

Abstract

:
The present study underpins the design and validation of a Financial Literacy (FL) scale in the Latin American and the Caribbean (LAC) context. Though scales are available, they do not meet contextual characteristics and seem to miss out on a focus on Key Financial Decisions (KFD). Scale design was consistent with an extensive literature review (2010–2021). Forty-four items scale covering the dimensions of Financial Attitude, Financial Behavior, and Financial Knowledge were presented to 478 young adults aged 18–30, and women 58% of them. The results reflect a robust FL scale by applying Confirmatory Factor Analysis (CFA). The data about young adults’ FL can be used as a benchmark in future studies fostering the development of FL in the Latin American and Caribbean contexts.

1. Introduction

The lack of financial literacy (FL) and financial education (FE) is often linked to the recent financial crises across the world [1,2]. The Organization for Economic Cooperation and Development (OECD) has promoted FL and FE worldwide since 2003 [3]. Their initiatives build on the observation that FL is low, as reflected across the twenty-six sampled countries and economies studied by the OECD/INFE 2020 International Survey of Adult FL [3]. This low mastery level demands hard work to develop a basic understanding of financial concepts and help individuals make sound financial decisions.
Building on a longitudinal study, Van der Cruijsen et al. (2021) found that more financially literate people seem to be better able to deal with financial institutions, indemnity companies, and retirement funds [4]. Higher FL increased the probability of long-term financial planning and better choice of financial products [1]. Other authors, such as Yeh et al. (2021), indicate that overconfidence in FL affects the stock market and weak retirement plan decision-making [5]. FL is considered essential for a country’s development, financial stability, and citizens’ well-being [6]. They refer to financial citizenship as the rights and duties related to the economic life of the citizen. In this context, a nation should guarantee consumer protection of financial services and financial inclusion and foster high-quality financial education [6]. Financial education is geared to FL and is expected to boost complex knowledge, beliefs, and skills [7].
Differences in FL depend not only on nationalities but also on generational FL differences [8]. Shaping an inverted curve, significantly younger and older adults reflect lower FL scores or are less literate than middle-aged respondents [9]. Young adults are critical to influencing part of the active population of a country [10]. They are also at a crucial moment where they expect to make and manage key financial decisions about home budgets, mortgage plans, insurance, social security, and retirement [11,12,13,14].
University students model the FL of a country’s youth as the most educated population group. Mapping their FL level helps understand FL levels in a population [15]. The latter studies of Yildirim et al. (2020), Pavkovic et al. (2018), Mandmaa (2019), and Mudzingiri et al. (2018), just as samples, introduce a discussion about the way FL is being measured [12,15,16,17,18]. FL studies involving young adults are crucial but are rare in the LAC region [19].
Poor FL was confirmed in a LAC subsample by Klapper and Lusardi (2019), who studied FL in 140 countries (percentage of adults correctly answering three of five questions S&P FL Survey) [20]. Two research initiatives pointed to a poor Ecuadorian FL level on average of 40%: Klapper and Lusardi (2019) remarked that only 30% of Ecuadorians are financially literate [20], and the later Andean Development Corporation CAF reports of 2015 and 2022 with part of the OECD/INFE Toolkit [21] revealed a level of 51% financially literate from a sample of 1200 Ecuadorian respondents [22].
When analyzing the prevalent scales used to measure FL worldwide, we look at the OECD/INFE Toolkit for measuring FL and financial inclusion survey, The Test of FL survey, and the S&P FL survey [21,23,24]. The scale design came from developed countries and is consistently built on three dimensions: financial knowledge (FK), financial behavior (FB), and financial attitude (FA). In other studies, we mostly find variations that can bring back these three basic dimensions [25].
According to Schuhen & Schürkmann (2014), FL does not consist of global contents evaluated by the same question worldwide. We need to consider the heterogeneous country’s framework concerning education, taxes, insurance, and other financial issues [26]. Both facts explain a lack of scales reflecting weaker economic realities, e.g., found in Ecuador. In this setting, Aguilar & Ortiz (2013) essayed to map the FL of 136 university students between 18–22 years old enrolled in a Banking and Finance program, but their initiative did not build on a tested scale designed in the Ecuadorian context [27].
Screening the FL research literature, no validated scale is available to measure the FL reality in Ecuador [19]. Also, no records exist that document scientific research mapping FL starting from the Ecuadorian reality, which is critical to inspire public policies and interventions addressing FL problems and their consequences.
A focus on an Ecuadorian sample of young university students, considered being a proxy of young adults, is suitable try to attempt the lack in the literature research, those facts bring us to the present study’s central focus, which aims at developing and evaluating the design and validation of an FL scale in the Ecuadorian context.
Scale design starts from an analysis of the literature and available scales to ground the need for a new scale. That review is mainly linked to the lack of focus on Key Financial Decisions fitting the regional and Ecuadorian context. Next to scale development, implementation of the scale helped a reliability and validation study. Based on this first administration, we explore—at a basic level—the question of whether Ecuadorian young adults are financially literate and what explains the differences in financial literacy levels.

2. Financial Literacy Conceptual Basis and the FL Scales

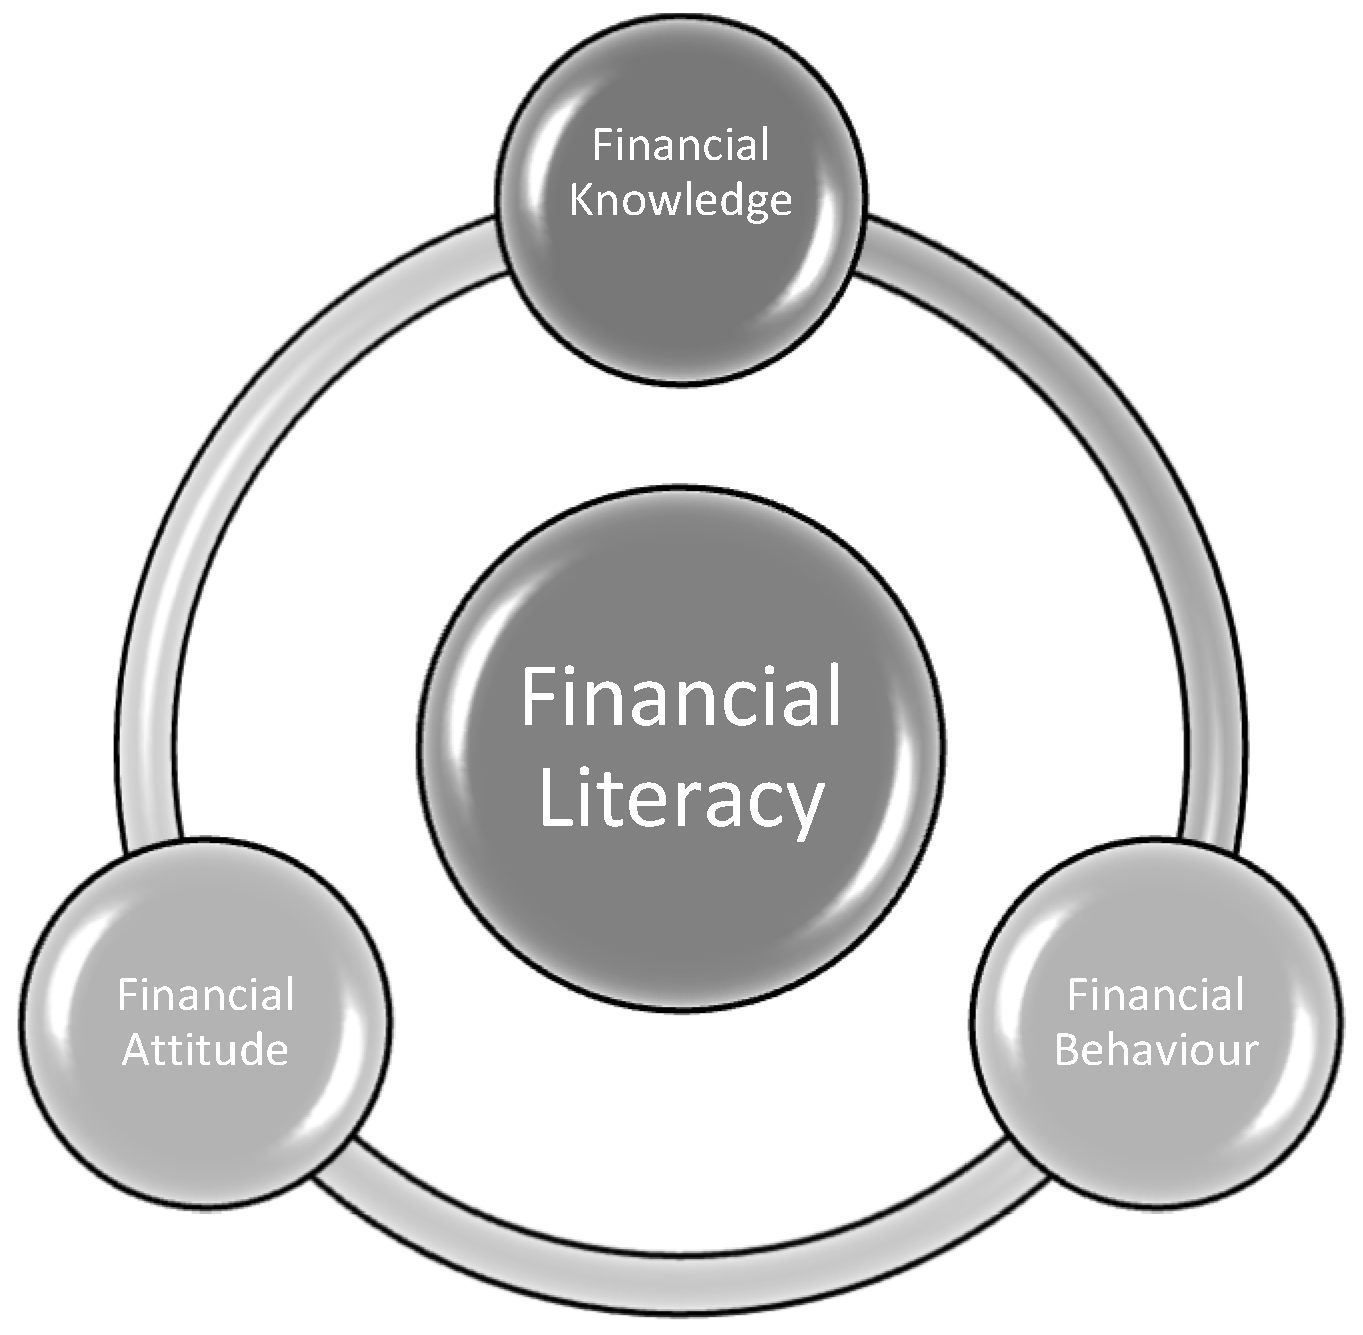
2.1. The Concept of Financial Literacy and Its Dimensions

In retrospect, the concept of financial literacy (FL) has evolved rapidly. Current conceptions link it to a basic understanding of financial concepts and the ability to manage personal finances. The concept was coined for the first time in the USA context in 1787 while addressing ignorance about credit management and the nature of the coins circulating [10]. Building on a Scopus literature search, the first scientific publication explicitly focusing on FL was published in 1984. From 2009 on, a significant increase in FL article production can be observed, with 2016 reflecting the beginner’s highest number thus far. In these publications, FL and financial education (FE) are often used interchangeably or at least in close connection [19].
A 2017 OECD study can be considered a milestone. Even with its new version in 2020, the OECD puts forward an FL definition that stresses awareness, knowledge, skills, attitudes, and behavior in making sound financial decisions and achieving individual financial well-being [3]. These fit the approach of Lusardi and Mitchell (2014), who define FL as the ability to analyze financial information and make informed financial decision-making. An individual is financially illiterate if they are unable to use their financial knowledge or cannot make sound financial decisions [28]. But other authors stress other features. For instance, van Rooij et al. (2011) [29] discuss financial knowledge that helps make financial decisions and consider this a determinant of successful stock market participation. Meanwhile, economic conditions, culture, and time preferences also affect financial decision-making. These facts lead to the position of Huston (2010), who therefore dissociates financial knowledge and financial decision-making [30].
The research highlights financial literacy due to learning and practicing financial decisions. Individuals will develop the skills and abilities that will lead them to obtain financial well-being.
Financial Literacy conceptions share three generalized dimensions: financial knowledge (FK), financial behavior (FB), and financial attitude (FA) (Figure 1). The three financial literacy dimensions contribute to a person’s ability to make decisions in pursuing financial well-being [31,32]. The FA dimension defines how an individual perceives and judges financial issues and fuels the intentions toward money [33]. FK grounds the ability to assimilate and understand economic or financial processes, making correct decisions about financial planning, budgets, loans, and others [34]. And FB reflects the skills and actions to achieve short-term and long-term financial goals, which can be linked to future acquisitions or covering unforeseen expenses [15].
The Key is that FL cannot be solely based on a Financial Knowledge dimension. FL goes together with Financial Behavior, which maps decision-making processes. Meanwhile, Financial Attitudes help consider an individual’s characteristics and background [35].
Grounding an FL definition works as a helping guide for studying an FL scale. A clear description is needed to help remove conceptual confusion. Table S1, in Supplementary Materials, puts forward a list of forty-five authors defining FL, derived from publications between 2010–2021. Forty-five listed study has FK as a practical dimension to evaluate FL. 84% of the studies declare FB and 44% FA as part of their FL definitions. 19/45 (42%) listed studies have FA, FB, and FK as embedded dimensions. We can partially reiterate the conclusion of Ouachani et al. (2021): FL can be seen as an outcome of FE [36]. Building on the variety of definitions, we stress that the FE is the action and the FL the consequence, often confused. FL is about the individuals’ background pursuing their financial well-being perception by making sound financial decisions within their idiosyncrasy and context.
According to Schuhen & Schürkmann (2014), the financial literacy assessments do not validate the constructs, and most are limited to evaluating knowledge, attitudes, etc. [26]. Mindra (2017) and Xing et al. (2010) propose to validate the underlying theoretical construct through a structural equation model (SEM).
The available overview of FL definitions reflects three founding dimensions: FK, FB, and FA. We ground the following hypotheses based on SEM:
H1. 
FA significantly influences FL.
H2. 
FB significantly affects FL.
H3. 
FB significantly influences FL.
We focus on these dimensions while discussing measurement approaches to map FL.

2.2. FL and Young Adults

Financial literacy is often low among young adults, identifying them as 18–29 years old [37,38]. These young adults are at a breakpoint in their lives, facing financial decisions. Most of them, inexperienced in the markets with a lack of financial knowledge, tend to have costly and lasting effects on their economies, consequently on the market [11,12,13,14].
University students model the FL of a country’s youth as the most educated population group [15]. Several studies use university students as a sample of young adults for convenience, introducing a discussion about the way FL is being measured [12,15,16,17,18].
Concerning the age relation to FL, young adults require an analysis according to their age range. The age has an inverted U-shaped effect because financial literacy increases as a person’s age increase until a certain point, then remains constant and decreases at approximately 60 years old. Liaqat, Mahmood, and Ali (2020) observed an age difference between those older than 26 years old in the 18–22 and 23–26 years old groups [39]. Nanziri and Leibbrandt (2018) consider the optimal FL age around 30 years [40]. They also share the conception that FL accumulates over time.
Related to young adults’ background, in the student stage, the literature review remarks that High School seems to be the standard setting to offer remediation programs to battle financial illiteracy [40,41,42]. Pending the school career of a subject, FL differences might be related to (not) attending high school.
Once again, analyses of university students are usually used in FL studies. Though this might reflect bias in FL studies by involving populations and samples that are easily accessible, the studies nevertheless show how educational programs linked to business, administration, and economics are more significantly related to FL levels. Students enrolled in other programs reflect significantly lower FL levels. They are less familiar with financial conceptions and find it more challenging to learn about financial literacy [10,42,43,44,45,46,47,48,49]. The study specialization of a student affects their numeracy level. Skagerlund et al. (2018) and Jayaraman and Jambunathan (2018) highlighted the significant relationship between numeracy levels and financial literacy [50,51].
The age of young adults is related to the “Program study Level”, where several studies stressed a positive and significant correlation with higher financial literacy, reminding the inverted U shape: People with higher educational levels have higher financial literacy levels [39,40,52,53]. Still, Liaqat, Mahmood, and Ali (2020) with Horobet et al. (2020) go further, remarking the differentiation between graduates and undergraduates is as high as it would be better. Those researchers stress how students in lower program study levels are less likely to answer questions correctly and are more prone to say they do not know the answer.
On the above based, it’s expected to find low FL level among young adults because the maximum FL point of the inverted U shape is at 30 years old, almost out of the age range of young adults’ definition. Nevertheless, their background concerning education, specialization, and age composition sample could variate the result.

2.3. The KFD and FL

FL is supposed to affect the Key Financial Decisions of citizens, this fact builds on a series of studies that link FL to specific financial decisions [11,12,13,14]. For instance, retirement planning is strongly associated with financial literacy. Garg and Singh (2016) found that younger people were less likely to think about retirement planning [10]. In addition, Bongini and Cucinelli (2019) state how a higher level of FL seems to influence the propensity to invest in a pension fund and think about retirement planning [51,53,54].
Carlsson et al. (2021) compare the cash and credit options for purchasing a car and house as part of their financial consciousness [55,56]. Indebtedness Matters according to Samek et al. (2021), who remarks how people have difficulty understanding complex aspects of retirement planning, which leads them to under-utilize annuities and claim Social Security benefits earlier than is optimal (Samek et al., 2021). All of them often connect retirement accounts, houses, and car purchasing with a financial education effect, with a perception of long-term financial planning as the authors propose.
Young adults can be considered FL role models who are expected to get engaged in current and future financial activities [12,57]. Information from this sample is expected to say something about Ecuadorian citizens’ FL levels [12]. It can inform decision-makers about the need to engage this group in Financial Education.

2.4. FL Scales in the Literature

FL scales published during the period 2010–2021 focus on measurement scales to analyze individuals’ latent variables related to a financial topic and how this affects subsequent variables and processes. As such, they operationalize an implicit or explicit definition of FL. For example, Ram et al. (2020) and Azizah et al. (2020) analyzed FK to direct remedial actions and promote public policy [58,59]. Researchers analyzed financial market consumption behavior [60], and other studies focus on FL and the effect of FE in a specific subgroup in society [61].
Scale design discussions are strongly influenced by three FL studies published between 2008–2021, as stated before: the OECD/INFE Toolkit [21] for measuring FL and financial inclusion, The Test of FL survey [24], and finally the S&P FL Survey [23]. These three FL scales share the three FL dimensions to reflect a comprehensive picture of FL: FK, FB, and FA. A focus on actual FL scale design is found in Ouachani et al. (2021). They developed a review paper about FL scales, which helps map various topics, particularly in the array of financial decisions, that help explain the diversity of available FL measures in the literature [36].
The most dominantly used scale in the literature is the OECD/INFE Toolkit, which consists of twenty-one items presented periodically to 18–79 years old subjects [21]. The original 2010 version was revised in 2018 [21] and used in an FL study set up in twenty-six countries that participated in the International Survey of Adult FL [3]. It focuses on FK and a range of attitudes and behaviors linked to planning and managing finances ad choosing and using financial products. A second dominantly used instrument is the Test of FL (TFL), which consists of forty-five items focusing mainly on the FK dimension [24]. Developed in the US, it evaluates the basic financial facts of personal finance decision-making for young adults: earning income, buying goods and services, saving, using credit, financial investing, protecting, and insuring. [24] The TFL has also been adopted in Germany and Netherlands [62,63]. The third dominant scale is the S&P Global Finlit Survey, set up as a joint research endeavor of researchers from the World Bank and The George Washington University [23]. It addresses the “big five” issues to assess people’s FL capacities related to risk diversification, inflation, simple interest, numeracy, and compound interest.
Based on these three scales, a critical picture of FL has been reported. Individual and specific studies measuring FL have constantly found low FL levels [24,63,64]. The OECD countries report of 2020 puts forward an FK score of around 0.71 (71% of answers correct) and 0.6 for the other two constructs (or 60%) [3]. European students did not obtain 60%; their overall average was 56.15% [63]. The S&P Global survey reports that subjects from advanced economies have the highest scores (around 60%). For emerging economies, this is barely 50%. Overall, FL studies put forward an average FL score of 60%. This fact could be used as a reference score in FL studies.
According to Schuhen & Schürkmann (2014), Financial literacy assessments don’t contain global contents to evaluate it with the same questionnaire. They suggest building scales based on each reality country affected by their financial framework and development as the insurance and tax system and bankerization, among other specific characteristics. [26].
But next to these three dominant scales, other authors put forward their “own” FL scale. They nevertheless also rely heavily on the existing literature, as can be derived from the analysis of thirty-three reviews about FL scales [19]. The authors conclude that more than twenty studies of them mirror features of the existing dominant scales. Only ten of the thirty-three FL scales currently used in LAC can be considered relatively “new” instruments: five from Brazil, three from Chile, one from Colombia, and one from Mexico.
Brazil presented 2016 the first scale with a gender focus: “Bolsa Família X” Program Financial Literacy, searching for a model for low-income women. Its 23-items mirror the FA, FB, FK dimensions and excellent psychometric qualities have been reported (Cronbach’s alpha > 0.63, GFI > 0.99, NFI > 0.99) [65].
In 2017, Brazil researchers reiterated a focus on gender: How well do women do when it comes to financial literacy with a 38-item scale. Scale design hardly differed, and the good psychometric test measures were published (Cronbach’s alpha > 0.85, CFI > 0.99, RMSEA ≤ 0.05) [66]. A contribution in 2018 is a FL study centered on university students (Development of a financial literacy model for university students), with a 37-items scale, is again three-dimensional with optimal scores (Cronbach’s alpha > 0.75, TLI > 0.98, NFI > 0.98) [15].
In 2021 two new Brazilian proposals were put forward with a strong emphasis on community FL. Firstly, the Financial Citizenship Perception (FCP) Scale with 40 items (FA, FB, FK) reflects eight constructs: financial inclusion, transparency, suitability, security perception, and complaints. The scale reflects good psychometric qualities (Cronbach’s alpha > 0.70, NFI > 0.99, GFI > 0.99) [6]. Secondly, Brazil’s authors presented a scale focusing on financial well-being in the context of the Minha Casa Minha Vida program. The FL’s perception and its antecedents were mapped with a 35-item scale building on FA, FB, FK, and one additional dimension: Financial Wellness (FW). In addition, this scale revealed good quality of fit statistics (Cronbach’s alpha FB > 0.85, FA > 0.55; GFI > 0.99) [67].
Chilean researchers worked on specific scales for pension fund clients, ways to evaluate a financial education intervention in middle school, and financial education intervention in university students. The pension fund scale zoomed in on participants’ actual knowledge of commissions paid by contributors to pension funds. The 11 items considered seven dimensions: perceived knowledge of the commission paid, actual knowledge of the commission paid, and price awareness, among others. The target population of the scale was as such particular: prospective clients (i.e., planning to hire a pension fund provider within three months) and current contributors aged 18 and over. This Chilean scale is not documented with validity and reliability information [68]. Next, a second Chilean scale was an economic and financial literacy test for Chilean secondary students with 27 items derived from three other scales: the Economic and Financial Literacy Test (TAEF-E), the scale of susceptibility to the influence of peers in consumption, and the scale of attitude towards materialism for adolescents. The items focus on dimensions such as materialism and susceptibility to interpersonal influence. A confirmatory factor analysis test resulted in retaining 21 items, reflecting good psychometric values (Ordinal Cronbach’s alpha = 0.885; CFI = 0.970, TLI = 0.967) [69]. The third Chilean scale focused on university students’ financial education and knowledge. The 39-item scale was adapted from the Survey of Measurement of Financial Capacities in Chile in 2016 and reflected two components: financial knowledge (FK) and financial information. The related study does not present validity and reliability measures [70].
Mexico reflected Chilean efforts to evaluate middle school students’ FL, and Colombia focused on university students: Financial literacy of Mexican high school teenagers was mapped with a 24-item scale based on five dimensions: FA, FB, FK, Math skills, and influence of- parents or peers. Their related FL report does not document scale validity and reliability [71]. For their part, the Colombian scale was labeled as the Financial Perceptions and Skills Among university student’s scale. The 26 items can be divided into two dimensions: Perceptions and financial skills. Content validity was based on expert judgment and excellent reliability (Cronbach’s alpha 0.89) [72].
Building on the above, we can conclude that a sizeable inspiring range of FL scales is available. Nevertheless, the collection mirrors shortcomings. A first key critical element is the focus on Key Financial Decisions (KFD) that are often very specific (e.g., pension fund) or undefined. A consistent focus on such KFD is needed. Secondly, psychometric information is not available in the Ecuadorian context. The latter is critical since economies in Latin America diverge, especially when looking at the GDP, nature of economic activities, financial products, and related Financial Education approaches with language differences in several countries. The latter is important given the focus of the current research teal on evaluating concrete FE initiatives. Thirdly, there is hardly a focus on young adults and their current and prospective engagement in financial issues.
Nevertheless, the current set of instruments is convincing in its reliance on the three founding dimensions of FL (FK, FB, and FA). The authors propose an FL scale fitted to young adults inspired by KFD. That allows a scale that remains aligned with state-of-the-art approaches adopted in the literature.

3. Research Design

3.1. Sample

The research sample consisting of university students allows the new scale evaluation. A stratified random sampling [73] procedure was followed, starting from a population of all 9646 students enrolled in 33 programs careers at ESPOL, a Polytechnic University (Guayaquil, Ecuador). Students were initially assigned to one of three program categories, reflecting a strong or weaker focus on financial math: (1) “Natural” programs (receiving more courses than an introductory financial math course; n:3); (2) “Enlightened” programs (receiving at least a financial math course; n:8); and (3) “Unfamiliar” programs (receiving no financial math course; n:22). The final sample consisted of 478 young adults (5% of the population university). Of the 478 participants, some data from 57 observations were missing (range 1 to 3 missing answers).

3.2. Recruiting

The students usually are very busy in February, and the sample design considers equilibrated participation of this university population. The paper-pen data collection process took sixteen days (31 January to 16 February 2018) to get the response of a minimum sample of four hundred seventy-eight young people. Due to the busy academic period, obtaining minimum participants per group represented challenging work. An extra work activity was to identify the careers participants in the lectures with a mixed population, every journey work. A group of collectors visits every classroom previously identified with the specifically required profile to complete the goal as a random and equilibrated group of students across campus.

3.3. Ethical Statement

This study was aligned with the Declaration of Helsinki and received approval from the institutional authorities of ESPOL Polytechnic University after checking the Ethics Committees rules related to data management [74], privacy, and informed consent. The informed consent stressed confidentiality, anonymity, voluntary participation, the right to withdraw at any time without consequences, and the researcher’s contact details. The participants filled out paper and pencil forms in a separate room.

3.4. Scale Design

Figure 2 depicts the scale design and evaluation process. The design process resulted in an instrument consisting of forty-four items derived from existing tools and connected each item with the three Key Financial Decisions chosen for analysis: Car, house, and retirement account, as Table S2 reveals in Supplementary Materials.
Next to the fact that this is a newly designed instrument and the fact that a different—Spanish speaking—the audience is being addressed, this explains the need to set up a specific quality assessment to use the instrument in future research.
Table S2 of Supplementary Materials summarizes the references documenting the origin of the forty-four items of the scale construction, with thirty-three items derived from Potrich et al. (2017), five from CFL et al. (2013), four from Kiliyanni et al. (2016), one of Lusardi et al. (2011), and one proposed by the authors [35,49,64,66]. In total, fifteen items were adapted (A), twenty-eight were copied and translated as such (C), and one new item was developed.
The FK subscale, with thirteen items, consists of five “basic FK” and eight “advanced FK” items. Essential knowledge items measure basic understanding of topics related to inflation, tax rates, and the value of money over time. Advanced knowledge items explore knowledge concerning complex financial instruments and key financial decisions; (e.g., buying a car, house, retirement account). The respondent’s choice is about a correct answer between other options offered as distractors.
The FB subscale consists of thirteen items analyzing actual FB of individuals from two perspectives: FB control (7 items) and FB related to savings (6 items). Seventeen of the eighteen FB items have been derived from Potrich et al. (2017), and the remaining were based on Kilyanni et al. (2016) [49,66]. While most items adopt a general financial focus, three items focus on retirement issues. Item modifications resulted in aligning item formulation. By focusing on young adults, item design should consider that respondents cannot always identify themselves with specific issues. This explains why respondents were offered a 6-point Likert scale starting from 0 “Not Applicable” to 1 “never” and 5 “always”. The extra option raised in scale items as they do not—yet—reveal living the listed experiences; see, e.g., credit card usage, paying loans, retirement planning.
The FA subscale builds on eighteen items focusing on an individual’s self-evaluation of their financial management. Fifteen items were derived from Potrich et al. (2017) and were complemented with items from the Commission for FL and Retirement Income scale of 2013. [35,66] Three questions exclusively addressed retirement issues. All FA items were scored with a 5-point Likert scale, with 1 “strongly disagree” to 5 “strongly agree” (See Table S2 in Supplementary Files).
Building on the scale structure, FL scoring reflects the number of items and the nature of the answering categories: FA 90 points (18∗5), FB 65 points (13∗5), and FK 13 points (1∗13). The total scale FL score is the average of the three subscale scores. The maximum value for each subscale can be transformed as a percentage of 100%.

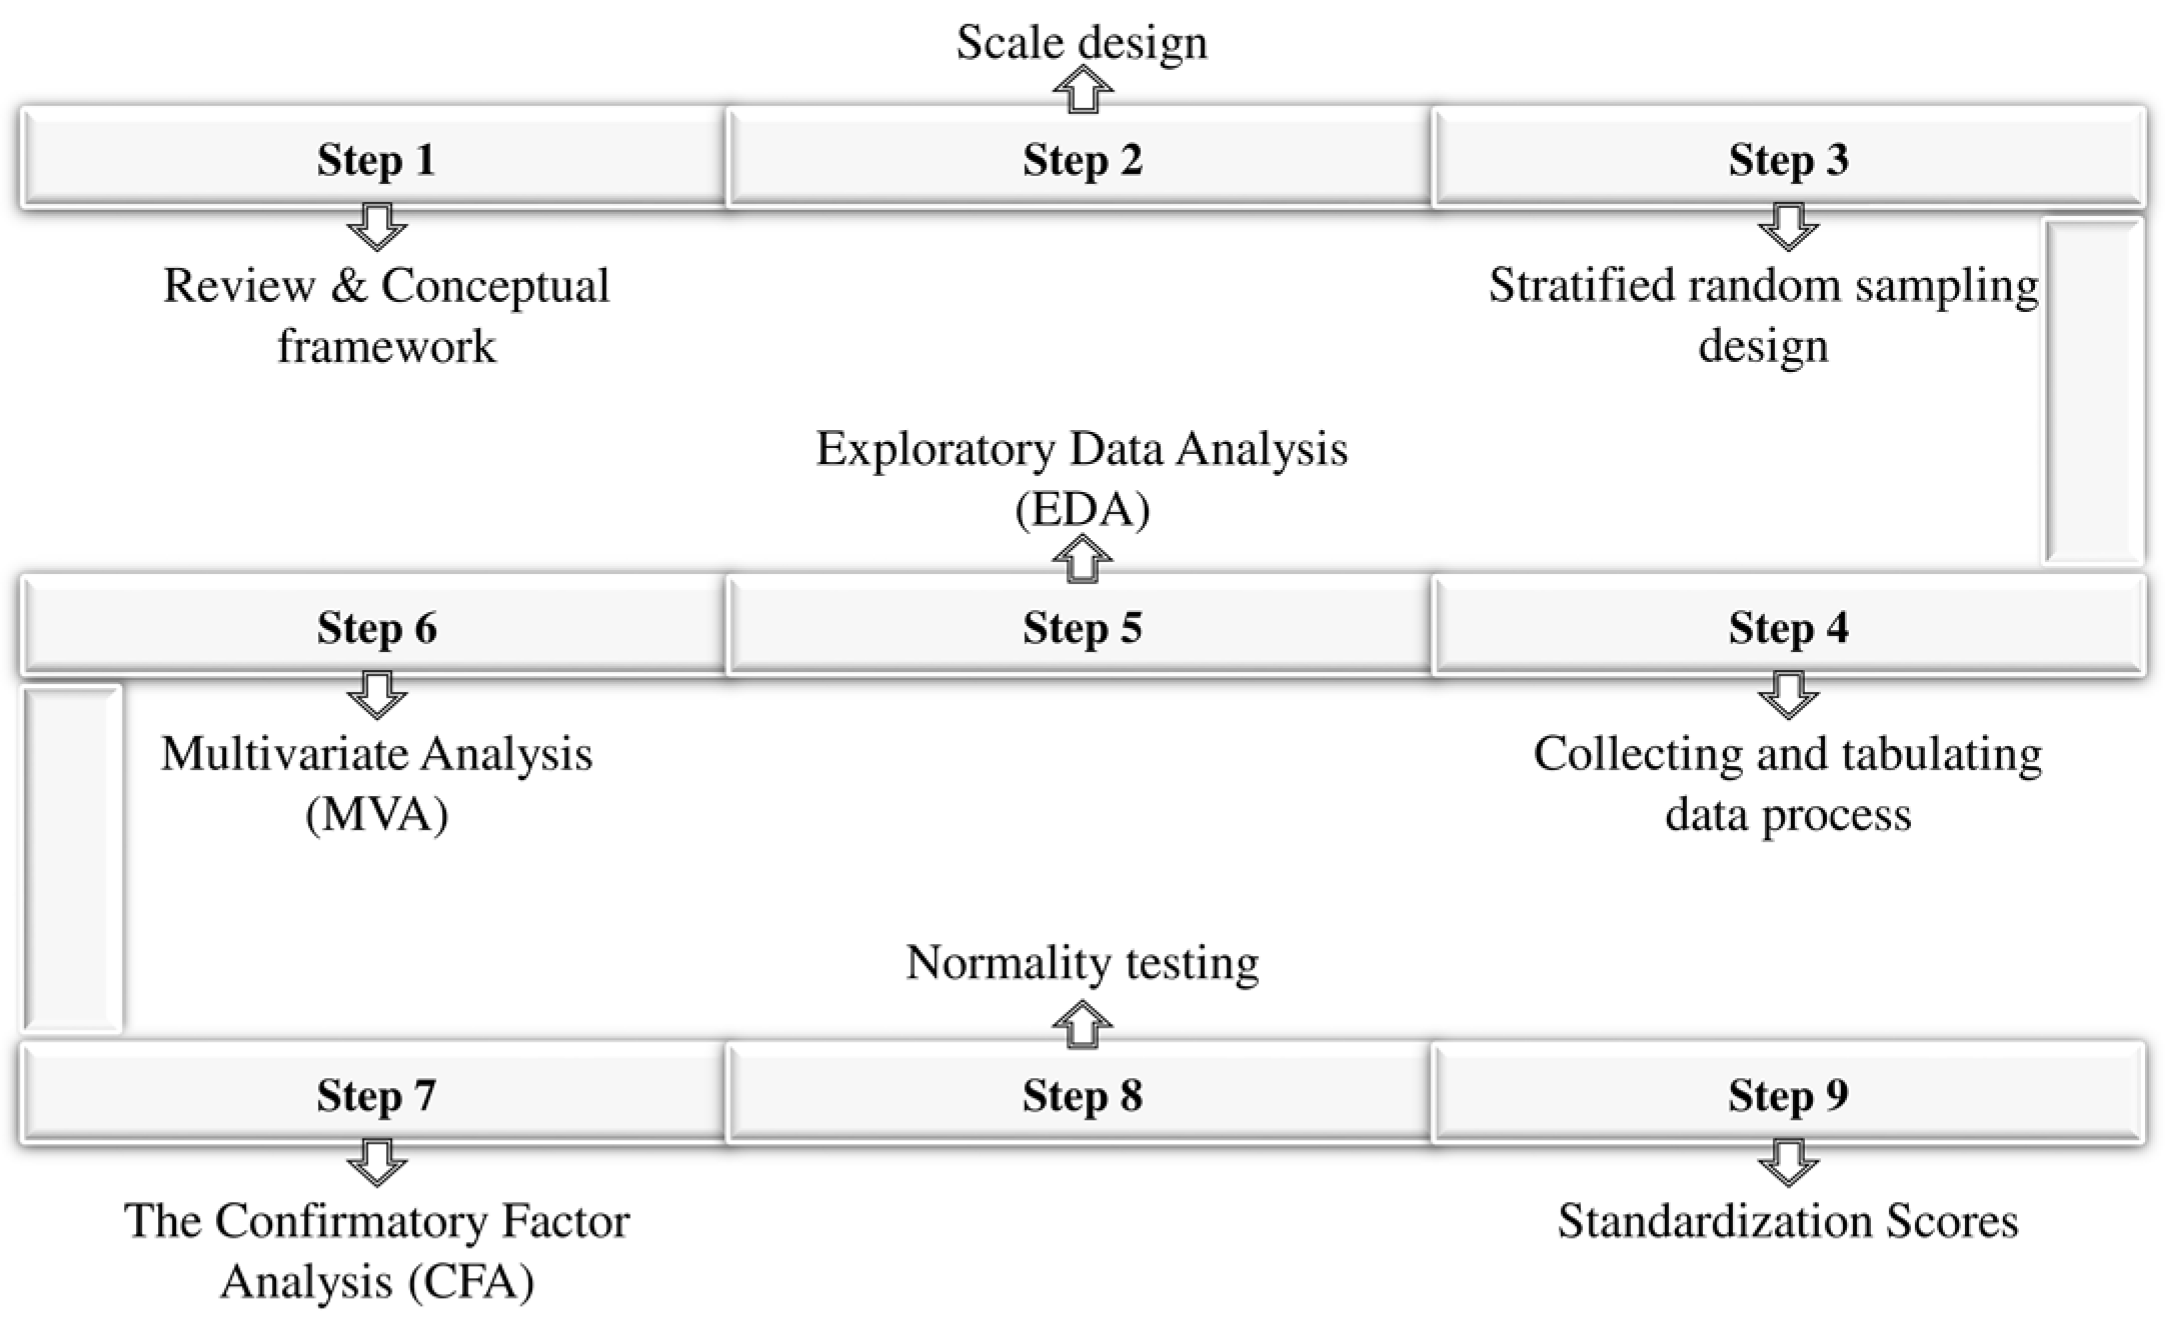
3.5. Analysis Procedure

Confirmatory Factor Analysis (CFA) suits to validate the constructs when there is underlying knowledge [75]. Table S1 in Supplementary Materials shows whether theoretical and/or empirical way the variables FA, FB, and FK underlie the FL concept [75,76]. CFA included scrutinization of factor loadings and p-values for every item. The analysis procedure started with correlation analysis to assess the convenience of subsequent factor analysis convergent validity, reliability, and structured equation model (SEM), trying to confirm the significative explanation of the FL brought by their dimensions [77,78].
Lavaan version 0.6–5 [79], implemented in R version 3.6.1 and R-studio 2019 [80], were used to carry out CFA based on maximum likelihood estimation. The correlation analysis results help study the relationship between 44 items [60]. The latent factors were standardized, allowing estimates free of factorial loads [81]. Chi-Square relative/normed chi-square (χ2/pdf) should be between 2.0 and 5.0; GFI should be at least 0.9, with 0.95 being a more conservative value; CFI and TLI are expected to be >0.95, and SRMR and RMSEA values are expected being <0.08 [82].
The internal consistency is considered acceptable with a Cronbach’s alpha of 0.7; good with values between 0.8 ≤ α < 0.9, and excellent when α exceeds or is equal to 0.9 [83]. Building on Blackwell et al. (2017) [84], we could conclude that missing data remained within acceptable limits (57 missing answers related to 22 items).

4. Results

The participants are full-time university students aged 18–30, distributed in 33 grade-level programs. Fifty-eight percent of the 478 sample profiles are women.

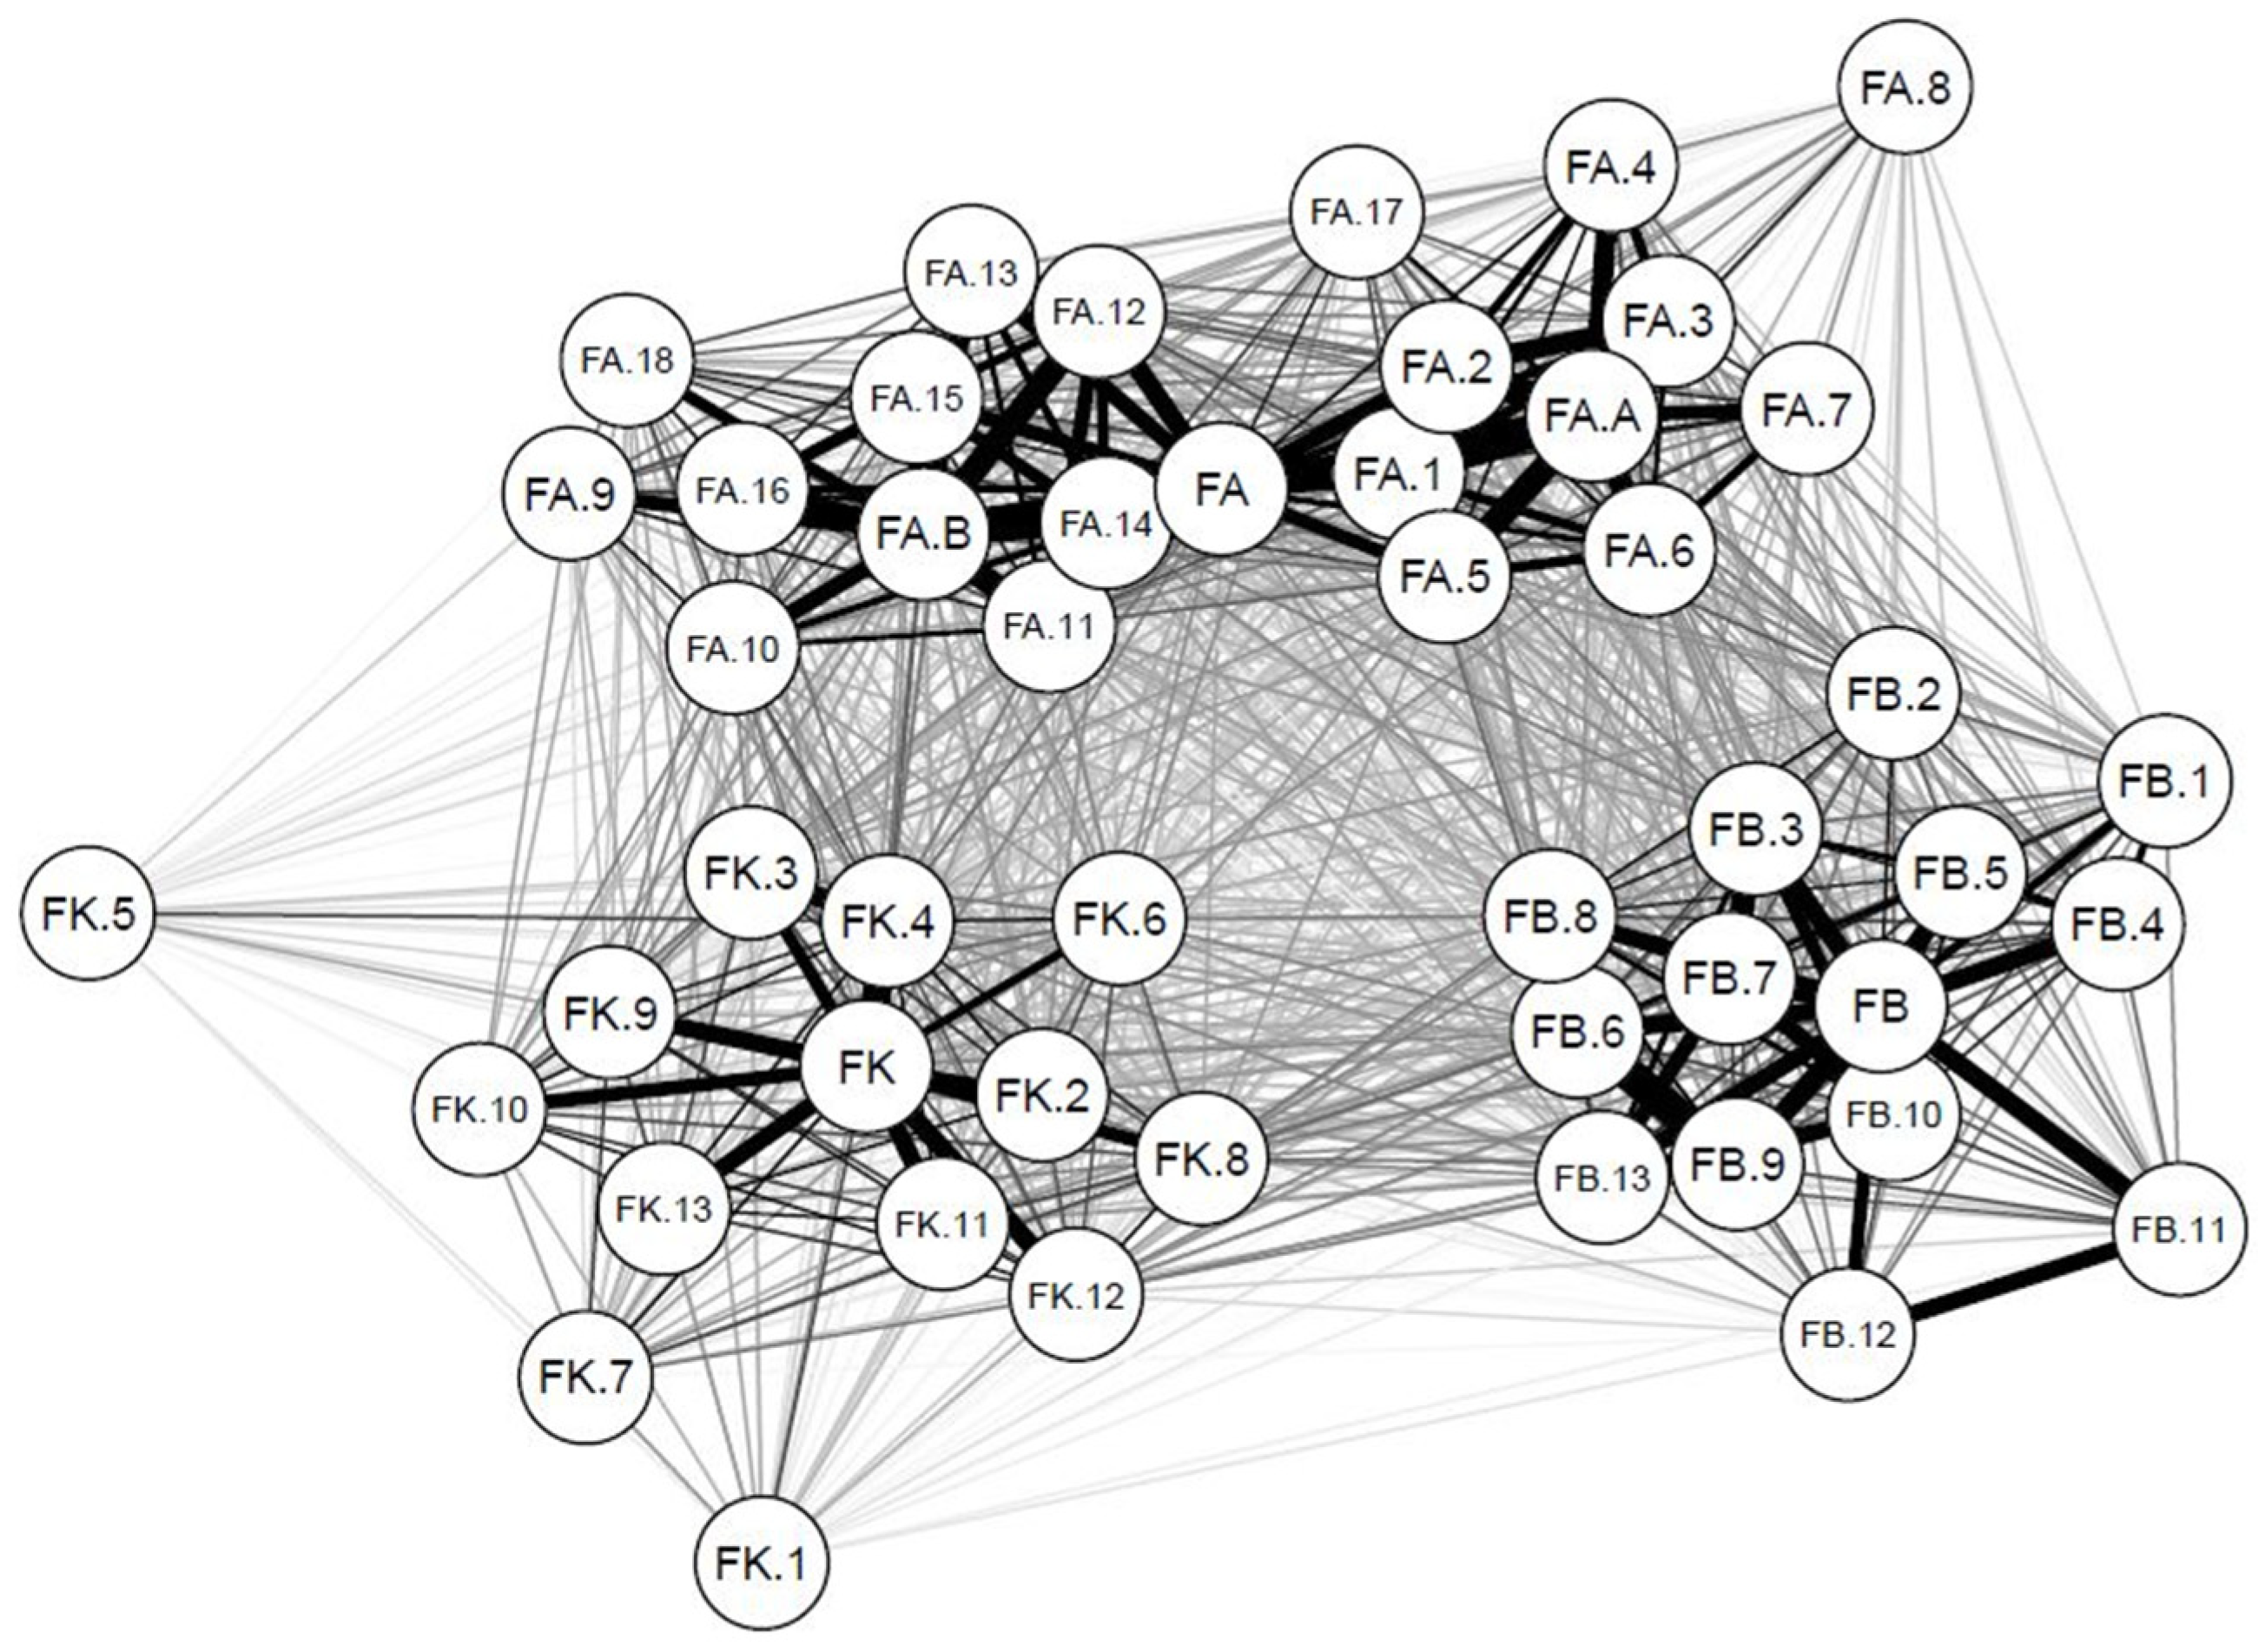
4.1. Correlational Analysis Results

Figure 3 shows how-item correlations are significant when looking at within-cluster correlations; the thickness of the connectors represents the absolute magnitude of the correlation value [85]. This fact implies that the CFA could start from most 44 items while considering the three FL dimensions.
Figure 3 shows how the items FA.8, FK.1, and FK.5 are lowly correlated with items within the same subscale, pushing to their omission from the subsequent scale analysis.
Looking at the items aligned with the Financial Knowledge dimension, we observe strong correlations between FK.4 and FK.3. Next, FK.1 to FK.5 represent Basic Financial Knowledge and show strong intercorrelations. The correlations of these items with the other subset (FK.7, FK.9, FK.10, FK.12, FK.13) reflect the differences explicitly embedded into the two subdimensions pursued within this dimension.
Item correlation results about FB show how all items seem to fit this dimension.
Items associated with the FA dimension reflect two groups: “FA.A” and “FA.B,” as the direct and reverse code subgroups (see Table S2 in Supplementary Materials), with high item correlations.
Overall, we observe a positive and significant correlation between FA, FB, FK, and FL (rFA, FB: 0.38; rFA, FK: 0.42; rFA, FL: 0.32; rFB, FK: 0.27; rFB, FL: 0.29; rFK, FL: 0.33).

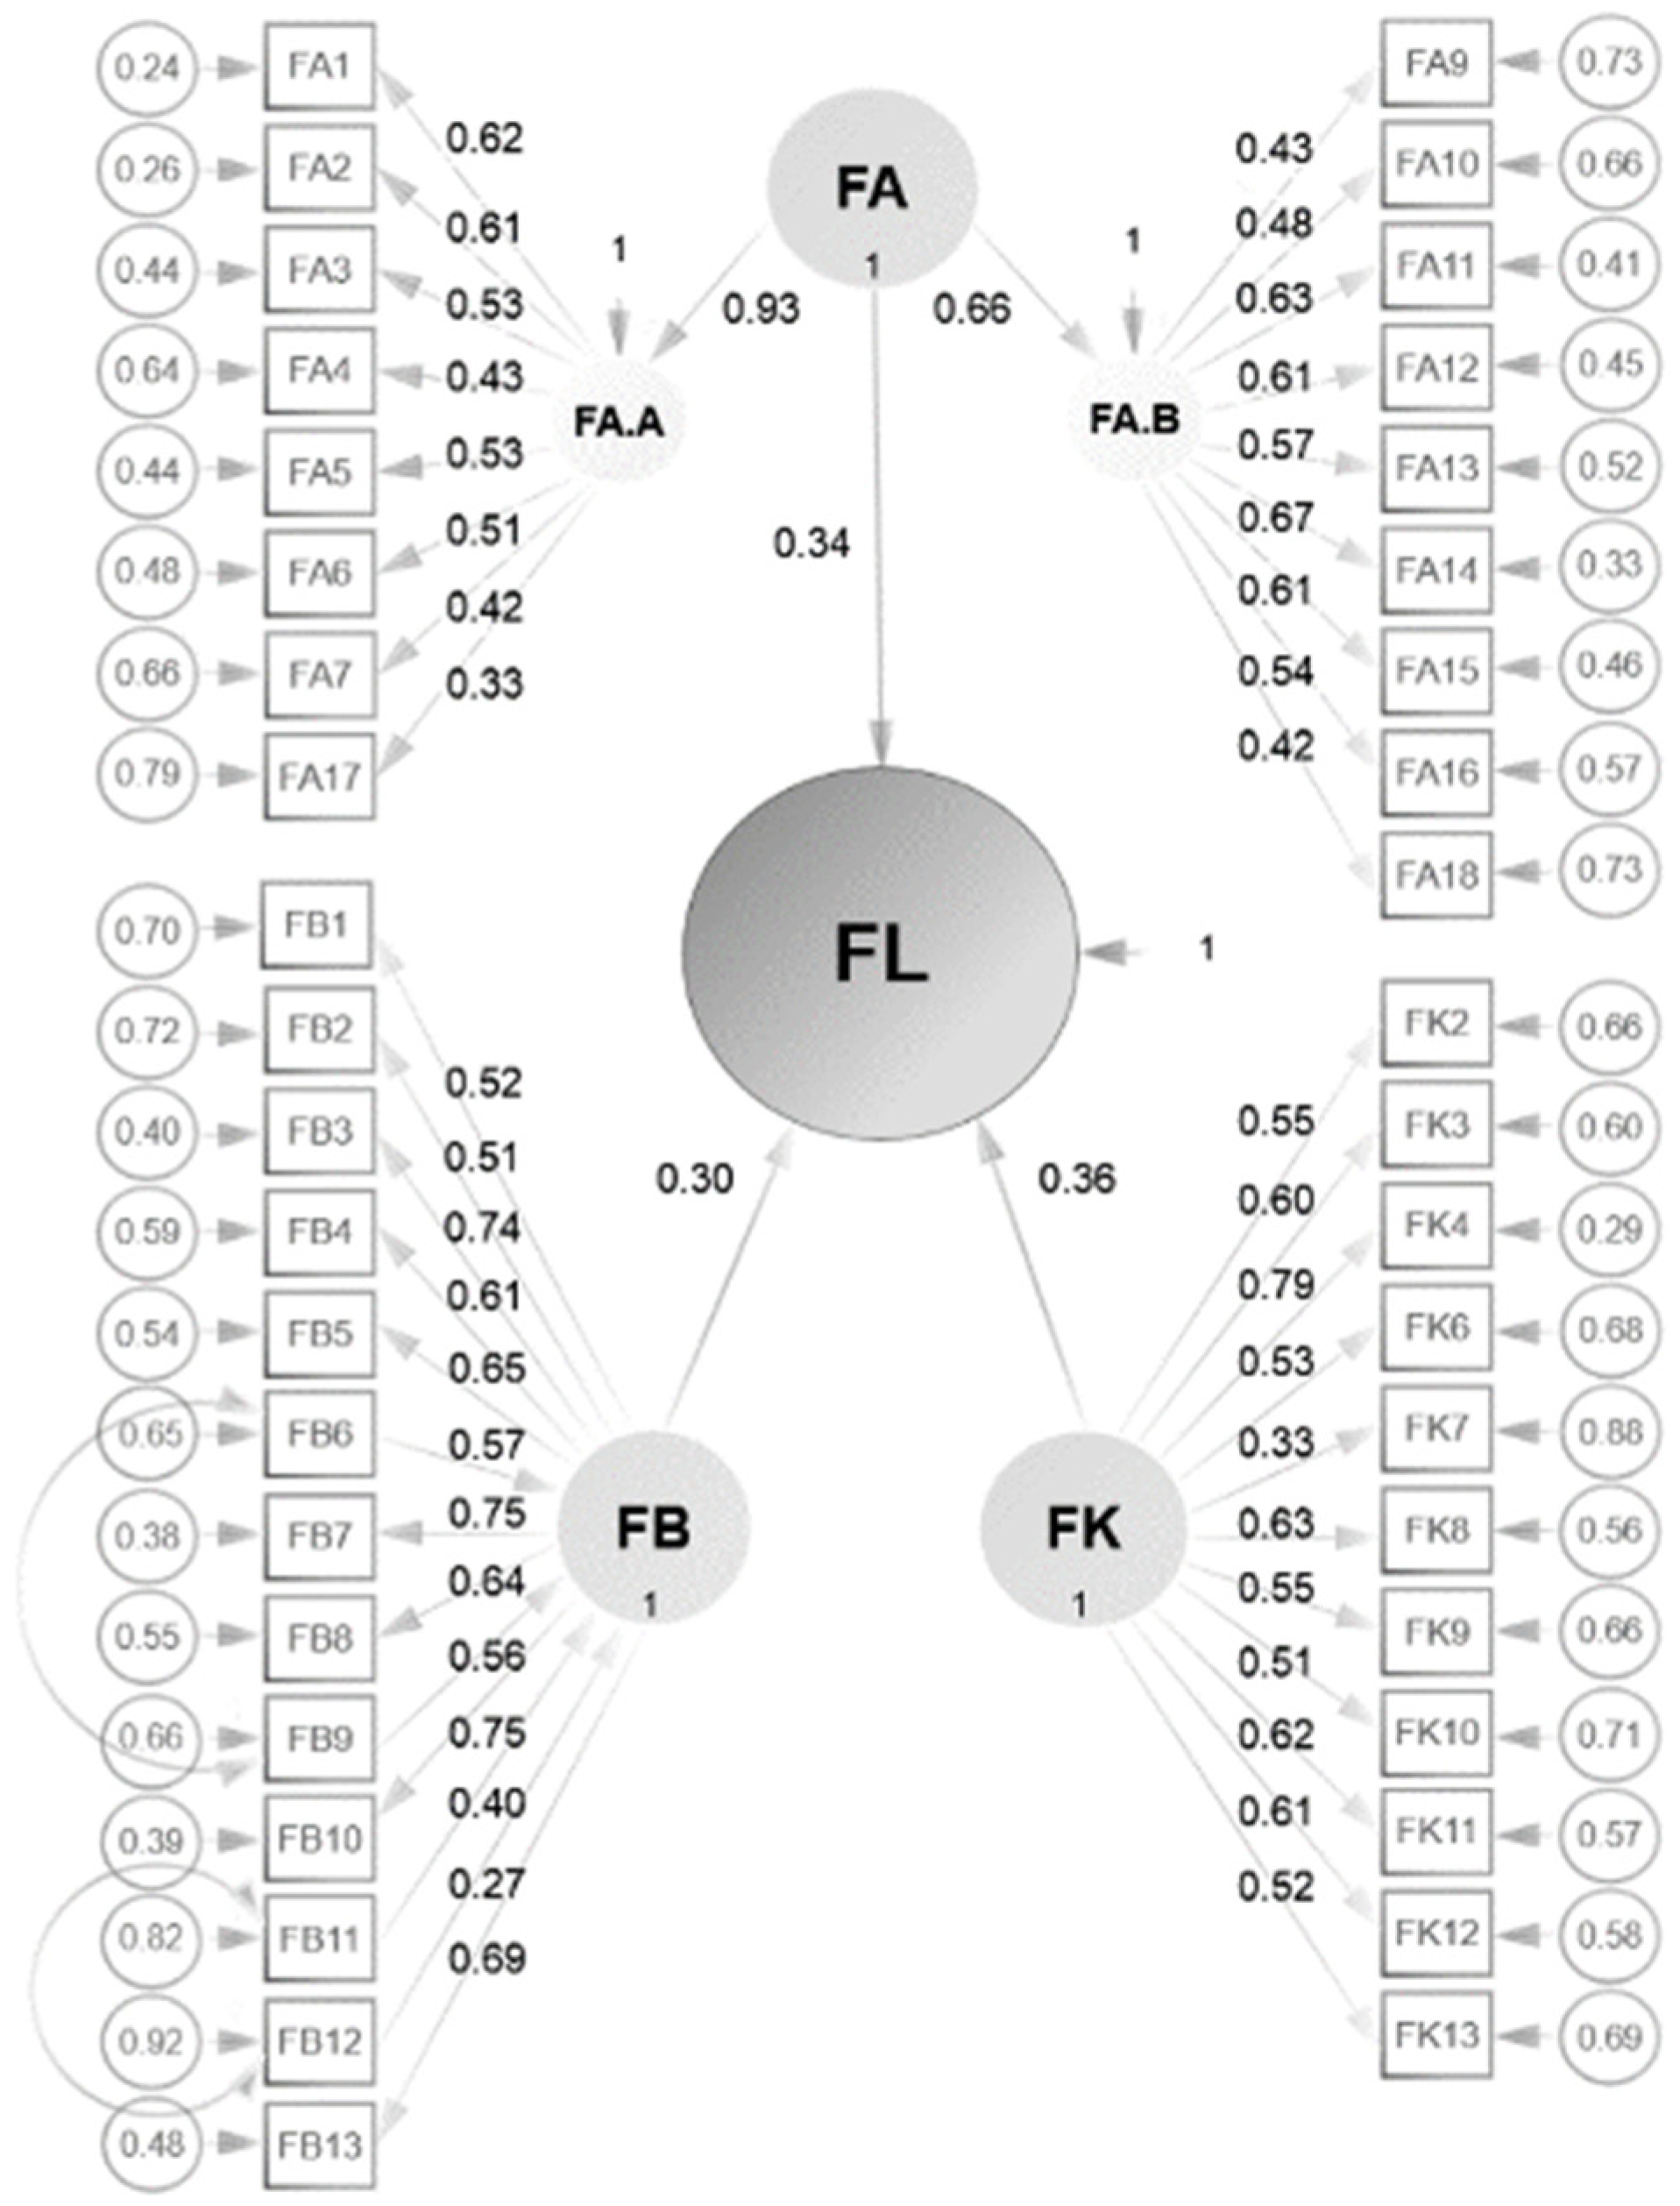
4.2. Validity and Reliability of the Scale

The analysis processes started from forty-one variables. As can be derived from Figure 4 and Table 1, the best model fit could be achieved in three steps: after allowing for covariances at the level of the three FL dimensions and between some within-subscale items: FB~~FK; FA~~FK; FA~~FB; FB6~~FB9; FB11~~FB12. All item-factor loadings—in the final model—approach 0.7, except for the items FA.17, FB.11, FB.12, and FK.7.
Further details are represented in Figure 4, and more details can be found in Table S2 of Supplementary Materials. The final model reflects good convergent validity. Cronbach’s alpha for the entire FL scale is 0.855, implying good to excellent reliability. The FK dimension reflects good reliability α = 0.747; the FB dimension reflects high reliability α = 0.857 and the FA dimension scale mirrors again very good reliability α = 0.852.
Building on Figure 4, the coefficients of the CFA model can be read as follows:
FL = ( 0.34 FA ) + ( 0.30 FB ) + ( 0.36 FK )
FK and FA reflect almost similar coefficients, explaining the young adults’ FL level.
Figure 4 shows FL’s structural equation model (SEM) with the significant standardized coefficients and the latent indicator variables joined by five significative covariances. The results show positive and significant relationships between FA-FB, FA-FK, and FB-FK.
According to Table 2, the SEM results corroborate empirical evidence on the positive and significant influences of the three dimensions: FA, FB, and FK, as determinants of FL among young adults, showing an appropriate segment to design a scale containing those dimensions.

4.3. Exploring Financial Literacy in the Ecuadorian Sample

Given the quality of the new scale, we can explore FL in the current Ecuadorian sample. We observe that the average score for FL is 65%. Average scores for the subscale are as follows: FK = 50%; FB = 66%; and FA = 79%. A further exploration builds on looking at the distribution of the scores.
Applying a one-sample t-test when comparing the different average FL and dimensions scores, shows that consistently, the Ecuadorian group is above the benchmark 60% excepting FK dimension. The t-student test at 95% to FL (t = 9.01; p < 0.00 ***), FK (t = −17.84; p = 1.00), FB (t = 7.16; p < 0.00 ***) and FA (t = 38.75; p < 0.00 ***).
The total FL score and the sub-scores were standardized and rescaled to obtain a measure between 0–100 (See Figure S1 in Supplementary Files).
Standardization formula [86].
Z = x μ σ ;   w h e r e :   x = s c o r e ,   μ = m e a n   a n d   σ = s t a n d a r d   d e v i a t (Zimmerman & Zumbo, 1993) [87,88]
Y = μ + σ x ;   w h e r e :   μ = 50 ,   σ = 50 3   a n d   x = s c o r e
Building on the standardized scores, this was done by looking at the proportion of students attaining a level; five levels are considered: “very high”, “high”, “average”, “low”, and “very low”. These are based on the following values 100–80, 80–60, 60–40, 40–20, 20–0.
The above brings us to the question: Are Ecuadorian young adults financially literate? Answering the question depends on the choice of a benchmark. Since the current average—reported concerning most scales—is 60%. Our results can be matched to this number.
Looking at the FL level of the current target group (n:478), only 3% reflect a “very high” FL level, followed by 25% with a “high” level. Next, 46% reflect an “average” level, 22% appear to have a “low” level, and 4% seem to have a “very low” FL level. Comparable information is available in Figure 5 for the FK, FB, and FA subscales.
28% of the sample has a score higher than 60%, and 26% are in a range of low and very low. The numbers show an FL issue considering this sample is an educated people in the community.

5. Discussion and Conclusions

FL receives growing attention. The research literature points to the importance of FL considering the economic and social development of individuals and society. As used in the literature, a conceptual analysis of the FL points to a multi-dimensional structure to capture FL. This fact is also reflected in an analysis of available research instruments. Next to a focus on financial knowledge, studies stress the importance of FB and FA. Building on the available tools, a new Spanish language scale was designed for the Ecuadorian context, aiming at young adults, and considering several Key Financial Decisions /KFD) in a consistent way. Forty-four items were translated, adapted, and presented to university students. Subsequent analysis steps resulted in a 41 items FL scale consisting of three subscales.
Three dimensions, FA, FB, and FK, act as clear variables belonging to FL according to SEM hypotheses grounded in the theoretical framework [26,77,78]. As the current literature review revealed and our results confronting, FA criteria cannot be neglected as the FL component, nor the FK should be the unique component explaining FL. Thus, according to the young adult’s sample, FL comprises knowledge, attitude, and behavior dimensions, showing an appropriate segment to design a scale containing those dimensions.
The new FL scale has been built on the KFD criteria pursuing to give the fittest evaluation of our reality compared to the three worldwide known scales, the OECD/INFE Toolkit [21] for measuring FL and financial inclusion, The Test of FL survey [24], and finally the S&P FL Survey [23]. These three FL scales also share the three FL dimensions with our instrument to reflect a comprehensive picture of FL: FK, FB, and FA.
Comparing our new scale based on our reality [26] to those available in the Latin American and Caribbean setting, three comparable formal scales are available: one from Brazil (37 items), Chile, FL (39 items), and Mexico (26 items). Our scale resembles most of a Brazilian alternative [15] Still, our new FL scale’s reliability and fit indices reached a higher performance because our items were often adapted from earlier instruments and adopted stringent procedures revealed in the manuscript. A second observation is that the new scale consists of three balanced subscales mirroring a relevant and comparable loading on the general FL construct (0.34; 0.30; and 0.36) and confirming their significative explanation of FL via SEM [77,78]. This result affirms that those dimensions are natural components of Fl in the sample of 478 young adults [2,66,89]. But the low intercorrelations between the three FL dimensions show that conceptual overlap is not too high. Each dimension reflects a unique feature of FL [22]; correlation values between the subscales are significant but not too high (maximum r = 0.27). This value meets the warning of Garg and Singh (2016) that subscales should be relatively independent of mapping a rich picture of financial literacy [10].
Overall, the results point to a relatively weak level of FL along all three dimensions. Even when comparing current FL scores with a modest 60% benchmark, less than one-third of the respondents can be considered sufficiently financially literate. This finding points to a critical need to foster financial education (FE), even among a group of highly educated adults [12]. Moreover, one quarter (26%) of the sample reflected “low” and “very low” FL levels. This result can be considered a small proportion, but remember, this finding is related to data from a highly educated sample. Overall, the FL values are mostly lower than those reported by CAF (2015, 2022) and Klapper and Lusardi (2019), 51% and 30%, respectively [20,22,90]. Therefore, all the FL scores are low and seem to call for a red flag in the Ecuadorian context, as was already done elsewhere [11,12,13,91].
Despite its strengths, the current study reflects some limitations. First, we rely on self-reporting items. These measures have statistical limitations and might be less reliable due to shifts in mood and the time of the data collection. Second, the current sample belongs to a well-educated proportion of the population with the expected most positive FL performance. Third, the bias in FL studies involving people and samples that are easily accessible with the skewness of only one evaluated institution. Fourth is the age bias of the sample group, where vast literature shows an inverted U-shaped effect because financial literacy increases as a person’s age increase until a certain point, then remains constant and decreases [39,40].
Since FL is already low in this sample, the current results cannot yet be generalized. One can expect that results from the general community will be disturbing and emphasize that FL is a red flag in Ecuador’s financial and economic development.
Nevertheless, the research is novel and original, being the first study that evaluates the financial literacy level of ESPOL Polytechnic University Students—revealing all details concerning the item sources and contributing with a new FL scale built under the key financial decisions criteria.
The contribution of the present study is clear. Firstly, the scale and the data collected answer the need for formal scales in the region [19], and the scale is adapted to the country framework [26]. Those facts are followed by a strengths list of the new scale: (a) The FL scale is grounded in items linked to Key Financial Decisions (KFD): buying a car, a house, and having a retirement account; (b) the scale reflects a balanced focus on the FA, FB, and FK dimension; (c) the scale addresses young adults at a critical point in their life, at the moment they become independent financial consumers and lastly (d) a benchmark is now available to direct other studies in the Ecuadorian context.
Those remarks introduce future research directions that center on profiling FL in a broader Ecuadorian sample, linking FL to critical financial products in Ecuador, and studies measuring the impact of FE interventions and financial support provisions. The focus on FE is crucial in this context, especially when we observe that FL is relatively weak in Ecuadorian young adults, especially the highly educated sample, with only 28% of them reflecting high FL (FL score > 60%).
The related study should be repeated by involving a new sample through further analysis of the Ecuadorian FL. In this study, other background variables could be collected that help characterizes the nature of FL differences in the Ecuadorian population (gender, age levels, regional variation, rural-urban, income levels, etc. Additionally, the scale could be used to map FL differences before and after financial education interventions.

Supplementary Materials

The following supporting information can be downloaded at: https://www.mdpi.com/article/10.3390/educsci12070460/s1, Table S1: FL (FL) Definitions and Dimensions Compared (2010–2021); Table S2: Characteristics of the items and the scale; Figure S1: The FL scale process from CFA to the Standardization.

Author Contributions

Conceptualization, S.M.M.P., P.E.; methodology, S.M.M.P., M.V. and P.E.; software, S.M.M.P.; validation, S.M.M.P., M.V. and P.E.; formal analysis, S.M.M.P.; investigation, S.M.M.P.; resources, S.M.M.P.; data curation, S.M.M.P.; writing—original draft preparation, S.M.M.P.; writing—review and editing, S.M.M.P., M.V., K.C. and P.E.; visualization, S.M.M.P.; supervision, M.V., K.C. and P.E.; project administration, S.M.M.P.; funding acquisition, S.M.M.P. All authors have read and agreed to the published version of the manuscript.

Funding

This research received no external funding.

Institutional Review Board Statement

The study was conducted following the Declaration of Helsinki and approved by the Ethics Committee of ESPOL represented during those days by the Vice-Rector approval. All students were informed about the questionary and its implications. They were informed of the type of questions they would answer, the importance of the questionary, the estimated time, and how the survey was divided. Out loud, they receive an oral introduction and invitation to be part or go out of the room. Then they received the paper form with the same content having a second chance to drop the survey, and they began filling out as a third stage accepting to be part of the study. This study was conducted just for students aged 18 or older. Students could retire from the research with no consequences. Furthermore, they have informed their participation, and contribution answers to our questions were entirely voluntary, and data is confidential and only for research purposes, finishing with an acknowledgment to them.

Informed Consent Statement

Informed consent was obtained from all subjects involved in the study.

Data Availability Statement

Not applicable.

Acknowledgments

Thanks to the professors and students of ESPOL (Escuela Superior Politécnica del Litoral) for their active collaboration during the collecting data process.

Conflicts of Interest

The authors declare no conflict of interest.

References

  1. Roa, M.J.; Garrón, I.; Barboza, J. Financial Decisions and Financial Capabilities in the Andean Region. J. Consum. Aff. 2018. Available online: http://doi.wiley.com/10.1111/joca.12187 (accessed on 18 October 2018).
  2. Klapper, L.; Lusardi, A.; Panos, G.A. Financial literacy and its consequences: Evidence from Russia during the financial crisis. J. Bank. Financ. 2013, 37, 3904–3923. [Google Scholar] [CrossRef]
  3. OECD. OECD/INFE 2020 International Survey of Adult Financial Literacy. 2020. Available online: www.oecd.org/financial/education/launchoftheoecdinfeglobalfinancialliteracysurveyreport.htm (accessed on 8 June 2022).
  4. van der Cruijsen, C.; de Haan, J.; Roerink, R. Financial knowledge and trust in financial institutions. J. Consum. Aff. 2021, 55, 680–714. [Google Scholar] [CrossRef]
  5. Yeh, T.M.; Ling, Y. Confidence in Financial Literacy, Stock Market Participation, and Retirement Planning. J. Fam. Econ. Issues 2022, 43, 169–186. [Google Scholar] [CrossRef]
  6. Vieira, K.M.; Delanoy, M.M.; Potrich, A.C.G.; Bressan, A.A. Financial Citizenship Perception (FCP) Scale: Proposition and validation of a measure. Int. J. Bank Mark. 2021, 39, 127–146. [Google Scholar] [CrossRef]
  7. Lusardi, A. Financial literacy and the need for financial education: Evidence and implications. Swiss J. Econ. Stat. 2019, 155, 1. [Google Scholar] [CrossRef] [Green Version]
  8. Henager, R.; Cude, B.J. Financial Literacy and Long-and Short-Term Financial Behavior in Different Age Groups. J. Financ. Couns. Plan. 2016, 27, 3–19. [Google Scholar] [CrossRef]
  9. Yakoboski, P.J.; Lusardi, A.; Hasler, A. The 2020 TIAA Institute-GFLEC Personal Finance Index: Many Do Not Know What They Do and Do Not Know. 2020. Available online: https://gflec.org/initiatives/personal-finance-index/ (accessed on 8 June 2022).
  10. Garg, N.; Singh, S. Financial literacy among youth. Int. J. Soc. Econ. 2018, 45, 173–186. [Google Scholar] [CrossRef]
  11. Huhmann, B.A. Literacy matters in marketing. Int. J. Bank Mark. 2017, 35, 5. [Google Scholar] [CrossRef]
  12. Mudzingiri, C.; Mwamba, J.W.M.; Keyser, J.N. Financial behavior, confidence, risk preferences and financial literacy of university students. Cogent Econ. Financ. 2018, 6, 1512366. [Google Scholar] [CrossRef] [Green Version]
  13. Shim, S.; Barber, B.L.; Card, N.A.; Xiao, J.J.; Serido, J. Financial Socialization of First-year College Students: The Roles of Parents, Work, and Education. J. Youth Adolesc. 2010, 39, 1457–1470. [Google Scholar] [CrossRef] [PubMed]
  14. Cavdar, S.C.; Aydin, A.D. An Experimental Study on Relationship between Student Socio-Economic Profile, Financial Literacy, Student Satisfaction and Innovation within the Framework of TQM. Procedia Soc. Behav. Sci. 2015, 195, 739–748. [Google Scholar] [CrossRef]
  15. Vieira, K.M.; Potrich, A.C.G.; Mendes-Da-Silva, W. A financial literacy model for university students. In Individual Behaviors and Technologies for Financial Innovations; Springer: Cham, Switzerland, 2018; pp. 69–95. [Google Scholar] [CrossRef]
  16. Yildirim, M.M.; Vardari, L. Mathematical and Financial Literacy: A Research with Prizren University Students. Cypriot J. Educ. Sci. 2020, 15, 1574–1586. Available online: https://www.researchgate.net/publication/348149471_Mathematical_and_financial_literacy_A_research_with_prizren_University_students (accessed on 11 May 2021). [CrossRef]
  17. Pavković, A.; Anđelinović, M.; Mišević, D. Measuring financial literacy of university students. Croat. Oper. Res. Rev. 2018, 9, 87–97. [Google Scholar] [CrossRef]
  18. Mändmaa, S. Analyzing the factors influencing university students’ financial literacy. Int. J. Innov. Educ. Res. 2019, 7, 465–497. [Google Scholar] [CrossRef] [Green Version]
  19. Méndez Prado, S.M.; Zambrano Franco, M.J.; Zambrano Zapata, S.G.; Chiluiza García, K.M.; Everaert, P.; Valcke, M. A Systematic Review of Financial Literacy Research in Latin America and The Caribbean. Sustainability 2022, 14, 3814. [Google Scholar] [CrossRef]
  20. Klapper, L.; Lusardi, A. Financial literacy and financial resilience: Evidence from around the world. Financ. Manag. 2019, 49, 589–614. [Google Scholar] [CrossRef]
  21. OECD/INFE. OECD/INFE Toolkit for Measuring Financial Literacy and Financial Inclusion. OECD. 2018, pp. 1–47. Available online: https://www.oecd.org/financial/education/2018-INFE-FinLit-Measurement-Toolkit.pdf (accessed on 8 June 2022).
  22. CAF. Encuesta de Medición de las Capacidades Financieras en los Países Andinos. Inf. Comp. 2015, 40. Available online: http://www.sic.gov.co/drupal/sites/default/files/files/Informe_Estadistico_de_Registro_Publicos_2015.pdf (accessed on 8 June 2022).
  23. Klapper, L.; Lusardi, A.; van Oudheusden, P. Insights from the Standard & Poor’S Ratings Services Global Financial Literacy Survey. Financial Literacy around the World. 2015. Available online: https://data.opendevelopmentmekong.net/library_record/financial-literacy-around-the-world-insights-from-t/resource/3322e885-f1fb-4450-a6c7-b8692cc7f057 (accessed on 3 June 2021).
  24. Walstad, W.; Urban, C.; JAsarta, C.; Breitbach, E.; Bosshardt, W.; Heath, J.; O’Neill, B.; Wagner, J.; Xiao, J.J. Perspectives on evaluation in financial education: Landscape, issues, and studies. J. Econ. Educ. 2017, 48, 93–112. [Google Scholar] [CrossRef]
  25. Ranyard, R.; McNair, S.; Nicolini, G.; Duxbury, D.; Duxbury, A.D. An item response theory approach to constructing and evaluating brief and in-depth financial literacy scales. J. Consum. Aff. 2020, 54, 1121–1156. [Google Scholar] [CrossRef]
  26. Schuhen, M.; Schürkmann, S. Construct validity of financial literacy. Int. Rev. Econ. Educ. 2014, 16, 1–11. [Google Scholar] [CrossRef]
  27. Aguilar, X.P.; Ortiz, B.M. Diseño de un Programa de Educación y Cultura Financiera Para los Estudiantes de Modalidad Presencial de la Titulación en Administración en Banca y Finanzas. UTPL. 2013. Available online: https://dspace.utpl.edu.ec/bitstream/123456789/7712/1/Tesis%20ECF%20final%20junio%203%2c%20%202013%20%281%29.pdf (accessed on 8 June 2022).
  28. Lusardi, A.; Mitchell, O.S. The economic importance of financial literacy: Theory and evidence. J. Econ. Lit. 2014, 52, 5–44. [Google Scholar] [CrossRef] [Green Version]
  29. van Rooij, M.; Lusardi, A.; Alessie, R. Financial literacy and stock market participation. J. Financ. Econ. 2011, 101, 449–472. [Google Scholar] [CrossRef] [Green Version]
  30. Huston, S.J. Measuring Financial Literacy. J. Consum. Aff. 2010, 44, 296–316. [Google Scholar] [CrossRef]
  31. Atkinson, A.; Messy, F.-A. Promoting Financial Inclusion through Financial Education.pdf; OECD Working Papers on Finance, Insurance and Private Pensions; OECD: Paris, France, 2013; Volume 34, pp. 1–54. [Google Scholar] [CrossRef]
  32. OECD. PISA 2012 Results: Students and Money: Financial Literacy Skills for the 21st Century (Volume VI); PISA; OECD Publishing: Paris, France, 2014; Volume 6, 204p. [Google Scholar] [CrossRef]
  33. Chaulagain, R.P. Contribution of Financial Literacy to Behavior. J. Econ. Behav. Stud. 2015, 7, 61–71. [Google Scholar] [CrossRef]
  34. Lusardi, A. Financial Literacy Skills for the 21st Century: Evidence from PISA. J. Consum. Aff. 2015, 49, 639–659. [Google Scholar] [CrossRef]
  35. Colmar Brunton, Social Research Agency. Financial Knowledge and Behaviour Survey 2013 CFL and RI, Commission for Financial Literacy and Retirement Income. Colmar Brunton, Social Research Agency. 2013, 6–10 of 225. Available online: http://media.nzherald.co.nz/webcontent/document/pdf/201324/FinancialSurvey.pdf (accessed on 8 June 2022).
  36. Ouachani, S.; Belhassine, O.; Kammoun, A. Measuring financial literacy: A literature review. Manag. Financ. 2021, 47, 266–281. [Google Scholar] [CrossRef]
  37. Oehler, A.; Horn, M.; Wendt, S.; Reisch, L.A.; Walker, T.J. Young Adults and Their Finances: An International Comparative Study on Applied Financial Literacy. Econ. Notes 2017, 47, 305–330. [Google Scholar] [CrossRef]
  38. Shim, S.; Serido, J.; Bosch, L.; Tang, C. Financial Identity-Processing Styles Among Young Adults: A Longitudinal Study of Socialization Factors and Consequences for Financial Capabilities. J. Consum. Aff. 2013, 47, 128–152. [Google Scholar] [CrossRef]
  39. Liaqat, F.; Mahmood, K.; Ali, F.H. Demographic and socio-economic differences in financial information literacy among university students. Inf. Dev. 2020, 37, 376–388. [Google Scholar] [CrossRef]
  40. Nanziri, E.L.; Leibbrandt, M. Measuring and profiling financial literacy in South Africa. S. Afr. J. Econ. Manag. Sci. 2018, 21, 1–17. [Google Scholar] [CrossRef]
  41. Gerrans, P.; Heaney, R. The impact of undergraduate personal finance education on individual financial literacy, attitudes and intentions. Account. Financ. 2016, 59, 177–217. [Google Scholar] [CrossRef]
  42. Longobardi, S.; Pagliuca, M.M.; Regoli, A. Can problem-solving attitudes explain the gender gap in financial literacy? Evidence from Italian students’ data. Qual. Quant. 2017, 52, 1677–1705. [Google Scholar] [CrossRef]
  43. Susanti, N.; Rahmayanti, R.; Padmakusumah, R.R.; Susanto, R. Factors Affecting Students’ Financial Literation: A Study on Widyatama University, Indonesia. Univers. J. Educ. Res. 2019, 7, 7–14. [Google Scholar] [CrossRef]
  44. Pangestu, S.; Karnadi, E.B. The effects of financial literacy and materialism on the savings decision of generation Z Indonesians. Cogent Bus. Manag. 2020, 7, 1743618. [Google Scholar] [CrossRef]
  45. Ergün, K. Financial literacy among university students: A study in eight European countries. Int. J. Consum. Stud. 2018, 42, 2–15. [Google Scholar] [CrossRef]
  46. Douissa, I.B. Factors affecting College students’ multidimensional financial literacy in the Middle East. Int. Rev. Econ. Educ. 2020, 35, 100173. [Google Scholar] [CrossRef]
  47. Ahmad, W.M.W. Financial literacy among Malaysian Muslim undergraduates. J. Islam. Account. Bus. Res. 2020, 11, 1515–1529. [Google Scholar] [CrossRef]
  48. de Cecco, S.; Estache, A. Is the belgian youth ready to save for retirement under a defined contribution pension system? Reflets Et Perspect. De La Vie Econ. 2016, 55, 99–118. [Google Scholar] [CrossRef] [Green Version]
  49. Kiliyanni, A.L.; Sivaraman, S. The perception-reality gap in financial literacy: Evidence from the most literate state in India. Int. Rev. Econ. Educ. 2016, 23, 47–64. [Google Scholar] [CrossRef]
  50. Jayaraman, J.; Jambunathan, S. Financial literacy among high school students: Evidence from India. Citizenship Soc. Econ. Educ. 2018, 17, 168–187. [Google Scholar] [CrossRef]
  51. Skagerlund, K.; Lind, T.; Strömbäck, C.; Tinghög, G.; Västfjäll, D. Financial literacy and the role of numeracy–How individuals’ attitude and affinity with numbers influence financial literacy? J. Behav. Exp. Econ. 2018, 74, 18–25. [Google Scholar] [CrossRef]
  52. Horobet, A.; Vrînceanu, G.; Hurduzeu, G.; Lupu, R. Financial Literacy in Romania: A Test of Economics and Business Students. Stud. Bus. Econ. 2020, 15, 269–286. [Google Scholar]
  53. Boisclair, D.; Lusardi, A.; Michaud, P.C. Financial literacy and retirement planning in Canada. J. Pension Econ. Financ. 2017, 16, 277–296. [Google Scholar] [CrossRef] [Green Version]
  54. Bongini, P.; Cucinelli, D. University students and retirement planning: Never too early. Int. J. Bank Mark. 2019, 37, 775–797. [Google Scholar] [CrossRef]
  55. Carlsson Hauff, J.; Nilsson, J. Determinants of indebtedness among young adults: Impacts of lender guidelines, explicit information and financial (over)confidence. Int. J. Consum. Stud. 2020, 44, 89–98. [Google Scholar] [CrossRef]
  56. Samek, A.; Kapteyn, A.; Gray, A. Using vignettes to improve understanding of Social Security and annuities. J. Pension-Econ. Financ. 2021, 21, 326–343. [Google Scholar] [CrossRef]
  57. Anderson, A.; Baker, F.; Robinson, D.T.; Bay, C.; Catasús, B.; Johed, G. Financial Literacy of University Students: Methodology and Results of an Online Survey. J. Consum. Aff. 2018, 6, 32–35. [Google Scholar]
  58. Ram, D.C.; Bansal, G. Impact of Financial Literacy (Fl) and Access To Banking Services ( Ac ) on Financial Well-Being ( Fwb ): An empirical study. Int. J. Manag. 2020, 11, 1010–1020. [Google Scholar]
  59. Al Azizah, U.S.; Mulyono, H. Dataset on determinants of intention and investment behaviour amongst young Indonesian millennials. Data Brief 2020, 32, 106083. [Google Scholar] [CrossRef] [PubMed]
  60. Sivaramakrishnan, S.; Srivastava, M.; Rastogi, A. Attitudinal factors, financial literacy, and stock market participation. Int. J. Bank Mark. 2017, 35, 818–841. [Google Scholar] [CrossRef]
  61. Aparicio, M.; Oliveira, T.; Bacao, F.; Painho, M. Gamification: A key determinant of massive open online course (MOOC) success. Inf. Manag. 2019, 56, 39–54. [Google Scholar] [CrossRef] [Green Version]
  62. Förster, M.; Happ, R.; Molerov, D. Using the U.S. Test of Financial Literacy in Germany-Adaptation and validation. J. Econ. Educ. 2017, 48, 123–135. [Google Scholar] [CrossRef]
  63. Amagir, A.; Groot, W.; Brink, H.M.V.D.; Wilschut, A. Financial literacy of high school students in the Netherlands: Knowledge, attitudes, self-efficacy, and behavior. Int. Rev. Econ. Educ. 2020, 34, 100185. [Google Scholar] [CrossRef]
  64. Lusardi, A.; Mitchell, O.S. Financial literacy around the world: An overview. J. Pension Econ. Financ. 2011, 10, 497–508. [Google Scholar] [CrossRef] [Green Version]
  65. Campara, J.; Vieira, K.; Potrich, A.C.; Paraboni, A.L. Programa Bolsa Família X Alfabetização Financeira: Em Busca de um Modelo Para Mulheres de Baixa Renda “Bolsa Família X” Program Financial Literacy: In Search of a Model for Low-income Women. ESPACIOS 2016, 37, 22. Available online: https://www.revistaespacios.com/a16v37n07/16370722.html (accessed on 3 June 2022).
  66. Potrich, A.C.G.; Vieira, K.M.; Kirch, G. How well do women do when it comes to financial literacy? Proposition of an indicator and analysis of gender differences. J. Behav. Exp. Financ. 2018, 17, 28–41. [Google Scholar] [CrossRef]
  67. Vieira, K.M.; Bressan, A.A.; Fraga, L.S. Financial well-being of the beneficiaries of the minha casa minha vida program: Perception and antecedents. Rev. Adm. Mackenzie 2021, 22, 1–40. [Google Scholar] [CrossRef]
  68. Farías, P. Determinants of perceived and actual knowledge of commission paid by contributors in the pension funds industry. BRQ Bus. Res. Q. 2017, 20, 18–27. [Google Scholar] [CrossRef] [Green Version]
  69. Coria, M.D.; Concha-Salgado, A.; Aravena, J.S. Adaptation, and validation of the economic and financial literacy test for chilean secondary students. Rev. Latinoam. Psicol. 2019, 51, 113–122. [Google Scholar]
  70. de la Fuente-Mella, H.; Umaña-Hermosilla, B.; Fonseca-Fuentes, M.; Elórtegui-Gómez, C. Multinomial logistic regression to estimate the financial education and financial knowledge of university students in Chile. Information 2021, 12, 379. [Google Scholar] [CrossRef]
  71. Arceo-Gómez, E.O.; Villagómez, F.A. Financial literacy among Mexican high school teenagers. Int. Rev. Econ. Educ. 2017, 24, 1–17. [Google Scholar] [CrossRef]
  72. Avendaño, W.R.; Rueda, G.; Velasco, B.M. Financial Perceptions and Skills Among University Students. Form. Univ. 2021, 14, 95–104. [Google Scholar] [CrossRef]
  73. Marshall, M.N. Sampling for qualitative research. Fam. Pract. 1996, 13, 522–526. [Google Scholar] [CrossRef]
  74. Monsalve, C. ESPOL Ethics Committee Certification. 2021. Available online: https://drive.google.com/file/d/1K8dUsrOdo2F2-YmFRTxj4OmeR8oYTSUX/view?usp=sharing (accessed on 4 June 2022).
  75. Byrne, B.M. Structural Equation Modeling with AMOS, 3rd ed.; Routledge: New York, NY, USA, 2016; 460p. [Google Scholar] [CrossRef]
  76. Gadermann, A.M.; Guhn, M.; Zumbo, B.D.; Columbia, B. Estimating ordinal reliability for Likert-type and ordinal item response data: A conceptual, empirical, and practical guide. Pract. Assess. Res. Eval. 2012, 17, 3. [Google Scholar]
  77. Mindra, R.; Moya, M.; Zuze, L.T.; Kodongo, O. Financial self-efficacy: A determinant of financial inclusion. Int. J. Bank Mark. 2017, 35, 338–353. [Google Scholar] [CrossRef]
  78. Xin Ding, D.; Hu, P.J.H.; Verma, R.; Wardell, D.G. The Impact of Service System Design and Flow Experience on Customer Satisfaction in Online Financial Services. J. Serv. Res. 2010, 13, 96–110. [Google Scholar] [CrossRef]
  79. Holtmann, J.; Koch, T.; Lochner, K.; Eid, M. A Comparison of ML, WLSMV, and Bayesian Methods for Multilevel Structural Equation Models in Small Samples: A Simulation Study. Multivar. Behav. Res. 2016, 51, 661–680. [Google Scholar] [CrossRef]
  80. R Core Team. Changes in R. R J. 2017, 9, 509–521. [Google Scholar]
  81. Burt, C. The factorial analysis of qualitiative data. Br. J. Stat. Psychol. 1950, 3, 166–185. [Google Scholar] [CrossRef]
  82. Hooper, D.; Coughlan, J.; Mullen, M.R. Structural Equation Modelling: Guidelines for Determining Model Fit Structural Equation Modelling: Guidelines for Determining Model Fit. Electron. J. Bus. Res. Methods 2008, 6, 53–60. [Google Scholar]
  83. Cronbach, L.J. Coefficient alpha and the internal structure of tests. Psychometrika 1951, 16, 297–334. [Google Scholar] [CrossRef] [Green Version]
  84. Blackwell, M.; Honaker, J.; King, G. A Unified Approach to Measurement Error and Missing Data: Overview and Applications. Sociol. Methods Res. 2017, 46, 303–341. [Google Scholar] [CrossRef]
  85. Epskamp, S.; Cramer, A.O.J.; Waldorp, L.J.; Schmittmann, V.D.; Borsboom, D. qgraph: Network Visualizations of Relationships in Psychometric Data. J. Stat. Softw. 2012, 48, 1–8. [Google Scholar] [CrossRef] [Green Version]
  86. Milligan, G.W.; Cooper, M.C. A study of standardization of variables in cluster analysis. J. Classif. 1988, 5, 181–204. [Google Scholar] [CrossRef]
  87. Morris, C.N. Parametric Empirical Bayes Inference: Theory and Applications. J. Am. Stat. Assoc. 1983, 78, 47–55. [Google Scholar] [CrossRef]
  88. Zimmerman, D.W.; Zumbo, B.D. Relative Power of the Wilcoxon Test, the Friedman Test, and Repeated-Measures ANOVA on Ranks. J. Exp. Educ. 1993, 62, 75–86. [Google Scholar] [CrossRef]
  89. Balasubramnian, B.; Sargent, C.S. Impact of inflated perceptions of financial literacy on financial decision making. J. Econ. Psychol. 2020, 80, 102306. [Google Scholar] [CrossRef]
  90. Auricchio, B.; Lara, E.; Mejía, D.; Remicio, P.; Valdez, M. Capacidades Financieras de las Mujeres. Brechas de Género en las Encuestas de Capacidades Financieras de CAF Brasil, Colombia, Ecuador y Perú. CAF 2022, 1–59. Available online: http://scioteca.caf.com/handle/123456789/1707 (accessed on 6 June 2022).
  91. Aydin, A.E.; Akben Selcuk, E. An investigation of financial literacy, money ethics and time preferences among college students: A structural equation model. Int. J. Bank Mark. 2019, 37, 880–900. [Google Scholar] [CrossRef]
Figure 1. Financial Literacy dimensions.
Education 12 00460 g001
Figure 2. Design and evaluation process.
Education 12 00460 g002
Figure 3. FL and dimensions correlations.
Education 12 00460 g003
Figure 4. Structural equation model of Financial Literacy (n:478). Notes: (1) *** p < 0.001 All path coefficients with. (2) cov FA, FB: 0.32; cov FA, FK: 0.35; cov FB, FK: 0.19, cov FB6, FB9: 0.48; cov FB11, FB12: 0.53.
Education 12 00460 g004
Figure 5. FL Levels in the Ecuadorian sample.
Education 12 00460 g005
Table 1. CFA Fit Statistics (n:478).
TrialModel 1Model 2Model 3
Applied Co-Variances--FB~~FK; FA~~FK; FA~~FBFB~~FK; FA~~FK; FA ~~FB; FB6~~FB9; FB11~~FB12
Chi-square (value)1746.171605.91306.04
Chi-square (p-value)000
Degrees of freedom775772770
Chi-square/Degrees of freedom2.252.081.70
GFI-Goodness of fit index0.9440.9590.97
CFI-Comparative fit index0.9240.9520.972
NFI-Normed fit index0.8980.9250.945
TLI-Tucker-Lewis index0.920.9490.97
RMR- Root media square residual0.0980.0790.074
RMSEA-Root media square error of approximation0.0740.0590.045
Cronbach’s Alpha α0.8550.8550.855
Table 2. Structural Model Results (n:478).
HnStructural PathsEstimateDecision
H1Financial Literacy ← Financial Attitude0.34 ***Supported
H2Financial Literacy ← Financial Behavior0.30 ***Supported
H3Financial Literacy ← Financial Knowledge0.36 ***Supported
*** p < 0.001.
Publisher’s Note: MDPI stays neutral with regard to jurisdictional claims in published maps and institutional affiliations.

