Review

A Weight and Meta-Analysis on the Academic Achievement of High School Students

by
Catarina Nunes
1,*,
Tiago Oliveira
1,
Fernando de Oliveira Santini
2,
Mauro Castelli
1 and
Frederico Cruz-Jesus
1
1
NOVA IMS Infomation Management School, Universidade Nova de Lisboa, 1070-312 Lisboa, Portugal
2
UNISINOS Business School, Universidade do Vale do Rio dos Sinos, Porto Alegre 93022-750, Brazil
*
Author to whom correspondence should be addressed.
Educ. Sci. 2022, 12(5), 287; https://doi.org/10.3390/educsci12050287
Submission received: 28 February 2022 / Revised: 9 April 2022 / Accepted: 10 April 2022 / Published: 19 April 2022

Abstract

:
Understanding the determinants of academic achievement (AA) is crucial for virtually every stakeholder interested in personal development and individual and societal wellbeing. Extensive research in several areas, such as education, economics, or psychology, has addressed this topic, identifying a vast number of determinants that impact high school students’ AA. In this work, we perform a meta-analysis, including a weight analysis of 49 quantitative studies that investigate this topic, exploring the best predictors of high school students’ academic success. We also explore moderation effects. Our results show that academic self-efficacy and socioeconomic status are the best predictors of AA, and they are statistically significant. Other statistically significant predictors, albeit less common in the analyses, are mastery avoidance, motivation, sleep habits, and work avoidance. Implications for theory and practice and directions for future research are discussed.

1. Introduction

Academic achievement (AA) has been a key topic of interest in many areas of knowledge, namely education, psychology, sociology, and economics [1], and involves one’s family, community, and school experiences [2]. It is usually measured through performance, namely individual students’ grades in a given year, school achievement exams or standardized test scores in core subjects, grade point average (GPA), and teacher rating scales [3].
The impact that students’ AA has on individuals and overall society is a matter that has increasingly concerned researchers, mainly due to the positive effects that it has demonstrated on critical aspects of society, such as improvements in development and productivity [4]. Research shows that international scores on mathematics and science tests are strongly related to national development and economic growth because mathematics, science, and reading skills are essential for the labor force [5]. Academic difficulties may lead to long-term patterns of school dropout, academic failure, and problems achieving a successful career in adulthood [6]. Struggling in school can also lead to externalizing problems [7,8], especially during adolescence and high school years, which are understood to be a critical period with important implications for school achievement [9]. Given all the rapid societal transformations and the need to handle and adapt to the economic, technological, and cultural changes of societies and the competition in the job market [10], one can understand the importance of understanding the drivers of AA, as it is a topic that has considerable personal and social impacts. School dropout is one of the most common outcomes of school failure [11]. It is also an obstacle to economic growth and employment, as dropout harms productivity and competitiveness and fuels poverty and social exclusion. For these reasons, the Europe 2020 Strategy seeks to reduce dropout rates, increase the number of students who complete their compulsory education, and simultaneously increase the number of students who continue to university level [12]. This matter is still ongoing as it is a fundamental concern in the 2030 Strategy, according to which all young people should receive better education and training, regardless of their socio-economic background, thereby leading to more and better skills.
Therefore, research on this topic is critical to provide decision makers with quality information to increase school success [13]. The interconnectedness between researchers and practitioners also enriches the range of knowledge gained, improving theory building and allowing more practically applicable results [14]. Most of the research on AA has identified many factors that impact students’ performance, namely characteristics of the students [15,16], parents [17,18], teachers [19,20], and schools [21]—the four main agents related to the education process. However, most studies and reviews on this topic explore the contributions of each of these factors individually or in clusters of more related factors. Another conundrum is that the literature in AA reports conflicting findings. For example, some authors show that internet access is highly correlated with low academic achievement [22,23]. However, other studies have proved these conclusions are unclear, as children who use the internet more often attain higher scores [24,25]. In this line, a quantitative meta-analysis serves as a valuable tool for synthesizing the results of numerous studies on a particular topic [26]. We perform a quantitative synthesis of the findings in this research area with our weight analysis and meta-analysis by identifying determinants that have been intensely scrutinized in the literature, including the best predictors of success and shedding light on the contributions of each construct to AA. This meta-analysis will also promote a generalization analysis of each relationship tested with AA, thereby providing evidence regarding the conflicting results found in the academic literature [27].
We will perform a weight and meta-analysis of factors that impact AA, including high school students. Although it may seem reasonable to assume that several AA drivers may be shared across different school levels, each undoubtedly has its own and, more importantly, different impacts. High school was chosen because, even though this particular period of school life is a part of compulsory education in most developed countries, it is the one during which most students drop out [11]. The high school period is characterized by significant changes on a personal level, namely in identity and personal and social development [28], and research shows that, in adolescence, cognitive-affective variables become crucial in accounting for academic behavior, compared to earlier years [29]. High school also presents changes at a curricular level, as secondary education is more narrowed down to a student’s interests regarding preparation for tertiary education or pursuit of a professional career [30]. High school success is also linked to better results in university [31]. Thus, the importance of understanding AA is to enhance social and personal development.
This paper’s contributions are threefold. First, we contribute to a broader understanding of which of the determinants of AA have received more attention from researchers in this period of education. Second, we characterize the impact and relevance of those determinants on high school achievement. Finally, we identify the best AA determinants based on the weight analysis and meta-analysis results.
The following section describes the research methodology. Subsequently, we present this study’s results, including descriptive statistics, weight analysis, and meta-analysis. Finally, we discuss the findings and their implications for theory and practice, our conclusions, study limitations, and avenues for future research.

2. Method

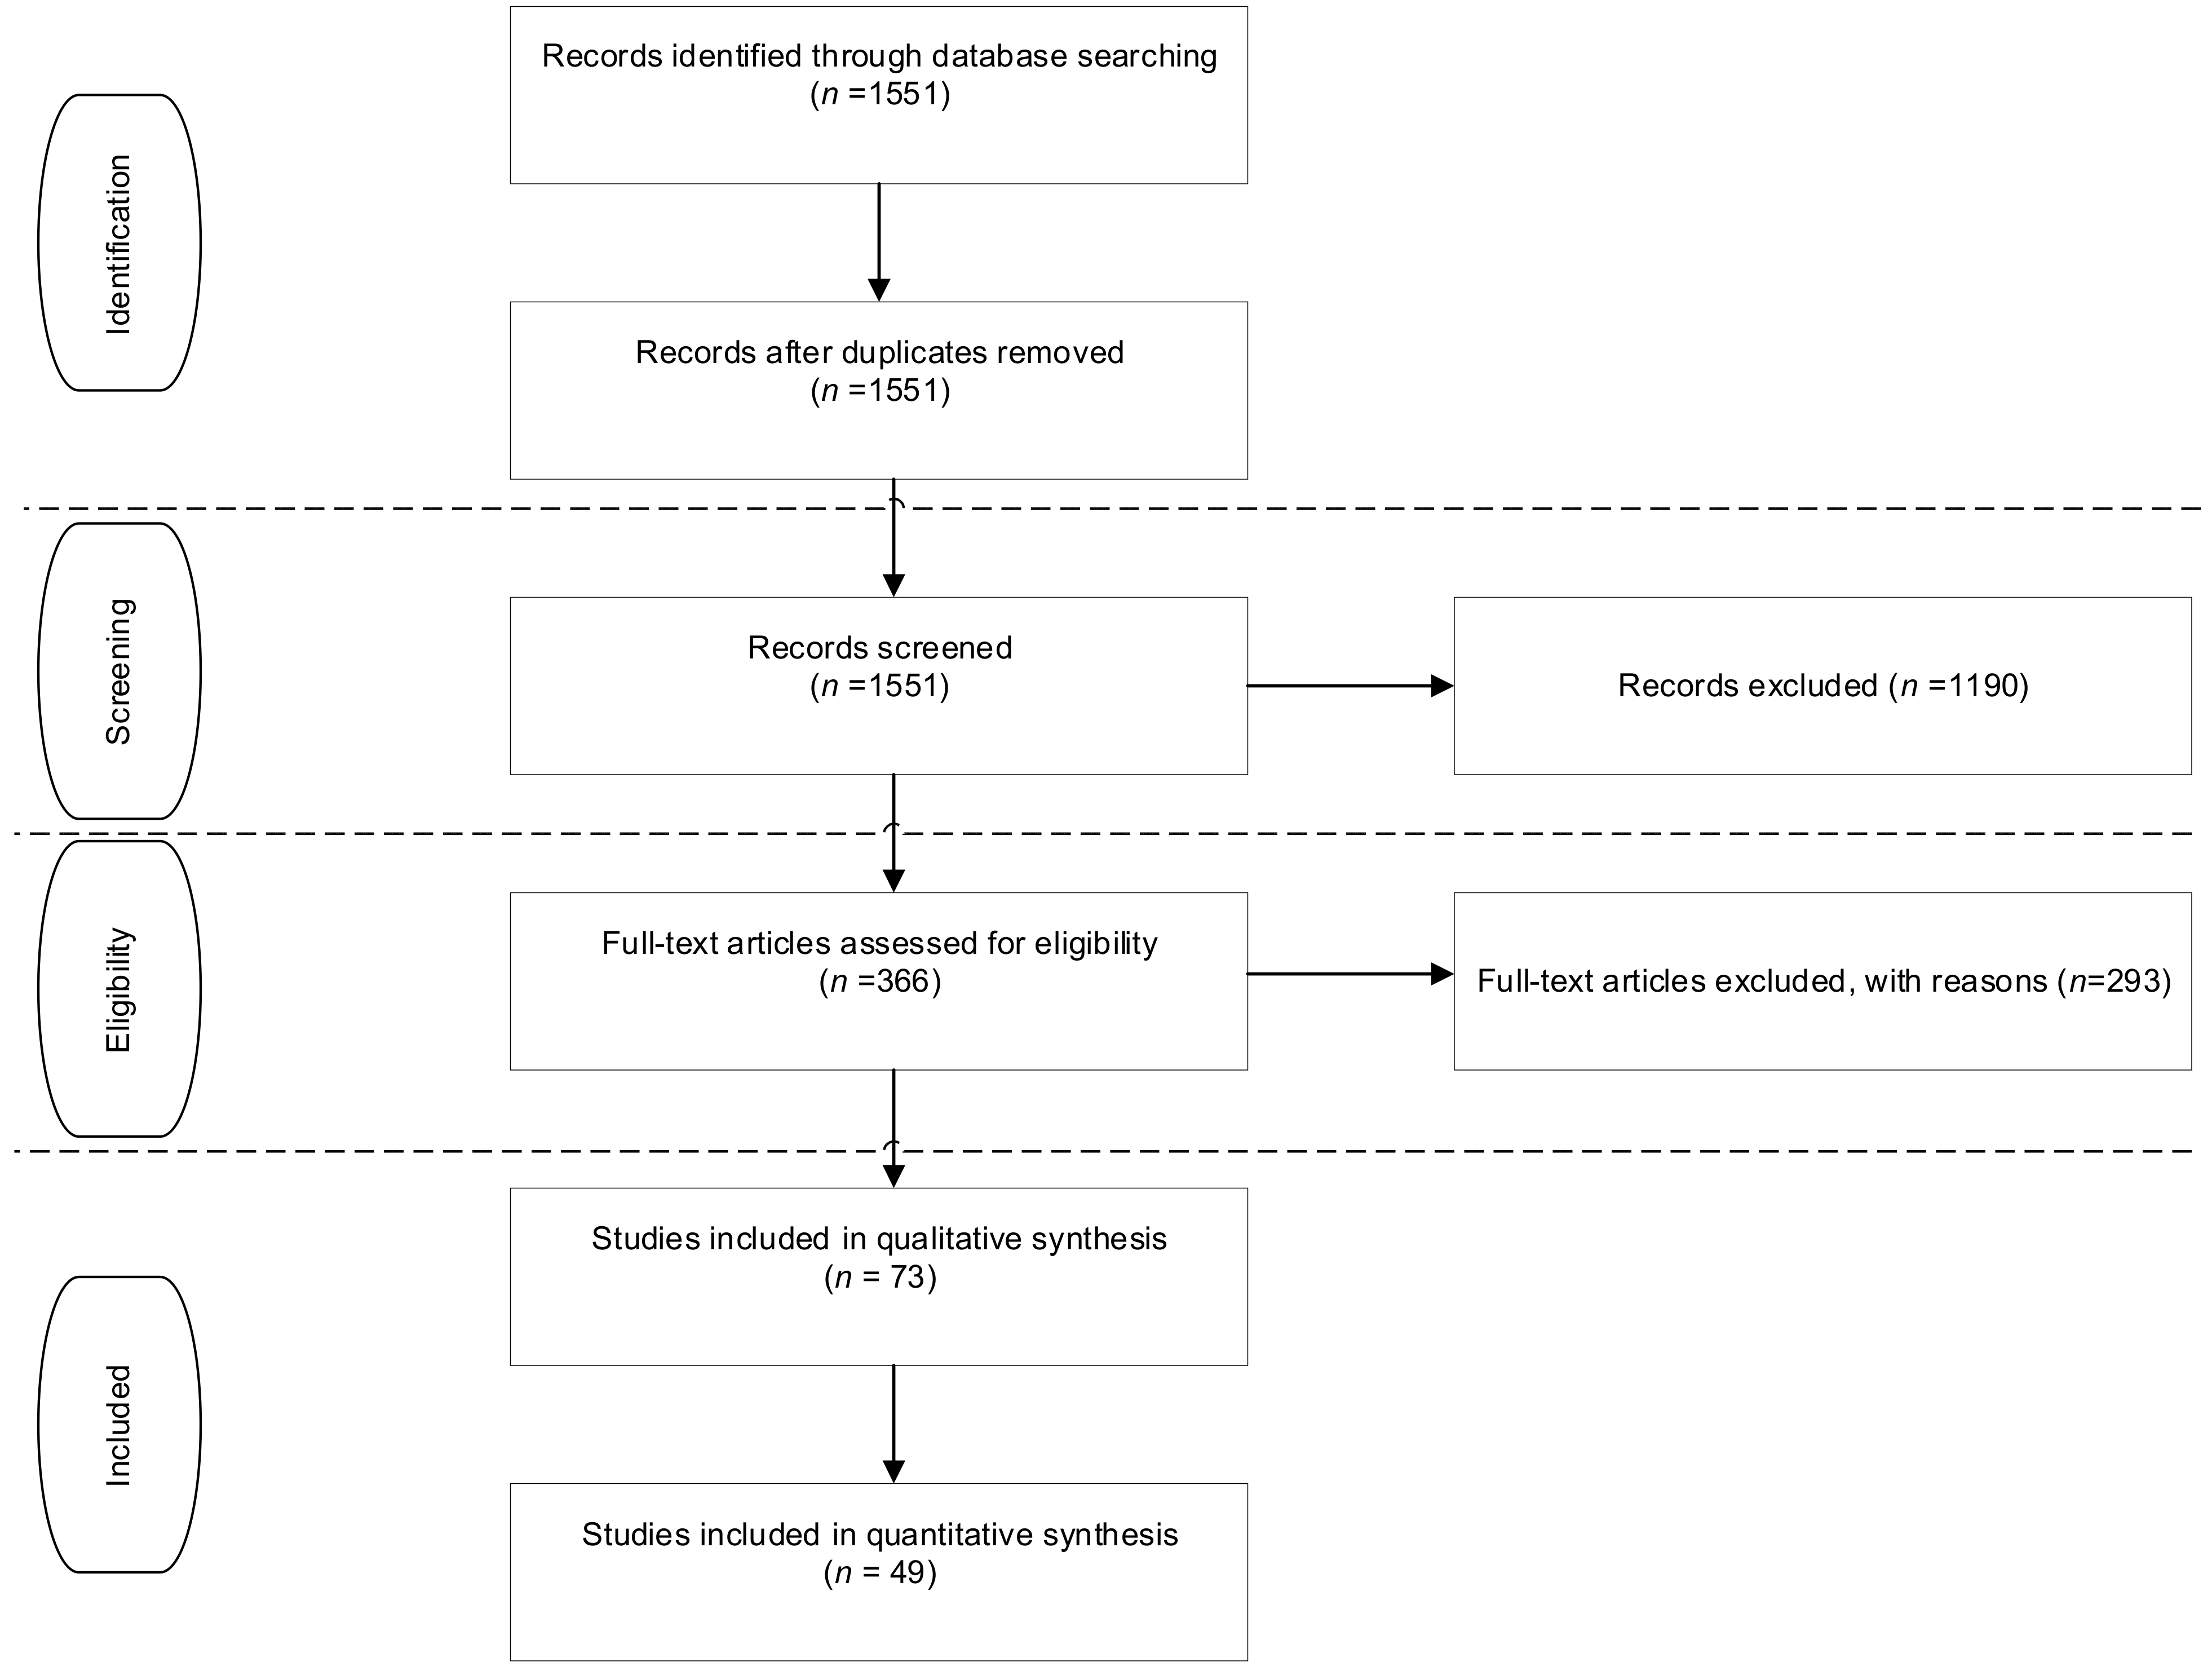
2.1. Criteria for Selection of Studies

The first step in a weight and meta-analysis investigation is to formulate the problem [32]. We are interested in determining which factors are most studied when trying to explain the academic performance of high school students. The second step concerns how to conduct a systematic review [32]. We follow the PRISMA protocol [33] to achieve this aim as applied in other researchers’ meta-analyses [34]. Following the PRISMA protocol, we selected studies that examined this topic as broadly as possible to identify the AA factors or variables. Accordingly, we searched an online scientific database (Web of Science core collection) through a query combining the following terms in the title or abstract (topic): “academic achievement”, “school dropout”, and “academic performance”, AND “drivers”, “model”, “research model”, “conceptual model”, “quantitative”, “regression”, and “correlation”, AND “PLS”, “SEM”, “OLS”, and “ordinary least squares”, AND “student”, “high school”, and “secondary”. The papers were published in English and peer reviewed. The systematic search included all papers published until the end of 2019. This query returned 1551 results, screened according to the following exclusion criteria: (a) school year (only secondary school years were included, and we excluded studies made in elementary/primary school, junior high, or university); (b) clinical population (e.g., students with dyslexia; studies that addressed drug or alcohol use); (c) studies in which the dependent variable was not AA, expressed by GPA or another quantitative score (e.g., test or exam score, previous term grade, previous year grade); (d) qualitative studies, scale development studies, or meta-analyses; and (e) training development program studies. This screening excluded 1190 papers by reading the title and abstract only, and 293 excluded after full text reading. Following the screening, 73 papers remained for inclusion in the meta-analysis (Figure 1).

2.2. Data Extraction

We applied the Rust and Cooil [35] suggestion to extract the data. Two research assistants performed these tasks. Before starting the data extraction process, the classification criteria were discussed among three researchers. As mentioned, two researchers performed the coding of all valid articles separately. At the end of these procedures, the results were compared, and the level of agreement was 80%. For the cases in disagreement, the third researcher analyzed the differences. The procedure used for the data extraction followed that of earlier meta-analysis research [36]. The following items were extracted from each article: year of publication, type of relationship found with AA (e.g., independent–dependent variable), name of relational constructs, coefficient of relationships between constructs, significance (yes or no), quantitative method, sample size, school year, school subject (when available), and nationality of the sample. We identified 363 relationships between explanatory variables and AA. Figure 1 illustrates each step applied to identify the valid studies used in this meta-analysis.

2.3. Merging of Variables

The extracted data analysis revealed that, in some cases, different authors gave different names to variables that measure the same construct, and therefore have the same meaning. Hence, after a detailed theoretical review, we merged variables found in the studies that were synonyms (e.g., gender and sex), described with different phrasing (e.g., performance-approach and performance-approach goals, absence, and absenteeism), or related to the same construct (e.g., cognitive confidence and academic self-efficacy). After merging variables, we identified twenty relationships between variables studied at least three times or more in our sample’s papers [37]. Nineteen of those relationships revealed the dependent variable was AA; the other relationship between variables present at least three times was between academic self-efficacy and performance goals. From the initial pool of 73 papers, 24 studied only variables that did not coincide with the others, i.e., were not used at least three times in explaining AA. We therefore excluded those 24 papers from the analysis. The final sample included in the weight analysis and meta-analysis comprises 49 papers (Appendix A).

2.4. Analysis Procedures

2.4.1. Weight Analysis

Weight is an indicator of the predictive power of independent variables [38]. The weight for a variable was calculated by dividing the number of times an independent variable was reported to be significant by the number of times the independent variable was examined. This study analyzes the constructs’ relationship strength, i.e., the influence of an independent variable over a dependent variable (AA). A weight of 1 indicates that the relationship was significant in all papers, and a weight equal to 0 indicates that the relationship was nonsignificant in all studies.

2.4.2. Meta-Analysis

We follow the traditional analysis techniques used in meta-analytical studies [39], whereby the direct analysis was performed considering Pearson’s correlation coefficient (r). When studies did not report the correlation effects (e.g., Beta; t-test; F-ratio; and χ2), we used Hunter and Schmidt’s (2015) conversion procedure suggestions. The effect sizes were corrected by scales reliability and sample size [37]. As suggested by those authors, we applied the random-effects model of the effect size and considered the confidence interval index at the 95% level.
Our analysis also presented heterogeneity among the studies by the Q and I2 tests. Cochran’s Q calculates the weighted sum of squared differences between the individual effects of the study and the combined effect of the studies [40]. The I2 statistic is obtained through the Q statistic. I2 of 25% or lower presents low heterogeneity; the I2 index of 26–50% shows moderate heterogeneity, and studies with an I2 greater than 75% have high heterogeneity [41].
We also investigated possible moderators on the significant relationships with more than ten effects [37]. This analysis was conducted via a meta-regression test in which we used raw effect sizes from primary studies as a dependent variable in weighted regression analysis. The coded moderators were used as independent variables [42]. All analyses were performed employing the metafor R package [43].

3. Results

3.1. Descriptive Statistics

In the 49 selected papers published between 1992 and 2019, we identified 120 relationships (independent–dependent variables) included in the meta and weight analyses. The Table A1 in the Appendix A synthesizes the list of papers selected for our study, indicating the school years and subjects each study refers to (when this information is available), the sample size, country, and the statistical analysis used. The total sample is 610,522 students from 25 different countries in Europe (10), Asia (9), North America (2), Africa (2), and Australia (1). South Korea is the country with the largest sample size (487,077), and the United Kingdom (UK) has the smallest (120). Although many studies choose to assess AA considering global performance in a given year (e.g., GPA), Math, Sciences, and English (either as a native or foreign language) are the main subjects considered. Few of the articles found were published before 2012; nonetheless, from that year on, we observed a more regular number of publications per year, showing an increasing interest in this topic.

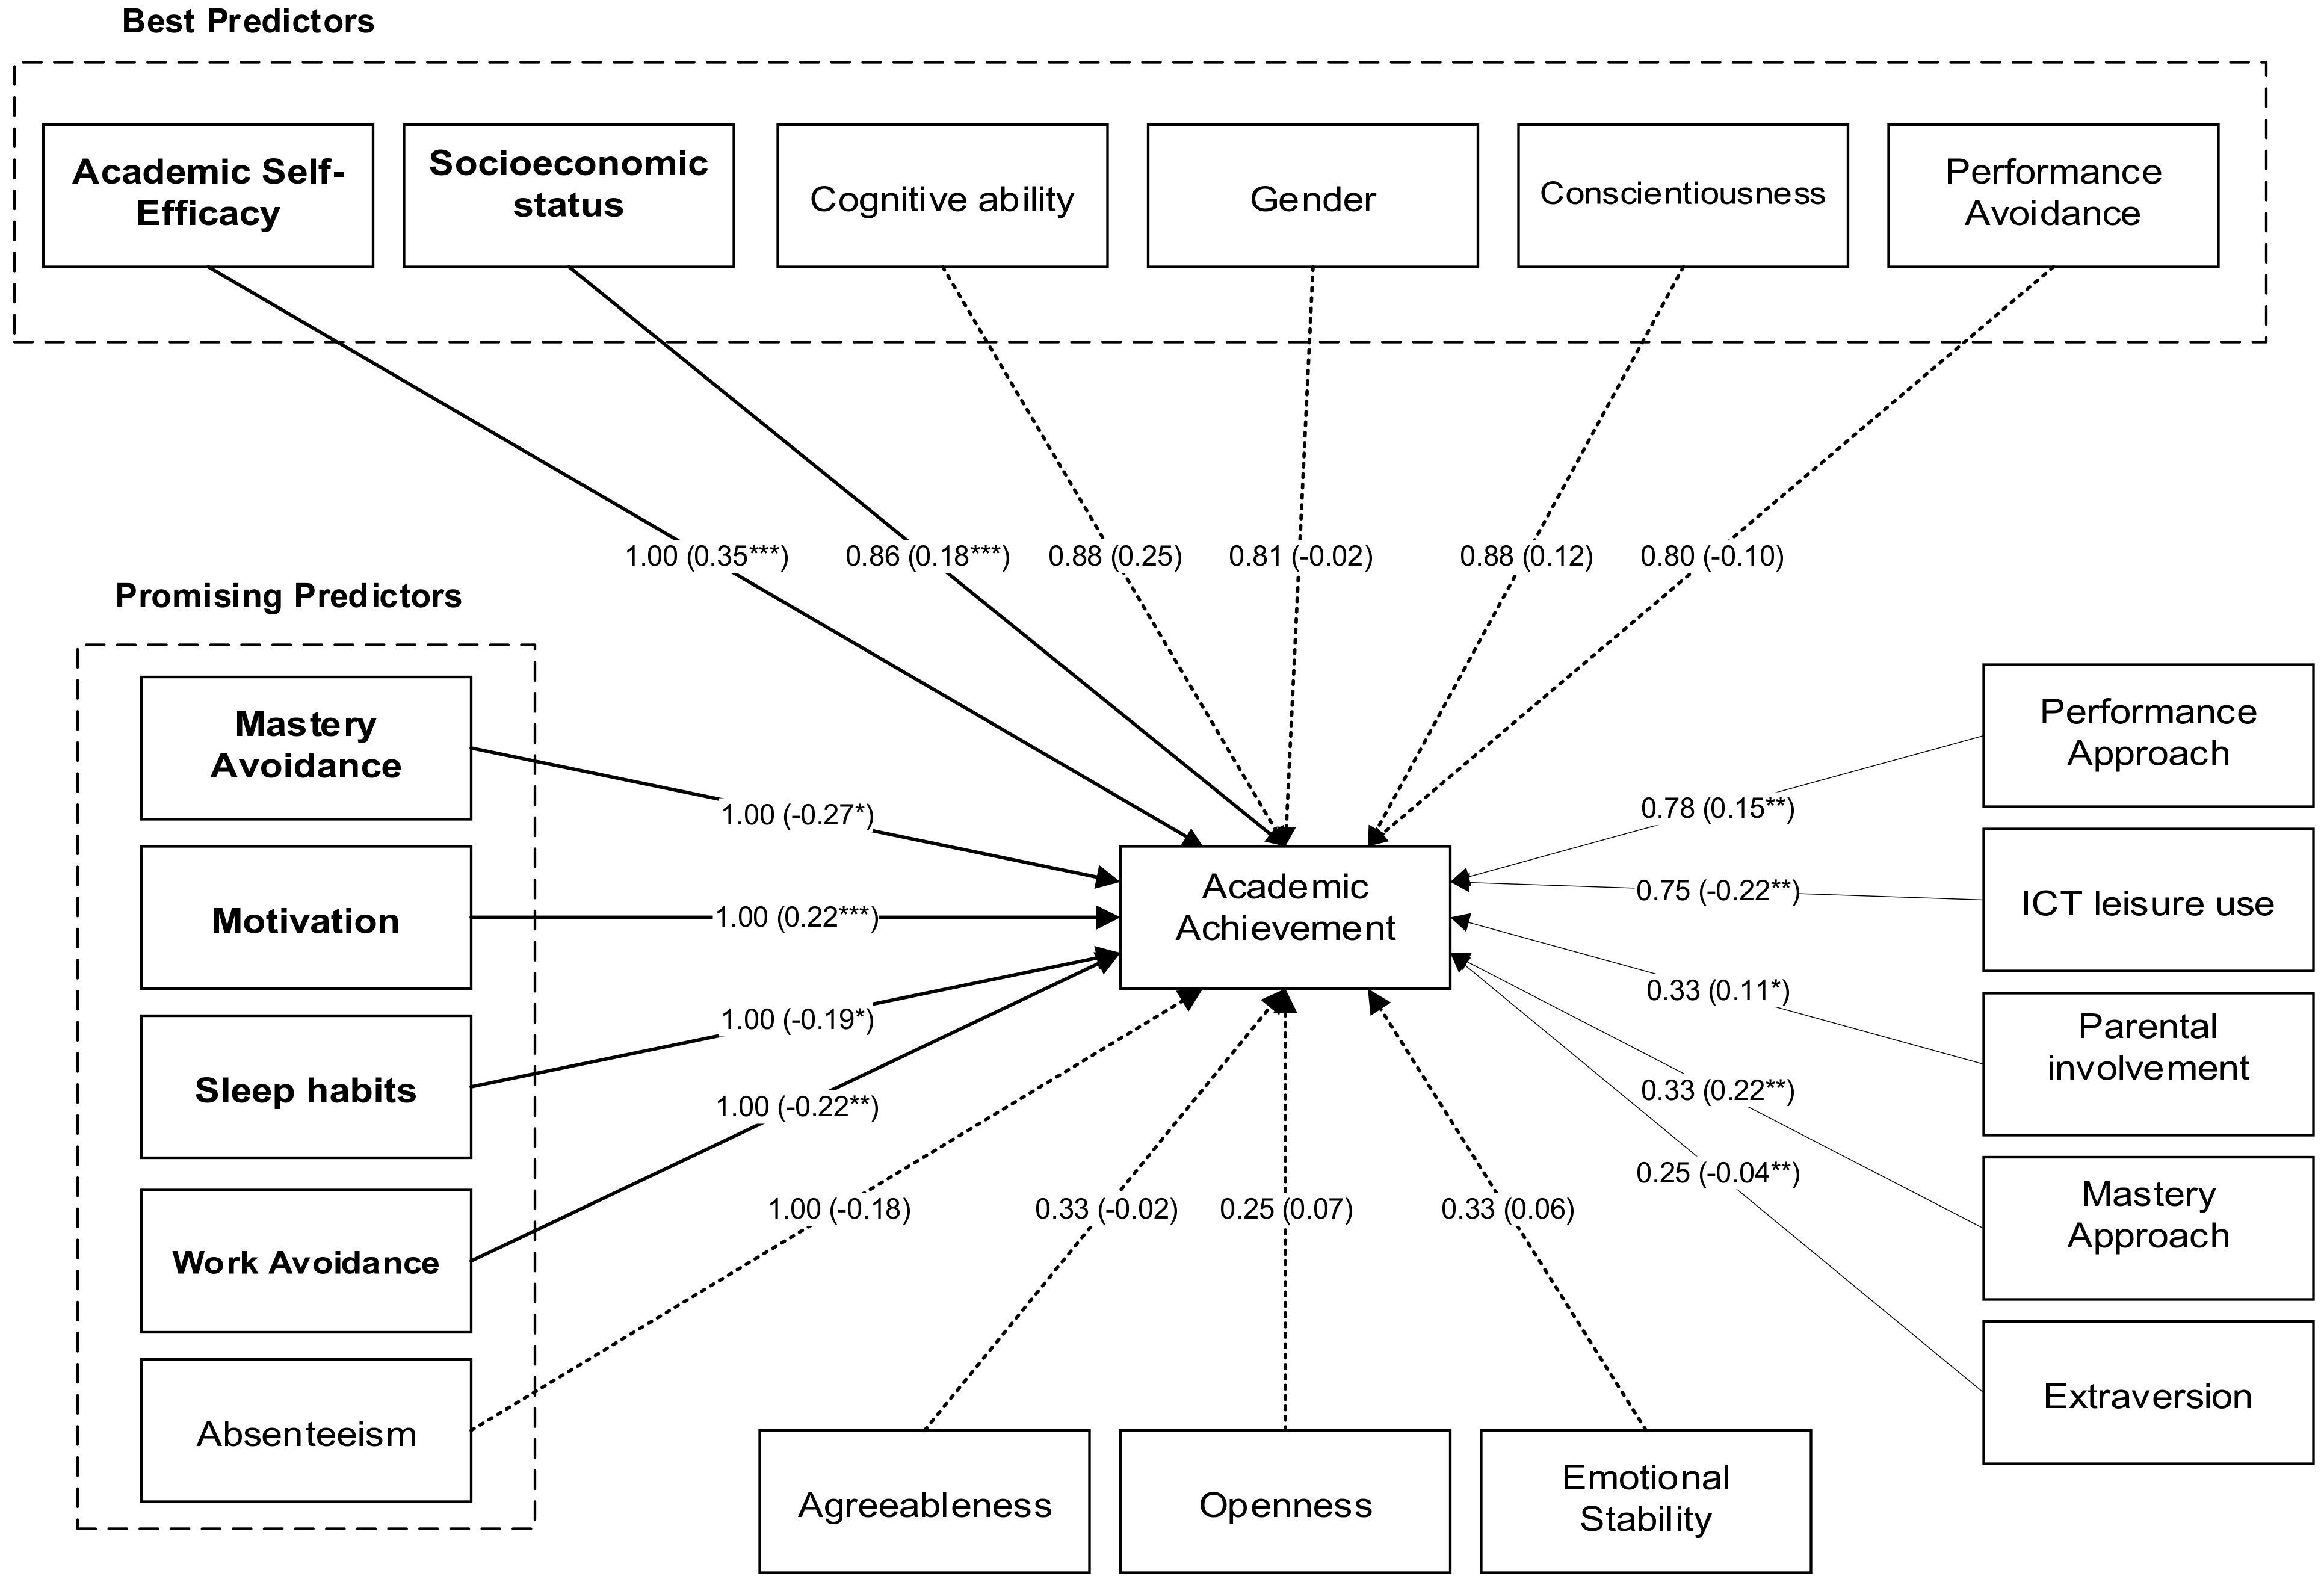
3.2. Weight Analysis

Table 1 presents the results of the weight analysis ordered by the independent variables’ frequency of use. According to the weight analysis, the variables that can be considered to be the leading determinants of AA (as their weight is equal to or greater than 0.8 and are examined at least five times) are academic self-efficacy (1), conscientiousness (0.88), cognitive ability (0.88), socioeconomic status (SES) (0.86), gender (0.81), and performance-avoidance (0.80). Some variables are significant in all studies and therefore have a weight of 1, but because they are present fewer than five times are considered “promising determinants.” These include sleep habits, motivation (both present four times), absenteeism, work avoidance, and mastery avoidance (present three times).

3.3. Meta-Analysis Correlations Effects

We first present the results of direct relationships (Table 2). This table presents: (a) the effect sizes (r) adjusted by sample size and reliability of measurement; (b) the correlations transformed by Fischer’s Z-distribution; (c) the upper and lower confidence interval index (95% level), which comprises an estimate of the mean range of corrected weighted correlations [37], and (d) the heterogeneity test of the effects by Cochran’s Q test and I2.
We evaluated 19 constructs related to AA. Eleven of these presented significant effects. Academic self-efficacy had the strongest positive effect-size (r = 0.347; p < 0.001). This analysis was obtained from 12 studies and a sample of 27,705 students. Extraversion was negatively related with achievement (r = −0.044; p < 0.01). In this case, we also observed that the effects produced by four primary studies that analyzed the relationship produced consistent findings as the heterogeneity index was not significant (Q = 3.31; p > 0.05; I2 = 4.2%). Along the same line, we also found a negative and significant effect on the relationship between ICT leisure use and AA (r = −0.216; p < 0.05).
Other significant effects were related to mastery assumptions. While the relationship between mastery approach and AA was positive (r = 0.221; p < 0.05), the effect of mastery avoidance on AA was negative (r = −0.217; p < 0.05). Both were obtained from three effect-sizes. We also noted positive and significant effects of student motivation and AA (r = 0.220; p < 0.01). These results are derived from a sample of 21,054 students distributed among four studies. Parental involvement also presented positive and significant effects on student achievement (r = 0.113; p < 0.05). Regarding the other four significant relationships, we found that performance approach and SES socio-economic status showed positive effects on AA (r = 0.147 and r = 0.183; respectively), while sleep habits and work avoidance produced negative effects (r = −0.192 and r = −0.219; respectively).
Finally, the results also showed that eight of the tested relationships, namely absenteeism, agreeableness, cognitive ability, conscientiousness, emotional stability, gender, openness, and performance-avoidance, do not yield a significant effect on the students’ AA. One can argue that, although these features appear in some research as AA antecedents, they can work as such in specific contexts.

3.4. Moderation Effects

We also investigated possible moderators that could explain some heterogeneity in the direct relationships found [44]. The analysis was on the relationships between (1) academic self-efficacy and AA and (2) SES and AA. Both relationships were significant and produced more than ten effect sizes. Lower numbers would be insufficient to analyze effect size changes through moderators [37].
In the same vein, we analyzed the possible moderation of (1) the scores of the 2018 Program for International Student Assessment (PISA), an international assessment that measures 15-year-old students’ reading, math, and science literacy every three years, (2) the Human Development Index (HDI), a statistic composite index of life expectancy, education, and per capita income indicators, and (3) Education Index (EI), a component of the HDI, measured by combining average adult years of schooling with expected years of schooling for children in each country. The PISA index was obtained by the National Center for Education Statistics (2018), the EI from the United Nations Human Development Report (2016), and the HDI from the United Nations Human Development Report (2019). Each of the moderators’ classifications was based on the country of origin of the data collections applied in each investigation. The raw PISA index scores are scaled to allow meaningful comparisons: the OECD average in each domain (mathematics, reading, and science) is 500, and the standard deviation is 100; the EI and HDI scores vary from 0.001 to 0.999. Table 3 presents the moderation analysis results.
As seen in Table 3, none of the moderators obtained significant effects. This observation may indicate that the impact of the academic self-efficacy and SES variables included in this meta-analysis’ studies is relatively stable across countries, regardless of being developed or developing, as none of the possible moderator variables explored explain variance in our results.

3.5. Major Findings

Figure 2 presents the combined results of the weight and meta-analysis. Values represent the weights obtained by weight analysis, and the weighted average effect values obtained in the meta-analysis are in parentheses. Best and promising predictors as determined from the weight analysis are represented: best predictors have a weight of at least 0.80 and are present in the analysis five times or more. Promising predictors have a weight of 1 but are examined fewer than five times. The results show that the best predictors of AA are academic self-efficacy, socioeconomic status, cognitive ability, gender, conscientiousness, and performance-avoidance. Of these best predictors, those statistically significant in the meta-analysis are academic self-efficacy and socioeconomic status. The statistically significant promising predictors are motivation, sleep habits, mastery avoidance, and work avoidance. Absenteeism is also a promising determinant (weight of 1, but only present four times in the analysis). However, it proved not significant in the meta-analysis. The determinants found to be least important are agreeableness, openness, and emotional stability, as they were all nonsignificant and had low weight values.

4. Discussion

This paper’s results show that AA is a widely studied topic that interests researchers from different areas and is a topic that has become increasingly prominent in the literature, with a growing number of published papers in the last decade. Paradoxically, there are a plethora of studies with apparently contradictory findings and a paucity of studies summarizing the literature with the goal of shedding light on such a pertinent topic as is AA. Our goal is to contribute to this synthesis of the drivers that are the best and most significant predictors of AA.
From the weight analysis, the following variables emerged as the best predictors of students’ success in high school (independent variables that were examined five or more times and with a weight of at least 0.80): academic self-efficacy, socioeconomic status, conscientiousness, cognitive ability, gender, and performance-avoidance. All of these variables, except for performance avoidance, positively impact AA, but only academic self-efficacy and socioeconomic status are statistically significant in the meta-analysis. Academic self-efficacy refers to an individual’s belief that they can successfully achieve a specific academic goal at a designated level in an academic task [45]. In this analysis, socioeconomic status (SES) measures derive from self-reported or self-perceived values and school record information. Students’ SES background depends upon family income, level of education, and occupation status and, not surprisingly, is a significant determinant of AA, as social and economic conditions may influence youngsters’ functioning and development [46]. Conscientiousness is a personality trait present in the Big Five Model related to self-control, the ability to plan, and being efficient and organized [47]. As operationalized in the papers in this meta-analysis, cognitive ability is a quantitative measure of the general intelligence (g factor), i.e., the ability for reasoning, problem-solving, complex idea comprehension, and learning from experience [48]. Cognitive ability is one of the most studied predictors of AA, and research has consistently demonstrated it to be a significant predictor of success in school [49] and adult life [50]. Concerning gender, our results are consistent with the literature: females tend to perform better than males. However, some authors have shown that males outperform females in specific mathematics abilities [51], so this analysis could help clarify gender impact on AA. The only determinant identified in the weight analysis as one of the best predictors of AA that has a negative impact is performance-avoidance, i.e., the desire to avoid performing more poorly than others do [52]. Performance-avoidance is consistently linked to several adverse outcomes, such as anxiety and decreased performance [53], thus explaining its negative impact on AA.
Other relationships between variables evaluated five times or more in this study were found to be significant in the meta-analysis but obtained a weight slightly below 0.80. This is the case for performance approach (weight = 0.78), for which further research could help assess the actual impact on AA. The AA determinants with the lowest weight value (0.25) are extraversion and openness, personality traits that are part of the Big Five Personality Model [54], suggesting they are probably not among the most relevant for AA research.
Our weight analysis and meta-analysis results allow us to draw a model of the predictors of high school achievement across countries. The best of these predictors are academic self-efficacy and social-economic status. The model also identifies other seemingly important antecedents of AA (carrying weights of 1 but present fewer than five times in this analysis), viz. motivation, sleep habits, work avoidance, and mastery avoidance. These last three antecedents have a significant negative impact on AA and should continue to be considered in future research in order to clarify their importance in student achievement. Although not statistically significant in the meta-analysis, absenteeism is also a promising predictor of AA. These results highlight the importance of students’ habits outside school, and further conclusions can help parents, teachers, and other educational agents promote better conditions to enhance AA.
We analyzed the possible effect of moderators in two relationships found in this meta-analysis: academic self-efficacy and AA, and SES and AA. The data samples used in this study belong to countries with different social and economic development classifications, such as Norway, the USA, the Dominican Republic, and Iran. No significant results were found for the moderators (PISA index score, Human Development Index, and Education Index score of each country), which seems to indicate that both of the previously mentioned determinants (academic self-efficacy and SES) influence AA in a manner that is independent of the students’ country of origin.
Survey-driven measures, such as those in most studies presented in this work, have been widely used in AA research. Recent research [55] has suggested that data-driven research using machine learning techniques could complement the more traditional research approach and produce more accurate results, capitalizing on the massive amount of information available to educational institutions [56]. For example, Cruz-Jesus et al. [57] employed artificial intelligence techniques to assess AA drivers in high school, using a database from all public high schools in Portugal. The database included demographic information, financial information of students’ families, and information about the school and the area in which the school is located. These authors found that students’ previous academic record (namely if the student had failed previously) and gender (females outperforming males) impact AA the most, whereas, and contrary to what previous research had suggested [58], class size does not significantly affect students’ achievement. Apart from gender, none of the other variables identified by these authors emerged in our analysis, suggesting that using AI methods could bring new valuable insights to this area of research.

4.1. Theoretical Implications

This paper contributes to theory by assessing the main drivers of AA through an analysis of relevant literature. To the best of our knowledge, no research addresses meta-analysis combined with weight analysis in the context of AA. Using these analytical methods, we contribute to research by identifying the most used determinants, their significance, impact, and the best predictors of AA, thus allowing us to synthesize knowledge from a vast area of research.
According to our results, one of the most critical drivers of AA is academic self-efficacy, a variable that impacts AA positively. Students who have a high level of academic self-efficacy tend to have a greater level of class participation and exert prodigious effort in studying, which will increase their final score [59]. Research also indicates that academic self-efficacy moderates the relationship between future orientation (i.e., students’ expectations about the outcomes of their academic path) and AA [60]. Our study also allowed us to assess the impact of all four dimensions of the achievement goals framework [61] on high school students’ AA. According to this framework, individuals who have a strong mastery orientation feel competent at a task when they have mastered the task itself or when they have improved relative to their past performance. In contrast, individuals who have a strong performance orientation feel competent at a task when they have performed well on the task relative to others.
Previous research findings are not consistent considering the impact of the performance-approach (i.e., the desire to outperform others) showing that, although it is a driver of success, it is also related to adverse outcomes, namely due to increased performance anxiety levels [61]. However, our results highlight a significant positive impact of performance-approach on AA, suggesting that the motivation to perform better than peers can be more beneficial than detrimental at the secondary education level. Our results also reveal a positive impact of the mastery approach on AA, consistent with earlier empirical research reporting that this driver is linked to several positive achievement outcomes through increased self-efficacy, adaptive learning strategies, and feedback-seeking behaviors [62]. Performance-avoidance and mastery avoidance are both determinants with a negative impact on AA. The impact is significant for mastery avoidance, suggesting that when preventing failure, it is the self-evaluation of past performance rather than comparing with other students that matter the most. However, based on earlier research, we would have expected a stronger relationship between performance-avoidance and AA [53].
Some predictors in this study did not significantly impact AA; namely, conscientiousness is a contrasting result compared with recent findings [63]. This aspect indicates that conscientiousness is a crucial non-cognitive predictor for school achievement compared to other predictors such as self-efficacy, grit, and anxiety. It should be focused on when supporting students and improving their performance. Our results, however, highlight context-specific determinants such as academic self-efficacy as more relevant and worthy of such focus.

4.2. Practical Implications

Academic success has significant personal and societal outcomes. This study’s findings raise implications that could be of widespread interest to policymakers, schools, and teachers. Specifically, understanding which among the variables studied herein are the best predictors of AA yields valuable information highlighting new policies or interventions that could be directed to enhance academic results.
Considering academic self-efficacy is one of the most critical determinants of AA, school management bodies and teachers could implement academic self-efficacy enhancing interventions such as teaching study methods and test-taking skills to reduce performance anxiety [64], thus increasing students’ belief that they will succeed academically. These interventions would convey benefits for students with low academic self-efficacy, who are usually less motivated to thrive [65]. Our results also suggest other ways of improving AA, such as interventions designed to minimize the negative impact of mastery avoidance and work avoidance—specifically discussing with students the influence of previous academic failure on their performance and helping them to set personalized and attainable achievement goals. Combined with school environment interventions, such as those discussed, others involving families and schools seem to convey good results: parental involvement is a strong predictor of student AA [66]. Our results demonstrate a positive relationship between parents’ involvement in school life and AA. Previous research has highlighted that the combination of solid school–family relationships and high levels of parental satisfaction with a school leads to better results [67]. Therefore, facilitating ways to engage parents in their children’s academic path and enhance communication with schools are seemingly beneficial to increasing performance. Parental involvement can be contingent on the family’s SES, as not all families have the same availability or social capital to participate in students’ school life. Although SES is a relatively stable condition and difficult to change, research suggests that social inequalities can be attenuated by interventions based on the sociocultural-self model. Targeting individual attributes can help underprivileged students form and sustain a positive self-concept, increasing AA [68]. Research also shows that hope is a significant mediator between SES and AA [69], meaning that SES gaps can be overcome if students’ hope increases.
Our results show that ICT leisure use impairs AA. Thus, policy changes in schools to minimize the impact of this variable, such as the restraint of mobile phone use in the classroom or monitoring students’ time spent on the internet (on social media, gaming, etc.), could increase AA. The concern with ICT leisure use should also be considered outside school. The Internet and technology use play a tremendous part in everyday human life activities and are also considered an asset for learning. Nevertheless, their excessive use has been linked to addiction behaviors [70,71]. Research has shown that parental monitoring of students’ internet usage should be done carefully, as mere dissuasion may not be an effective strategy. Some authors suggest alternative means such as rationalization. Communication should be preferential [72].
Although a common characteristic in adolescence, poor sleep habits also diminish AA and are antecedents of other problems such as smoking, alcohol usage, and high anxiety and depression scores. Seemingly, high school students would benefit from more guidance from parents, school authorities, and health professionals regarding sleep and sleep habits [73].

4.3. Limitations and Future Studies

As stated above, AA is a vast topic that interests researchers from different areas of knowledge. We present an analysis based on a few papers, which are only a tiny portion of the existing literature on this topic. The fact that we only selected papers written in English can also mean we omitted relevant literature in other languages and, for the type of analysis conducted, we also left out qualitative studies.

5. Conclusions

This paper performs a meta-analysis and weight analysis on the determinants of AA in high school of 49 papers published across 27 years (1992–2019). We identify some of the best and most promising predictors of high school AA and their significance, thus contributing to an integrated and synthesized view of an extensive research topic such as AA. The results show that academic self-efficacy and socioeconomic status are the variables with the most significant impact on AA. At the same time, motivation, sleep habits, absenteeism, work avoidance, and mastery avoidance are promising determinants that should be further explored in research. We critically discuss these results, framing them in the findings reported in the existing literature, and propose a model of the synthesized determinants of AA that could be of use for researchers by providing information about the primary constructs to be included in AA research models. Our research also enables parents, teachers, and other stakeholders to support policies and interventions aimed at helping students achieve better schooling results.

Author Contributions

Conceptualization, T.O., F.C.-J. and M.C.; methodology, C.N., F.d.O.S. and T.O.; software, C.N. and F.d.O.S.; validation, F.d.O.S., C.N. and T.O.; formal analysis, C.N. and T.O.; investigation, C.N.; resources, C.N.; data curation, F.d.O.S.; writing—original draft preparation, C.N.; writing—review and editing, C.N., F.d.O.S., T.O., F.C.-J. and M.C.; visualization, C.N.; supervision, T.O.; project administration, T.O., F.C.-J. and M.C.; funding acquisition, T.O. All authors have read and agreed to the published version of the manuscript.

Funding

This work was supported by national funds through FCT (Fundação para a Ciência e a Tecnologia) under project DSAIPA/DS/0032/2018 (DS4AA).

Institutional Review Board Statement

Not applicable.

Informed Consent Statement

Not applicable.

Data Availability Statement

Not applicable.

Conflicts of Interest

The authors declare no conflict of interest.

Appendix A

Table A1. List of useful datasets, indicating school grade and school subject (when indicated), number of subjects, country, and analysis method.
StudiesSchool SubjectSample SizeCountryMethod
Abdi et al. [74]GPA127IranRegression analysis
Ahinful et al. [75]Accounting500GhanaRegression analysis
Anderson and Keith [76]ND8100USAStructural equation modeling (SEM)
Arslan [77]GPA553TurkeySEM
Carolan [78]Math10,350USARegression analysis
Cho and Coulton [79]English, Math1100South KoreaOrdinary least squares regression
Crook et al. [80]Biology340AustraliaMultiple regression
Crouzevialle and Butera [81]Physics, Chemistry173FranceLinear regression analysis
Di Fabio and Busoni [82]GPA286ItalyHierarchical regression
Di Giunta et al. [83]GPA426ItalySEM
Dickhäuser et al. [84] Math288GermanySEM
Dinger et al. [85]GPA524GermanySEM
Ergene [86]GPA510TurkeyMultiple regression analyses
Gibson et al. [87]ND3235CanadaGeneralized estimated equations
Gilar-Corbi et al. [88]GPA1396SpainRegression analysis
Howard et al. [89]Math13,694USARegression analysis
Inal et al. [90]GPA804TurkeyCorrelation
Ishak et al. [91]GPA493MalaysiaSEM
Keith and Benson [92]GPA12,142USASEM
Kim and Hong [93]Korean, English, Math485,977South KoreaMultivariate multilevel modeling (HLM)
King and Ganotice [94]Math, Science, English1026PhilippinesSEM
Köller et al. [95]GPA3775GermanyMultiple regression analysis
Kozina et al. [96]Math2802SloveniaMultiple regression analyses
Levi et al. [97]EFL, Math, History289IsraelSEM
Liem et al. [98]Math, English356IndonesiaSEM
Luo et al. [99]Math1196SingaporeSEM
McIlroy et al. [100]English, Math, Science120UKHLM
Meyer et al. [101]GPA (Math, EFL)3637GermanyMultiple regression analysis
Miñano et al. [102]Math341SpainSEM
Novak et al. [103]GPA1854LithuaniaMultivariate regression analysis
Oljača et al. [104]GPA584SerbiaLinear regression analysis
Osborne [105]ND21,830USAMultiple regression analysis
Peklaj et al. [106]Math386SloveniaSEM
Pina-Neves et al. [107]Portuguese, Math2179PortugalSEM
Rahafar et al. [108]GPA158IranSEM
Robinson et al. [109]GPA972USARegression models
Sæle et al. [110]GPA1315NorwayMultivariable regression analyses
Sahin et al. [111]GPA104TurkeySEM
Sampasa-Kanyinga et al. [112]ND6093CanadaMultiple linear regression
Sánchez et al. [113]GPA143USARegression models
Sivertsen et al. [114]GPA8347NorwayRegression models
Sorić et al. [115]Chemistry501CroatiaMultiple regression analysis
Titus et al. [116]Economics640NigeriaSEM
Tomás et al. [117]ND614Dominican RepublicSEM
Tonetti et al. [118]GPA36ItalyMultiple regression analysis
Wang et al. [119]GPA148ChinaRegression analysis
Wernette and Emory [120]GPA217USACorrelation
Zhang et al. [121]Math10,495ChinaSEM
Zhou and Zhou [122]EFL 187ChinaHierarchical regression analyses
Note: ND = not disclosed in the article; EFL = English as a foreign language; and GPA = grade point average.

References

  1. Koch, A.; Nafziger, J.; Nielsen, H.S. Behavioral Economics of Education. J. Econ. Behav. Organ. 2015, 115, 3–17. [Google Scholar] [CrossRef] [Green Version]
  2. Rivkin, S.G.; Hanushek, E.A.; Kain, J.F. Teachers, Schools, and Academic Achievement. Econometrica 2005, 73, 417–458. [Google Scholar] [CrossRef]
  3. Chowa, G.A.N.; Masa, R.D.; Ramos, Y.; Ansong, D. How Do Student and School Characteristics Influence Youth Academic Achievement in Ghana? A Hierarchical Linear Modeling of Ghana YouthSave Baseline Data. Int. J. Educ. Dev. 2015, 45, 129–140. [Google Scholar] [CrossRef]
  4. Spinath, B. Academic Achievement. In Encyclopedia of Human Behavior, 2nd ed.; Elsevier: Amsterdam, The Netherlands, 2012. [Google Scholar] [CrossRef]
  5. Wößmann, L.; Hanushek, E. The Role of Education Quality in Economic Growth. The Role of School Improvement in Economic Development. World Bank Policy Res. Work. Pap. 2007, 4122, 1–94. [Google Scholar] [CrossRef]
  6. Alexander, K.L.; Entwisle, D.R.; Kabbani, N.S. The Dropout Process in Life Course Perspective: Early Risk Factors at Home and School. Teach. Coll. Rec. 2001, 103, 760–822. [Google Scholar] [CrossRef]
  7. Ansary, N.S.; Luthar, S.S. Distress and Academic Achievement among Adolescents of Affluence: A Study of Externalizing and Internalizing Problem Behaviors and School Performance. Dev. Psychopathol. 2009, 21, 319–341. [Google Scholar] [CrossRef] [PubMed] [Green Version]
  8. Bishop, S.A.; Okagbue, H.I.; Odukoya, J.A. Statistical Analysis of Childhood and Early Adolescent Externalizing Behaviors in a Middle Low Income Country. Heliyon 2020, 6, e03377. [Google Scholar] [CrossRef]
  9. Leeson, P.; Ciarrochi, J.; Heaven, P.C.L. Cognitive Ability, Personality, and Academic Performance in Adolescence. Pers. Individ. Dif. 2008, 45, 630–635. [Google Scholar] [CrossRef]
  10. OECD. OECD Employment Outlook 2019—The Future of Work. In The Future of Work; OECD: Paris, France, 2019. [Google Scholar] [CrossRef]
  11. Janosz, M.; Le Blanc, M.; Boulerice, B.; Tremblay, R.E. Predicting Different Types of School Dropouts: A Typological Approach with Two Longitudinal Samples. J. Educ. Psychol. 2000, 92, 171. [Google Scholar] [CrossRef]
  12. European Commission/EACEA/Eurydice. Structural Indicators on Early Leaving from Education and Training in Europe—2016; European Commission: Brussels, Belgium, 2016; pp. 5–25. [Google Scholar]
  13. Crain-Dorough, M.; Elder, A.C. Absorptive Capacity as a Means of Understanding and Addressing the Disconnects between Research and Practice. Rev. Res. Educ. 2021, 45, 67–100. [Google Scholar] [CrossRef]
  14. Ming, N.C.; Goldenberg, L.B. Research Worth Using: (Re)Framing Research Evidence Quality for Educational Policymaking and Practice. Rev. Res. Educ. 2021, 45, 129–169. [Google Scholar] [CrossRef]
  15. Watts, T.W.; Duncan, G.J.; Siegler, R.S.; Davis-Kean, P.E. What’s Past Is Prologue: Relations Between Early Mathematics Knowledge and High School Achievement. Educ. Res. 2014, 43, 352–360. [Google Scholar] [CrossRef] [PubMed] [Green Version]
  16. Steinmayr, R.; Spinath, B. Sex Differences in School Achievement: What Are the Roles of Personality and Achievement Motivation? Eur. J. Pers. 2008, 22, 185–209. [Google Scholar] [CrossRef]
  17. Ali, N.; Ullah, A.; Shah, M.; Ali, A.; Khan, S.A.; Shakoor, A.; Begum, A.; Ahmad, S. School Role in Improving Parenting Skills and Academic Performance of Secondary Schools Students in Pakistan. Heliyon 2020, 6, e05443. [Google Scholar] [CrossRef] [PubMed]
  18. Fan, X.; Chen, M. Parental Involvement and Students’ Academic Achievement: A Meta-Analysis. Educ. Psychol. Rev. 2001, 13, 1–22. [Google Scholar] [CrossRef]
  19. Akiba, M.; LeTendre, G.K.; Scribner, J.P. Teacher Quality, Opportunity Gap, and National Achievement in 46 Countries. Educ. Res. 2007, 36, 369–387. [Google Scholar] [CrossRef] [Green Version]
  20. Kalogrides, D.; Loeb, S. Different Teachers, Different Peers: The Magnitude of Student Sorting within Schools. Educ. Res. 2013, 42, 304–316. [Google Scholar] [CrossRef] [Green Version]
  21. Rockoff, J.E. The Impact of Individual Teachers on Student Achievement: Evidence from Panel Data Source: Vol. 94, No. 2, Papers and Proceedings of the One Hundred Sixteenth Annual Meeting of the American Economic Association San Diego, CA. Amer. Am. Econ. Rev. 2004, 94, 247–252. [Google Scholar] [CrossRef] [Green Version]
  22. Kubey, R.W.; Lavin, M.J.; Barrows, J.R. Internet Use and Collegiate Academic Performance Decrements: Early Findings. J. Commun. 2001, 51, 366–382. [Google Scholar] [CrossRef]
  23. Liebert, M.A.; Chou, C. College Students: An Online Interview Study. Cyber Psychol. Behav. 2001, 4, 573–586. [Google Scholar]
  24. Jackson, L.A.; Von Eye, A.; Biocca, F.A.; Barbatsis, G.; Zhao, Y.; Fitzgerald, H.E. Does Home Internet Use Influence the Academic Performance of Low-Income Children? Dev. Psychol. 2006, 42, 429–435. [Google Scholar] [CrossRef] [PubMed] [Green Version]
  25. Torres-Díaz, J.C.; Duart, J.M.; Gómez-Alvarado, H.F.; Marín-Gutiérrez, I.; Segarra-Faggioni, V. Internet Use and Academic Success in University Students. Comunicar 2016, 24, 61–70. [Google Scholar] [CrossRef] [Green Version]
  26. Bowman, N.A. Effect Sizes and Statistical Methods for Meta-Analysis in Higher Education. Res. High. Educ. 2012, 53, 375–382. [Google Scholar] [CrossRef]
  27. Fern, E.F.; Monroe, K.B. Effect-Size Estimates: Issues and Problems in Interpretation. J. Consum. Res. 1996, 23, 89–105. [Google Scholar] [CrossRef]
  28. Nakkula, M.; Toshalis, E. Understanding Youth: Adolescent Development for Educators. Choice Rev. Online 2006. [Google Scholar] [CrossRef]
  29. Gonzalez-pienda, J.A.; Nunez, J.C.; Gonzalez-pumariega, S.; Alvarez, L.; Roces, C.; Garcia, M. A Structural Equation Model of Parental Involvement, Motivational and Aptitudinal Characteristics, and Academic Achievement. J. Exp. Educ. 2002, 70, 257–287. [Google Scholar] [CrossRef]
  30. Julien, H.; Barker, S. How High-School Students Find and Evaluate Scientific Information: A Basis for Information Literacy Skills Development. Libr. Inf. Sci. Res. 2009, 31, 12–17. [Google Scholar] [CrossRef]
  31. Kleemola, K.; Hyytinen, H. Exploring the Relationship between Law Students’ Prior Performance and Academic Achievement at University. Educ. Sci. 2019, 9, 236. [Google Scholar] [CrossRef] [Green Version]
  32. Cooper, H.M. Research Synthesis and Meta-Analysis: A Step-by-Step Approach. Appl. Soc. Res. Methods Ser. 2010. [Google Scholar] [CrossRef] [Green Version]
  33. Moher, D.; Liberati, A.; Tetzlaff, J.; Altman, D.G.; Altman, D.; Antes, G.; Atkins, D.; Barbour, V.; Barrowman, N.; Berlin, J.A.; et al. Preferred Reporting Items for Systematic Reviews and Meta-Analyses: The PRISMA Statement. PLoS Med. 2009, 6, e1000097. [Google Scholar] [CrossRef] [Green Version]
  34. Guraya, S.Y.; Barr, H. The Effectiveness of Interprofessional Education in Healthcare: A Systematic Review and Meta-Analysis. Kaohsiung J. Med. Sci. 2018, 34, 160–165. [Google Scholar] [CrossRef] [PubMed]
  35. Rust, R.T.; Cooil, B. Reliability Measures for Qualitative Data: Theory and Implications. J. Mark. Res. 1994, 31, 1–14. [Google Scholar] [CrossRef]
  36. Rosario, A.B.; Sotgiu, F.; De Valck, K.; Bijmolt, T.H.A. The Effect of Electronic Word of Mouth on Sales: A Meta-Analytic Review of Platform, Product, and Metric Factors. J. Mark. Res. 2016, 53, 297–318. [Google Scholar] [CrossRef]
  37. Hunter, J.E.; Schmidt, F.L. Methods of Meta-Analysis: Correcting Error and Bias in Research Findings; SAGE Publications, Ltd.: Thousand Oaks, CA, USA, 2015. [Google Scholar] [CrossRef]
  38. Kline, R.B. Beyond Significance Testing: Statistics Reform in the Behavioral Sciences, 2nd ed.; American Psychological Association: Washington, DC, USA, 2013. [Google Scholar] [CrossRef]
  39. Santini, F.D.; Ladeira, W.J.; Sampaio, C.H.; da Silva Costa, G. Student Satisfaction in Higher Education: A Meta-Analytic Study. J. Mark. High. Educ. 2017, 27, 1–18. [Google Scholar] [CrossRef]
  40. Lau, J.; Ioannidis, J.P.A.; Schmid, C.H. Summing up Evidence: One Answer Is Not Always Enough. Lancet 1998, 351, 123–127. [Google Scholar] [CrossRef]
  41. Higgins, J.P.T.; Thompson, S.G.; Deeks, J.J.; Altman, D.G. Measuring Inconsistency in Meta-Analyses. Br. Med. J. 2003, 327, 557–560. [Google Scholar] [CrossRef] [Green Version]
  42. Combs, J.G.; Crook, T.R.; Rauch, A. Meta-Analytic Research in Management: Contemporary Approaches, Unresolved Controversies, and Rising Standards. J. Manag. Stud. 2019, 56, 1–18. [Google Scholar] [CrossRef] [Green Version]
  43. Viechtbauer, W. Conducting Meta-Analyses in R with the Metafor package. J. Stat. Softw. 2010, 36, 1–48. [Google Scholar] [CrossRef] [Green Version]
  44. Lipsey, M.W.; Wilson, D.B. Practical Meta-Analysis. Appl. Soc. Res. Methods Ser. 2007, 135, 58. [Google Scholar] [CrossRef]
  45. Bandura, A. Self-Efficacy: The Excercise of Control. Springer Ref. 1997, 13, 158–166. [Google Scholar]
  46. Conger, R.D.; Wallace, L.E.; Sun, Y.; Simons, R.L.; McLoyd, V.C.; Brody, G.H. Economic Pressure in African American Families: A Replication and Extension of the Family Stress Model. Dev. Psychol. 2002, 38, 179–193. [Google Scholar] [CrossRef] [PubMed]
  47. Digman, J.M. Higher-Order Factors of the Big Five. J. Pers. Soc. Psychol. 1997, 73, 1246–1256. [Google Scholar] [CrossRef] [PubMed]
  48. Gottfredson, L.S. Why g Matters: The Complexity of Everyday Life. Intelligence 1997, 24, 79–132. [Google Scholar] [CrossRef] [Green Version]
  49. Rohde, T.E.; Thompson, L.A. Predicting Academic Achievement with Cognitive Ability. Intelligence 2007, 35, 83–92. [Google Scholar] [CrossRef]
  50. Furnham, A.; Cheng, H. Childhood Cognitive Ability Predicts Adult Financial Well-Being. J. Intell. 2016, 5, 3. [Google Scholar] [CrossRef] [Green Version]
  51. Brunner, M.; Krauss, S.; Kunter, M. Gender Differences in Mathematics: Does the Story Need to Be Rewritten? Intelligence 2008, 36, 403–421. [Google Scholar] [CrossRef]
  52. Darnon, C.; Harackiewicz, J.M.; Butera, F.; Mugny, G.; Quiamzade, A. Performance-Approach and Performance-Avoidance Goals: When Uncertainty Makes a Difference. Personal. Soc. Psychol. Bull. 2007, 33, 813–827. [Google Scholar] [CrossRef] [Green Version]
  53. Baranik, L.E.; Stanley, L.J.; Bynum, B.H.; Lance, C.E. Examining the Construct Validity of Mastery-Avoidance Achievement Goals: A Meta-Analysis. Hum. Perform. 2010, 23, 265–282. [Google Scholar] [CrossRef]
  54. McCrae, R.R.; Costa, P.T. The Five Factor Theory of Personality. In Handbook of Personality; Elsevier: Amsterdam, The Netherlands, 2008. [Google Scholar] [CrossRef]
  55. Bernardo, A.B.I.; Cordel, M.O.; Lucas, R.I.G.; Teves, J.M.M.; Yap, S.A.; Chua, U.C. Using Machine Learning Approaches to Explore Noncognitive Variables Influencing Reading Proficiency in English among Filipino Learners. Educ. Sci. 2021, 11, 628. [Google Scholar] [CrossRef]
  56. Fischer, C.; Pardos, Z.A.; Baker, R.S.; Williams, J.J.; Smyth, P.; Yu, R.; Slater, S.; Baker, R.; Warschauer, M. Mining Big Data in Education: Affordances and Challenges. Rev. Res. Educ. 2020, 44, 130–160. [Google Scholar] [CrossRef] [Green Version]
  57. Cruz-Jesus, F.; Castelli, M.; Oliveira, T.; Mendes, R.; Nunes, C.; Sa-Velho, M.; Rosa-Louro, A. Using Artificial Intelligence Methods to Assess Academic Achievement in Public High Schools of a European Union Country. Heliyon 2020, 6, e04081. [Google Scholar] [CrossRef] [PubMed]
  58. Bosworth, R. Class Size, Class Composition, and the Distribution of Student Achievement. Educ. Econ. 2014, 22, 141–165. [Google Scholar] [CrossRef]
  59. Galyon, C.E.; Blondin, C.A.; Yaw, J.S.; Nalls, M.L.; Williams, R.L. The Relationship of Academic Self-Efficacy to Class Participation and Exam Performance. Soc. Psychol. Educ. 2012, 15, 233–249. [Google Scholar] [CrossRef]
  60. Mazzetti, G.; Paolucci, A.; Guglielmi, D.; Vannini, I. The Impact of Learning Strategies and Future Orientation on Academic Success: The Moderating Role of Academic Self-Efficacy among Italian Undergraduate Students. Educ. Sci. 2020, 10, 134. [Google Scholar] [CrossRef]
  61. Elliot, A.J.; Murayama, K. On the Measurement of Achievement Goals: Critique, Illustration, and Application. J. Educ. Psychol. 2008, 100, 613–628. [Google Scholar] [CrossRef] [Green Version]
  62. Payne, S.C.; Youngcourt, S.S.; Beaubien, J.M. A Meta-Analytic Examination of the Goal Orientation Nomological Net. J. Appl. Psychol. 2007, 92, 128–150. [Google Scholar] [CrossRef]
  63. Dumfart, B.; Neubauer, A.C. Conscientiousness Is the Most Powerful Noncognitive Predictor of School Achievement in Adolescents. J. Individ. Differ. 2016, 37, 8–15. [Google Scholar] [CrossRef]
  64. Schunk, D.H.; Ertmer, P.A. Self-Regulation and Academic Learning: Self-Efficacy Enhancing Interventions. In Handbook of Self-Regulation; Elsevier: Amsterdam, The Netherlands, 2000. [Google Scholar] [CrossRef]
  65. Bakadorova, O.; Raufelder, D. Do Socio-Motivational Relationships Predict Achievement Motivation in Adolescents with High and Low School Self-Concepts? J. Educ. Res. 2016, 109, 219–231. [Google Scholar] [CrossRef]
  66. Wilder, S. Effects of Parental Involvement on Academic Achievement: A Meta-Synthesis. Educ. Rev. 2014, 66, 377–397. [Google Scholar] [CrossRef]
  67. Hampden-Thompson, G.; Galindo, C. School–Family Relationships, School Satisfaction and the Academic Achievement of Young People. Educ. Rev. 2017, 69, 248–265. [Google Scholar] [CrossRef]
  68. Li, S.; Xu, Q.; Xia, R. Relationship Between SES and Academic Achievement of Junior High School Students in China: The Mediating Effect of Self-Concept. Front. Psychol. 2020, 10, 2513. [Google Scholar] [CrossRef] [PubMed]
  69. Dixson, D.D.; Keltner, D.; Worrell, F.C.; Mello, Z. The Magic of Hope: Hope Mediates the Relationship between Socioeconomic Status and Academic Achievement. J. Educ. Res. 2018, 111, 507–515. [Google Scholar] [CrossRef]
  70. Xu, Z.; Turel, O.; Yuan, Y. Online Game Addiction among Adolescents: Motivation and Prevention Factors. Eur. J. Inf. Syst. 2012, 21, 321–340. [Google Scholar] [CrossRef]
  71. Toozandehjani, A.; Mahmoodi, Z.; Rahimzadeh, M.; Jashni Motlagh, A.; Akbari Kamrani, M.; Esmaelzadeh Saeieh, S. The Predictor Role of Internet Addiction in High- Risk Behaviors and General Health Status among Alborz Students: A Structural Equation Model. Heliyon 2021, 7, e06987. [Google Scholar] [CrossRef] [PubMed]
  72. Venkatesh, V.; Sykes, T.A.; Chan, F.K.Y.; Thong, J.Y.L.; Hu, P.J.H. Children’s Internet Addiction, Family-to-Work Conflict, and Job Outcomes: A Study of Parent–Child Dyads. MIS Q. Manag. Inf. Syst. 2019, 43, 903–927. [Google Scholar] [CrossRef]
  73. Saxvig, I.W.; Pallesen, S.; Wilhelmsen-Langeland, A.; Molde, H.; Bjorvatn, B. Prevalence and Correlates of Delayed Sleep Phase in High School Students. Sleep Med. 2012, 13, 193–199. [Google Scholar] [CrossRef] [Green Version]
  74. Abdi, H.M.; Bageri, S.; Shoghi, S.; Goodarzi, S.; Hosseinzadeh, A. The Role of Metacognitive and Self-Efficacy Beliefs in Students’ Test Anxiety and Academic Achievement. Aust. J. Basic Appl. Sci. 2012, 6, 418–422. [Google Scholar]
  75. Ahinful, G.S.; Tauringana, V.; Bansah, E.A.; Essuman, D. Determinants of Academic Performance of Accounting Students in Ghanaian Secondary and Tertiary Education Institutions. Account. Educ. 2019, 28, 553–581. [Google Scholar] [CrossRef]
  76. Anderson, E.S.; Keith, T.Z. A Longitudinal Test of a Model of Academic Success for at–Risk High School Students. J. Educ. Res. 1997, 90, 259–268. [Google Scholar] [CrossRef]
  77. Arslan, G. Relationship between Sense of Rejection, Academic Achievement, Academic Efficacy, and Educational Purpose in High School Students. Egit. Ve Bilim 2016, 41, 293–304. [Google Scholar] [CrossRef] [Green Version]
  78. Carolan, B.V. Unequal Academic Achievement in High School: The Mediating Roles of Concerted Cultivation and Close Friends. Br. J. Sociol. Educ. 2016, 37, 1034–1055. [Google Scholar] [CrossRef]
  79. Cho, Y.; Coulton, C.J. The Effects of Parental Nonstandard Work Schedules on Adolescents’ Academic Achievement in Dual-Earner Households in South Korea. Child Indic. Res. 2016, 9, 193–212. [Google Scholar] [CrossRef]
  80. Crook, S.J.; Sharma, M.D.; Wilson, R. An Evaluation of the Impact of 1:1 Laptops on Student Attainment in Senior High School Sciences. Int. J. Sci. Educ. 2015, 37, 272–293. [Google Scholar] [CrossRef]
  81. Crouzevialle, M.; Butera, F. The Role of Test Anticipation in the Link between Performance-Approach Goals and Academic Achievement: A Field Experiment with Science, Technology, Engineering, And mathematics (STEM) Classes. Swiss J. Psychol. 2016, 75, 123–132. [Google Scholar] [CrossRef]
  82. Di Fabio, A.; Busoni, L. Fluid Intelligence, Personality Traits and Scholastic Success: Empirical Evidence in a Sample of Italian High School Students. Pers. Individ. Dif. 2007, 43, 2095–2104. [Google Scholar] [CrossRef]
  83. Di Giunta, L.; Alessandri, G.; Gerbino, M.; Luengo Kanacri, P.; Zuffiano, A.; Caprara, G.V. The Determinants of Scholastic Achievement: The Contribution of Personality Traits, Self-Esteem, and Academic Self-Efficacy. Learn. Individ. Differ. 2013, 27, 102–108. [Google Scholar] [CrossRef]
  84. Dickhäuser, O.; Dinger, F.C.; Janke, S.; Spinath, B.; Steinmayr, R. A Prospective Correlational Analysis of Achievement Goals as Mediating Constructs Linking Distal Motivational Dispositions to Intrinsic Motivation and Academic Achievement. Learn. Individ. Differ. 2016, 50, 30–41. [Google Scholar] [CrossRef]
  85. Dinger, F.C.; Dickhäuser, O.; Spinath, B.; Steinmayr, R. Antecedents and Consequences of Students’ Achievement Goals: A Mediation Analysis. Learn. Individ. Differ. 2013, 28, 90–101. [Google Scholar] [CrossRef]
  86. Ergene, T. The Relationships among Test Anxiety, Study Habits, Achievement, Motivation, and Academic Performance among Turkish High School Students. Egit. Ve Bilim 2011, 36, 320–330. [Google Scholar]
  87. Gibson, E.S.; Powles, A.C.P.; Thabane, L.; O’Brien, S.; Molnar, D.S.; Trajanovic, N.; Ogilvie, R.; Shapiro, C.; Yan, M.; Chilcott-Tanser, L. “Sleepiness” Is Serious in Adolescence: Two Surveys of 3235 Canadian Students. BMC Public Health 2006, 6, 1–9. [Google Scholar] [CrossRef]
  88. Gilar-Corbi, R.; Miñano, P.; Veas, A.; Castejón, J.L. Testing for Invariance in a Structural Model of Academic Achievement across Underachieving and Non-Underachieving Students. Contemp. Educ. Psychol. 2019, 59, 101780. [Google Scholar] [CrossRef]
  89. Howard, N.R.; Howard, K.E.; Busse, R.T.; Hunt, C. Let’s Talk: An Examination of Parental Involvement as a Predictor of STEM Achievement in Math for High School Girls. Urban Educ. 2019, 0042085919877933. [Google Scholar] [CrossRef]
  90. Inal, S.; Kelleci, M.; Canbulat, N. Internet Use and Its Relation with the Academic Performance for a Sample of High School Students. HealthMED 2012, 6, 1643–1650. [Google Scholar]
  91. Ishak, Z.; Low, S.F.; Lau, P.L. Parenting Style as a Moderator for Students’ Academic Achievement. J. Sci. Educ. Technol. 2012, 21, 487–493. [Google Scholar] [CrossRef]
  92. Keith, T.Z.; Benson, M.J. Effects of Manipulable Influences on High School Grades Across Five Ethnic Groups. J. Educ. Res. 1992, 86, 85–93. [Google Scholar] [CrossRef]
  93. Kim, S.; Hong, S. The Effects of School Contexts and Student Characteristics on Cognitive and Affective Achievement in South Korea. Asia Pacific Educ. Rev. 2018, 19, 557–572. [Google Scholar] [CrossRef]
  94. King, R.B.; Ganotice, F.A. The Social Underpinnings of Motivation and Achievement: Investigating the Role of Parents, Teachers, and Peers on Academic Outcomes. Asia-Pacific Educ. Res. 2014, 23, 745–756. [Google Scholar] [CrossRef]
  95. Köller, O.; Meyer, J.; Saß, S.; Baumert, J. New Analyses of an Old Topic. Effects of Intelligence and Motivation on Academic Achievement. J. Educ. Res. Online 2019, 11, 166–189. [Google Scholar]
  96. Kozina, A.; Wiium, N.; Gonzalez, J.M.; Dimitrova, R. Positive Youth Development and Academic Achievement in Slovenia. Child Youth Care Forum 2019, 48, 223–240. [Google Scholar] [CrossRef]
  97. Levi, U.; Einav, M.; Ziv, O.; Raskind, I.; Margalit, M. Academic Expectations and Actual Achievements: The Roles of Hope and Effort. Eur. J. Psychol. Educ. 2014, 29, 367–386. [Google Scholar] [CrossRef]
  98. Liem, G.A.D.; Martin, A.J.; Porter, A.L.; Colmar, S. Sociocultural Antecedents of Academic Motivation and Achievement: Role of Values and Achievement Motives in Achievement Goals and Academic Performance. Asian J. Soc. Psychol. 2012, 15, 1–13. [Google Scholar] [CrossRef]
  99. Luo, W.; Hogan, D.; Tan, L.S.; Kaur, B.; Ng, P.T.; Chan, M. Self-Construal and Students’ Math Self-Concept, Anxiety and Achievement: An Examination of Achievement Goals as Mediators. Asian J. Soc. Psychol. 2014, 17, 184–195. [Google Scholar] [CrossRef]
  100. McIlroy, D.; Palmer-Conn, S.; Lawler, B.; Poole, K.; Ursavas, O. Secondary Level Achievement Non-Intellective Factors Implicated in the Process and Product of Performance. J. Individ. Differ. 2017, 38. [Google Scholar] [CrossRef]
  101. Meyer, J.; Fleckenstein, J.; Retelsdorf, J.; Köller, O. The Relationship of Personality Traits and Different Measures of Domain-Specific Achievement in Upper Secondary Education. Learn. Individ. Differ. 2019, 69, 45–59. [Google Scholar] [CrossRef]
  102. Miñano, P.; Gilar, R.; Castejón, J.L. A Structural Model of Cognitive-Motivational Variables as Explanatory Factors of Academic Achievement in Spanish Language and Mathematics. An. Psicol. 2012, 28, 45–54. [Google Scholar]
  103. Novak, D.; Emeljanovas, A.; Mieziene, B.; Antala, B.; Stefan, L.; Kawachi, I. Is Social Capital Associated with Academic Achievement in Lithuanian High-School Students? A Population-Based Study. Montenegrin J. Sport. Sci. Med. 2018, 7, 29–35. [Google Scholar] [CrossRef] [Green Version]
  104. Oljača, M.; Erdeš-Kavečan, D.; Kostović, S. Relationship between the Quality of Family Functioning and Academic Achievement in Adolescents. Croat. J. Educ. 2012, 14, 485–510. [Google Scholar]
  105. Osborne, J.W. Testing Stereotype Threat: Does Anxiety Explain Race and Sex Differences in Achievement? Contemp. Educ. Psychol. 2001, 26, 291–310. [Google Scholar] [CrossRef]
  106. Peklaj, C.; Podlesek, A.; Pečjak, S. Gender, Previous Knowledge, Personality Traits and Subject-Specific Motivation as Predictors of Students’ Math Grade in Upper-Secondary School. Eur. J. Psychol. Educ. 2015, 30, 313–330. [Google Scholar] [CrossRef]
  107. Pina-Neves, S.; Faria, L.; Räty, H. Students’ Individual and Collective Efficacy: Joining Together Two Sets of Beliefs for Understanding Academic Achievement. Eur. J. Psychol. Educ. 2013, 28, 453–474. [Google Scholar] [CrossRef] [Green Version]
  108. Rahafar, A.; Maghsudloo, M.; Farhangnia, S.; Vollmer, C.; Randler, C. The Role of Chronotype, Gender, Test Anxiety, and Conscientiousness in Academic Achievement of High School Students. Chronobiol. Int. 2016, 33, 1–9. [Google Scholar] [CrossRef] [PubMed]
  109. Robinson, L.; Wiborg, Ø.; Schulz, J. Interlocking Inequalities: Digital Stratification Meets Academic Stratification. Am. Behav. Sci. 2018, 62, 1251–1272. [Google Scholar] [CrossRef]
  110. Sæle, R.G.; Sørlie, T.; Nergård-Nilssen, T.; Ottosen, K.O.; Goll, C.B.; Friborg, O. Demographic and Psychological Predictors of Grade Point Average (GPA) in North-Norway: A Particular Analysis of Cognitive/School-Related and Literacy Problems. Educ. Psychol. 2016, 36, 1886–1907. [Google Scholar] [CrossRef] [Green Version]
  111. Sahin, M.; Gumus, Y.Y.; Dincel, S. Game Addiction and Academic Achievement. Educ. Psychol. 2016, 36, 1540–1550. [Google Scholar] [CrossRef]
  112. Sampasa-Kanyinga, H.; Chaput, J.P.; Hamilton, H.A. Social Media Use, School Connectedness, and Academic Performance Among Adolescents. J. Prim. Prev. 2019, 40, 189–211. [Google Scholar] [CrossRef]
  113. Sánchez, B.; Colón, Y.; Esparza, P. The Role of Sense of School Belonging and Gender in the Academic Adjustment of Latino Adolescents. J. Youth Adolesc. 2005, 34, 619–628. [Google Scholar] [CrossRef]
  114. Sivertsen, B.; Glozier, N.; Harvey, A.G.; Hysing, M. Academic Performance in Adolescents with Delayed Sleep Phase. Sleep Med. 2015, 16, 1084–1090. [Google Scholar] [CrossRef]
  115. Sorić, I.; Penezić, Z.; Burić, I. The Big Five Personality Traits, Goal Orientations, and Academic Achievement. Learn. Individ. Differ. 2017, 54, 126–134. [Google Scholar] [CrossRef]
  116. Titus, A.B.; Dada, A.B.; Adu, E.O. School Location and Gender as Correlates of Students’ Academic Achievement in Economics. Int. J. Educ. Sci. 2016, 13, 255–261. [Google Scholar] [CrossRef]
  117. Tomás, J.M.; Gutiérrez, M.; Georgieva, S.; Hernández, M. The Effects of Self-Efficacy, Hope, and Engagement on the Academic Achievement of Secondary Education in the Dominican Republic. Psychol. Sch. 2020, 57, 191–203. [Google Scholar] [CrossRef]
  118. Tonetti, L.; Fabbri, M.; Filardi, M.; Martoni, M.; Natale, V. Effects of Sleep Timing, Sleep Quality and Sleep Duration on School Achievement in Adolescents. Sleep Med. 2015, 16, 936–940. [Google Scholar] [CrossRef] [PubMed]
  119. Wang, S.; Zhao, Y.; Li, J.; Wang, X.; Luo, K.; Gong, Q. Brain Structure Links Trait Conscientiousness to Academic Performance. Sci. Rep. 2019, 9, 1–12. [Google Scholar] [CrossRef] [PubMed]
  120. Wernette, M.J.; Emory, J. Student Bedtimes, Academic Performance, and Health in a Residential High School. J. Sch. Nurs. 2017, 33, 264–268. [Google Scholar] [CrossRef] [PubMed]
  121. Zhang, D.; Cui, Y.; Zhou, Y.; Cai, M.; Liu, H. The Role of School Adaptation and Self-Concept in Influencing Chinese High School Students’ Growth in Math Achievement. Front. Psychol. 2018, 9, 2356. [Google Scholar] [CrossRef] [PubMed]
  122. Zhou, W.; Zhou, M. Role of Self-Identity and Self-Determination in English Learning among High School Students. J. Lang. Identity Educ. 2018, 17, 168–181. [Google Scholar] [CrossRef]
Figure 1. Literature search, screening, and assessment process. Note: n refers to the number of papers.
Education 12 00287 g001
Figure 2. Final weight analysis and meta-analysis results model. Note: * p < 0.05; ** p < 0.01; and *** p < 0.001. Values represent the weight and effect sizes (r) adjusted by sample size, and measurement reliabilities are in parentheses. Full lines represent significant paths.
Education 12 00287 g002
Table 1. Weight analysis results (ordered by frequency of use).
Independent VariableDependent VariableNon-SignificantSignificantFrequency of UseWeight = Sig/Freq
GenderAA417210.81
Socioeconomic status (SES)AA212140.86
Academic self-efficacyAA011111.00
Performance-approachAA2790.78
ConscientiousnessAA1780.88
Cognitive abilityAA1780.88
AgreeablenessAA4260.33
Performance avoidanceAA1450.80
MotivationAA0441.00
Sleep habitsAA0441.00
ICT leisure useAA1340.75
ExtraversionAA3140.25
OpennessAA3140.25
AbsenteeismAA0331.00
Mastery avoidanceAA0331.00
Work avoidanceAA0331.00
Parental involvementAA1230.67
Emotional stabilityAA2130.33
Mastery approachAA2130.33
Table 2. Meta-analytic calculation (ordered by frequency of use).
Variables (k)(o)NrZSigLCI (95%)UCI (95%)QI2
Gender2021571,462−0.021−0.4700.636−0.1090.0675220.20099.600%
Socioeconomic status1313117,0880.1833.4200.000 ***0.0790.2841748.68099.300%
Academic self-efficacy111127,7050.3473.9700.000 ***0.181493969.22098.900%
Performance-approach9989300.1472.6200.008 **0.0370.25490.78091.200%
Conscientiousness9910,9810.1191.3900.165−0.0490.281416.34098.100%
Cognitive ability8850,8440.2491.2100.225−0.1560.5837732.00099.900%
Agreeableness665654−0.024−0.3910.697−0.140.178.87092.400%
Performance-avoidance453244−0.099−1.1400.253−0.2630.0773.22094.500%
Motivation4421,0540.2211.6900.001 ***0.1840.25512.09075.200%
Sleep habits3311,799−0.192−2.0100.044 *−0.366−0.004134.86098.500%
ICT leisure use448777−0.216−2.5900.009 **−0.368−0.05384.33096.400%
Extraversion444572−0.044−2.6800.007 **−0.076−0.0193.31 ns4.200%
Openness4446170.0751.3400.179−0.0340.18411.69074.300%
Absenteeism339271−0.177−1.6800.095−0.3690.02954.15096.300%
Mastery avoidance231908−0.271−2.4400.014 *−0.464−0.05539.57094.900%
Work avoidance333325−0.219−2.7200.006 **−0.366−0.06223.04091.300%
Parental involvement3323,8460.1132.2500.024 *0.0170.245122.15098.400%
Emotional Stability4413160.0561.2600.207−0.0310.1425.20 ns42.400%
Mastery approach3342860.2212.0000.004 **0.0040.41849.51096.000%
Note: * p < 0.05; ** p < 0.01; and *** p < 0.001; ns = non-significant; k = number of studies used in the analysis; o = number of observations tested; r = weighted average effect and corrected from the sample obtained in studies; Z = Fisher Z effects; Sig = degree of significance of the effect size, LCI lower confidence interval; UCI upper confidence interval; Q: test of heterogeneity; and I2 = test of heterogeneity.
Table 3. Meta-regression analysis.
Academic Self−Efficacy and AA
ModeratorßzCI(L)CI(U)p
Intercept0.8970.911−0.890−2.6800.325
PISA × ASE−0.0020.001−0.0040.0010.208
HDI × ASE0.3751.560−2.6903.4400.811
EI × ASE−0.1240.933−1.9501.7000.089
Socioeconomic status (SES) and AA
ßzCI(L)CI(U)p
Intercept1.2671.530−1.7304.2600.408
PISA × SES−0.0010.002−0.0050.0030.587
HDI × SES−1.9004.090−9.9106.1100.642
EI × SES1.3102.730−4.0506.7400.632
Publisher’s Note: MDPI stays neutral with regard to jurisdictional claims in published maps and institutional affiliations.

