
Online Formative Assessment in Higher Education: Bibliometric Analysis

 ,
,  ,
,
Abstract
:1. Introduction
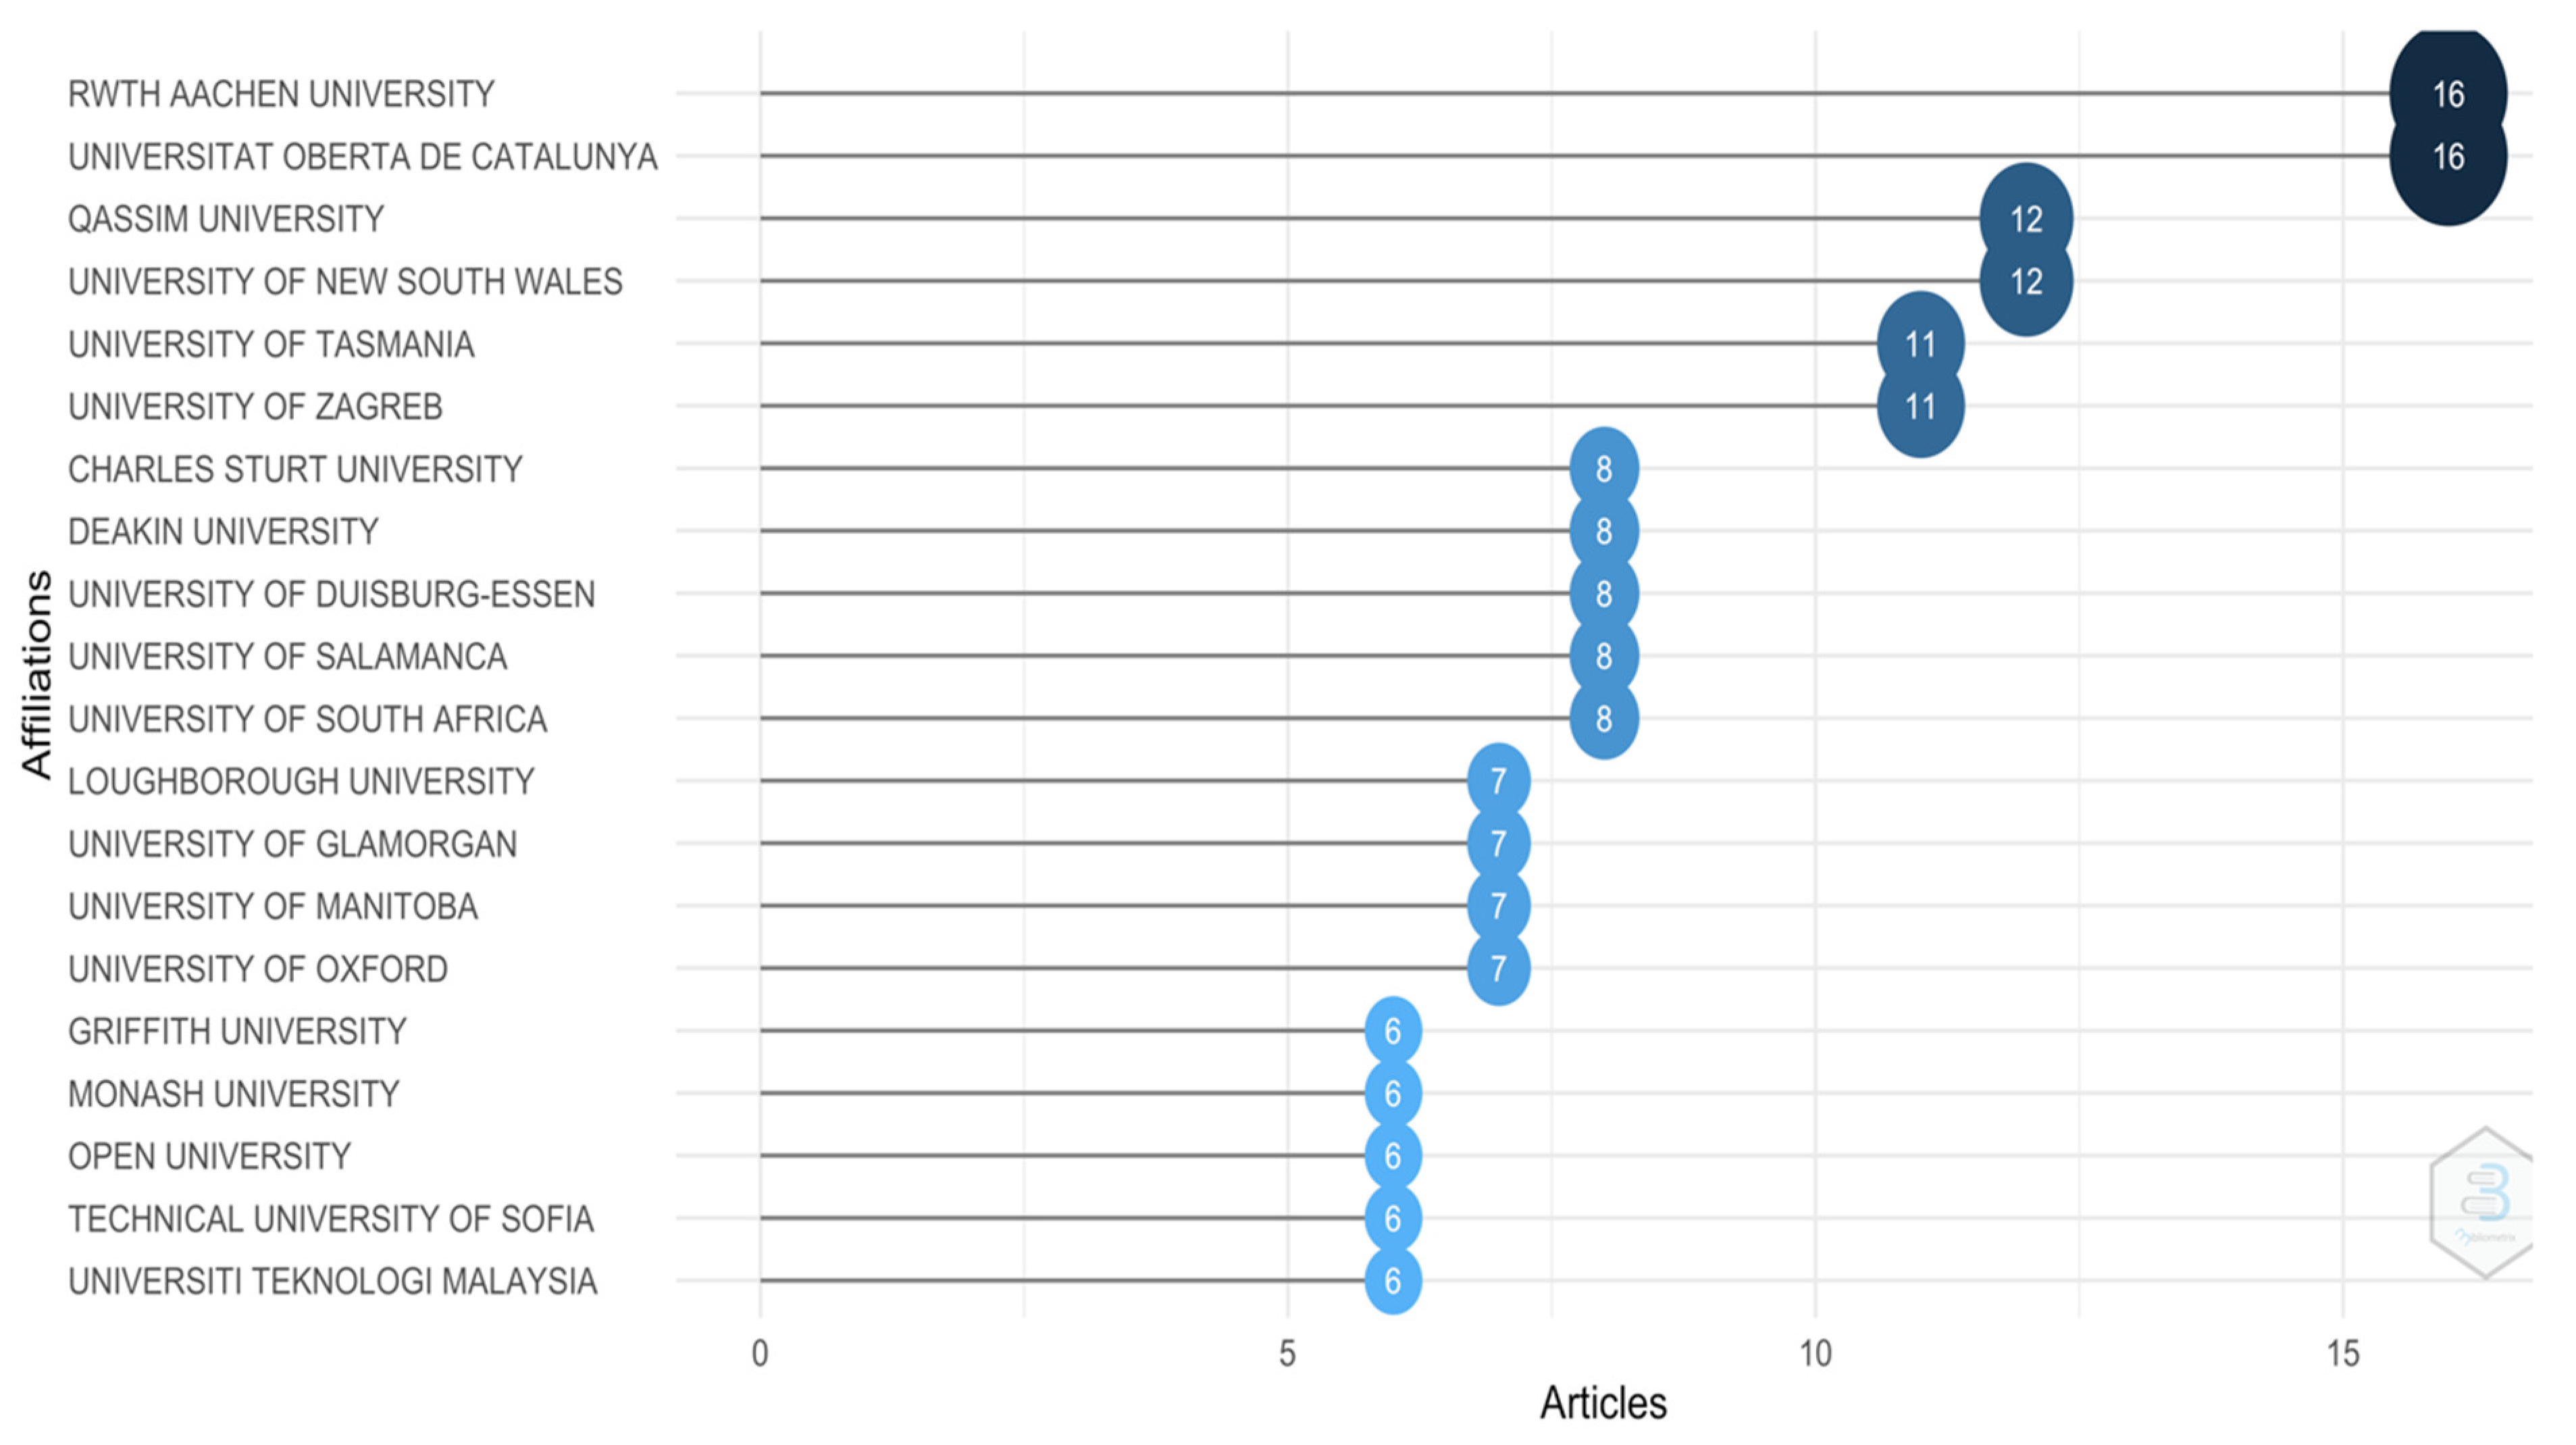
- Which are the most relevant and cited studies, authors, affiliations, and sources relating to online formative assessment?
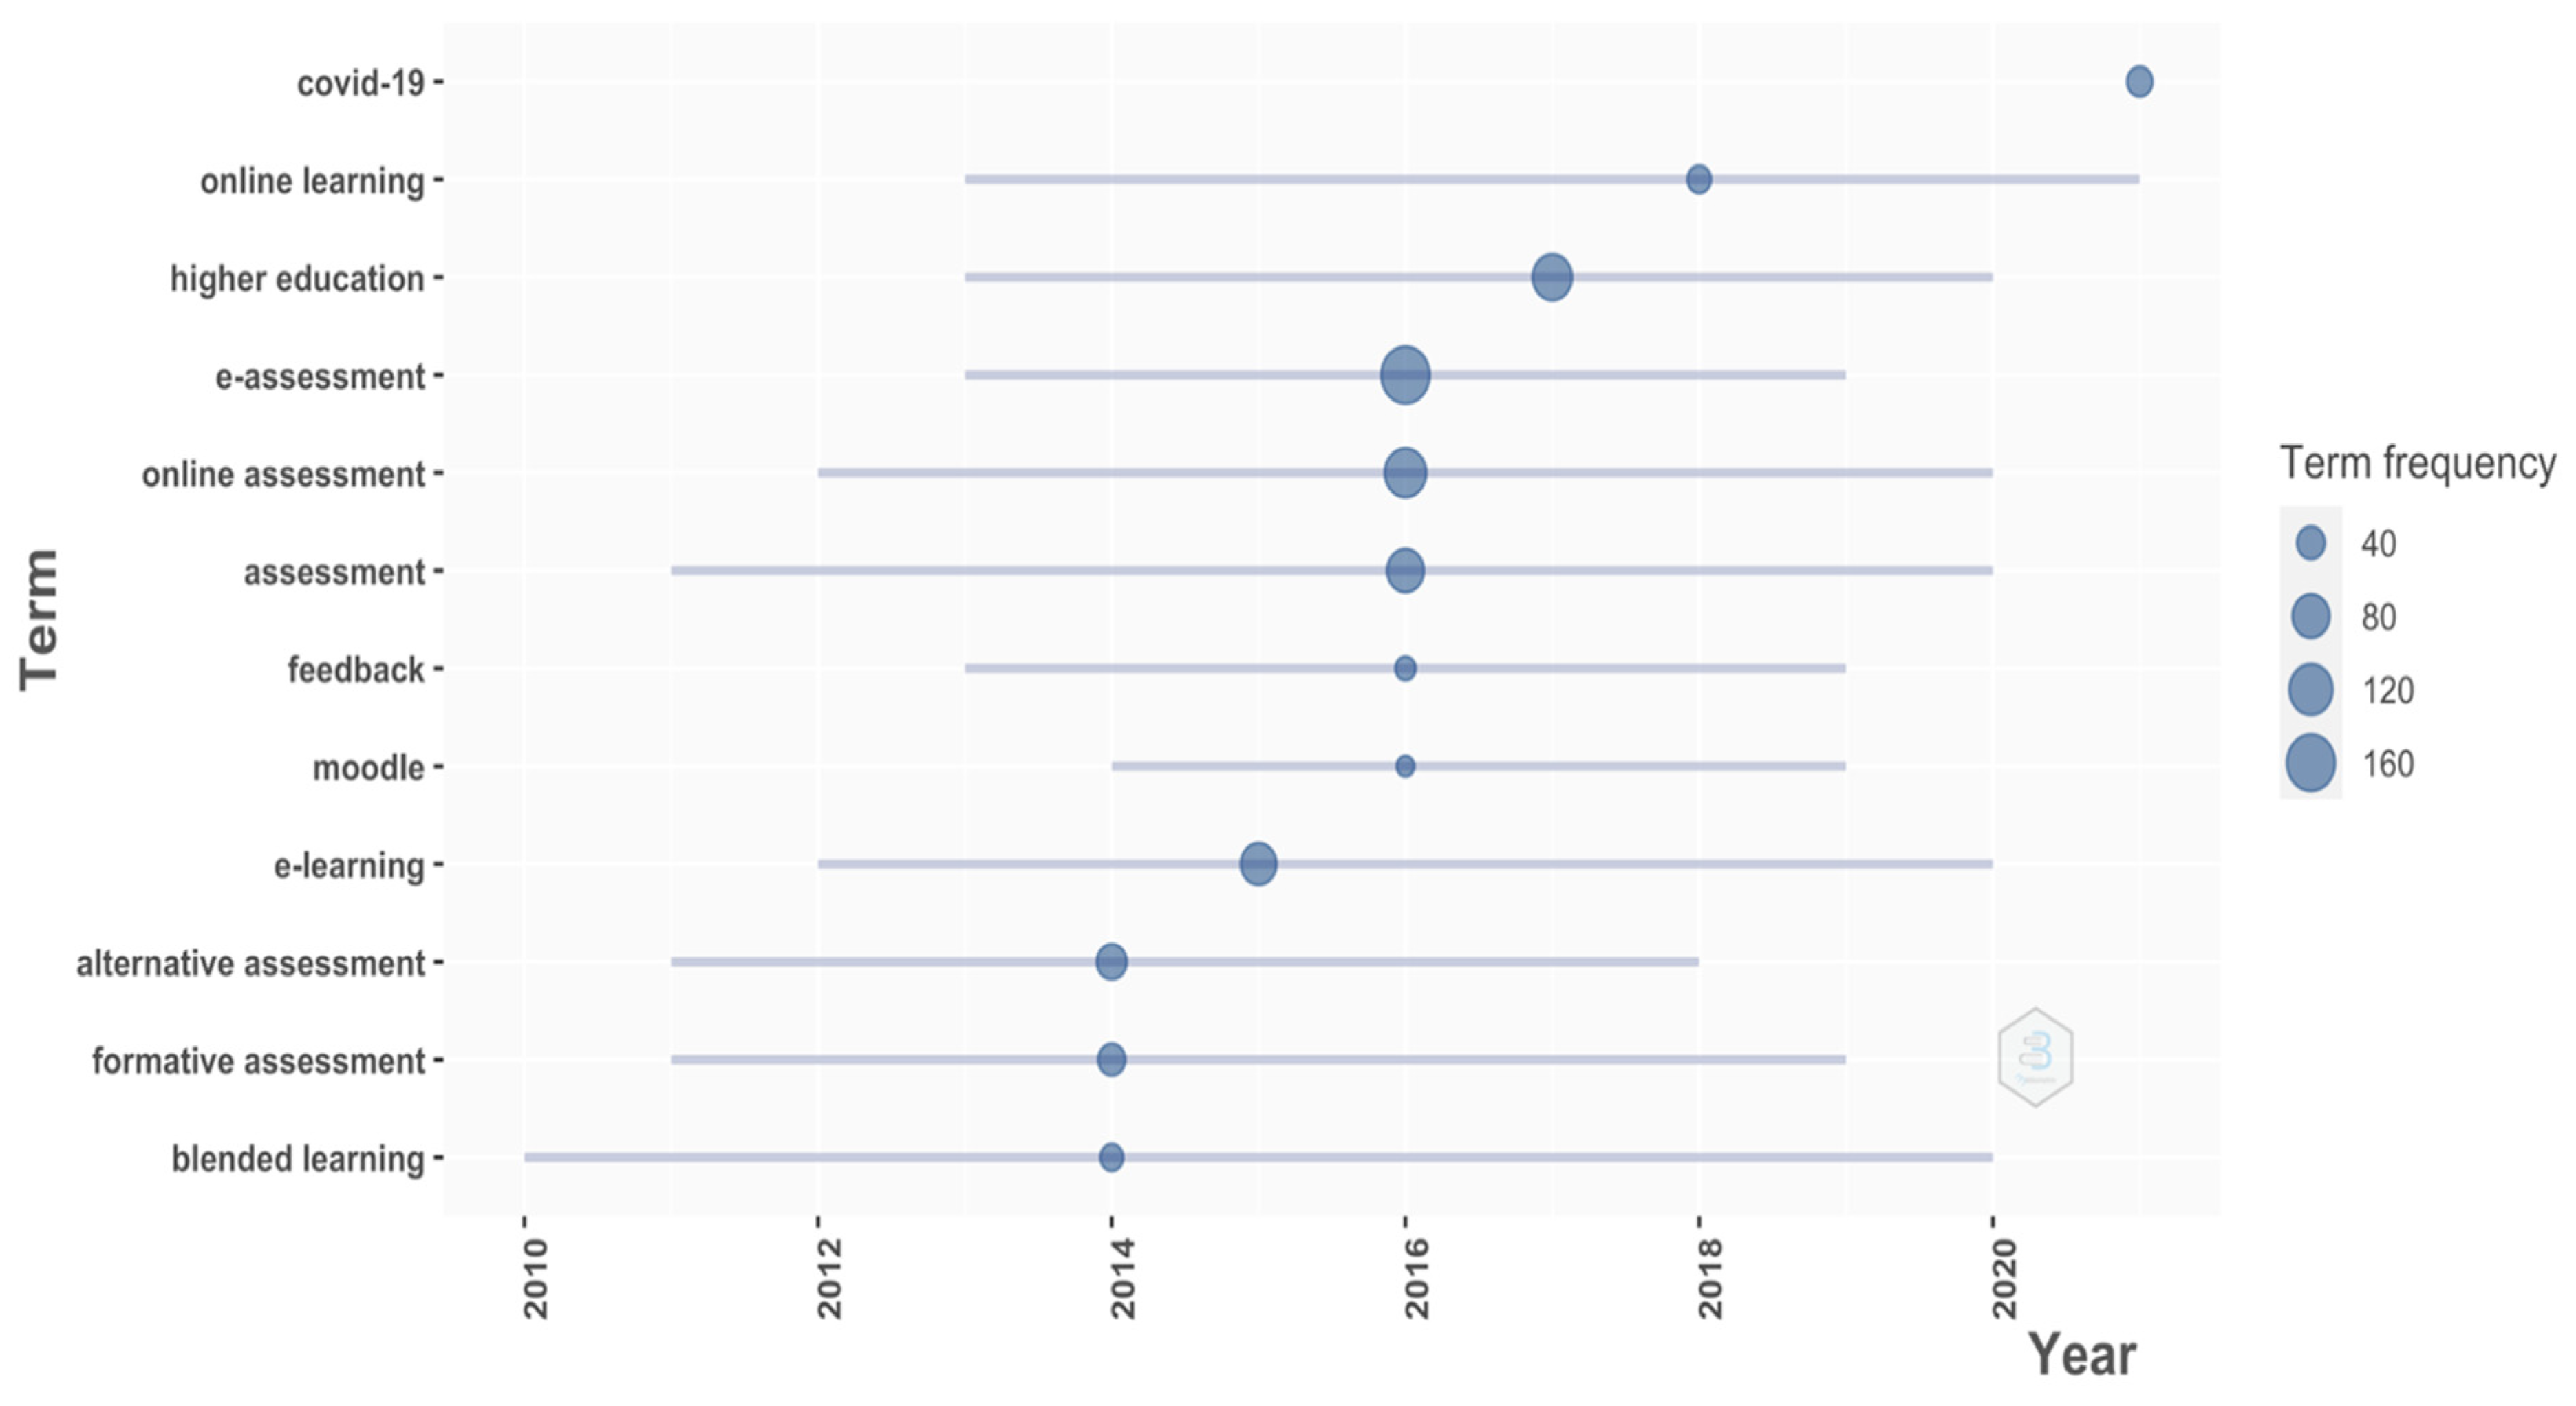
- What are the trend topics in online formative assessment?
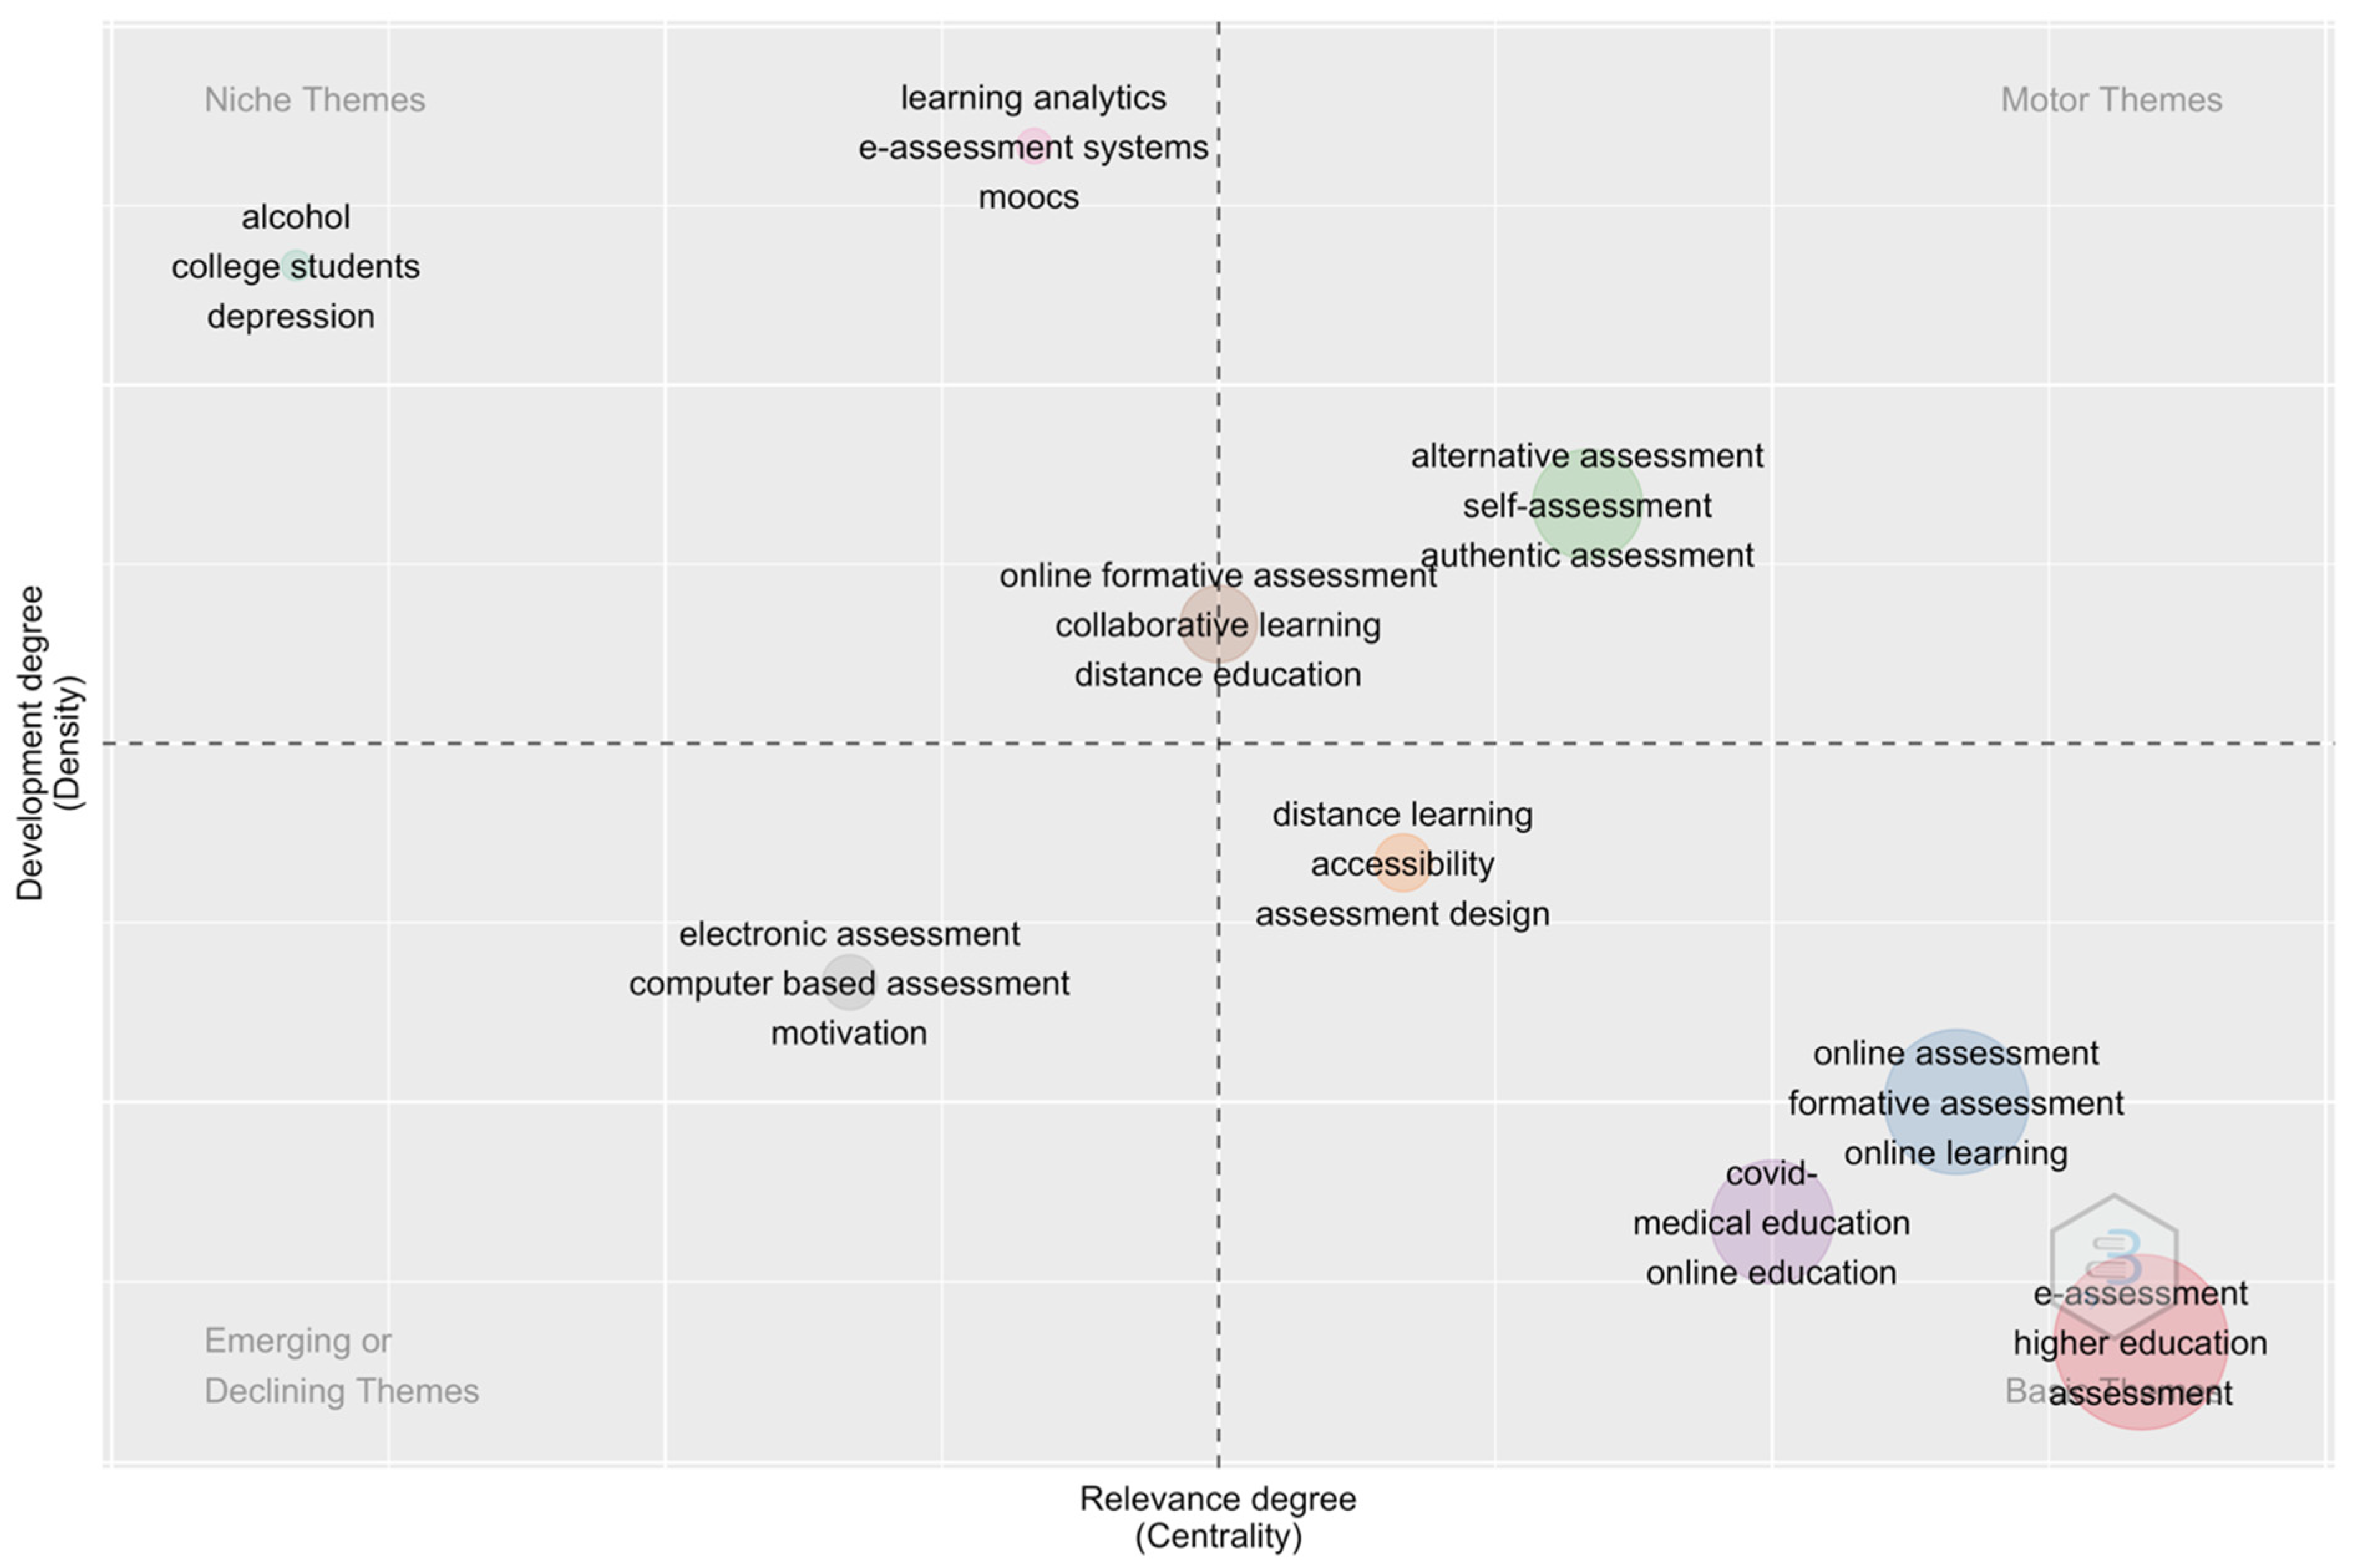
- What are the research themes in online formative assessment?
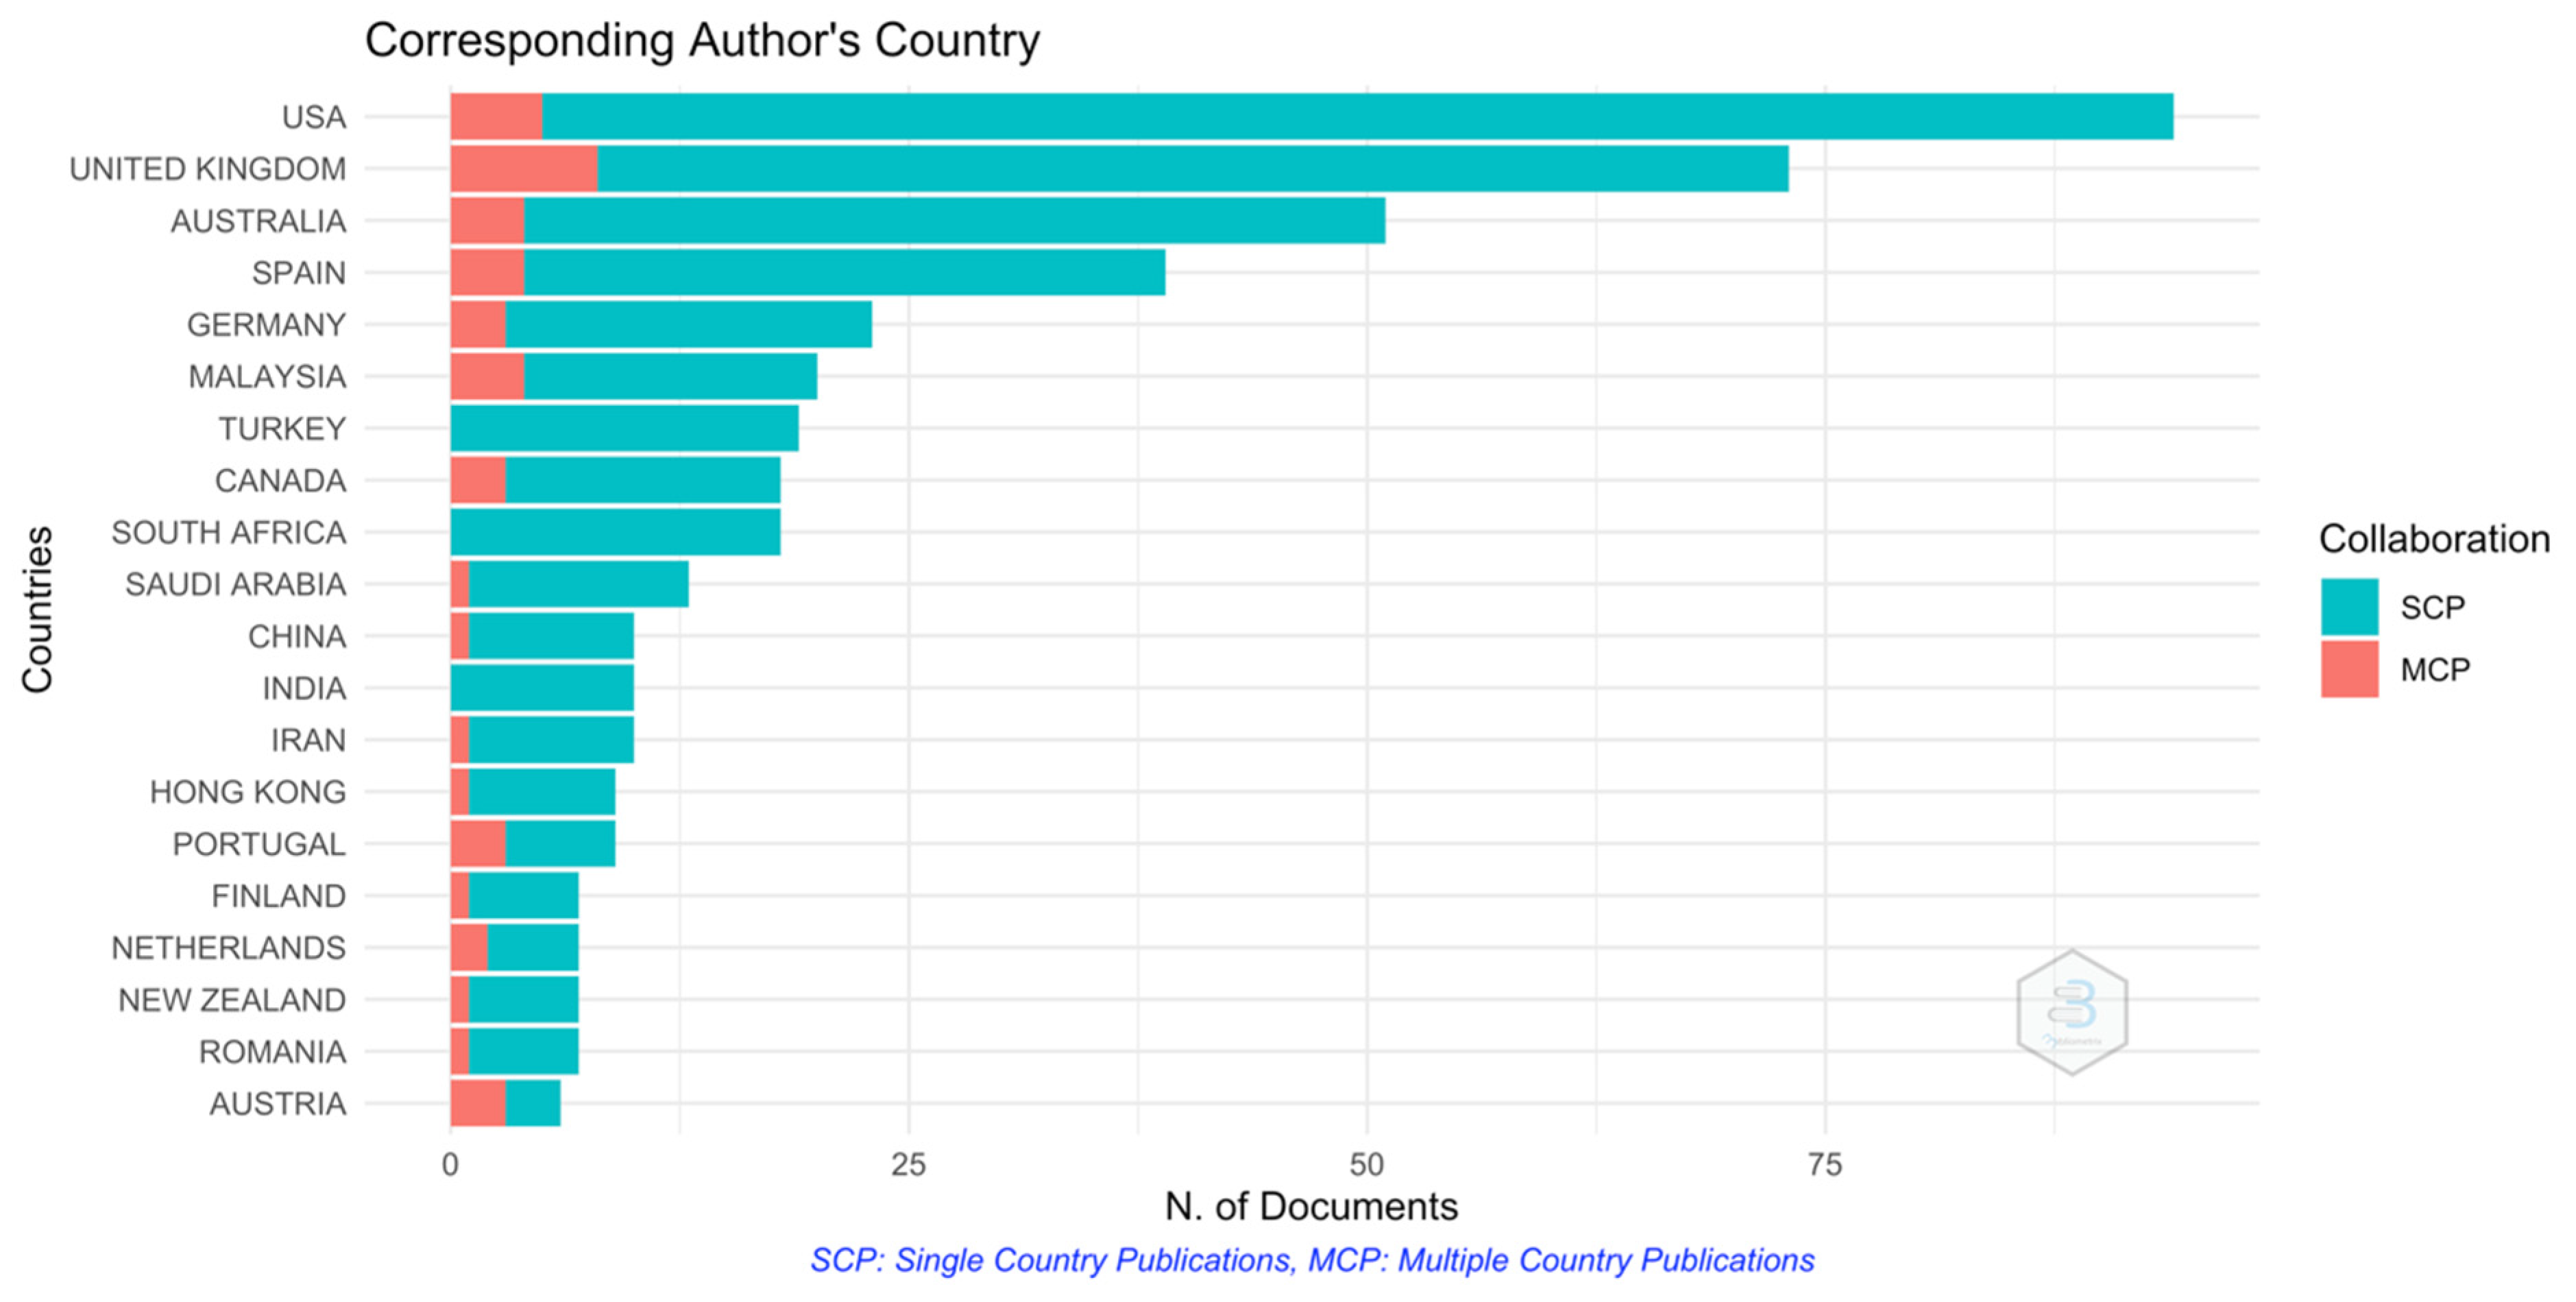
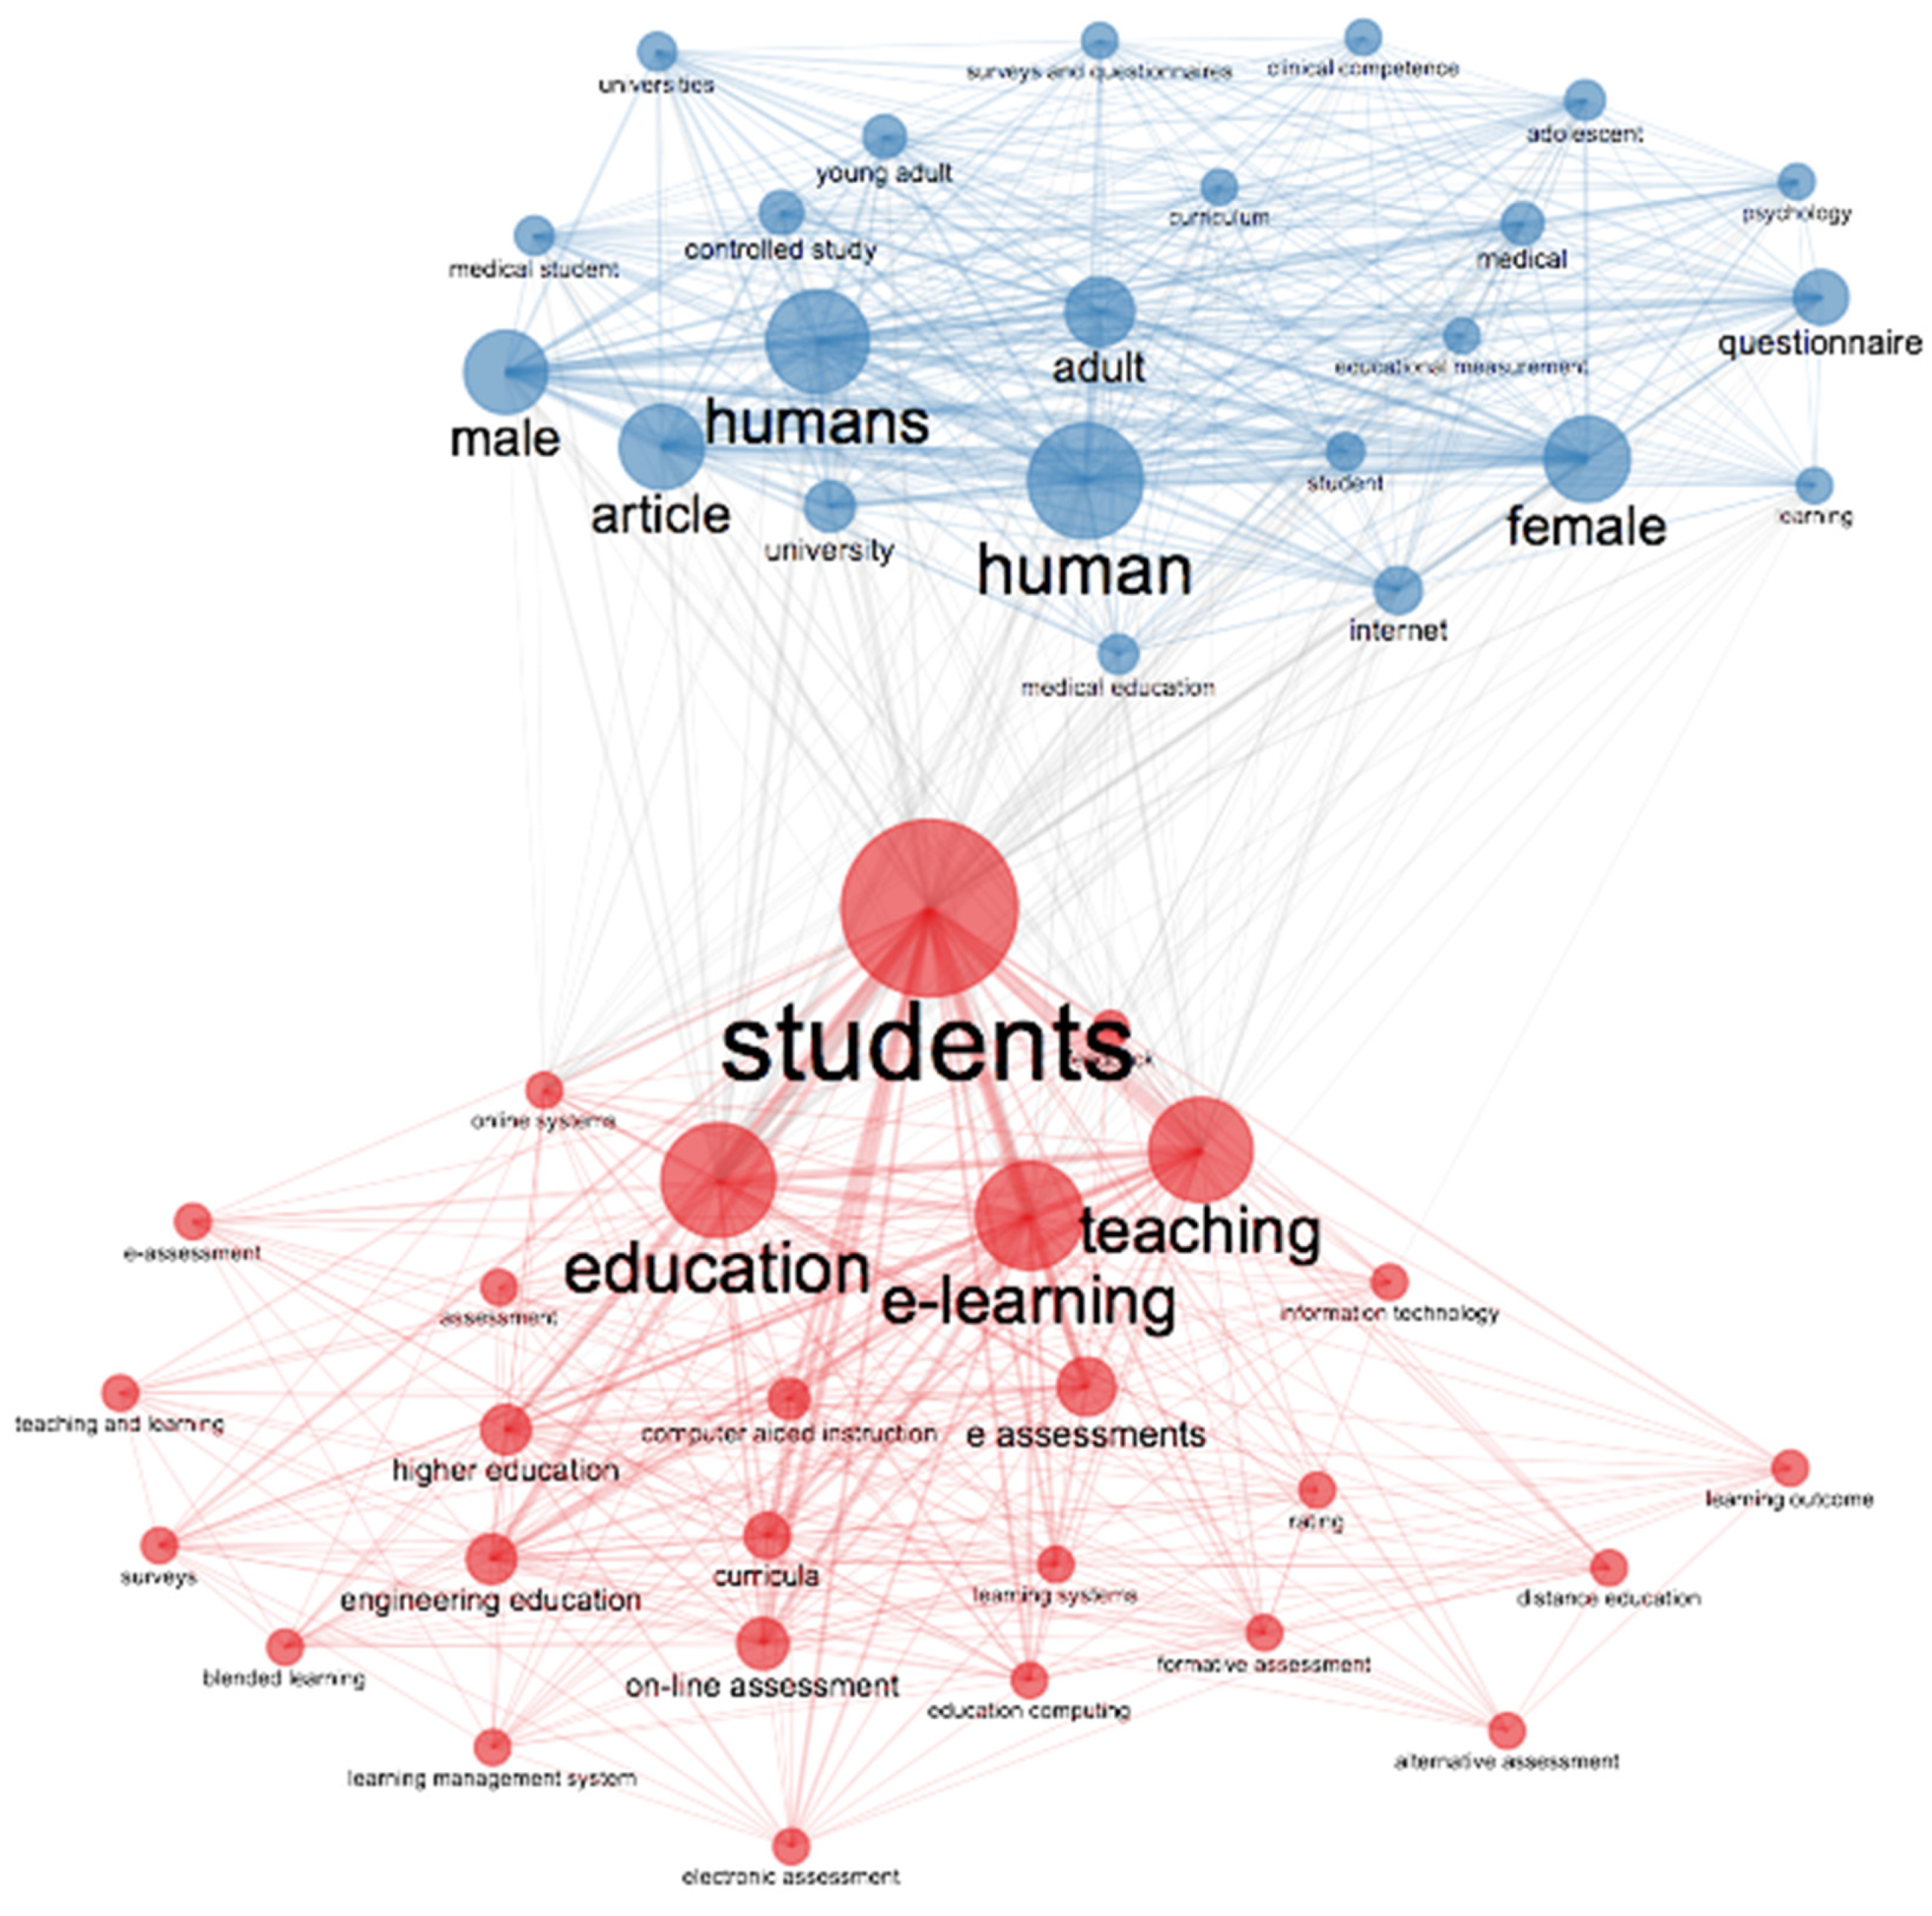
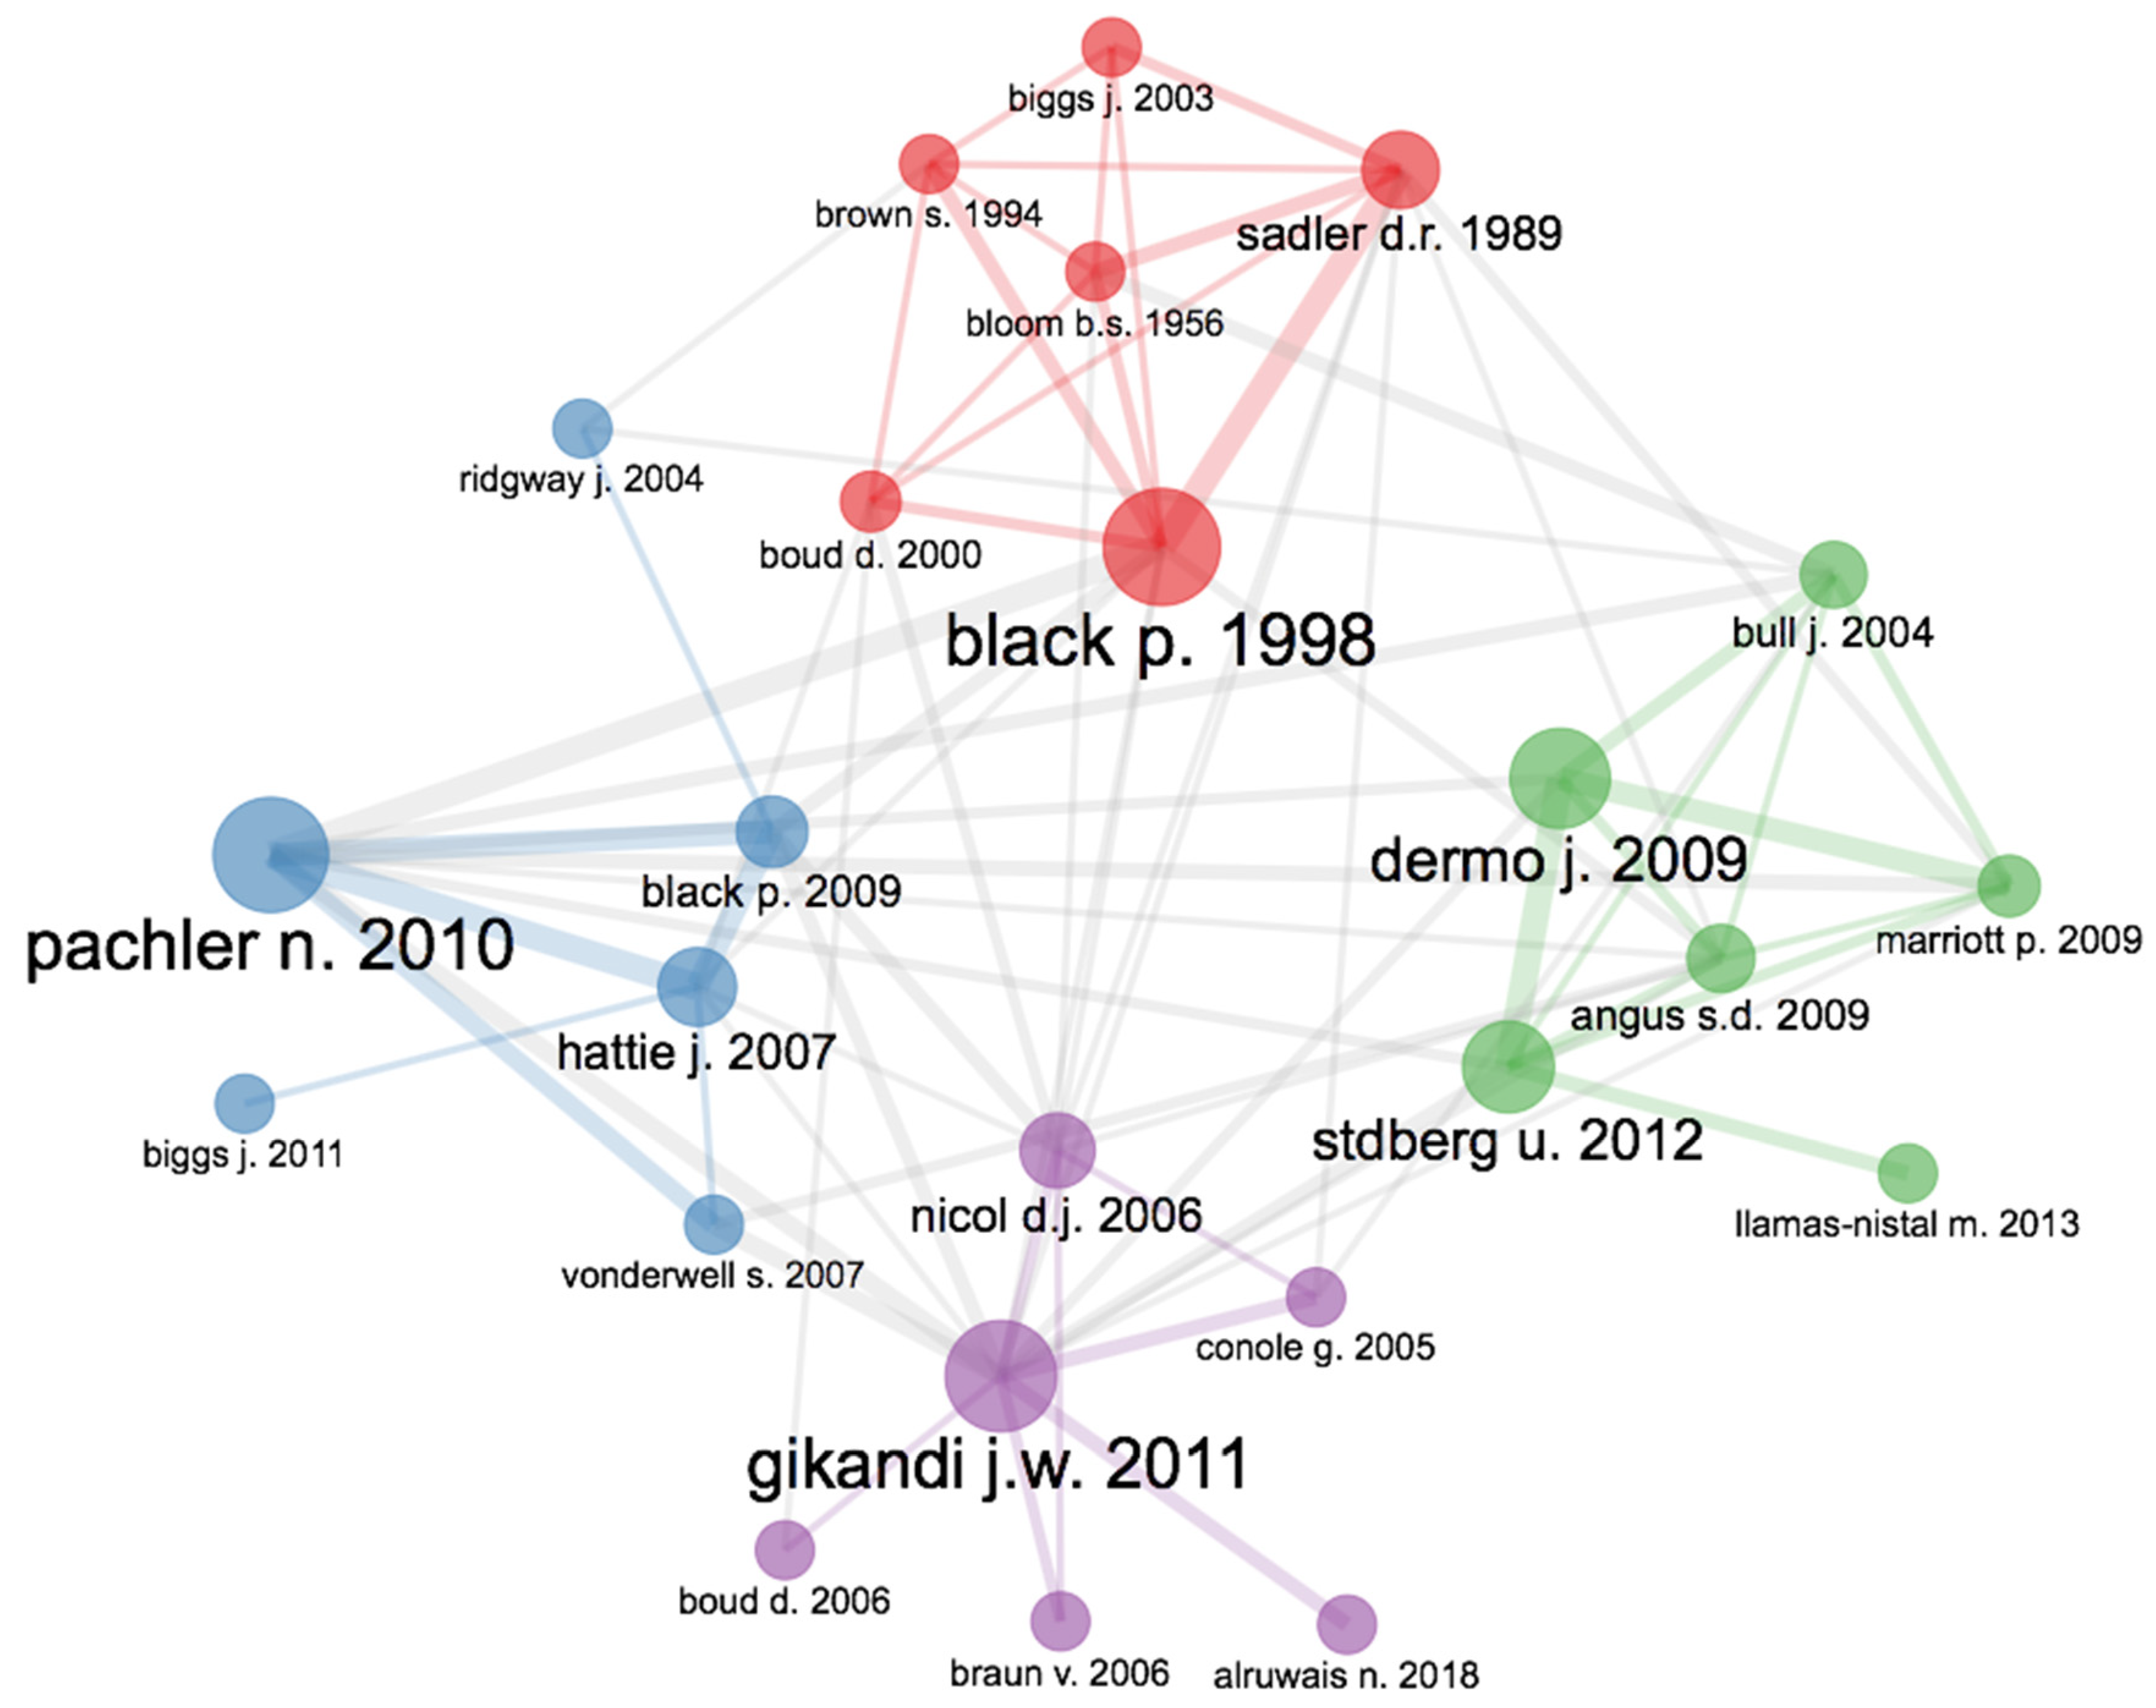
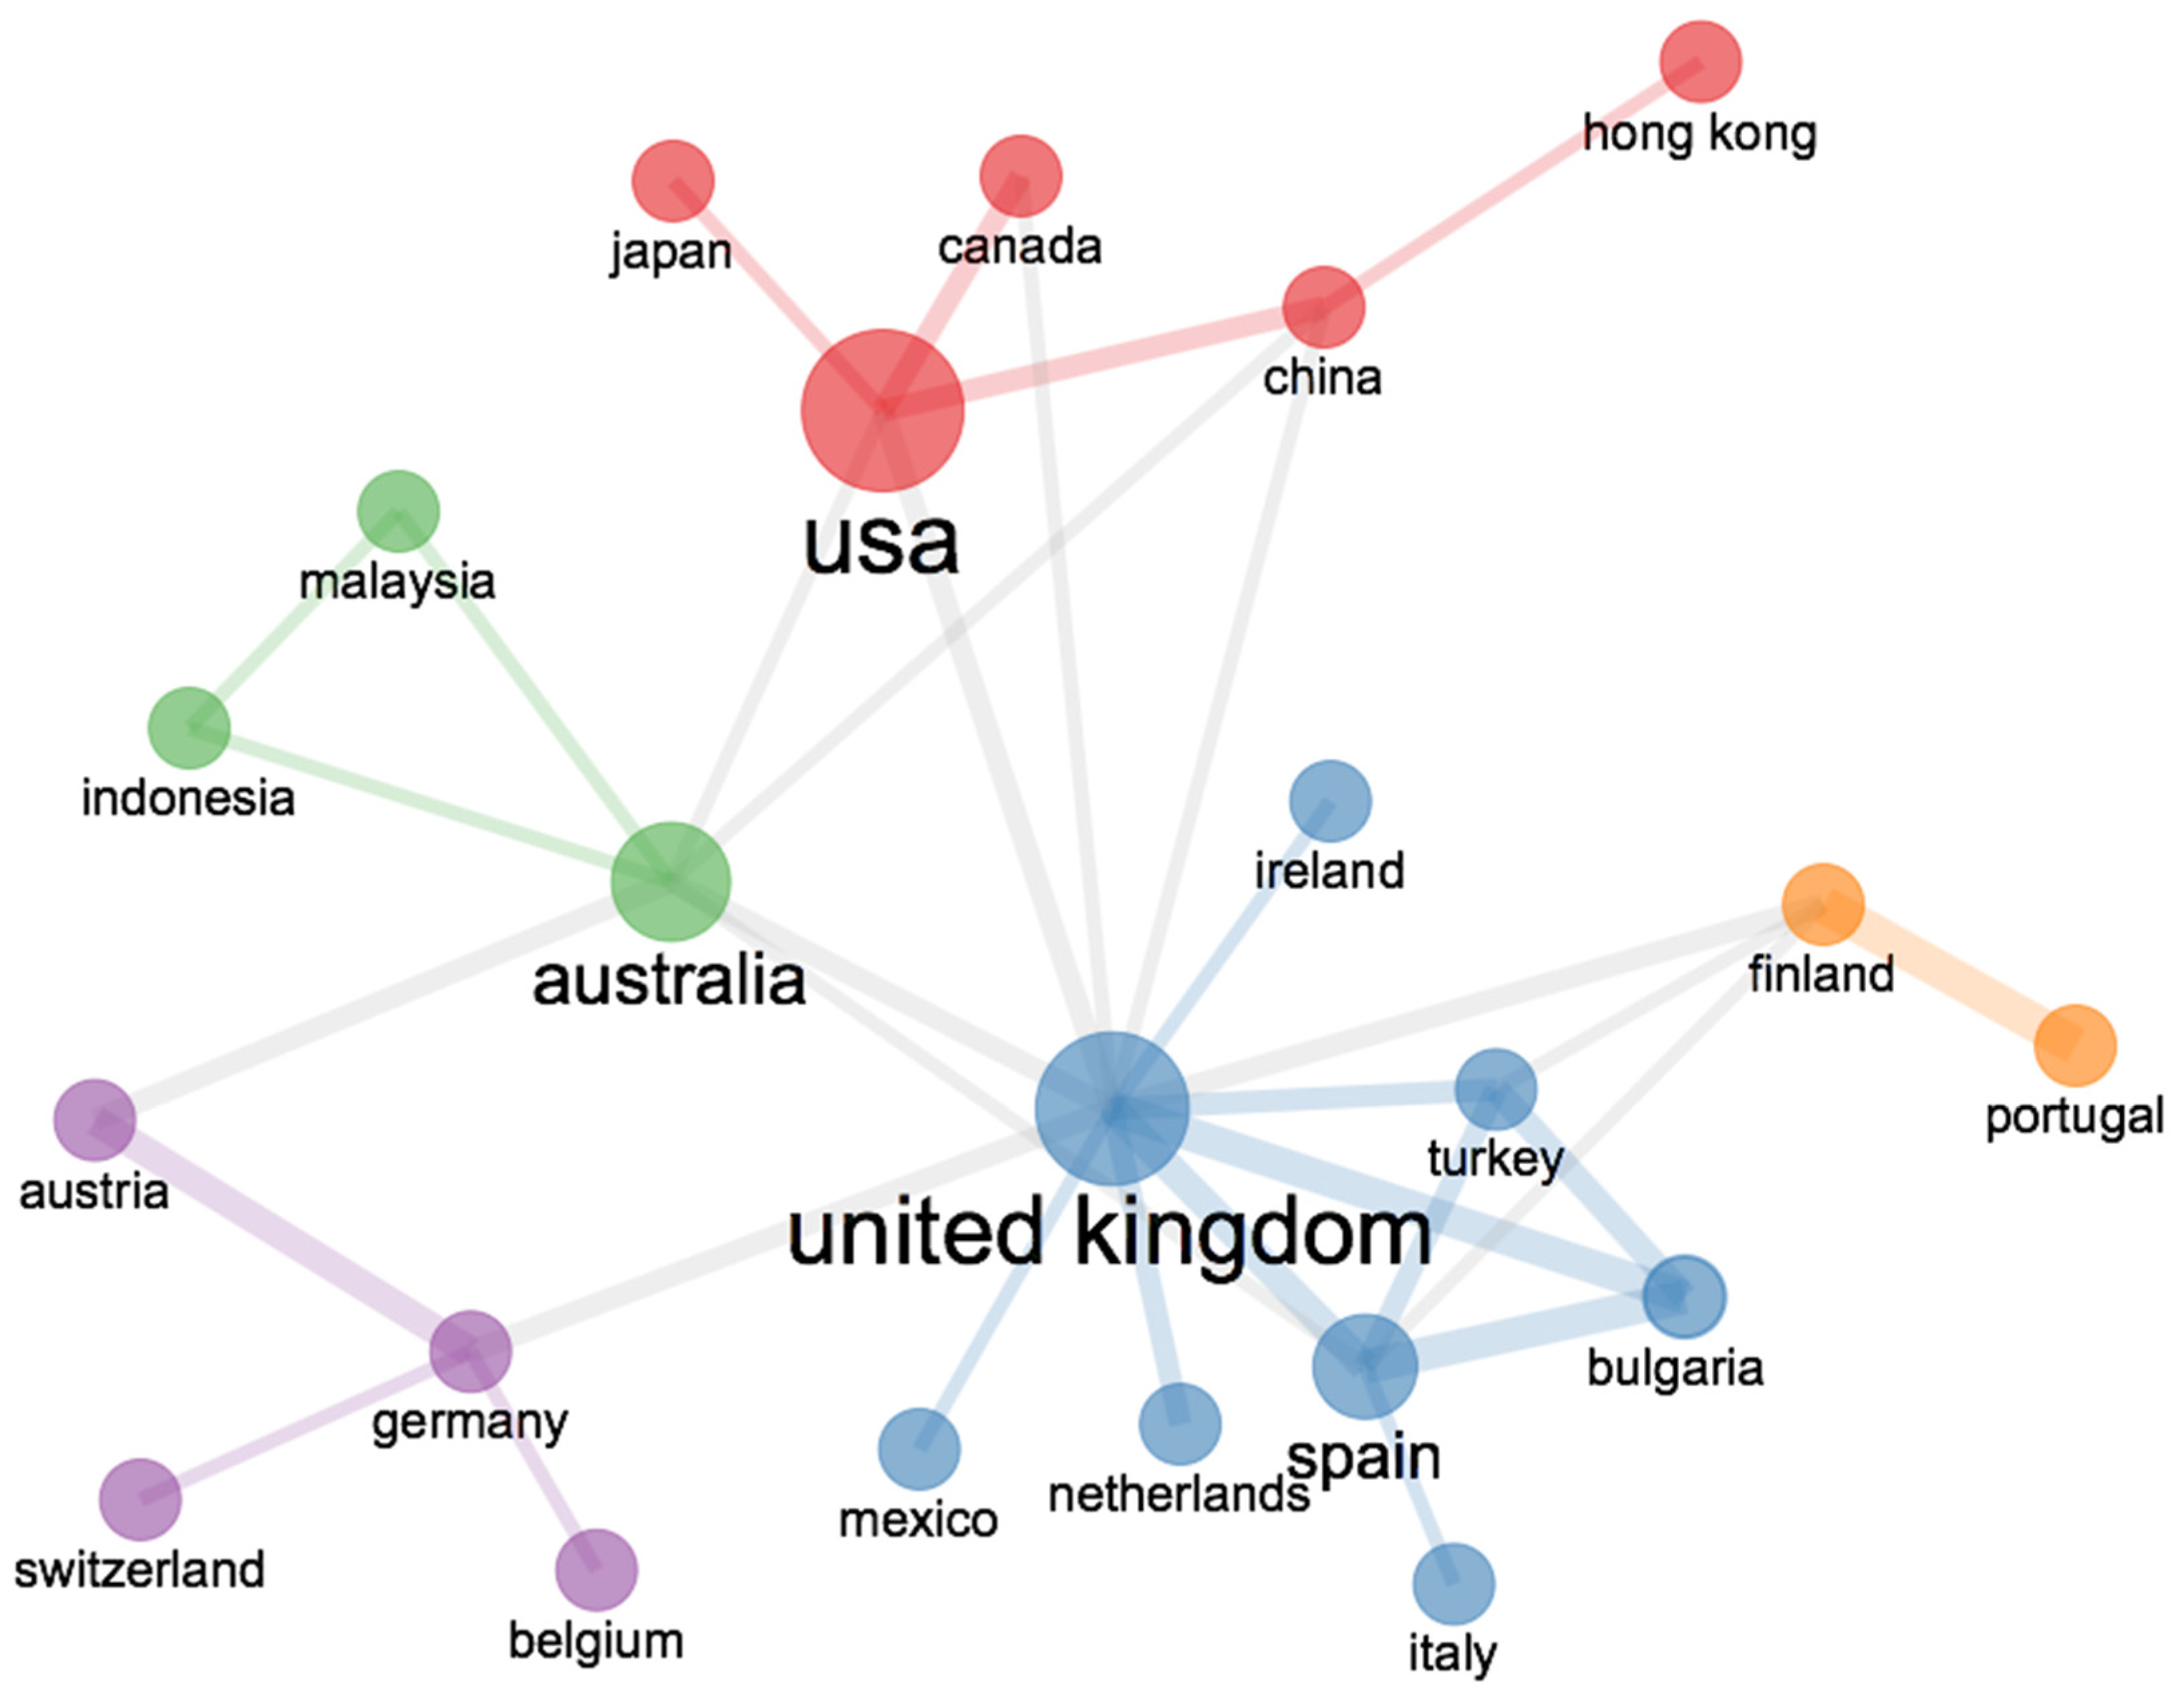
- What are co-occurrence, co-citation, and countries’ collaboration?
2. Method
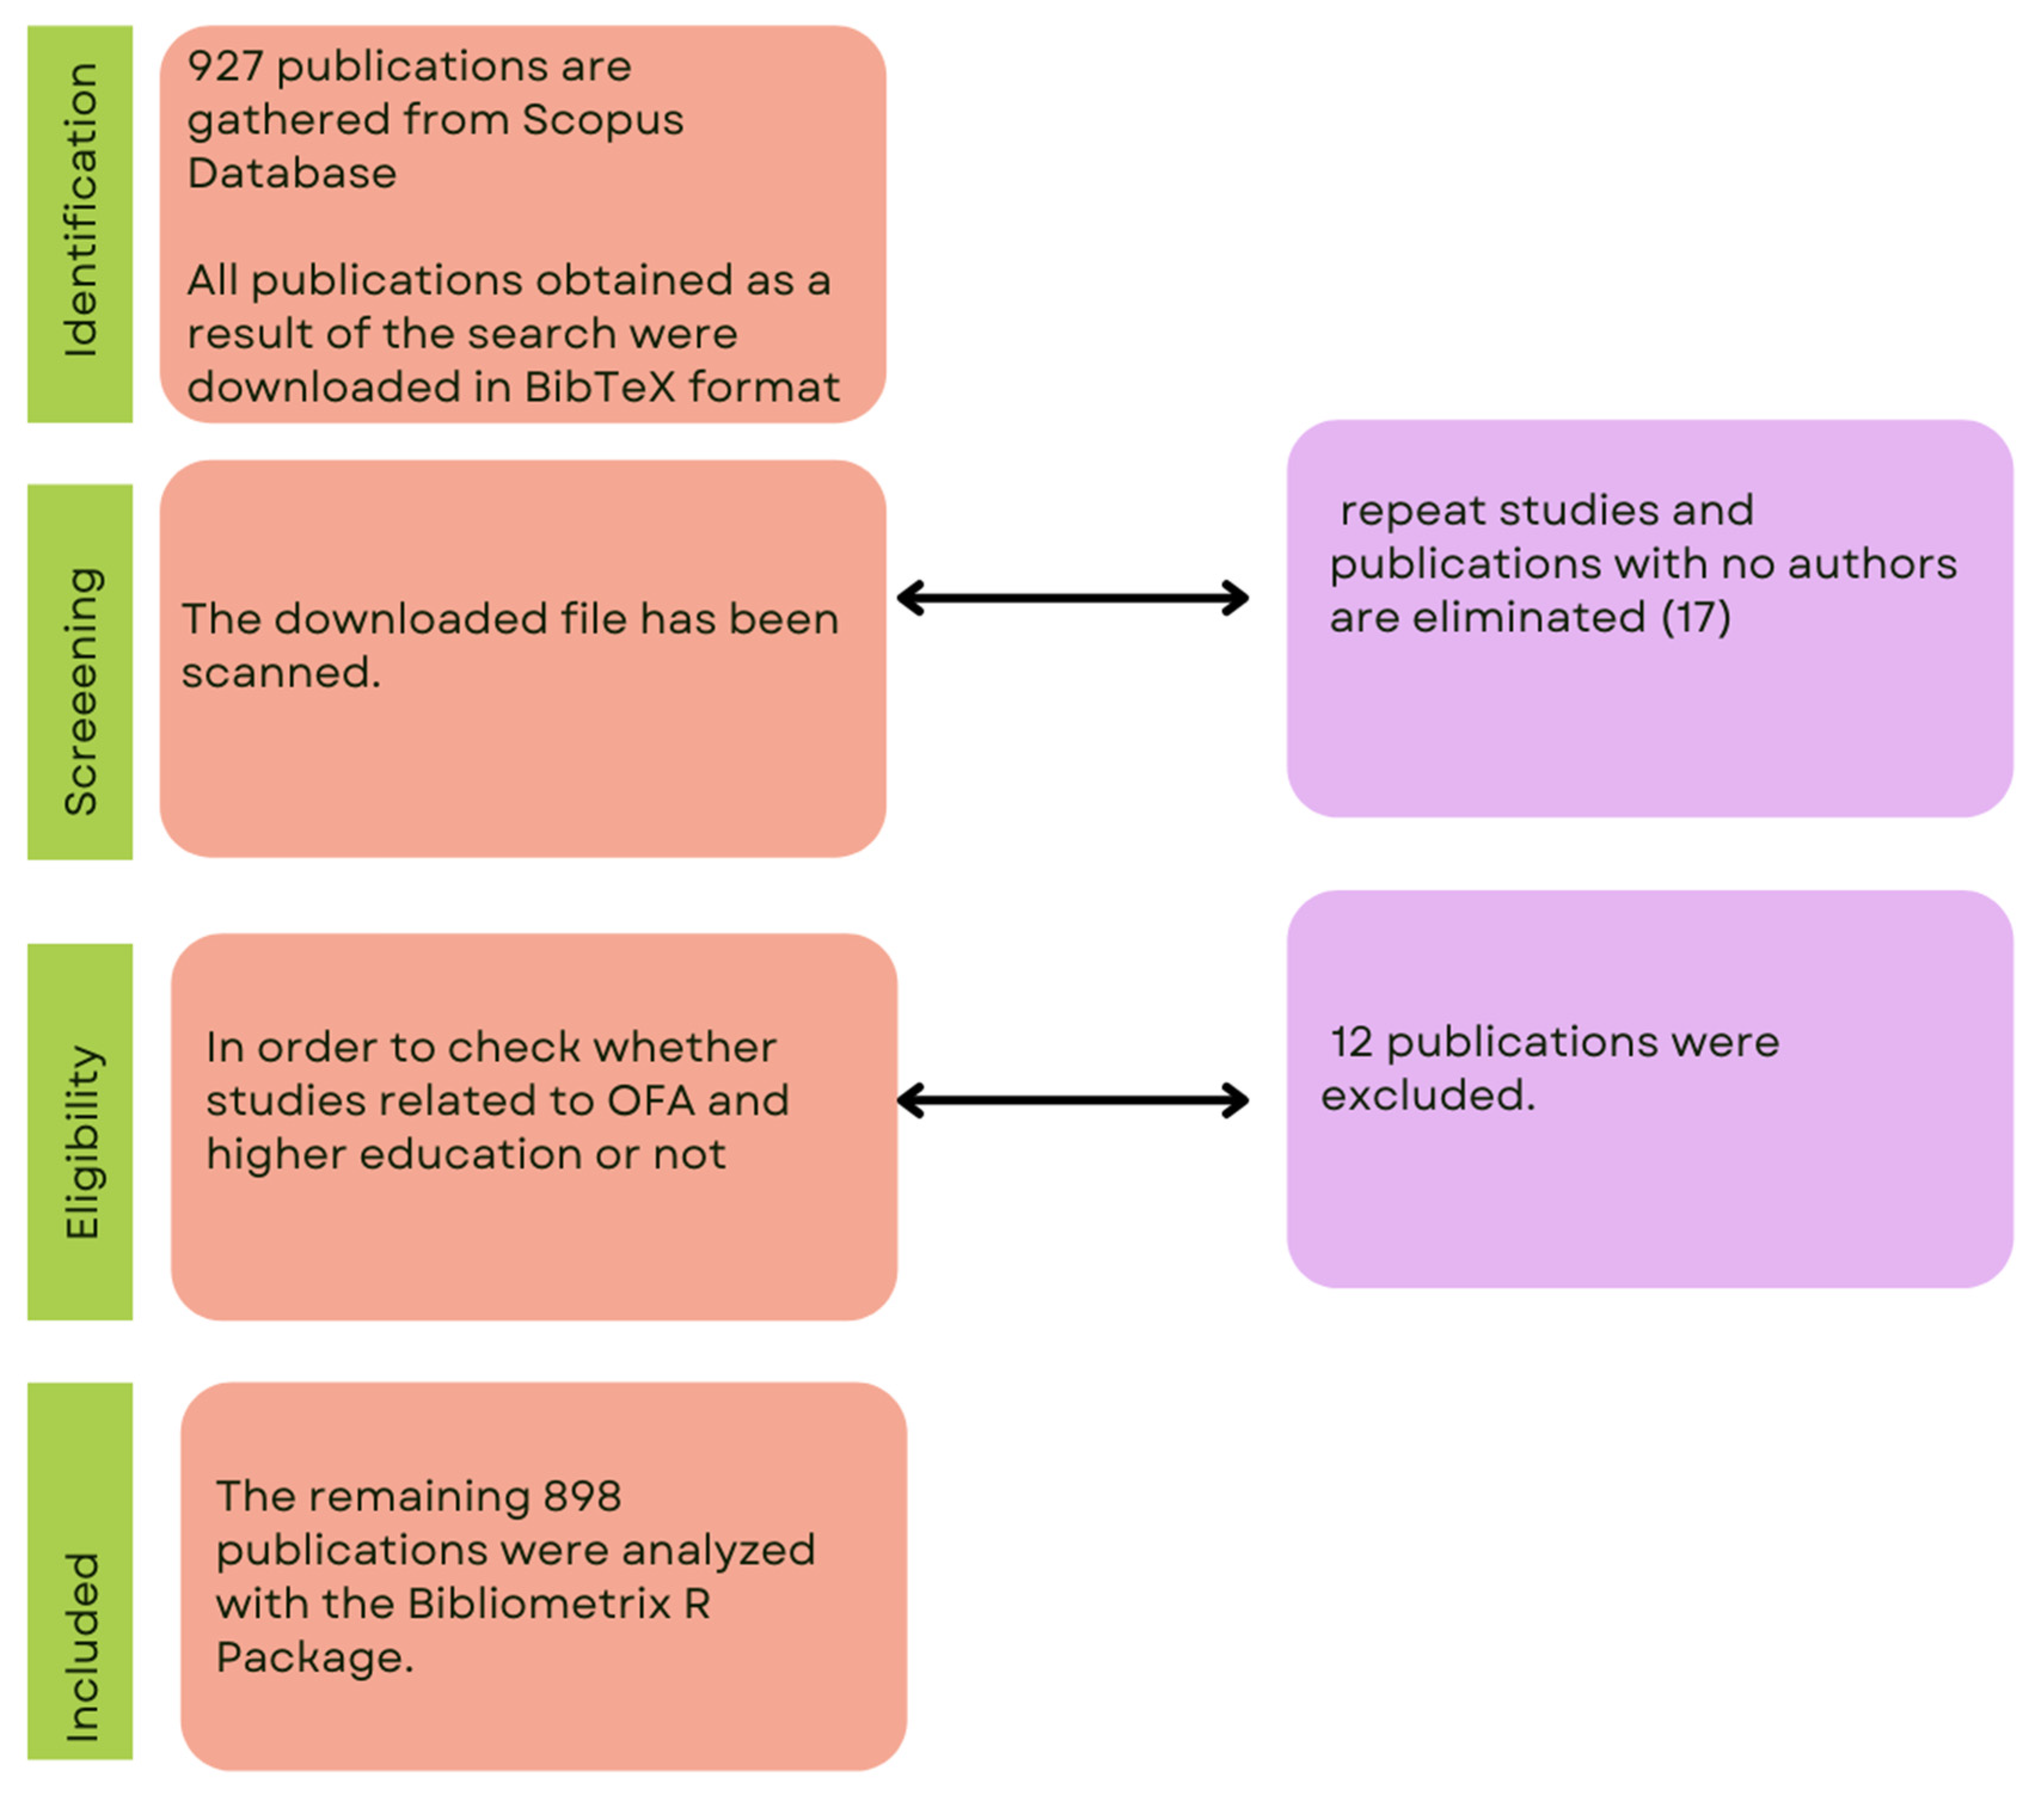
2.1. Data Sources
2.2. Data Analysis
3. Results and Discussion
4. Conclusions
Author Contributions
Funding
Institutional Review Board Statement
Informed Consent Statement
Data Availability Statement
Conflicts of Interest
References
- Joughin, G. Assessment, Learning and Judgement in Higher Education; Joughin, G., Ed.; Springer: Dordrecht, The Netherlands, 2009; ISBN 978-1-4020-8904-6. [Google Scholar]
- Angus, S.D.; Watson, J. Does regular online testing enhance student learning in the numerical sciences? Robust evidence from a large data set. Br. J. Educ. Technol. 2009, 40, 255–272. [Google Scholar] [CrossRef] [Green Version]
- Bransford, J.D.; Brown, A.L.; Cocking, R.R. How People Learn: Brain, Mind, Experience, and School, Expanded Edition; National Academy Press: Washington, DC, USA, 2000; ISBN 0-309-50145-8. [Google Scholar]
- Harlen, W.; James, M. Assessment and Learning: Differences and relationships between formative and summative assessment. Assess. Educ. Princ. Policy Pract. 1997, 4, 365–379. [Google Scholar] [CrossRef]
- Cong, X.; Zhang, Y.; Xu, H.; Liu, L.-M.; Zheng, M.; Xiang, R.-L.; Wang, J.-Y.; Jia, S.; Cai, J.-Y.; Liu, C.; et al. The effectiveness of formative assessment in pathophysiology education from students’ perspective: A questionnaire study. Adv. Physiol. Educ. 2020, 44, 726–733. [Google Scholar] [CrossRef] [PubMed]
- Vonderwell, S.; Liang, X.; Alderman, K. Asynchronous discussions and assessment in online learning. J. Res. Technol. Educ. 2007, 39, 309–328. [Google Scholar] [CrossRef] [Green Version]
- Na, S.J.; Ji, Y.G.; Lee, D.H. Application of Bloom’s taxonomy to formative assessment in real-time online classes in Korea. Korean J. Med. Educ. 2021, 33, 191–201. [Google Scholar] [CrossRef] [PubMed]
- Oyetoro, O.S. Assessment of Learning Paths for Maximizing Teachers’ Attitude and Efficacy in Implementing Inclusive Education in Ile-Ife, Southwestern Nigeria. Eur. J. Sustain. Dev. Res. 2019, 4. [Google Scholar] [CrossRef] [Green Version]
- Akiri, E.; Tor, H.M.; Dori, Y.J. Teaching and Assessment Methods: STEM Teachers’ Perceptions and Implementation. Eurasia J. Math. Sci. Technol. Educ. 2021, 17, em1969. [Google Scholar] [CrossRef]
- Hodgen, J.; Marshall, B. Assessment for learning in English and mathematics: A comparison. Curric. J. 2005, 16, 153–176. [Google Scholar] [CrossRef]
- Wiliam, D.; Lee, C.; Harrison, C.; Black, P. Teachers developing assessment for learning: Impact on student achievement. Assess. Educ. Princ. Policy Pract. 2004, 11, 49–65. [Google Scholar] [CrossRef]
- Antonova, K.; Tyrkheeva, N. Formative assessment of critical reading skills in higher education in russia in the context of emergency remote teaching. J. Teach. English Specif. Acad. Purp. 2021, 9, 137–148. [Google Scholar] [CrossRef]
- Kugurakova, V.V.; Golovanova, I.I.; Shaidullina, A.R.; Khairullina, E.R.; Orekhovskaya, N.A. Digital Solutions in Educators’ Training: Concept for Implementing a Virtual Reality Simulator. Eurasia J. Math. Sci. Technol. Educ. 2021, 17, em2008. [Google Scholar] [CrossRef]
- Pishchukhina, O.; Allen, A. Supporting learning in large classes: Online formative assessment and automated feedback. In Proceedings of the 2021 30th Annual Conference of the European Association for Education in Electrical and Information Engineering (EAEEIE), Prague, Czech Republic, 1–4 September 2021; pp. 1–3. [Google Scholar] [CrossRef]
- Baleni, G.Z. Online formative assessment in higher education: Its pros and cons. Electron. J. e-Learn. 2015, 13, 228–236. [Google Scholar]
- Purkayastha, S.; Surapaneni, A.K.; Maity, P.; Rajapuri, A.S.; Gichoya, J.W. Critical components of formative assessment in process-oriented guided inquiry learning for online labs. Electron. J. e-Learn. 2019, 17, 79–92. [Google Scholar] [CrossRef] [Green Version]
- Fuller, J.S.; Dawson, K.M. Student Response Systems for Formative Assessment: Literature-based Strategies and Findings from a Middle School Implementation. Contemp. Educ. Technol. 2020, 8, 370–389. [Google Scholar] [CrossRef]
- Stiggins, R.; Chappuis, S. Putting Testing in Perspective: It’s for Learning. Princ. Leadersh. 2005, 6, 1620. [Google Scholar]
- Wlodkowski, R.J.; Ginsberg, M.B. Enhancing Adult Motivation to Learn: A Comprehensive Guide for Teaching All Adults; John Wiley & Sons: Hoboken, NJ, USA, 2017; ISBN 1119077990. [Google Scholar]
- Shams, J.A.; Iqbal, M.Z. Development of Classroom Assessment Literacy Training Program for University Teachers in Punjab. Bull. Educ. Res. 2019, 41, 41–52. [Google Scholar]
- Caliskan, S.; Guney, Z.; Sakhieva, R.G.; Vasbieva, D.G.; Zaitseva, N.A. Teachers’ Views on the Availability of Web 2.0 Tools in Education. Int. J. Emerg. Technol. Learn. 2019, 14, 70. [Google Scholar] [CrossRef]
- Basilaia, G.; Kvavadze, D. Transition to Online Education in Schools during a SARS-CoV-2 Coronavirus (COVID-19) Pandemic in Georgia. Pedagog. Res. 2020, 5, 1–9. [Google Scholar] [CrossRef] [Green Version]
- Al-Karaki, J.N.; Ababneh, N.; Hamid, Y.; Gawanmeh, A. Evaluating the effectiveness of distance learning in higher education during covid-19 global crisis: Uae educators’ perspectives. Contemp. Educ. Technol. 2021, 13. [Google Scholar] [CrossRef]
- Clark, I. Formative Assessment: Assessment Is for Self-regulated Learning. Educ. Psychol. Rev. 2012, 24, 205–249. [Google Scholar] [CrossRef]
- Conole, G.; Warburton, B. A review of computer-assisted assessment. Alt-J 2005, 13, 17–31. [Google Scholar] [CrossRef]
- Moscinska, K.; Rutkowski, J. Effective computer-assisted assessment: Challenges and solutions. In Proceedings of the 2018 IEEE Global Engineering Education Conference (EDUCON), Santa Cruz de Tenerife, Spain, 17–20 April 2018; pp. 969–978. [Google Scholar]
- Nicol, D. E-assessment by design: Using multiple-choice tests to good effect. J. Furth. High. Educ. 2007, 31, 53–64. [Google Scholar] [CrossRef]
- McLaughlin, T.; Yan, Z. Diverse delivery methods and strong psychological benefits: A review of online formative assessment. J. Comput. Assist. Learn. 2017, 33, 562–574. [Google Scholar] [CrossRef]
- Zheng, C.; Su, Y.; Lian, J. Developing an Online Formative Assessment System for a Chinese EFL course. In Proceedings of the 22nd International Conference on Computers in Education, ICCE 2014, Nara, Japan, 30 November–4 December 2014; pp. 532–535. [Google Scholar]
- Pauline-Graf, D.; Mandel, S.E.; Allen, H.W.; Devnew, L.E. Assumption Validation Process for the Assessment of Technology-Enhanced Learning. Contemp. Educ. Technol. 2021, 13, ep316. [Google Scholar] [CrossRef]
- Pachler, N.; Daly, C.; Mor, Y.; Mellar, H.; Pachler, N.; Daly, C.; Mor, Y.; Mellar, H. Formative e-assessment: Practitioner cases. Comput. Educ. 2010, 54, 715–721. [Google Scholar] [CrossRef] [Green Version]
- Wang, T.H.; Wang, K.H.; Huang, S.C. Designing a Web-based assessment environment for improving pre-service teacher assessment literacy. Comput. Educ. 2008, 51, 448–462. [Google Scholar] [CrossRef]
- Gikandi, J.W.; Morrow, D.; Davis, N.E. Online formative assessment in higher education: A review of the literature. Comput. Educ. 2011, 57, 2333–2351. [Google Scholar] [CrossRef]
- Thanuskodi, S. Journal of Social Sciences: A Bibliometric Study. J. Soc. Sci. 2010, 24, 77–80. [Google Scholar] [CrossRef]
- Noyons, E. Bibliometric mapping of science in a policy context. Scientometrics 2001, 50, 83–98. [Google Scholar] [CrossRef]
- Gokhale, A.; Mulay, P.; Pramod, D.; Kulkarni, R. A Bibliometric Analysis of Digital Image Forensics. Sci. Technol. Libr. 2020, 39, 96–113. [Google Scholar] [CrossRef]
- McInnes, M.D.F.; Moher, D.; Thombs, B.D.; McGrath, T.A.; Bossuyt, P.M.; Clifford, T.; Cohen, J.F.; Deeks, J.J.; Gatsonis, C.; Hooft, L.; et al. Preferred Reporting Items for a Systematic Review and Meta-analysis of Diagnostic Test Accuracy Studies The PRISMA-DTA Statement. JAMA J. Am. Med. Assoc. 2018, 319, 388–396. [Google Scholar] [CrossRef] [PubMed]
- Why Choose Scopus—Scopus Benefits|Elsevier Solutions. Available online: https://www.elsevier.com/solutions/scopus/why-choose-scopus (accessed on 31 January 2022).
- Aria, M.; Cuccurullo, C. Bibliometrix: An R-tool for comprehensive science mapping analysis. J. Informetr. 2017, 11, 959–975. [Google Scholar] [CrossRef]
- Christensen, H.; Griffiths, K.M.; Korten, A. Web-based cognitive behavior therapy: Analysis of site usage and changes in depression and anxiety scores. J. Med. Internet Res. 2002, 4, 29–40. [Google Scholar] [CrossRef] [PubMed]
- Tsai, M.J.; Hou, H.T.; Lai, M.L.; Liu, W.Y.; Yang, F.Y. Visual attention for solving multiple-choice science problem: An eye-tracking analysis. Comput. Educ. 2012, 58, 375–385. [Google Scholar] [CrossRef]
- Ivanitskaya, L.; O’Boyle, I.; Casey, A.M.; Ivanitskaya, L. Health information literacy and competencies of information age students: Results from the interactive online Research Readiness Self-Assessment (RRSA). J. Med. Internet Res. 2006, 8, e6. [Google Scholar] [CrossRef] [PubMed]
- Vallejo, M.A.; Jordán, C.M.; Díaz, M.I.; Comeche, M.I.; Ortega, J. Psychological assessment via the internet: A reliability and validity study of online (vs paper-and-pencil) versions of the General Health Questionnaire-28 (GHQ-28) and the Symptoms Check-List-90-Revised (SCL-90-R). J. Med. Internet Res. 2007, 9, 1–10. [Google Scholar] [CrossRef]
- Condon, D.M.; Revelle, W. The international cognitive ability resource: Development and initial validation of a public-domain measure. Intelligence 2014, 43, 52–64. [Google Scholar] [CrossRef]
- Kandiah, J.; Yake, M.; Jones, J.; Meyer, M. Stress influences appetite and comfort food preferences in college women. Nutr. Res. 2006, 26, 118–123. [Google Scholar] [CrossRef]
- Neighbors, C.; Geisner, I.M.; Lee, C.M. Perceived Marijuana Norms and Social Expectancies Among Entering College Student Marijuana Users. Psychol. Addict. Behav. 2008, 22, 433–438. [Google Scholar] [CrossRef]
- Dermo, J. e-Assessment and the student learning experience: A survey of student perceptions of e-assessment. Br. J. Educ. Technol. 2009, 40, 203–214. [Google Scholar] [CrossRef]
- Higgins, C.A.; Gray, G.; Symeonidis, P.; Tsintsifas, A. Automated Assessment and Experiences of Teaching Programming. ACM J. Educ. Resour. Comput. 2005, 5, 5-es. [Google Scholar] [CrossRef]
- Howley, L.D.; Wilson, W.G. Direct Observation of Students during Clerkship Rotations: A Multiyear Descriptive Study. Acad. Med. 2004, 79, 276–280. [Google Scholar] [CrossRef] [Green Version]
- Reeves, T.C. Alternative assessment approaches for online learning environments in higher education. J. Educ. Comput. Res. 2000, 23, 101–111. [Google Scholar] [CrossRef]
- Frank, M.; Barzilia, A. Integrating alternative assessment in a Project-Based Learning course for pre-service science and technology teachers. Assess. Eval. High. Educ. 2004, 29, 41–61. [Google Scholar] [CrossRef]
- Dvorak, R.D.; Lamis, D.A.; Malone, P.S. Alcohol use, depressive symptoms, and impulsivity as risk factors for suicide proneness among college students. J. Affect. Disord. 2013, 149, 326–334. [Google Scholar] [CrossRef] [PubMed] [Green Version]
- Stödberg, U. A research review of e-assessment. Assess. Eval. High. Educ. 2012, 37, 591–604. [Google Scholar] [CrossRef]
- Draper, S.W. Catalytic assessment: Understanding how MCQs and EVS can foster deep learning. Br. J. Educ. Technol. 2009, 40, 285–293. [Google Scholar] [CrossRef]
- Llamas-Nistal, M.; Fernández-Iglesias, M.J.; González-Tato, J.; Mikic-Fonte, F.A. Blended e-assessment: Migrating classical exams to the digital world. Comput. Educ. 2013, 62, 72–87. [Google Scholar] [CrossRef]
- García-Peñalvo, F.J.; Corell, A.; Abella-García, V.; Grande-de-Prado, M. Recommendations for Mandatory Online Assessment in Higher Education During the COVID-19 Pandemic. In Radical Solutions for Education in a Crisis Context; Springer: Singapore, 2021; pp. 85–98. ISBN 978-981-15-7868-7. [Google Scholar]
- Agarwal, A.; Durairajanayagam, D.; Tatagari, S.; Esteves, S.C.; Harlev, A.; Henkel, R.; Roychoudhury, S.; Homa, S.; Puchalt, N.G.; Ramasamy, R.; et al. Bibliometrics: Tracking research impact by selecting the appropriate metrics. Asian J. Androl. 2016, 18, 296–309. [Google Scholar] [CrossRef] [PubMed] [Green Version]
- Cuschieri, S. WASP (Write a Scientific Paper): Understanding research metrics. Early Hum. Dev. 2018, 118, 67–71. [Google Scholar] [CrossRef]
- Egghe, L. Theory and practise of the g-index. Scientometrics 2006, 69, 131–152. [Google Scholar] [CrossRef]
- Ghosh, S.; Das, D.; Chakraborty, T. Determining Sentiment in Citation Text and Analyzing Its Impact on the Proposed Ranking Index. Lect. Notes Comput. Sci. 2018, 9624, 292–306. [Google Scholar]
- Kessler, M.M. Bibliographic Coupling between Scientific Papers’ Received. J. Assoc. Inf. Sci. Technol. 1963, 14, 10–25. [Google Scholar]
- Kretschmer, H.; Kretschmer, T. Application of a New Centrality Measure for Social Network Analysis to Bibliometric and Webometric Data. In Proceedings of the 2006 1st International Conference on Digital Information Management, Bangalore, India, 6–8 December 2006; pp. 199–204. [Google Scholar]
- Callon, M.; Courtial, J.P.; Laville, F. Co-word analysis as a tool for describing the network of interactions between basic and technological research: The case of polymer chemsitry. Scientometrics 1991, 22, 155–205. [Google Scholar] [CrossRef]
- Zammarchi, G.; Conversano, C. Application of Eye Tracking Technology in Medicine: A Bibliometric Analysis. Vision 2021, 5, 56. [Google Scholar] [CrossRef] [PubMed]
- Black, P.; Wiliam, D. Assessment and classroom learning. Assess. Educ. Princ. Policy Pract. 1998, 5, 7–74. [Google Scholar] [CrossRef]
- Sadler, D.R. Formative assessment and the design of instructional systems. Instr. Sci. 1989, 18, 119–144. [Google Scholar] [CrossRef]
- Hattie, J.; Timperley, H. The power of feedback. Rev. Educ. Res. 2007, 77, 81–112. [Google Scholar] [CrossRef]
- Nicol, D.; MacFarlane-Dick, D. Formative assessment and selfregulated learning: A model and seven principles of good feedback practice. Stud. High. Educ. 2006, 31, 199–218. [Google Scholar] [CrossRef]


| Description | Results |
|---|---|
| Main Information about Data | |
| Timespan | 1998:2021 |
| Sources (Journals, Books, etc.) | 556 |
| Documents | 898 |
| Average years from publication | 7.22 |
| Average citations per documents | 8.739 |
| Average citations per year per doc | 1.021 |
| References | 27,114 |
| Document Types | |
| Article | 504 |
| Conference paper | 303 |
| Book chapter | 56 |
| Review | 21 |
| Book | 9 |
| Note | 3 |
| Erratum | 1 |
| Editorial | 1 |
| Document Contents | |
| Keywords Plus (ID) | 3029 |
| Author’s Keywords (DE) | 2049 |
| Authors | |
| Authors | 2351 |
| Author Appearances | 2671 |
| Authors of single-authored documents | 168 |
| Authors of multi-authored documents | 2183 |
| Authors Collaboration | |
| Single-authored documents | 174 |
| Documents per Author | 0.382 |
| Authors per Document | 2.62 |
| Co-Authors per Documents | 2.97 |
| Collaboration Index | 3.02 |
| Sources | Articles |
|---|---|
| Assessment & Evaluation in Higher Education | 649 |
| Computers & Education | 543 |
| British Journal of Educational Technology | 245 |
| Studies in Higher Education | 193 |
| Higher Education | 119 |
| Computers in Human Behavior | 100 |
| Review of Educational Research | 97 |
| Comput Educ | 89 |
| Journal of Computer Assisted Learning | 83 |
| Studies in Educational Evaluation | 79 |
| The Internet and Higher Education | 79 |
| Med Teach | 78 |
| Teaching in Higher Education | 70 |
| Language Testing | 65 |
| Assessment in Education: Principles | 63 |
| Australasian Journal of Educational Technology | 60 |
| Educational Technology Research and Development | 57 |
| Journal of Educational Psychology | 57 |
| Educational Researcher | 55 |
| Assessment in Education | 53 |
| Paper | DOI | Total Citations | TC Rank | TC per Year | TC per Year Rank | Normalized TC | Normalized TC Rank |
|---|---|---|---|---|---|---|---|
| Gikandi et al. [33] | 10.1016/j.compedu.2011.06.004 | 426 | 1 | 35.5 | 1 | 24.9 | 2 |
| Christensen et al. [40] | 10.2196/jmir.4.1.e3 | 197 | 2 | 9.4 | 12 | 3.8 | 26 |
| Nicol [27] | 10.1080/03098770601167922 | 184 | 3 | 11.5 | 5 | 5.4 | 21 |
| Tsai et al. [41] | 10.1016/j.compedu.2011.07.012 | 167 | 4 | 15.2 | 3 | 14.3 | 3 |
| Ivanitskaya et al. [42] | 10.2196/jmir.8.2.e6 | 163 | 5 | 9.59 | 10 | 6.7 | 18 |
| Vallejo et al. [43] | 10.2196/jmir.9.1.e2 | 146 | 6 | 9.1 | 13 | 4.3 | 25 |
| Condon and William [44] | 10.1016/j.intell.2014.01.004 | 130 | 7 | 14.4 | 4 | 12.9 | 5 |
| Vonderwell et al. [6] | 10.1080/15391523.2007.10782485 | 125 | 8 | 7.8 | 18 | 3.7 | 27 |
| Kandiah et al. [45] | 10.1016/j.nutres.2005.11.010 | 124 | 9 | 7.3 | 20 | 5.1 | 22 |
| Neighbors et al. [46] | 10.1037/0893-164X.22.3.433 | 118 | 10 | 7.8 | 16 | 9.1 | 11 |
| Dermo [47] | 10.1111/j.1467-8535.2008.00915.x | 110 | 11 | 7.9 | 17 | 6.6 | 19 |
| Higgins et al. [48] | 10.1145/1163405.1163410 | 107 | 12 | 5.9 | 24 | 9.3 | 9 |
| Howley et al. [49] | 10.1097/00001888-200403000-00017 | 100 | 13 | 5.2 | 27 | 3.4 | 29 |
| Reeves [50] | 10.2190/GYMQ-78FA-WMTX-J06C | 94 | 14 | 4.1 | 30 | 3.5 | 28 |
| Frank and Barzilia [51] | 10.1080/0260293042000160401 | 91 | 15 | 4.8 | 28 | 3.1 | 30 |
| Dvorak et al. [52] | 10.1016/j.jad.2013.01.046 | 82 | 16 | 8.2 | 14 | 8.4 | 12 |
| Angus and Watson [2] | 10.1111/j.1467-8535.2008.00916.x | 78 | 17 | 5.6 | 25 | 4.7 | 23 |
| Stödberg [53] | 10.1080/02602938.2011.557496 | 76 | 18 | 6.9 | 21 | 6.5 | 20 |
| Draper [54] | 10.1111/j.1467-8535.2008.00920.x | 75 | 19 | 5.4 | 26 | 4.5 | 24 |
| Llamas-Nistal et al. [55] | 10.1016/j.compedu.2012.10.021 | 69 | 20 | 6.9 | 22 | 7.1 | 16 |
| Garcia-Penalvo et al. [56] | 10.1007/978-981-15-7869-4_6 | 40 | 23 | 20 | 2 | 27.8 | 1 |
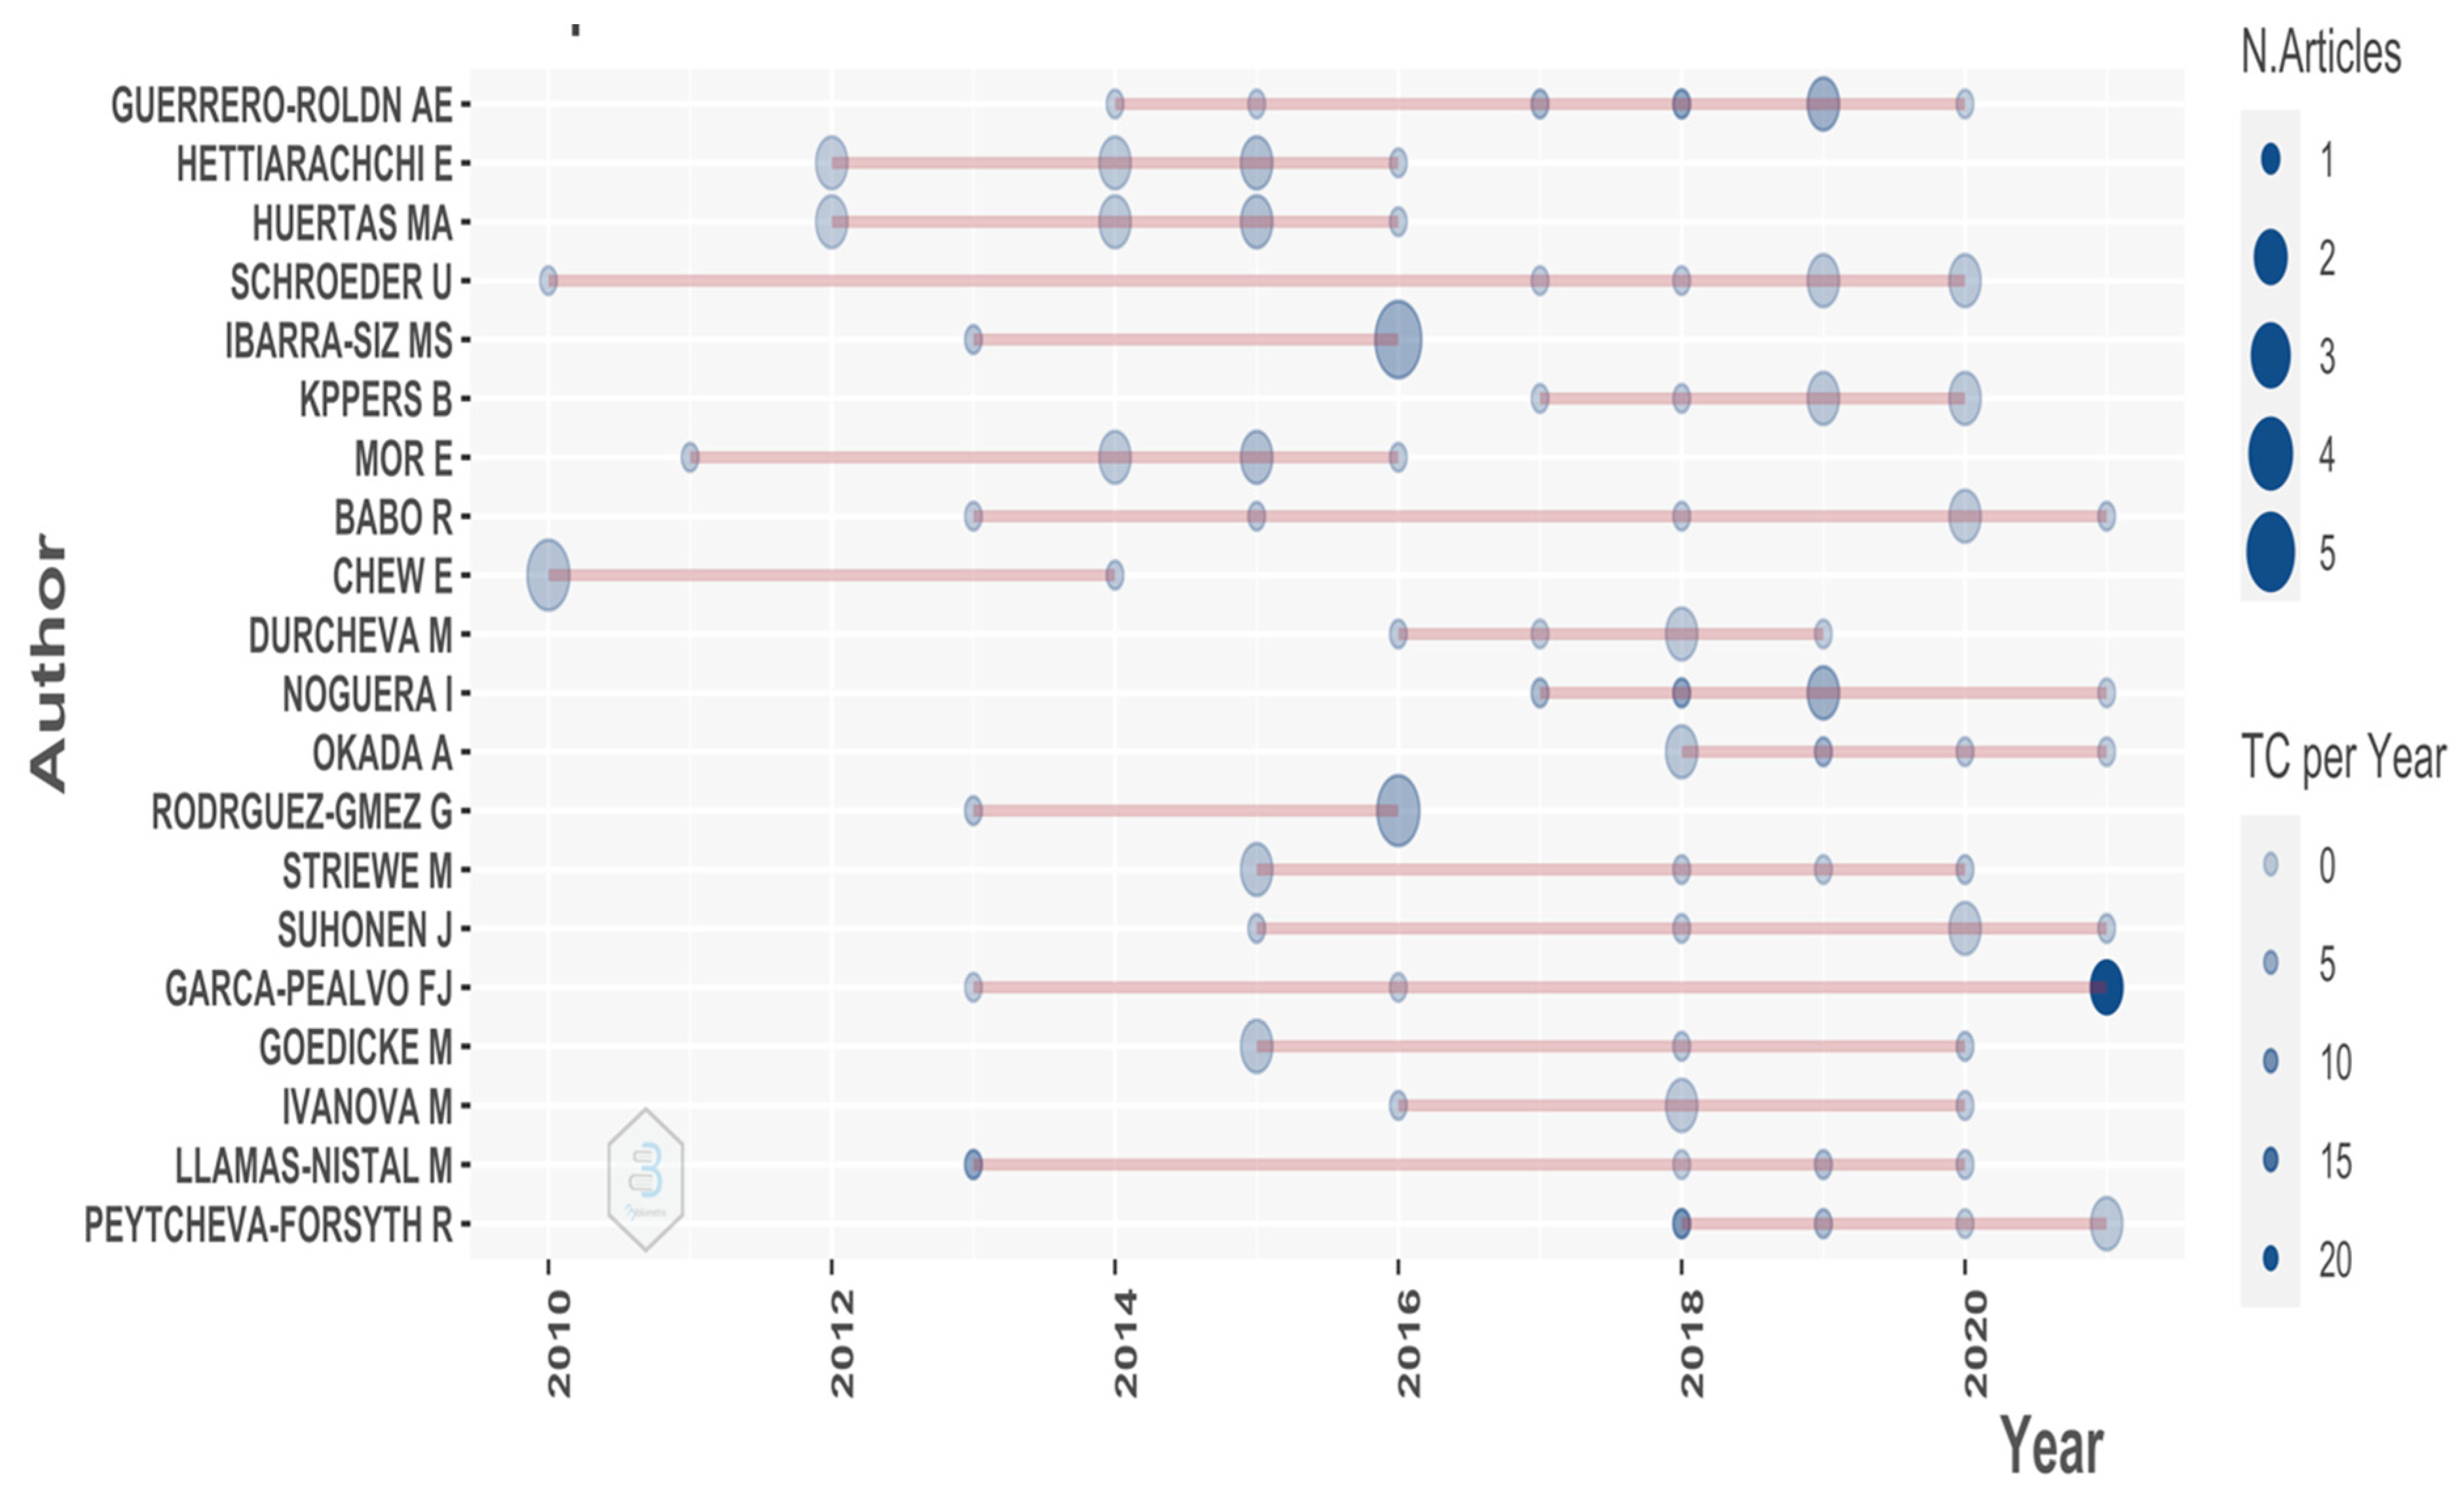
| Authors | h Index | h Rank | g Index | g Rank | m Index | m Rank | TC | TC Rank | NP | PY Start |
|---|---|---|---|---|---|---|---|---|---|---|
| Gikandi Jw | 2 | 17 | 2 | 22 | 0.167 | 42 | 432 | 1 | 2 | 2011 |
| Davis Ne | 1 | 36 | 1 | 36 | 0.083 | 53 | 426 | 2 | 1 | 2011 |
| Morrow D | 1 | 37 | 1 | 37 | 0.083 | 54 | 426 | 3 | 1 | 2011 |
| Velan Gm | 4 | 1 | 4 | 8 | 0.27 | 34 | 72 | 23 | 4 | 2008 |
| Ibarra-Siz Ms | 4 | 2 | 6 | 2 | 0.40 | 22 | 46 | 31 | 6 | 2013 |
| Guerrero-Roldn Ae | 3 | 3 | 6 | 1 | 0.33 | 28 | 75 | 22 | 6 | 2014 |
| Rodrguez-Gmez G | 3 | 7 | 5 | 3 | 0.30 | 29 | 42 | 32 | 5 | 2013 |
| Garca-Pealvo Fj | 2 | 25 | 2 | 29 | 1 | 1 | 42 | 33 | 2 | 2021 |
| Al Abdulmonem W | 2 | 22 | 2 | 26 | 0.667 | 2 | 57 | 28 | 2 | 2020 |
| El Sadik A | 2 | 23 | 2 | 27 | 0.667 | 3 | 57 | 29 | 2 | 2020 |
Publisher’s Note: MDPI stays neutral with regard to jurisdictional claims in published maps and institutional affiliations. |
© 2022 by the authors. Licensee MDPI, Basel, Switzerland. This article is an open access article distributed under the terms and conditions of the Creative Commons Attribution (CC BY) license (https://creativecommons.org/licenses/by/4.0/).
Share and Cite
Sudakova, N.E.; Savina, T.N.; Masalimova, A.R.; Mikhaylovsky, M.N.; Karandeeva, L.G.; Zhdanov, S.P. Online Formative Assessment in Higher Education: Bibliometric Analysis. Educ. Sci. 2022, 12, 209. https://doi.org/10.3390/educsci12030209
Sudakova NE, Savina TN, Masalimova AR, Mikhaylovsky MN, Karandeeva LG, Zhdanov SP. Online Formative Assessment in Higher Education: Bibliometric Analysis. Education Sciences. 2022; 12(3):209. https://doi.org/10.3390/educsci12030209
Chicago/Turabian StyleSudakova, Natalia E., Tatyana N. Savina, Alfiya R. Masalimova, Mikhail N. Mikhaylovsky, Lyudmila G. Karandeeva, and Sergei P. Zhdanov. 2022. "Online Formative Assessment in Higher Education: Bibliometric Analysis" Education Sciences 12, no. 3: 209. https://doi.org/10.3390/educsci12030209