Article

Deal Me in: Playing Cards in the Home to Learn Math

1
Department of Cognitive Sciences, University of California, Irvine, CA 92697, USA
2
Department of Human Development and Quantitative Methodology, University of Maryland, College Park, MD 20742, USA
3
Department of Psychology, Temple University, Philadelphia, PA 19122, USA
4
Department of Counseling and Learning Sciences, West Virginia University, Morgantown, WV 26506, USA
*
Authors to whom correspondence should be addressed.
Educ. Sci. 2022, 12(3), 190; https://doi.org/10.3390/educsci12030190
Submission received: 15 December 2021 / Revised: 24 February 2022 / Accepted: 7 March 2022 / Published: 9 March 2022
(This article belongs to the Special Issue Mathematics Education: At Home and in the Classroom)

Abstract

:
Recent meta-analyses have demonstrated a significant association between children’s early math achievement and their experiences with math at home, including their caregivers’ talk about math. However, few studies have investigated the relations between caregiver math talk and children’s learning with experimental designs. Eighty-six children (M = 5.0 years) and their caregivers were randomly assigned to play either a numeracy or a shape card game at home for six weeks. Data were collected on children’s number and shape knowledge and families’ math talk during gameplay. There was substantial participant attrition (42% did not return completed materials), however, both an intent-to-treat analysis of the sample that received study materials and a subgroup analysis of study completers showed that children who played the shape game significantly improved their shape naming and matching skills relative to children who played the number game. Children who played the number game did not significantly improve their numerical skills relative to children who played the shape game. Mathematical talk during gameplay varied between families but was correlated over time within families. Caregivers’ and children’s talk about matching cards by shape or color predicted children’s learning from the shape game. The results suggest that despite receiving uniform instructions and materials, there was significant variability in children’s home math experiences that predicted their learning from the card game.

1. Introduction

Supporting children’s mathematical development is key to sustaining the workforce in science, technology, engineering, and mathematics (STEM) fields. Mathematical proficiency at school entry predicts later achievement in secondary school [1], which in turn may act as a gateway to post-secondary education, STEM degrees, and ultimately STEM careers [2]. Yet the significant variability in children’s mathematics skills at school entry points to the role of the home learning environment in early skill acquisition [3,4,5,6]. Indeed, recent reviews have found that caregivers’ attitudes towards math, talk about math in the home, and provision of math activities in the home are associated with children’s early mathematics achievement [3,7,8,9]. However, most previous studies on the relation between children’s home math experiences and their math skills are correlational in design, leaving open the possibility of other confounding factors underlying the association. The goal of the present study is to describe the variability in the home mathematics engagement observed in an experimental intervention and examine whether differences relate to children’s learning.

1.1. Home Mathematics Environment and Children’s Achievement

The home math environment (HME) includes all aspects of children’s home experience involving families’ engagement in math, including math activities, math talk, and attitudes and beliefs about math. The HME has been previously measured by parent report of frequency of engagement in activities at home as well as by direct observation, and measures of HME vary in the range of aspects examined (e.g., types of activities, talk, attitudes) [9,10]. Overall, findings from recent meta-analyses and systematic reviews show that there is variability in the HME across families and that the HME positively relates to children’s math performance [3,7,9].
Within the home math environment, two aspects—games and parent math talk—are of interest in the current study. Prior research has shown that parent-reported frequency of playing math games such as dice games, card games, or board games at home relates to young children’s math performance [11,12,13]. In addition, studies that have provided materials to families have demonstrated that playing math games at home can lead to improvements in children’s math skills [14,15]. Further, the talk that parents and children use while playing can enhance children’s learning. For example, findings indicate that parental talk about numbers and math concepts during game play relates to children’s math learning [16,17,18], and that children’s talk about spatial concepts (e.g., shape, location, orientation) during play with math activities relates to their spatial and patterning abilities [19].

1.2. Variability within Low-SES Households

Another consistent predictor of variability in children’s early math proficiency is socioeconomic status (SES). On average, children from lower-income households tend to have lower math performance at school entry than same-aged children from middle- and upper-income households [4,20,21]. However, children from lower-income households are not a monolithic group—there is substantial variability in their early mathematical skills [22,23]. For example, Wu and colleagues used latent profile analysis to characterize the performance among preschoolers from low-income households and found patterns of high, moderate, and low performance among preschoolers from low-income households that spanned children’s performance on numeracy, measurement, shape, and patterning knowledge [23]. A second recent study using latent profile analysis found four distinct profile groups of numerical proficiency among preschoolers from low-income households: (1) high accuracy on all number tasks, (2) moderate accuracy on all number tasks, (3) low accuracy on all number tasks, and (4) high accuracy only on counting and numeral identification tasks but low accuracy on non-symbolic and symbolic magnitude tasks [22]. Together, these findings demonstrate that there are significant differences in the early mathematical skills of children from low-income households prior to the start of formal schooling.
Similarly, there is significant variability in the home mathematics environments provisioned by low-income families [16,24,25]. Low-income caregivers vary in their frequency of engaging children in numeracy activities at home, such as singing number songs, recognizing digits, and learning simple sums [25]. Children from low-income households self-report varied experiences with math-related games at home. One study found that 17% of participants had played the board game Chutes and Ladders, 9% of participants had played the card game Uno, and 22% of participants had played educational video games at home [26]. Low-income caregivers also provide a range of guidance to their children during math activities at home [16,17,24]. For example, low-income caregivers’ talk about numbers varied significantly while they cooked at home with their young children, which predicted children’s initial math achievement in the fall of the school year [24]. Low-income caregivers similarly vary in their mathematical talk when completing activities using the same materials. Ramani and colleagues provided low-income caregivers with three math-related activities (reading a counting book, completing a numbered puzzle, and playing a numbered board game) and coded their frequency of mathematical talk [16]. Caregivers varied significantly in the frequency of their statements related to counting, identifying numerals, labeling the total quantity of a set, comparing quantities, and basic arithmetic [16]. Overall, caregivers talked about math concepts in between 4 to 34% of their total utterances (with an average of 19%). This variability in mathematical talk in turn predicted children’s math skills; in particular, caregivers’ use of more advanced number concepts during the activities predicted children’s more advanced number knowledge.
Previous research has found variability in caregivers’ math guidance and children’s math learning even when low-income families were provided with a standard set of materials and instructions as part of a home mathematics intervention [17]. Building off prior successful interventions that used number and shape card games to improve children’s mathematical skills [27,28], 39 caregivers from low-income households were taught to play the games at home with their preschoolers for six weeks. Children who played the shape card game significantly improved their shape knowledge (specifically, shape names), and across conditions, children who played the games more frequently showed more improvement on their numeracy and shape skills by the end of the intervention. In addition, caregivers varied in the type of guidance they provided children during the game; both in the frequency of their content-related talk such as number and shape words, as well as their use of prompting their child for an answer, affirming their child’s responses, providing answers for their children, or cognitively guiding their child’s game play. This study provided an important first step in understanding how caregivers may help children effectively learn from home mathematics experiences. However, the conclusions are limited by the small sample size and the analyses that focused on general patterns of caregiver guidance as opposed to specific game-relevant categories of mathematical talk.

1.3. Present Study

The present study aimed to describe the variability in the home mathematics interactions when families are randomly assigned to play mathematics card games and determine whether those differences relate to children’s learning from the games. Our first research question asked whether children would show significant improvements in their number and shape skills as a result of the intervention. Based on previous research using these games with trained experimenters [27,28] and sent home with families [17], we hypothesized that with a larger sample of families, children randomly assigned to play the numbered card game would significantly improve their number skills and children randomly assigned to play the shape card game would significantly improve their shape skills (relative to children assigned to the other condition). Moreover, we hypothesized that children who played the shape card game would significantly improve on their ability to categorize on features of objects (i.e., shape and color) based on their practice matching cards during gameplay. To assess change in this skill, we administered a common measure of children’s early executive functioning—the Dimensional Change Card Sort task, which asks children to sort cards based on shape or color [29].
The next two research questions focused on caregivers’ and children’s math talk during the game. These questions are novel as little research has examined math talk as a potential mechanism in explaining children’s learning from playing the games. Specifically, our second research question asked how caregivers and their children used math talk while playing the games at home. Given previous research with low-income families (e.g., [16,17,24]), we hypothesized that caregivers and children who played the same card game at home would vary significantly in their use of number and shape talk (e.g., counting, numeral identification, magnitude, shape naming, matching shapes), even though families received the same materials and instructions on how to play the games from the research team. Our third research question asked whether variability in caregiver and child math talk during game play would relate to children’s learning from the card game intervention. Due to previous research showing significant associations between parent math talk and children’s mathematical skills (e.g., [16,30,31,32]), we hypothesized that variability in caregivers’ and children’s math talk during game play would predict children’s learning on mathematical outcome measures. Specifically, we predicted that families who talked more about numbers (e.g., counting, numeral identification, magnitude) would have children with greater pretest-to-posttest improvements on number skills, and families who talked more about shapes (e.g., naming shapes, making matches between shapes) would have children with greater pretest-to-posttest improvements on shape skills.

2. Materials and Methods

2.1. Participants

Eighty-six preschoolers and their parents/guardians completed informed consent to participate in the study. Sixteen children were excluded from the analyses because their parents or guardians were unable to meet the research team and collect the intervention materials to begin the study. Thus, a total of 70 children received intervention materials to begin the study. However, only 50 children were considered study completers because: Participating families did not return the study materials at the end of the intervention (n = 8); participating families moved away during the intervention period (n = 2); and participating families did not record audio of any game playing interactions (n = 10). Analyses were conducted separately with the participants who received materials (n = 70) and the participants who were study completers (n = 50).
Table 1 reports the demographic characteristics of participants who completed consent forms, received intervention materials, and fully completed the study. Participants were recruited from four Head Start centers in the mid-Atlantic region of the United States. Head Start is a federally funded early childhood education program targeting families living at or below the poverty line, which was an annual household income of $25,100 USD or less for a family of four in the year these data were collected. After receiving permission from the center directors, all families with 4 or 5-year-old children enrolled in each center were invited to participate in the study with a study flyer and consent form sent home. Participating families received $35 for completing an informed consent form and meeting with the research team to collect the intervention materials and an additional $15 at the end of the study after returning the data collection materials (i.e., audio recording device and paper tracking log).

2.2. Measures

2.2.1. Child Assessments

Number Skills. Children completed five number tasks to assess their verbal counting, cardinality, number identification, and symbolic magnitude understanding.
Verbal Counting. Participants were asked to count aloud from 1 through 25. To discourage children from simply repeating, “one, twenty-five”, the experimenter said, “Can you count from one all the way up to 25?” (adapted from [26]). The dependent measure was the highest number reached without errors divided by the highest possible score (i.e., 25; minimum possible score = 0, maximum possible score = 1).
Cardinality. Participants were given a pile of 15 poker chips and asked to give the experimenter a certain number of chips (Give-N task) [33]. Participants were first asked to give the experimenter 1 chip, followed by 2, 3, 4, 5, and 6 chips. If on any trial the child provided a correct response, the experimenter next asked them for N + 1 chips. If the child provided an incorrect response, the experimenter next asked them for N − 1 chips. The task ended when the child reached six chips correctly or gave at least two correct responses for N and two incorrect responses for N + 1. The dependent measure was the highest number of chips that children provided correctly (minimum possible score = 0, maximum possible score = 6).
Number Identification. Children were presented with 10 randomly ordered cards, each with a numeral from 1 to 10, and asked “‘What number is this?” [26]. The dependent measure was the number of correctly identified numerals divided by the highest possible score (i.e., 10; minimum possible score = 0, maximum possible score = 1).
Symbolic Magnitude Comparison. Participants were asked to compare 20 pairs of symbolic numbers ranging from 1–9 [26]. On each trial, the experimenter showed and read aloud each pair of numbers and asked children to indicate which number was larger. Each number was counterbalanced for side of presentation (i.e., 3|8, 8|3). The ratio between pairs ranged from 1.1 (e.g., 8 vs. 9) to 9.0 (e.g., 1 vs. 9). After two practice problems with accuracy feedback, participants were shown 18 test pairs of numbers and asked to indicate which number is larger. The dependent measure was the number of correct comparisons from the testing phase divided by the highest possible score (i.e., 18; minimum possible score = 0, maximum possible score = 1).
Number Line 0–10. Participants were shown a number line on a Lenovo tablet computer (10.1 in), with endpoints labeled at 0 and 10 [26]. The experimenter introduced the child to the number line, the endpoints, and had each child practice making a mark on a blank number line with no target numeral. Children were then asked to make a mark to indicate the appropriate position for the numbers 1–9. Each number from 1–9 was requested twice, in random order. The dependent measure was the accuracy of the children’s estimate compared to the target number, measured by percentage of absolute error (PAE = |estimate-estimated quantity|/scale of estimates). PAE scores were reversed (1-PAE) prior to analyses to aid in interpretability, such that higher scores reflected more accurate performance (minimum possible score = 0, maximum possible score = 1).
Shape Skills. Children completed two tasks assessing their shape knowledge.
Shape Naming. Children were presented with 5 randomly ordered cards, each with a shape (circle, square, triangle, rectangle, pentagon), and asked “What shape is this?” [17]. The dependent measure was the number of correctly named shapes divided by the highest possible score (i.e., 5; minimum possible score = 0, maximum possible score = 1).
Shape Finding. Children were presented with a picture depicting a birthday party at a park and asked to find examples of various shapes. Specifically, children were asked to point to all the circles, squares, rectangles, triangles, and pentagons that they saw in the picture [17]. The dependent measure was the number of hidden shapes correctly identified from the picture divided by the highest possible score (i.e., two of each shape for a total of 10; minimum possible score = 0, maximum possible score = 1).
Sorting by Shape and Color. Participants were asked to complete the Dimensional Change Card Sort task [29]. They were asked to sort cards into two trays, first by color (6 pre-switch trial cards), then by shape (6 post-switch trial cards). If the participant successfully sorted all cards by color and by shape, they were then asked to sort by color if there was a black border on the card (6 cards) or by shape if there was not a black border on the card (6 cards). The dependent measure was a categorical score based on accuracy. Children scored zero points if they sorted less than 5 of the 6 cards correctly in the pre-switch trials, one point if they sorted 5 or more of the pre-switch cards correctly but less than 5 of the 6 cards correctly in the post-switch trials, two points if they sorted 5 or more of the pre-switch and post-switch trials correctly but less than 9 of the 12 border cards correctly, and three points if they sorted 5 or more of the pre-switch and post-switch trials correctly and 9 or more of the 12 border trials correctly (minimum possible score = 0, maximum possible score = 3).

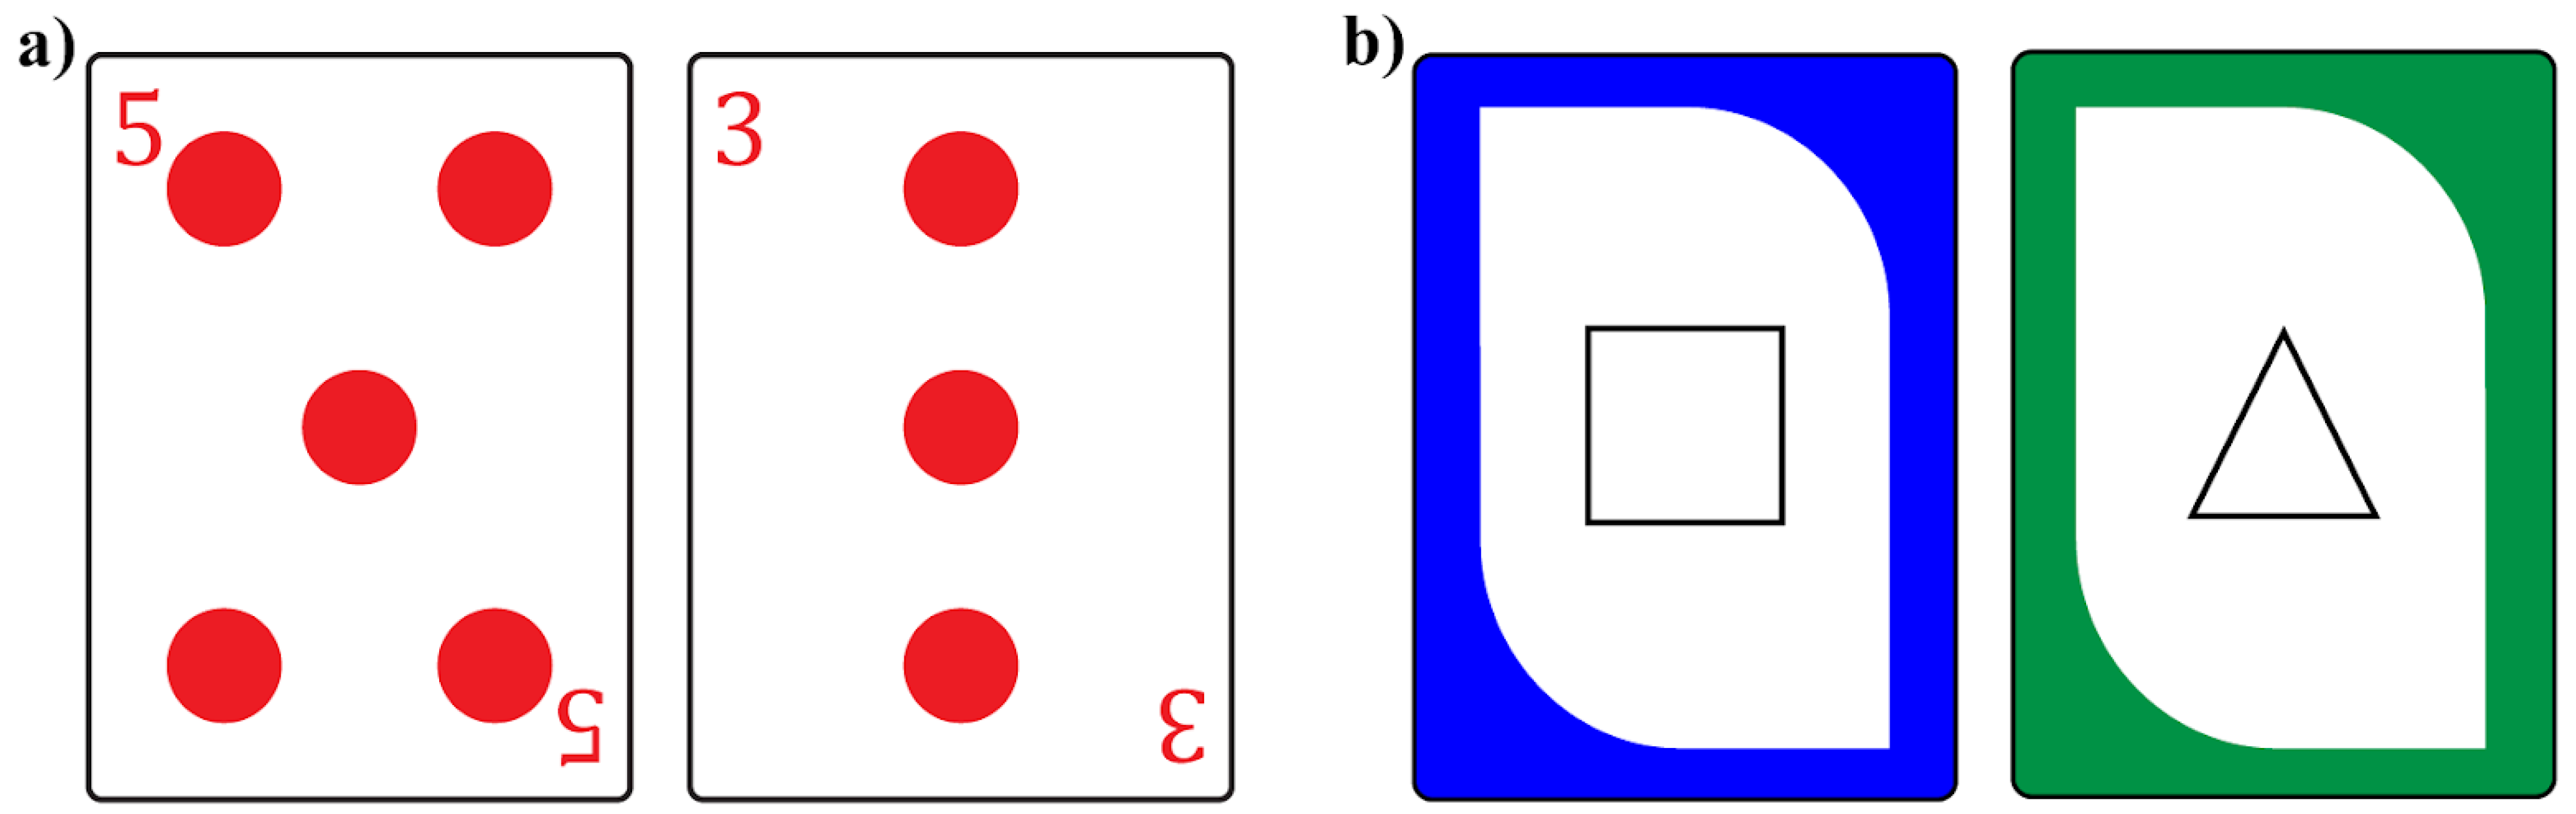
2.2.2. Math Card Games

Children were randomly assigned to one of two playful math conditions: a magnitude comparison card game named “Top It, Take It” (like the card game “War”), and a shape and color matching game named “Match It” (like the card game “Uno”, Figure 1) [17,28]. The materials for the magnitude comparison card game were a deck of 40 cards in the dimensions of standard poker cards (3.5 inches × 2.5 inches), where each card had both red dots (0.5 inches in diameter) and red Arabic numerals (0.5 inches in height) in the upper left and lower right corners. The deck of cards included four sets of cards representing quantities 1 through 10. The materials for the shape and color matching card game were a deck of 40 cards with the same dimensions of the other cards, with 10 cards in each of four colors (red, blue, green, yellow) with one of five shapes in the center (circle, square, triangle, rectangle, pentagon). The experimenter explained the card game rules to the caregiver and the child following their pretest assessment (see Procedure).
Magnitude Comparison Game. To play this game, the caregiver divided the cards so that the child and caregiver each had 20 cards stacked in a pile face down. Each player turned over the top card from their stack and placed it in the middle of the space where both players could see it. The caregiver then prompted the child to label the number on each card that was placed in the center of the space. The player with the card of greater magnitude (“the card with more”) took both cards from the center and placed them face down in a second pile. During each turn, the caregiver asked the child “which card is more?”, letting the child identify who should add the cards to their pile. If both players placed the same card down, both players would put three additional cards face down in the middle, then flip a fourth card over to see who takes all the cards. The game ended when both players played all their 20 cards, and the caregiver and child counted the number of cards in each of their second piles aloud together. The player with the most cards in their second pile won.
Shape and Color Matching Game. To play this game, the caregiver laid out 5 cards face up in front of each player, then turned over the top card from the remaining pile of cards and placed it in the center. The caregiver and child took turns placing one of their face-up cards into the center pile if it matched either the shape or the color of the card in the center. During each turn, the caregiver prompted the child to name the shape and color of the center card (“What shape is your card? What color is your card?”). If a player did not have a card that matched the color or shape of the center card, on their turn they drew one card from the center deck, and if it matched, placed it in the middle. If it did not match, the player added it to their face-up cards. The player who played all their face-up cards first won.

2.2.3. Caregiver-Child Interactions

Transcriptions. Two audio recordings from each of 48 families and one audio recording from two families with only a single audio recording were transcribed for a total of 98 transcripts. Recordings were sampled from the available audio provided by each family; the first recording was selected as the earliest dated recording from each family that included at least one minute of gameplay (if the family had recordings that lasted one minute; n = 50, average length = 12.21 min, range = 1.57–25.82 min) and the second recording was selected as the latest dated recording that included at least one minute of gameplay (n = 48, average length = 12.22 min, range = 1.62–37.67 min). Recordings were transcribed in CLAN software using the CHAT conventions of the Child Language Data Exchange System (CHILDES) at the utterance level [34]. Each transcript was verified by a second reliable transcriber. Nine families played the games in Spanish. For families playing in a language other than English, professional transcribers were hired to translate and transcribe the audio recordings into English, and transcripts were then transferred into the CLAN software by the research team.
Coding Scheme. Each transcript was coded at the utterance level for caregivers’ and children’s mathematical talk. Definitions and examples of each type of mathematical talk are presented in Table 2 (adapted from [16]). One master coder (first author) coded all the transcripts, and twenty percent of the transcripts were coded independently by a second trained coder with interrater reliability of 83% agreement. To preserve the variability in how long families decided to play the games and how frequently they spoke during game play, we analyzed the total number of utterances that contained each type of math talk rather than creating proportions based on the total number of utterances spoken by each caregiver and child.

2.3. Procedure

Prior to the pretest assessment children were randomly assigned to play either the magnitude comparison or the shape and color game, stratified by child age (4 or 5 years old) and sex (male or female). Children completed two 15- to 20-min assessment sessions individually with an experimenter in a quiet area of their classroom or school; the pretest session occurred before the child’s family received the game materials and the posttest session occurred after the end of the six-week intervention.
Families were provided with a binder of study materials and were taught how to play the game by a member of the research team. The binder included the deck of cards for the assigned game, an audio recording device, spare batteries for the audio recording device, a pen, stickers, and paper sheets explaining how to play the game, how to use the audio recorder, how to contact the members of the research team with any questions, a tracking log to record days and times that they played the game, a sticker tracking log for children to add stickers to after each day that they played, and a copy of the written informed consent form. Binders were available in both English and Spanish. Families received the binders and the instructions on how to play the game either at a Family Math Night sponsored by the research team, which was held in the evening at their child’s preschool, or by meeting one-on-one with a member of the research team at school drop-off or pick-up. Families were asked to play the games for 15 min, twice per week across the six-week intervention period and received weekly text message reminders from the research team encouraging them to play the games that week.

3. Results

3.1. Preliminary Analyses

Families who returned paper logs and reported playing the games (n = 55) reported playing them on average on nine different occasions (SD = 4.0 days, range = 2–17 days), for 180 min total (SD = 143.4 min, range = 20–841 min), for a total of 25.5 game rounds (SD = 18.6 game rounds, range = 2–89 game rounds). There were no significant differences between the two conditions in the number of days or minutes played (ps = 0.95 and 0.88, respectively). However, families assigned to play the shape and color game played significantly more game rounds than families assigned to play the magnitude comparison game (M = 32.8 vs. 18.0, t(38) = 3.13, p < 0.01, reflecting the fact that it took approximately twice as long to play one round of the magnitude comparison as it took to play one round of the shape and color game [17].
Table 3 presents descriptive statistics of children’s pretest and posttest assessments. The means and standard deviations suggest that the scores were widely distributed. Independent samples t-tests of the pretest assessment scores revealed that there were no significant differences between the two conditions prior to the intervention (n = 70 sample of participants who received materials: 0.22 < ps < 0.99; n = 50 sample of participants who completed the study: 0.14 < ps < 0.96). There were no significant differences in the pretest scores of the 70 participants who received the study materials and the 50 participants who fully completed the study (0.52 < ps < 0.93).

3.2. Did Children Learn from the Intervention? (RQ1)

To address RQ1 we conducted OLS linear regressions with posttest score regressed on pretest score, age, and condition for each assessment measure for the 70 participants who received the intervention materials and the 50 participants who fully completed the study. Child age was not a significant predictor of posttest performance on any measure when controlling for pretest score and condition. To conserve degrees of freedom, we reran each linear regression with posttest score regressed on pretest score and condition (without child age) and the results were comparable in magnitude and statistical significance to the original regression model that included age. Thus, we present the results of the linear regression models without child age in Table 4 below.
Children’s pretest scores predicted their posttest performance on all measures in both the sample of participants who received the intervention materials and the subset of children who completed the study. When controlling for child pretest score, the only significant effects of condition were on the shape naming and shape matching measures. Specifically, children who were randomly assigned to play the shape and color game had significantly higher posttest scores on the shape naming measure (participants who received materials: B = 0.21, SE = 0.05, p < 0.001; participants who completed the study: B = 0.22, SE = 0.05, p < 0.001) and the shape matching measure (participants who received materials: B = 0.20, SE = 0.05, p < 0.001; participants who completed the study: B = 0.16, SE = 0.05, p < 0.01) than children randomly assigned to play the number comparison game. Children who were randomly assigned to play the number comparison game did not show significant improvement on any of the numerical skill measures.

3.3. How Do Parents and Children Use Math Talk during Gameplay? (RQ2)

Between families, caregivers and children varied in how much they spoke. In Time 1 recordings, caregivers produced an average of 292 utterances (SD = 165.9, range = 35–637), while children produced an average of 172 utterances (SD = 100.6, range = 16–377). In Time 2 recordings, caregivers produced an average of 252 utterances (SD = 169.4, range = 35–970), while children produced an average of 178 utterances (SD = 130.2, range = 17–828).
Caregivers and children also varied significantly in their use of math talk within intervention conditions (Table 5). Math talk during game play varied between families but caregivers’ game-relevant talk was correlated over time within individual families. Children’s game-relevant math talk was less consistent over time; only children’s talk about matching features was significantly correlated over time, r(21)=0.48, p = 0.018. However, caregiver and child game-relevant talk was significantly related within condition and timepoint (rs = 0.52–0.90, ps < 0.01).

3.4. Does Caregiver and Child Math Talk Relate to Learning from the Games? (RQ3)

Given that only the children randomly assigned to play the shape and color game showed significant improvement from the intervention, we examined the relations between caregiver and child math talk about shapes and colors during the first recording and posttest shape naming and shape matching scores, controlling for pretest scores. Regression analyses revealed that caregiver and child talk about matching features during the first game session predicted children’s learning on the shape naming task; no other type of math talk related to children’s posttest scores on the shape measures (Table 6).
We also asked whether overall frequency of game play predicted children’s learning outcomes (as in [17]). Minutes reported playing the shape and color game were negatively associated with children’s posttest scores on the shape naming (B = −0.05, p = 0.01), such that a one standard deviation increase in the number of minutes played predicted a 5% decrease in children’s posttest score. However, children’s posttest scores on the shape matching measure (p = 0.97) were not related to minutes played when controlling for their pretest scores.

4. Discussion

The goal of the present study was to examine the variability among low-income families who received the same materials and instructions for a home mathematics intervention card game. We found that children who were randomly assigned to play the shape and color matching game had significantly higher posttest performance on measures of shape naming and shape finding than children assigned to the magnitude game, controlling for pretest performance. We also found significant variability in families’ mathematical talk during gameplay, despite the uniformity in the instructions and materials they received. Finally, we found some preliminary evidence that caregiver and child mathematical talk relates to children’s learning during gameplay, specifically, that the frequency of caregivers’ and children’s talk about matching features during the shape and color game predicted children’s posttest scores on shape recognition.

4.1. Learning from Playing Card Games at Home

As in earlier research [17], we found that children who played the shape and color matching game, but not the magnitude comparison game, showed significantly higher scores at posttest on the mathematical outcomes of interest. With a larger sample size in the present study, we found that children who played the shape matching game had significantly higher posttest scores on both the shape naming and shape matching measures, representing improvements in their ability to both label and identify common early geometric shapes. These two skills also represent a direct and a more distal measure of children’s learning given their practice within the game context—children were prompted frequently to label the shapes on their cards, but were not directly asked to locate a shape embedded in a larger scene, which requires additional attention and visual search capabilities. Shape labeling and identification skills are foundational to children’s early mathematical learning. Indeed, labeling shapes and sorting objects by attributes such as shape or color are key competencies in early childhood mathematics, often categorized as a form of early geometry [35].
Surprisingly, the total amount of time children reported playing the shape and color game was negatively associated with children’s posttest scores on the shape naming and unrelated to children’s posttest scores on the shape matching measure, controlling for their pretest scores. This stands in contrast to prior research, which showed positive effects of intervention dosage on children’s learning [17]. It is possible that there is an amount of practice with the intervention game that leads to optimal learning outcomes, with additional practice leading children to disengage or develop negative associations with the content. It is also possible that the relation between time spent playing the game and learning about shapes is moderated by children’s initial shape knowledge, children’s executive functioning skills, or the quality of the caregiver-child interaction.
Contrary to our hypotheses, children who were randomly assigned to play the magnitude comparison game did not show significantly higher posttest scores on their numeracy skills than children who played the shape and color game. Although this was also a replication of previous findings [17], it is somewhat surprising given the success of similar interventions led by trained experimenters with children at school (e.g., [27,28,36,37,38]. There are several potential explanations for this finding. First, the children enrolled in the present study showed relatively high performance on the numeracy measures at pretest, particularly on the symbolic magnitude comparison task which was the most direct parallel to the game play context of comparing pairs of cards to determine which was the greater numerical value. Symbolic magnitude understanding in early childhood is a key predictor of later mathematical success [39,40,41,42,43,44,45], however, some children achieve mastery of this skill early on and likely do not need additional practice comparing the magnitudes of small whole numbers [22]. Future intervention work should consider using pretest assessments to categorize participants into profiles, which would allow for screening out children who have already achieved proficiency with the targeted skills. Second, there was a range in caregivers’ mathematical talk during game play that may have contributed to children’s exposure to the targeted concepts. When playing with a trained experimenter, experimental protocols would ensure that every turn the child would be explicitly asked to make a comparison between two cards (e.g., [27,28]), whereas the variability among families’ mathematical talk suggests that not all children received the same prompts when playing the games at home. In a similar vein, other home mathematics research has also failed to replicate the success of experimenter-led numeracy interventions (e.g., [15,17]). Researchers have pointed to lack of fidelity in implementing the intervention at home as a source of different results between classroom and home versions of interventions [15]. Given the variability in mathematical input children received during gameplay at home, additional time and exposure to the game concepts may be needed to see similar results to experimenter-led designs. Moreover, recent research suggests that not all children learn similarly from mathematical talk in their home environments-instead, child-level characteristics, such as executive functioning, may moderate their learning from caregivers’ mathematical talk [46].

4.2. Variability in Mathematical Talk during Gameplay

As hypothesized, we found significant variability in caregiver and child mathematical talk during game play. This replicates previous research with lower-income caregivers that shows significant differences in mathematical talk (e.g., [16,17,24]), and underscores the fact that low-income families show a range in home mathematical experiences similar to upper-income families (e.g., [25,47,48,49,50]). Despite receiving identical instructions and game materials, families had unique approaches to supporting their children’s learning. Previous research has shown that caregivers adapt their mathematical talk to their child’s individual skill level [19,51], which is one potential explanation for the variability in mathematical talk that we observed.
Although caregivers had a lower average number of utterances that involved mathematical talk during the audio recording sampled from the end of the intervention phase than the recording sampled from the beginning of the intervention, individual caregiver’s mathematical talk was significantly correlated over time. Previous research has demonstrated that middle-class caregivers vary their talk over time when playing the same games at home with their young children, and changes in their types of guidance relate to children’s use of more and less sophisticated strategies during gameplay [52]. Children’s talk was less consistently related; only children’s talk about matching cards based on shape or color in the shape game condition was significantly correlated over time. Over time, these consistent differences in caregivers’ mathematical talk could lead to large differences in children’s mathematical skills [53]. Furthermore, it is worth noting that children’s mathematical talk was inconsistent over time except for the one type of mathematical talk that related to their learning from the intervention, matching features of cards in the shape and color game.
In addition to positive, consistent patterns of caregiver mathematical talk over time, caregiver and child talk within condition and timepoint were also significantly and positively related. This provides additional evidence for caregivers’ tailoring their feedback to their child’s skill level and mathematical talk during gameplay, as has been demonstrated in previous work [19,52]. However, it is unclear whether caregivers adapt their talk to match their child’s, children adapt their talk to match their caregivers’, or perhaps most likely-caregivers and children both adapt their mathematical talk in conversation with one another.

4.3. Relations between Mathematical Talk and Learning Shape Names

Our results showed preliminary evidence that differences in caregivers’ and children’s talk predicts children’s posttest shape knowledge, controlling for their pretest performance. Given that only children who were assigned to play the shape and color matching game showed significantly higher posttest scores on outcomes of interest relative to children assigned to play the numeracy game, we focused on the relation between these children’s mathematical talk experiences during game play. Although it was surprising that caregivers’ and children’s frequency of naming shapes during game play did not relate to children’s improvements in shape naming or finding, talk about matching cards based on the features of shape and color did significantly predict children’s posttest scores on shape naming. This finding may have occurred for several reasons. First, the use of matching features utterances is by definition a more advanced type of reasoning than referring to shape or color labels—it entails walking children through the logic of finding a matching category member on one (or two) different dimensions. Children may need to focus even more attention on shape labels when searching for a match to the target shape, because each card they encounter must be assessed on whether it is the correct shape and they are likely to be corrected by a caregiver if they are mistaken (e.g., “That’s not a square, that’s a rectangle!”). Previous research has found that more advanced mathematical talk for preschoolers, such as talk about ordinal relations and cardinality and larger sets of present objects from 4–10, is predictive of children’s mathematical skills, whereas more foundational mathematical talk, such as talk about counting and identifying numerals and smaller sets of objects does not predict mathematical outcomes [16,32]. Second, the average number of utterances in which children and caregivers referred to matching features was lower than all other types of talk during gameplay. This suggests that families used this type of mathematical talk more sparingly than references to shapes and colors. It is possible that children who were exposed to even small amounts of this more advanced type of mathematical talk were more likely to learn from it compared to receiving any amount of more basic mathematical talk about shape and color identification. Moreover, our study is one of the first to look for relations between children’s own mathematical talk at home and their learning, and the positive relation between children’s use of matching features talk and their shape learning represents their active participation and meaning-making during gameplay, rather than their passive listening to their caregivers (see also [53,54,55]).

4.4. Remaining Questions and Future Directions

There are several remaining open questions from our investigation that suggest potential avenues for future research. First, like other targeted home mathematics interventions (e.g., [15,17]), our study had substantial participant attrition with a relatively small sample of study completers (n = 50). Of the initially consented 86 children, 81% received study materials, and only 58% completed the study activities in full. In our study design, we intentionally took steps suggested by Sonnenschein et al. [15] and others to boost participant retention: offered cash incentives for both study enrollment and completing the study, hosted a family-friendly recruitment event, explained the motivation behind the study and use of mathematical games to families, showed a video demonstration of an experimenter playing the games with a child in the appropriate age range, and had a researcher train families in person on how to play the games and be available for additional support via email or text message using a study-specific account. We also followed lessons from behavioral economics work suggested by Kuchirko and colleagues [56] and included weekly text message reminders to families, customized with their child’s name and noting their progress through the intervention phase (e.g., “You are on week 3 of 6!”). Future research should consider experimentally testing other methods of boosting participation, such as asking families to play the game at a specific time of day to anchor the math activity in a part of regular daily life.
A second limitation is that children in our sample had high initial scores on numerical measures of interest, specifically, the magnitude comparison task. In other successful magnitude training interventions, children had initial pretest accuracy ranging from 64–72% [27,28,36], whereas in the current sample pretest accuracy was 82%. This points to the need for future research to implement screenings or other methods of ensuring that study participants have room to improve on the measures of interest. Put another way, interventions could be designed to be adaptable to the child’s initial starting skills and areas of needed growth. Children who have mastered skills of symbolic magnitude comparison with small whole numbers could be introduced to larger numbers (10–20) [57] or build from their magnitude understanding to target small whole number addition [42].
A third limitation is the relatively short timeline of our study design (six weeks of intervention). It is possible that to provide enough additional practice with mathematical concepts to affect children’s skill development, home mathematics interventions, particularly those focused on numeracy skills, should last months or even up to a year. For example, one successful early numeracy intervention targeted first grade students’ mathematical knowledge, with a focus on skills including counting, geometry, arithmetic, fractions, and probability [58]. Students and their families completed nightly math activities for one school year, after which children whose families used the app more consistently saw improved math achievement compared to children who used a control app with reading comprehension prompts. As a corollary, it may be particularly important to intervene on family math practices in a routine, consistent way that families can continue after the end of the research study—such as pediatricians recommending that parents of infants and toddlers read to their child every night before bedtime [59]. Future research should explore methods of incorporating daily math activities into the home life of young children, which may be more likely to affect long term mathematical development compared to exposure with concepts that children would likely receive over time at school or elsewhere [60].
Finally, the present study is not able to shed light on which participants benefit the most from this type of home mathematics intervention. There are several potential factors that may moderate a child’s learning from home interventions, such as the child’s executive functioning skills (e.g., [46]), the child’s interest in math (e.g., [61]), the caregiver’s math anxiety (e.g., [58]), and the quality and frequency of mathematical instruction the child receives at school (e.g., [62]). The current study was not designed to investigate individual differences in children’s learning outcomes beyond variability in the mathematical talk children heard and produced during game play. However, future research with larger sample sizes should consider the interplay of both child and family characteristics that may impact study participation, retention, and fidelity [15].

5. Conclusions

Recent meta-analyses have demonstrated a significant association between children’s early math achievement and their experiences with math at home, including their caregivers’ talk about math [7,9]. However, few studies have investigated the relations between caregiver math talk and children’s learning with experimental designs. The goal of the present study was to ask whether children who were randomly assigned to play a mathematical card game at home for six weeks showed improvements in their mathematical skills, to characterize the mathematical talk they heard and produced during gameplay, and to test whether variability in mathematical talk during gameplay related to children’s learning from the games. Despite substantial attrition in participants both receiving intervention materials and completing all study requirements, both an intent-to-treat analysis of the full sample and a subgroup analysis of study completers showed that children who played the shape game significantly improved their shape naming and matching skills. Mathematical talk during game play varied between families but was correlated over time within families. Caregivers’ and children’s talk about matching cards by shape or color predicted children’s learning from the shape game. The results suggest that despite receiving uniform instructions and materials, there was significant variability in children’s home math experiences that predicted their learning from the card game. Over time, this variability could lead to differences in children’s mathematical skills.

Author Contributions

Conceptualization, G.B.R. and N.R.S.; formal analysis, N.R.S.; data curation, N.R.S., M.D., N.T. and C.M.; writing—original draft preparation, N.R.S., M.D. and G.B.R.; writing—review and editing, N.R.S., M.D., N.T., C.M. and G.B.R.; supervision, G.B.R.; project administration, N.R.S. and C.M.; funding acquisition, G.B.R. and N.R.S. All authors have read and agreed to the published version of the manuscript.

Funding

This research was funded by the Spencer Foundation, grant number 201700148 (PI: G.B.R.) and the National Science Foundation, grant numbers DGE 1322106 and SBE 1911869 (PI: N.R.S.).

Institutional Review Board Statement

The study was conducted according to the guidelines of the Declaration of Helsinki and approved by the Institutional Review Board of the University of Maryland, College Park (Protocol #953557, approved 17 October 2016).

Informed Consent Statement

Written informed consent was obtained from the parent/guardian of each child subject involved in the study, and child assent was collected prior to every assessment session.

Data Availability Statement

The data presented in this study are available on request from the corresponding author. The data are not publicly available due because participants did not provide informed consent allowing for their data to be made public.

Acknowledgments

The authors thank Myles Arrington, Jessie Kwon, Ana Maria Ortiz, and Amira Walton for their help in entering, transcribing, and coding these data. We also thank the students, teachers, and families at the participating Head Start Centers.

Conflicts of Interest

The authors declare no conflict of interest. The funders had no role in the design of the study; in the collection, analyses, or interpretation of data; in the writing of the manuscript, or in the decision to publish the results.

References

  1. Duncan, G.J.; Dowsett, C.J.; Claessens, A.; Magnuson, K.; Huston, A.C.; Klebanov, P.; Pagani, L.S.; Feinstein, L.; Engel, M.; Brooks-Gunn, J.; et al. School Readiness and Later Achievement. Dev. Psychol. 2007, 43, 1428–1446. [Google Scholar] [CrossRef] [PubMed] [Green Version]
  2. Hinojosa, T.; Rapaport, A.; Jaciw, A.; LiCalsi, C.; Zacamy, J. Exploring the Foundations of the Future STEM Workforce: K-12 Indicators of Postsecondary STEM Success. (REL 2016-122); Department of Education, Institute of Education Sciences, National Center for Education Evaluation and Regional Assistance, Regional Educational Laboratory Southwest: Washington, DC, USA, 2016. Available online: http://ies.ed.gov/ncee/edlabs (accessed on 30 November 2021).
  3. Eason, S.H.; Scalise, N.R.; Berkowitz, T.; Ramani, G.B.; Levine, S.C. Reviewing the Family Math Literature: Recommendations for Practice, Policy, and Research. 2020. Available online: https://education-first.com/wp-content/uploads/2020/06/FamilyMathReview_WhitePaper.pdf (accessed on 1 September 2021).
  4. Jordan, N.C.; Levine, S.C. Socioeconomic variation, number competence, and mathematics learning difficulties in young children. Dev. Disabil. Res. Rev. 2009, 15, 60–68. [Google Scholar] [CrossRef] [PubMed]
  5. Starkey, P.; Klein, A. Sociocultural influences on young children’s mathematical knowledge. In Contemporary Perspectives on Mathematics in Early Childhood Education; Saracho, O., Spodek, B., Eds.; Information Age Publishing: Charlotte, NC, USA, 2008; pp. 253–276. [Google Scholar]
  6. Verdine, B.N.; Irwin, C.M.; Golinkoff, R.M.; Hirsh-Pasek, K. Contributions of executive function and spatial skills to preschool mathematics achievement. J. Exp. Child Psychol. 2014, 126, 37–51. [Google Scholar] [CrossRef] [PubMed] [Green Version]
  7. Daucourt, M.C.; Napoli, A.R.; Quinn, J.M.; Wood, S.G.; Hart, S.A. The home math environment and math achievement: A meta-analysis. Psychol. Bull. 2021, 147, 565–596. [Google Scholar] [CrossRef]
  8. Elliott, L.; Bachman, H.J. How Do Parents Foster Young Children’s Math Skills? Child Dev. Perspect. 2018, 12, 16–21. [Google Scholar] [CrossRef] [Green Version]
  9. Mutaf-Yildiz, B.; Sasanguie, D.; De Smedt, B.; Reynvoet, B. Probing the Relationship Between Home Numeracy and Children’s Mathematical Skills: A Systematic Review. Front. Psychol. 2020, 11, 2074. [Google Scholar] [CrossRef]
  10. Hornburg, C.B.; Borriello, G.A.; Kung, M.; Lin, J.; Litkowski, E.; Cosso, J.; Ellis, A.; King, Y.; Zippert, E.; Cabrera, N.J.; et al. Next directions in measurement of the home mathematics environment: An international and interdisciplinary perspective. J. Numer. Cogn. 2021, 7, 195–220. [Google Scholar] [CrossRef]
  11. Benavides-Varela, S.; Butterworth, B.; Francesca, A.G.; Lucangeli, D.; Semenza, C. Numerical activities and information learned at home link to the exact numeracy skills in 5–6 years-old children. Front. Psychol. 2016, 7, 94. [Google Scholar] [CrossRef] [Green Version]
  12. Mutaf-Yildiz, B.; Sasanguie, D.; De Smedt, B.; Reynvoet, B. Frequency of Home Numeracy Activities Is Differentially Related to Basic Number Processing and Calculation Skills in Kindergarteners. Front. Psychol. 2018, 9, 340. [Google Scholar] [CrossRef] [Green Version]
  13. Niklas, F.; Schneider, W. Casting the die before the die is cast: The importance of the home numeracy environment for preschool children. Eur. J. Psychol. Educ. 2014, 29, 327–345. [Google Scholar] [CrossRef]
  14. Cheung, S.K.; McBride, C. Effectiveness of parent-child number board game playing in promoting Chinese kindergarteners’ numeracy skills and mathematics interest. Early Educ. Dev. 2017, 28, 572–589. [Google Scholar] [CrossRef]
  15. Sonnenschein, S.; Metzger, S.R.; Thompson, J.A. Low-income parents’ socialization of their preschoolers’ early reading and math skills. Res. Hum. Dev. 2016, 13, 207–224. [Google Scholar] [CrossRef]
  16. Ramani, G.B.; Rowe, M.L.; Eason, S.H.; Leech, K.A. Math talk during parent-child interactions in Head Start families. Cog. Dev. 2015, 35, 15–33. [Google Scholar] [CrossRef]
  17. Ramani, G.B.; Scalise, N.R. It’s more than just fun and games: Play-based mathematics activities for Head Start families. Ear. Child. Res. Quart. 2020, 50, 78–89. [Google Scholar] [CrossRef]
  18. Vandermaas-Peeler, M.; Ferretti, L.; Loving, S. Playing The Ladybug Game: Parent guidance of young children’s numeracy activities. Early Child Dev. Care 2011, 182, 1289–1307. [Google Scholar] [CrossRef]
  19. Zippert, E.L.; Daubert, E.N.; Scalise, N.R.; Noreen, G.D.; Ramani, G.B. “Tap space number three”: Promoting math talk during parent-child tablet play. Dev. Psychol. 2019, 55, 1605–1614. [Google Scholar] [CrossRef]
  20. Clements, D.H.; Sarama, J. Effects of a preschool mathematics curriculum: Summative research on the Building Blocks Project. J. Res. Math. Educ. 2007, 38, 136–163. [Google Scholar] [CrossRef]
  21. Siegler, R.S. Improving the Numerical Understanding of Children From Low-Income Families. Child Dev. Perspect. 2009, 3, 118–124. [Google Scholar] [CrossRef]
  22. Scalise, N.R.; Daubert, E.N.; Ramani, G.B. When one size does not fit all: A latent profile analysis of low-income preschoolers’ math skills. J. Exp. Child Psychol. 2021, 209, 105156. [Google Scholar] [CrossRef]
  23. Wu, Q.; Lei, P.-W.; DiPerna, J.; Morgan, P.L.; Reid, E.E. Identifying Differences in Early Mathematical Skills Among Children in Head Start. Int. J. Sci. Math. Educ. 2014, 13, 1403–1423. [Google Scholar] [CrossRef]
  24. Son, S.-H.C.; Hur, J.H. Parental Math Talk During Home Cooking and Math Skills in Head Start Children: The Role of Task Management Talk. J. Res. Child. Educ. 2020, 34, 406–426. [Google Scholar] [CrossRef]
  25. Susperreguy, M.I.; Lira, C.J.; Xu, C.; LeFevre, J.-A.; Vega, H.B.; Pando, E.V.B.; Contreras, M.O. Home Learning Environments of Children in Mexico in Relation to Socioeconomic Status. Front. Psychol. 2021, 12, 12. [Google Scholar] [CrossRef] [PubMed]
  26. Ramani, G.B.; Siegler, R.S. Promoting Broad and Stable Improvements in Low-Income Children’s Numerical Knowledge Through Playing Number Board Games. Child Dev. 2008, 79, 375–394. [Google Scholar] [CrossRef] [PubMed]
  27. Scalise, N.R.; Daubert, E.D.; Ramani, G.B. Narrowing the early mathematics gap: A play-based intervention to promote low-income preschoolers’ number skills. J. Num. Cog. 2017, 3, 655–661. [Google Scholar] [CrossRef]
  28. Scalise, N.R.; Daubert, E.N.; Ramani, G.B. Benefits of Playing Numerical Card Games on Head Start Children’s Mathematical Skills. J. Exp. Educ. 2020, 88, 200–220. [Google Scholar] [CrossRef] [PubMed]
  29. Zelazo, P.D. The Dimensional Change Card Sort (DCCS): A method of assessing executive function in children. Nat. Protoc. 2006, 1, 297–301. [Google Scholar] [CrossRef]
  30. Casey, B.M.; Lombardi, C.M.; Thomson, D.; Nguyen, H.N.; Paz, M.; Theriault, C.A.; Dearing, E. Maternal Support of Children’s Early Numerical Concept Learning Predicts Preschool and First-Grade Math Achievement. Child Dev. 2016, 89, 156–173. [Google Scholar] [CrossRef]
  31. Elliott, L.; Braham, E.J.; Libertus, M.E. Understanding sources of individual variability in parents’ number talk with young children. J. Exp. Child Psychol. 2017, 159, 1–15. [Google Scholar] [CrossRef]
  32. Gunderson, E.A.; Levine, S.C. Some types of parent number talk count more than others: Relations between parents’ input and children’s cardinal-number knowledge. Dev. Sci. 2011, 14, 1021–1032. [Google Scholar] [CrossRef] [Green Version]
  33. Wynn, K. Children’s understanding of counting. Cognition 1990, 36, 155–193. [Google Scholar] [CrossRef]
  34. MacWhinney, B. The CHILDES Project: Tools for Analyzing Talk, 3rd ed.; Erlbaum: Hillsdale, NJ, USA, 2000. [Google Scholar]
  35. National Council of Teachers of Mathematics (NCTM). Principles and Standards for School Mathematics; NCTM: Reston, VA, USA, 2000; Available online: https://www.nctm.org/Standards-and-Positions/Principles-and-Standards/Geometry/ (accessed on 30 November 2021).
  36. Honoré, N.; Noel, M.-P. Improving Preschoolers’ Arithmetic through Number Magnitude Training: The Impact of Non-Symbolic and Symbolic Training. PLoS ONE 2016, 11, e0166685. [Google Scholar] [CrossRef] [PubMed]
  37. Laski, E.; Siegler, R.S. Learning from number board games: You learn what you encode. Dev. Psychol. 2014, 50, 853–864. [Google Scholar] [CrossRef] [PubMed]
  38. Whyte, J.C.; Bull, R. Number games, magnitude representation, and basic number skills in preschoolers. Dev. Psychol. 2008, 44, 588–596. [Google Scholar] [CrossRef]
  39. De Smedt, B.; Noël, M.-P.; Gilmore, C.; Ansari, D. How do symbolic and non-symbolic numerical magnitude processing skills relate to individual differences in children’s mathematical skills? A review of evidence from brain and behavior. Trends Neurosci. Educ. 2013, 2, 48–55. [Google Scholar] [CrossRef] [Green Version]
  40. Fazio, L.; Bailey, D.H.; Thompson, C.; Siegler, R.S. Relations of different types of numerical magnitude representations to each other and to mathematics achievement. J. Exp. Child Psychol. 2014, 123, 53–72. [Google Scholar] [CrossRef]
  41. Mussolin, C.; Nys, J.; Leybaert, J.; Content, A. How approximate and exact number skills are related to each other across development: A review. Dev. Rev. 2016, 39, 1–15. [Google Scholar] [CrossRef]
  42. Scalise, N.R.; Ramani, G.B. Symbolic Magnitude Understanding Predicts Preschoolers’ Later Addition Skills. J. Cogn. Dev. 2021, 22, 185–202. [Google Scholar] [CrossRef]
  43. Schneider, M.D.; Beeres, K.; Coban, L.; Merz, S.; Schmidt, S.S.; Stricker, J.; De Smedt, B. Associations of non-symbolic and symbolic numerical magnitude processing with mathematical competence: A meta-analysis. Dev. Sci. 2017, 20, e12372. [Google Scholar] [CrossRef]
  44. Schneider, M.; Merz, S.; Stricker, J.; De Smedt, B.; Torbeyns, J.; Verschaffel, L.; Luwel, K. Associations of Number Line Estimation With Mathematical Competence: A Meta-analysis. Child Dev. 2018, 89, 1467–1484. [Google Scholar] [CrossRef]
  45. Siegler, R.S. Magnitude knowledge: The common core of numerical development. Dev. Sci. 2016, 19, 341–361. [Google Scholar] [CrossRef] [Green Version]
  46. Silver, A.M.; Elliott, L.; Libertus, M.E. Parental math input is not uniformly beneficial for young children: The moderating role of inhibitory control. J. Educ. Psychol. 2021. [Google Scholar] [CrossRef]
  47. Napoli, A.R.; Purpura, D.J. The home literacy and numeracy environment in preschool: Cross-domain relations of parent–child practices and child outcomes. J. Exp. Child Psychol. 2018, 166, 581–603. [Google Scholar] [CrossRef] [PubMed]
  48. Skwarchuk, S.-L. How Do Parents Support Preschoolers’ Numeracy Learning Experiences at Home? Day Care Early Educ. 2009, 37, 189–197. [Google Scholar] [CrossRef]
  49. Susperreguy, M.I.; Davis-Kean, P.E. Maternal Math Talk in the Home and Math Skills in Preschool Children. Early Educ. Dev. 2016, 27, 841–857. [Google Scholar] [CrossRef]
  50. Vandermaas-Peeler, M.; Boomgarden, E.; Finn, L.; Pittard, C. Parental support of numeracy during a cooking activity with four-year-olds. Int. J. Early Years Educ. 2012, 20, 78–93. [Google Scholar] [CrossRef]
  51. Saxe, G.B.; Guberman, S.R.; Gearhart, M.; Gelman, R.; Massey, C.M.; Rogoff, B. Social Processes in Early Number Development. Monogr. Soc. Res. Child Dev. 1987, 52, 52. [Google Scholar] [CrossRef]
  52. Bjorklund, D.F.; Hubertz, M.J.; Reubens, A.C. Young children’s arithmetic strategies in social context: How parents contribute to children’s strategy development while playing games. Int. J. Behav. Dev. 2004, 28, 347–357. [Google Scholar] [CrossRef]
  53. Levine, S.C.; Suriyakham, L.W.; Rowe, M.L.; Huttenlocher, J.; Gunderson, E.A. What counts in the development of young children’s number knowledge? Dev. Psychol. 2010, 46, 1309–1319. [Google Scholar] [CrossRef]
  54. Susperreguy, M.I. Math talk between children and mothers and its connection to math-related practices in the home setting. In Socializing Children through Language; Davis-Kean, P.E., Tang, S., Eds.; Academic Press: Cambridge, MA, USA, 2016; pp. 81–109. [Google Scholar]
  55. Hendrix, N.M.; Hojnoski, R.L.; Missall, K.N. Shared Book Reading to Promote Math Talk in Parent–Child Dyads in Low-Income Families. Top. Early Child. Spéc. Educ. 2019, 39, 45–55. [Google Scholar] [CrossRef]
  56. Kuchirko, Y.A.; Coskun, L.Z.; Duch, H.; Castaner, M.M.; Gennetian, L.A. Light-Touch Design Enhancements Can Boost Parent Engagement in Math Activities. Child. Youth Serv. Rev. 2021, 128, 106133. [Google Scholar] [CrossRef]
  57. Cheung, S.K.; McBride-Chang, C. Evaluation of a Parent Training Program for Promoting Filipino Young Children’s Number Sense with Number Card Games. Child Stud. Asia-Pac. Context 2015, 5, 39–49. [Google Scholar] [CrossRef] [Green Version]
  58. Berkowitz, T.; Schaeffer, M.W.; Maloney, E.A.; Peterson, L.; Gregor, C.; Levine, S.C.; Beilock, S.L. Math at home adds up to achievement in school. Science 2015, 350, 196–198. [Google Scholar] [CrossRef] [PubMed] [Green Version]
  59. High, P.C.; LaGasse, L.; Becker, S.; Ahlgren, I.; Gardner, A. Literacy Promotion in Primary Care Pediatrics: Can We Make a Difference? Pediatrics 2000, 105, 927–934. [Google Scholar] [CrossRef] [PubMed]
  60. Bailey, D.; Duncan, G.J.; Odgers, C.; Yu, W. Persistence and Fadeout in the Impacts of Child and Adolescent Interventions. J. Res. Educ. Eff. 2017, 10, 7–39. [Google Scholar] [CrossRef] [PubMed] [Green Version]
  61. Arnold, D.H.; Fisher, P.H.; Doctoroff, G.L.; Dobbs, J. Accelerating math development in Head Start classrooms. J. Educ. Psychol. 2002, 94, 762–770. [Google Scholar] [CrossRef]
  62. Klibanoff, R.S.; Levine, S.C.; Huttenlocher, J.; Vasilyeva, M.; Hedges, L.V. Preschool children’s mathematical knowledge: The effect of teacher “math talk”. Dev. Psychol. 2006, 42, 59–69. [Google Scholar] [CrossRef] [PubMed]
Figure 1. Intervention card games: (a) Top It, Take It magnitude comparison game; (b) Match It shape and color game.
Education 12 00190 g001
Table 1. Demographic characteristics of participants who completed consent forms, received study materials, and completed the study.
Completed Consent
(n = 86)
Received Materials
(n = 70)
Completed Study
(n = 50)
Child age (in months)60.5 (4.7) 160.4 (4.9)60.1 (4.4)
% Female474956
% Hispanic/Latinx353738
% African American/Black302726
% Caucasian/White445152
% Asian/Pacific Islander976
% Biracial/Multiracial141316
1 Mean (SD).
Table 2. Mathematical talk coding scheme 1.
CodeDefinitionExamples
Counting and cardinalityPlayer counts, asks other player to count, discusses counting strategies, or discusses the cardinal values of sets.One, two, three… (C)
Let’s count it! (A)
Count the dots. (A)
You have seven cards. (A)
How many cards do I have? (A)
Number identificationPlayer identifies a written numeral or asks other player to identify a numeral. Includes references to the same cards or the same number.What is your card? (A)
What number is this? (A)
I have a 5. (C)
We have the same number! (A)
Magnitude comparisonPlayer compares two quantities, makes a statement about relative quantity, or asks other player to make a comparison of two quantities. This includes statements of non-equivalence and talking about which number is closest to a target number.Which is more, 3 or 5? (A)
Whose card is higher? (A)
I have more cards. (C)
My card is more! (C)
Shape identificationPlayer identifies a shape or asks other player to identify a shape (i.e., circle, triangle, square, rectangle, pentagon, hexagon, octagon).What shape is this? (A)
Do you have a rectangle? (A)
I have a square. (C)
Color identificationPlayer identifies a color or asks other player to identify a color.What color is this? (A)
My card is red. (C)
Do you have green? (A)
Matching featuresPlayer identifies or asks other player to compare features of the cards, such as if both cards have the same color or shape. Focus on comparing features or the logic of finding a matching feature.Is it the same shape? (A)
Is it the same color? (A)
I don’t have any rectangles. (C)
You could play a red one. (A)
Do you have any green cards? (A)
1 Adapted from [16]. (A) indicates an example of adult speech; (C) indicates an example of child speech.
Table 3. Descriptive statistics on participants who received materials (n = 70) and completed the study (n = 50).
Magnitude ComparisonShape and Color
Pretest M (SD)Posttest M (SD)Pretest M (SD)Posttest M (SD)
Participants who received materials (n = 70)
Number knowledge
Counting0.76 (0.32)0.72 (0.34)0.76 (0.31)0.78 (0.32)
Cardinality5.17 (1.52)4.52 (1.06)4.21 (1.37)5.24 (1.42)
Number identification0.81 (0.29)0.76 (0.35)0.84 (0.25)0.86 (0.27)
Symbolic magnitude0.82 (0.21)0.78 (0.31)0.80 (0.23)0.83 (0.21)
Number line estimation0.74 (0.10)0.73 (0.09)0.75 (0.08)0.72 (0.09)
Shape knowledge
Shape naming0.64 (0.20)0.60 (0.29)0.70 (0.17)0.84 (0.19)
Shape finding0.62 (0.25)0.56 (0.29)0.61 (0.24)0.76 (0.21)
Sorting by shape and color1.78 (0.42)1.64 (0.80)1.65 (0.54)1.82 (0.67)
Participants who completed the study (n = 50)
Number knowledge
Counting0.76 (0.31)0.78 (0.30)0.77 (0.29)0.79 (0.31)
Cardinality4.44 (1.08)3.62 (0.82)3.44 (0.96)5.20 (1.53)
Number identification0.81 (0.27)0.81 (0.28)0.83 (0.25)0.86 (0.25)
Symbolic magnitude0.86 (0.17)0.83 (0.26)0.78 (0.25)0.80 (0.23)
Number line estimation0.25 (0.09)0.28 (0.09)0.25 (0.09)0.28 (0.09)
Shape knowledge
Shape naming0.66 (0.20)0.64 (0.26)0.71 (0.18)0.90 (0.13)
Shape finding0.65 (0.24)0.60 (0.29)0.64 (0.23)0.76 (0.21)
Sorting by shape and color1.84 (0.37)1.72 (0.74)1.68 (0.56)1.84 (0.75)
Table 4. Regression models predicting children’s posttest skills for participants who received study materials (n = 70) and completed the study (n = 50).
OutcomePretest ScoreCondition 1R2
Participants who received materials (n = 70)
Counting0.76 ***0.680.66
Cardinality0.66 ***0.010.63
Number identification0.68 ***−0.080.37
Symbolic magnitude 0.66 ***−0.060.29
Number line estimation0.35 **−0.010.13
Shape naming0.69 ***−0.21 ***0.42
Shape finding0.52 ***−0.20 ***0.35
Sorting shapes and colors0.50 **−0.250.12
Participants who completed the study (n = 50)
Counting0.72 ***0.800.58
Cardinality0.72 ***−0.140.67
Number identification0.61 ***−0.040.36
Symbolic magnitude 0.70 ***−0.020.39
Number line estimation0.40 *0.010.15
Shape naming0.66 ***−0.22 ***0.55
Shape finding0.73 ***−0.16 **0.52
Sorting shapes and colors0.52 *−0.200.12
1 Reference group for Condition variable: magnitude comparison game. * p < 0.05, ** p < 0.01, *** p < 0.001.
Table 5. Descriptive statistics of caregiver and child math talk within condition.
Time 1 M (SD)Time 2 M (SD)Correlation T1-T2
Number comparison game: Caregiver talk
Counting/cardinality37.9 (34.3)25.9 (41.0)0.68 ***
Number identification45.2 (33.1)42.4 (29.0)0.44 *
Magnitude comparison36.5 (25.4)28.0 (24.5)0.50 *
Shape identification0.1 (0.4)0.2 (0.8)0.99 ***
Color identification0 (0)0.1 (0.2)---
Matching features0 (0)0 (0)---
Number comparison game: Child talk
Counting/cardinality20.8 (19.8)16.6 (20.8)0.34
Number identification36.5 (23.2)35.0 (19.8)0.08
Magnitude comparison23.0 (15.5)22.0 (17.2)0.34
Shape identification0 (0)0 (0)---
Color identification0.1 (0.4)0 (0)---
Matching features0 (0)0 (0)---
Shape and color matching game: Caregiver talk
Counting/cardinality15.5 (11.9)16.3 (16.1)0.39
Number identification0 (0)0.4 (1.0)---
Magnitude comparison0.1 (0.3)0.1 (0.2)−0.08
Shape identification68.0 (45.2)60.6 (46.5)0.46 *
Color identification57.4 (39.9)53.1 (45.4)0.41 *
Matching features25.2 (20.6)14.3 (20.7)0.74 ***
Shape and color matching game: Child talk
Counting/cardinality9.6 (7.5)9.7 (10.1)0.54 **
Number identification0 (0)0.5 (1.9)---
Magnitude comparison0 (0)0 (0)---
Shape identification29.4 (20.5)38.5 (32.4)0.36
Color identification27.7 (20.7)36.5 (33.5)0.13
Matching features9.5 (9.0)9.1 (13.0)0.48 *
Note. * p < 0.05, ** p < 0.01, *** p < 0.001.
Table 6. Regression coefficients of caregiver and child math talk predicting children’s posttest scores, controlling for pretest scores 1.
Posttest Shape Naming
B (SE)
Posttest Shape Matching
B (SE)
Caregiver shape identification0.03 (0.02)0.02 (0.03)
Caregiver color identification0.04 (0.02)0.02 (0.03)
Caregiver matching features 0.05 (0.02) *0.002 (0.03)
Child shape identification−0.003 (0.02)−0.002 (0.03)
Child color identification0.003 (0.02)0.008 (0.03)
Child matching features 0.06 (0.02) **0.05 (0.03)
1 Regression analyses were conducted using standardized z-scores of all talk measures to aid in interpretability. Regression coefficients for math talk measures represent the estimated change in child outcome score for a one standard deviation increase in talk, holding pretest score constant. * p < 0.05, ** p < 0.01.
Publisher’s Note: MDPI stays neutral with regard to jurisdictional claims in published maps and institutional affiliations.

