Article

Development of a Framework to Assess Challenges to Virtual Education in an Emergency Remote Teaching Environment: A Developing Country Student Perspective—The Case of Peru

by
Enrique Mu
1,*,
Anna Florek-Paszkowska
2 and
Milagros Pereyra-Rojas
3
1
Department of Business Management, Accounting and Ethics, Carlow University, Pittsburgh, PA 15213, USA
2
CENTRUM Católica Graduate Business School, Pontificia Universidad Católica del Perú (PUCP), Lima 15023, Peru
3
Latin American Studies Association, University of Pittsburgh, Pittsburgh, PA 15213, USA
*
Author to whom correspondence should be addressed.
Educ. Sci. 2022, 12(10), 704; https://doi.org/10.3390/educsci12100704
Submission received: 5 September 2022 / Revised: 4 October 2022 / Accepted: 7 October 2022 / Published: 14 October 2022

Abstract

:
The COVID-19 pandemic forced most countries’ higher-education systems to shift to distance learning, which has been called either “Corona Teaching” or, more formally, “Emergency Remote Teaching (ERT).” Students were suddenly faced with a new class format delivery and the many challenges of virtual education. The present study aims to identify and measure the challenges in three stages: (1) a qualitative method approach was used to gather the opinions of 50 students that were then analyzed and coded to identify their perceived major challenges; (2) a survey was completed by 165 students to prioritize the relative importance of the previously identified challenges using the AHP as the weighting approach; (3) an assessment framework was developed, using statistical techniques to measure the extent of the challenges for specific stakeholders based on survey responses. The main challenges students face are inadequate physical facilities at home, difficulties with the learning platforms, and financial concerns. These results are applicable beyond the present research context. For the first time, an ERT assessment framework of the challenges was developed using composite indicators derived from students’ opinions and perspectives. This ERT framework allows for the exploration of a community of students’ vulnerability to the challenges within the context of an emergency remote environment.

1. Introduction

At the beginning of the COVID-19 pandemic (March 2020), many higher education institutions closed their doors for a few weeks to redesign their courses and train their faculty and staff in online instruction. Not all institutions had this opportunity or were savvy enough to thoroughly prepare and quickly switch to virtual instruction. Virtual schooling is possible asynchronously or synchronously. In the asynchronous format, there is no simultaneous student and faculty interaction during class delivery (although there might be some contact in the form of Q&As at the individual or group level). In the synchronous format, the instructor and students participate in a virtual classroom at a specified time. When the pandemic forced institutions to only provide distance education, synchronous virtual education was the format of choice, simply because it most closely resembled in-class instruction. Even so, once classes were restarted in the virtual delivery mode, there was conflicting evidence about how effective this virtual instruction was and the challenges students faced in this new learning format in the context of the pandemic. This was the motivation for the present research about the challenges online university students faced during the pandemic using a student sample from Peru.
Virtual education, also called virtual instruction, virtual learning, technology-mediated learning (TML), or other similar terms, can be defined for the purpose of this study as education mediated by technology; that is, “an environment in which the learner’s interactions with learning materials (readings, assignments, exercises, etc.), peers, and/or instructors are mediated through advanced information technologies” [1] (p. 2). The term “information technology” broadly refers to computing, communication, and data management technologies and their convergence, including the whole ICT spectrum.

1.1. Virtual Instruction

Virtual instruction has been studied for a few decades now. A solid body of research has explored the determinants for successful learning outcomes and students’ satisfaction. For example, Eom and Ashill [2] found that instructor–student dialogue, student–student dialogue, instructor activities, and course design positively affected online user satisfaction and learning outcomes at universities. This finding is important because the first three determinants are fundamentally different in an online format than they are in a classroom setting. Indeed, it is well known that student satisfaction is tightly coupled with the perception of the instructor’s engagement in course interaction, which is more natural in physical classroom settings [3]. There is a debate about whether there is fundamentally less faculty–student interaction online than there is in the physical classroom. Proponents of online education suggest that this is not the case and that the interaction is simply different in web-based learning; therefore, this is a practical and viable option to meet all of the learners’ educational needs [4,5].
Furthermore, online education advocates suggest that online instruction presents a more customized format in which instructors interact with each student [6]. Empirical studies show that skill-based learning outcomes can be equally achieved in online classes as in classroom settings [7]. A marketing perspective has been used to research student satisfaction with online learning. Parahoo, Santally [8] developed a predictive model for this purpose that showed that (in order of importance) university reputation, physical facilities, faculty empathy, and student interaction were needed for student satisfaction with online learning. Additionally, more than 20 years ago, some researchers underlined the importance of integrating distance learning objectives and functions into essential student services and student functions at all organizational units of higher education institutions [9,10]. However, all these studies have been conducted in a common education situation, i.e., students who had chosen to register for online classes and instructors who had agreed (and probably been trained) to teach in that format.

1.2. Emergency Remote Teaching during Covid-19

During the pandemic, students and teachers were forced into a virtual instruction format, which has been called “corona teaching” in the literature [11].The term might be understood as “teaching efforts to use the scarce technological resources available to teach their courses as if they were still in a classroom situation.” In other words, this consists in “virtually transforming face-to-face classes, but without changing the curriculum or the methodology” [11]. This is also consistent with the concept of emergency remote teaching (ERT), which, in contrast with long-planned online experiences, is a temporary shift of instructional delivery to an alternate delivery mode due to crisis circumstances [12,13]. Some studies also refer to this new global experimentation with remote teaching as emergency online education [14]. Indeed, the pandemic forced a quick adaptation to an educational modality never before experienced without the corresponding and necessary training [15,16,17,18,19,20]. This situation caused stress and frustration for teachers, students, and families worldwide. In addition to this stress, there was the ever-present fear of catching the coronavirus infection, death of family members, neighbors, and friends, as well as social isolation, increased screen exposure, and other stressors that caused a range of negative mental health consequences [21,22,23,24,25]. In some cases, this psychosocial process caused trauma and the development of the so-called “coronaphobia”[26]. García-Morales, Garrido-Moreno [27] briefly reviewed the literature to explore the barriers and challenges that universities faced during the COVID-19 disruption and argued that higher education has been transformed as a result. Students reported that a major challenge they experienced was technical problems [28], while other authors highlighted different ways in which virtual education could increase the digital divide [29]. Indeed, inequality observed before the pandemic became even more visible, challenging, and problematic due to the digital divide during the turbulent time of the spread of coronavirus in countries such as Peru [24,30]. In addition, several psychological barriers were reported, such as difficulty in maintaining attention, boredom, and inability to self-organize. Teachers also faced challenges adapting to the new emergency remote teaching environment [31]. Fülop, Breaz [32] analyzed teachers’ acceptance of new technologies and the impact on their well-being and university sustainability in an emerging country (Romania).They found several factors that caused teachers to be discontent when adapting to new technologies during the COVID-19 pandemic. Studies exploring the issues and challenges associated with distance learning in this unusual emergency context are still incipient, especially in developing countries such as Peru where technical facilities and Internet access are limited (Appendix A). This research aims to fill this gap in the literature, which is of great importance because students’ perceived challenges with distance learning, combined with the emergency remote teaching situation, negatively impacts both the expected performance improvements as well as the expected ease of use, both of which will lead to a decrease in acceptance of virtual instruction as a whole. Assessing the state of readiness for virtual instruction is considered to be the best practice to prepare for this type of instruction; however, this assessment needs to take into account the emergency remote teaching circumstances by focusing less on traditional outcomes (e.g., course satisfaction) and more on the context (e.g., home infrastructure), input (e.g., financial resources), and process(e.g., connectivity and computer availability) elements from a student’s perspective [12]. Furthermore, this assessment framework may help train faculty in emergency remote teaching [33].
Therefore, based on the previous literature discussion and, more specifically, following Hodges, Moore [12]’s recommendation of exploring broad questions while focusing the assessment on context, input, and process, the following research questions were proposed:
  • RQ1: What are the most common challenges students face in virtual instruction within the context of a pandemic?
  • RQ2: What is the importance of these virtual instruction challenges from the students’ perspective?
  • RQ3: Is it possible to assess the extent of challenges faced by online students?
The first research question is exploratory, which suggests a qualitative method approach, while the second and third questions constitute an assessment of the findings of the first question and was established using a quantitative approach. In summary, this study’s use of mixed-method research fits the rationale for applying this approach [34] and concludes with the development of an assessment framework to evaluate the challenges of the emergency remote teaching environment (ERT) within the context of the pandemic in Peru, but which are also important to other ERT environments.

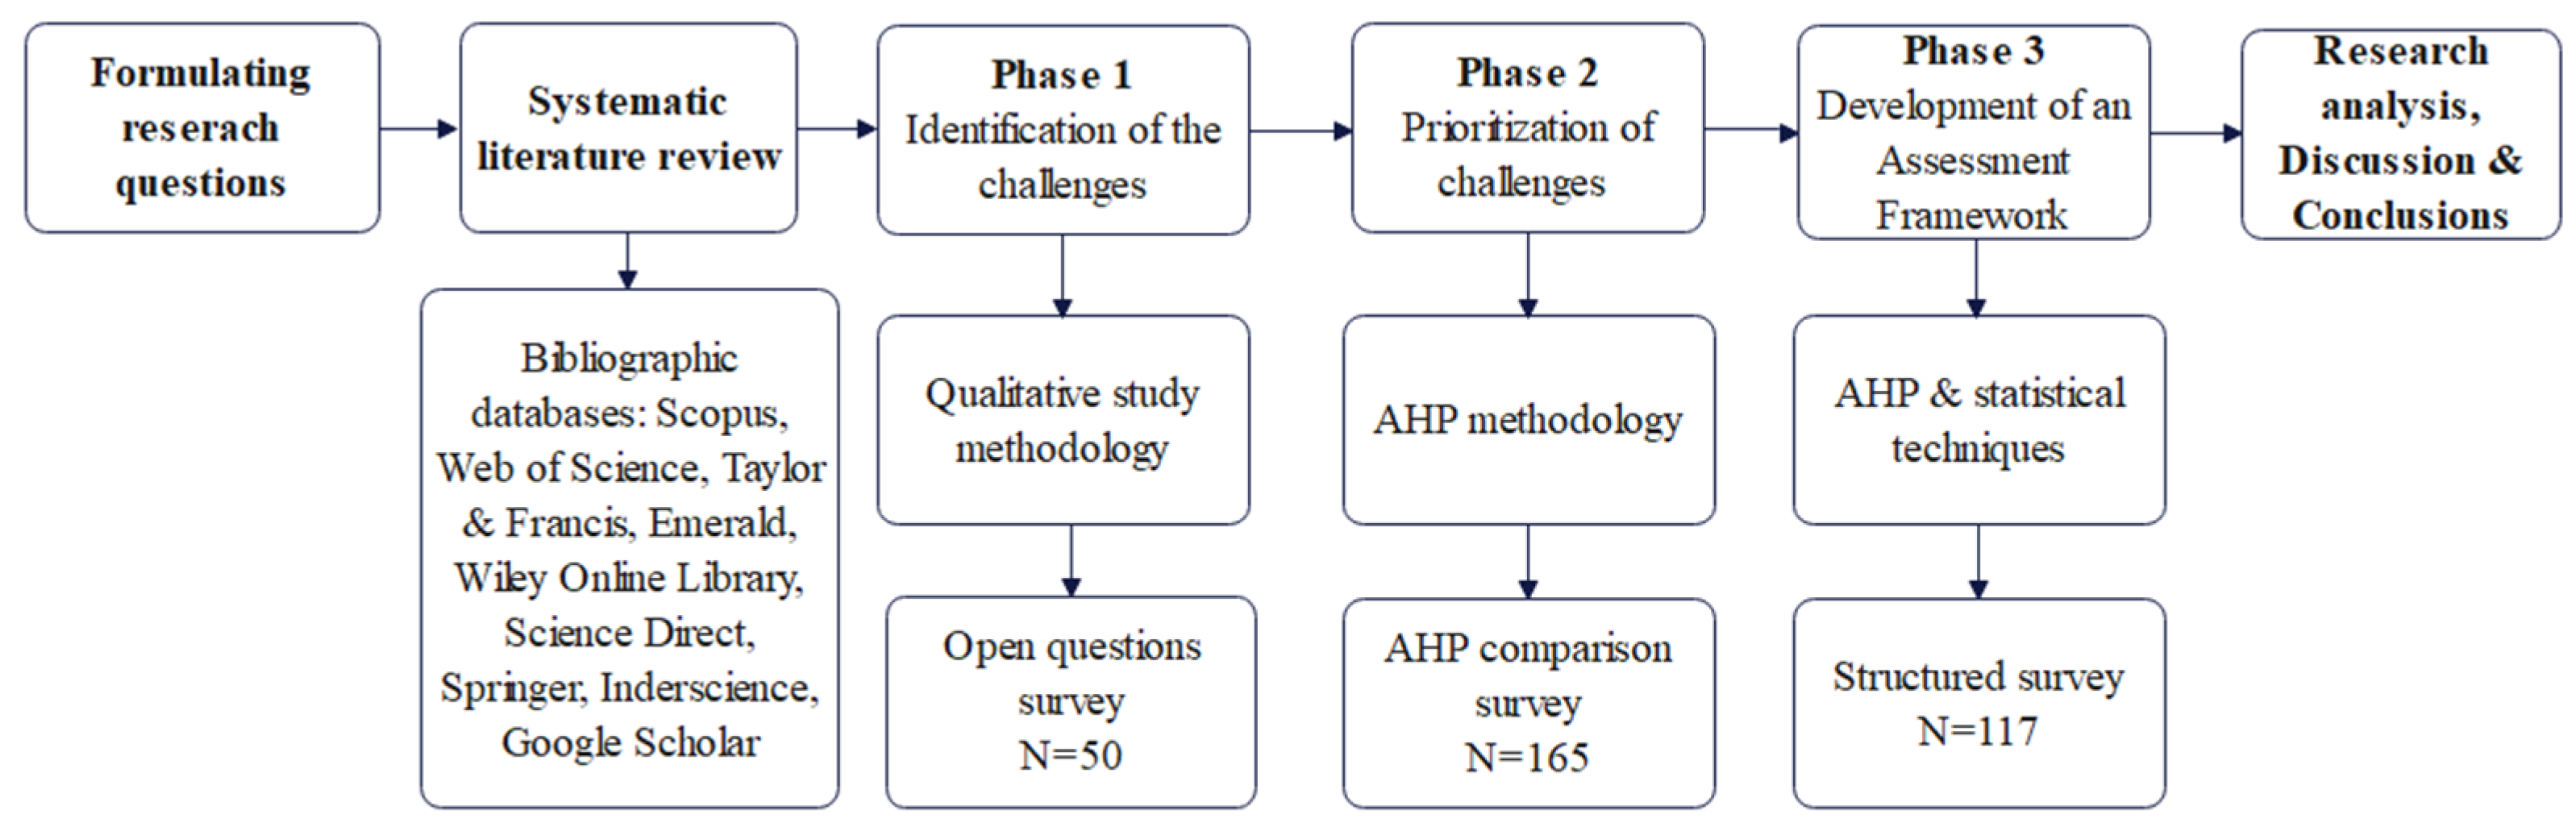
2. Materials and Methods

This study has three phases: first, identification of the challenges of virtual education in the context of the pandemic (open question survey); second, prioritization of those challenges (AHP pairwise comparison survey), and third, development of a virtual challenge assessment framework. The methodology and materials used for the three phases of this research are summarized in Figure 1.

2.1. Methodology for Phase I: Identification of the Challenges of Distance Learning

Given that a study of the challenges of virtual instruction within the context of a health crisis is rare or even unprecedented, it was decided that a qualitative study would be used in this phase. A traditional closed survey would have been highly inaccurate and incomplete in this study stage due to The novelty of the research subject matter and the many unknowns, especially in a developing country such as Peru. The lack of remote work experience among professors, students, and other family members on such a vast scale during the state of emergency and developing pandemic was another complication. Qualitative research is recommended for unprecedented and poorly understood situations, so a qualitative approach was used for the first stage of this study. The lockdown prevented organizing personal meetings to conduct surveys with respondents; therefore, the Peruvian Institute of Public Opinion (IOP) offered to collect survey data online1. The open qualitative questions (4, 5, 6, and 7 in the survey) were as follows:
  • RQ4. What problems do YOU face learning using virtual instruction?
  • RQ5. What problems does YOUR INSTITUTION face using virtual instruction?
  • RQ6. What problems does YOUR FAMILY face due to virtual instruction?
  • RQ7. What INFRASTRUCTURE problems do you face at home using virtual instruction?
Participants were allowed to list up to ten problems for each dimension/question. The IOP e-mailed potential student participants and posted the survey on college websites to collect responses from students associated with their host higher-education institution from June–July 2020. Since the survey was posted on websites, it was impossible to determine a response rate. The responses were meticulously, individually, and independently coded by two of the authors until theoretical saturation was reached. In qualitative analysis, the sample size is considered adequate when theoretical saturation is reached [35]. Theoretical saturation occurs when no new properties of the data categories emerge in further data collection [35]. In this study, once the authors had analyzed 50 cases, no new codes were created; theoretical saturation had been reached. Theoretical saturation means that codes (based on distinctive responses) and categories (based on a grouping of related responses) became repetitive, and there was no need to create new answer codes or group them into new categories. The demographics of the participants in the qualitative research phase are given in Table 1.
Once the responses to the open questions were collected, they were coded and assembled into thematic groups following standard practices for this type of qualitative study [36]. Seven major challenge thematic groups: quality of virtual instruction (C1), connectivity & equipment (C2), personal issues (C3), home infrastructure & study environment (C4), learning platform & access to resources (C5), financials (C6) and university administration & costs (C7) were identified and will be discussed in Section 3 of this study.

2.2. Methodology for Phase II: Prioritization of Challenges

Once specific challenge groups had been identified, it was decided that a survey research approach was most suitable to prioritize these challenges. The participants were asked to pairwise compare the seven major challenge groups (C1 to C7) to calculate their relative priorities (weights) using the Analytic Hierarchy Process (AHP) methodology [37]. The responses to the indicators’ questions and the calculated priorities (weights) in this stage were then used to develop an AHP assessment framework (see Appendix B for a brief discussion of the AHP methodology).
Five hundred seventy postgraduate MBA students from one of the top private Peruvian universities were invited to participate in this survey. Of this total, 165 students responded, yielding a survey response rate of 29%. The results were analyzed using the Analytic Hierarchy Process (AHP) to derive their relative importance (priorities). During this prioritization phase, efforts to comply with accepted best practices in AHP studies were heeded [38]. The participants’ demographics are provided in Table 2.

2.3. Methodology for Phase III: Development of an Assessment Framework

The most frequent quotes within each previously identified category (C1 to C7) in Phase I (Table 3) became the variables’ indicators (survey questions). They were edited to be in the form of a question (Q10 to Q20), each with sub-questions, and administered as part of the survey in the previous phase. Standard procedures for the construction of this type of assessment framework were followed according to established practices [39,40].
An indicator is “a quantitative or qualitative measure derived from a series of observed facts that can reveal a relative position in a given area and, when measured over time, can point out the direction of change.” [39] (p. 7). This direction of change may help identify performance trends and highlight potential issues needing improvement. In this study, each indicator is constituted by the response to one of the questions posed in the survey (Appendix A: Q10–Q20). These indicators can be converted into thematic indicators by grouping them along with common themes or categories (Challenges C1 to C7 in this study). A composite indicator is the compilation of the thematic indicators into a synthetic index and is presented as a measure of a challenge dimension.
There is a rich tradition of using AHP-based assessment frameworks taking advantage of the rating model approach. These frameworks have been used to evaluate proposals, such as vendor assessment in public bids [41] and similar evaluation tasks [42]. More recently, they have also been employed, in combination with advanced statistical techniques, as a psychometric assessment tool for organizational behavioral dimensions [43]. Following these practices, the questionnaire used in the previous stage also included questions developed from the most frequent quotes from students in the qualitative phase of the study. Based on this, an AHP assessment model for the top virtual instruction challenges in the context of the pandemic was proposed, as shown in Figure 2. Each challenge constitutes one of the dimensions to be considered when assessing the challenges to virtual instruction. Below each challenge dimension, a list of survey questions (also called indicators) was developed to assess the specific dimension.

3. Results

Next, the results of the data analysis for each of the three phases will be provided.

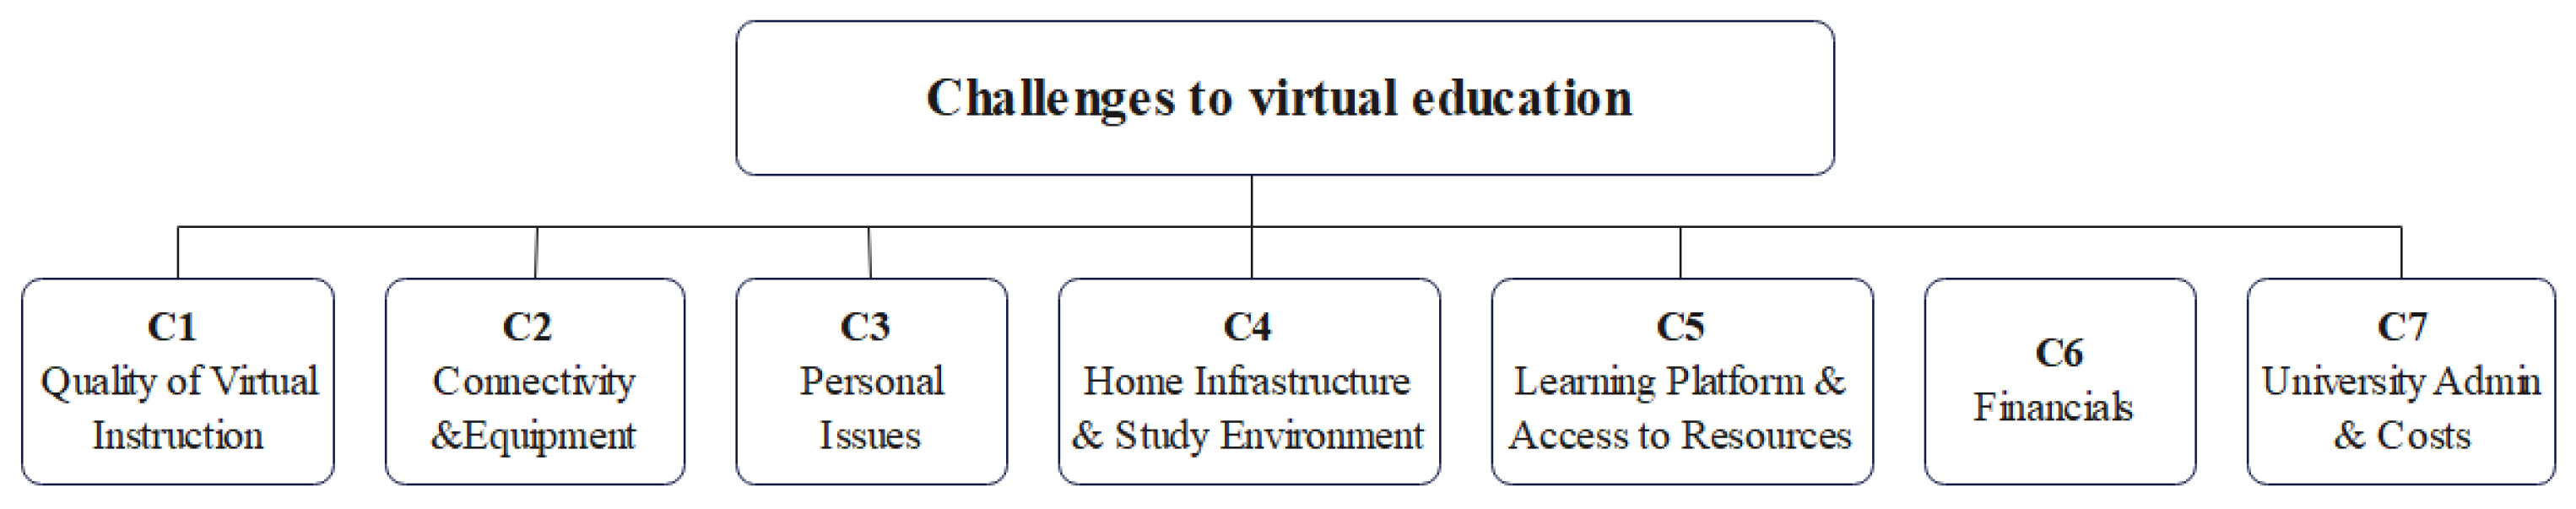
3.1. Phase I Results: Identification of the Challenges of Distance Learning

In this phase, the responses of the 50 participants to the proposed four open questions were coded into thematic challenges. For coding purposes, one of the authors read the answers to each question, created codes for the responses to each question, and grouped the codes into common themes. For example, the coded responses “201—Not appropriate environment to study” and “202—Interruptions…” were grouped under the theme “200—Inadequate Environment to Study”. The coding process followed standard recommendations for qualitative studies [36]. Next, another author who had not participated in the first analysis read the answers to each question, tried to code the answers according to the codes and themes created by the first analyst, and added new codes/categories as needed. There was a 5% discrepancy rate between the two authors’ coding, mainly placing a coded answer within a specific theme rather than within the themes themselves. The discrepancies were discussed, and an agreement was reached when needed. The most important result of this exercise was that the codes and, more importantly, the theme grouping of the codes or themes made sense.
To summarize the data analysis process, the codes (a total of 153) correspond to I.D.s given to specific different answers (e.g., answer codes 601–607 in Table 4) provided by participants, and the themes (a total of 16 in Table 3) were created as a grouping of codes with a standard topic answer (e.g., the set of answer codes 601–607 constitutes the theme “600—Access to Resources” as shown in Table 3). When a participant provided an answer semantically identical to a previous response, a new code was not created, but the frequency count for the specific answer code was increased.
The final grouping of codes into similar themes and their frequency count is shown in Table 4.
A further examination of the themes in Table 3 allowed for those with close or similar ideas to be grouped into higher-level categories. For example, the themes coded 100 and 150 refer to challenges related to Internet connectivity and lack of proper equipment; therefore, they can be considered a single higher-level challenge or category or can also be shown as a cluster of the original themes. Each grouping of themes (from Table 4) into higher-level categories is summarized in Table 5.
The categories (or groups of challenges) presented in Table 5 were listed in their count frequency in the coded participants’ responses. A detailed discussion of these grouped themes (C1 to C7), as shown in Table 5, is as follows:
  • C1—The perceived quality of virtual instruction
This challenge constituted 26% of the answers and is the largest grouped category; this challenge was the most common concern among the students. This included concerns related to the quality of teaching (19%, code 400), exams (1%, 500), and the lack of class interaction (5%, code 700). This challenge can be defined as the student’s perception that the quality of virtual instruction is lesser than its physical counterpart due to the lack of class interactions (either among peers or with faculty) and suitable course assessment. Related quotes2:
“Faculty are poorly trained to teach in a virtual environment”
[C7P7_1]
“Instruction quality is lower”
[C31P6_1]
“Class time is less than in physical sessions”
[C13P6_3]
“The most important thing in my career is practice, which is difficult to do…”
[C13P6_1] (an architecture student)
“Too many [exam] questions for such a short time”
[C41P6_2]
“Class participation is not the same in a virtual environment”
[C40P6_1]
  • C2—Connectivity and proper equipment
This challenge constituted 22% of the answers and is the second-largest cluster of issues. Within this category, 90% of the responses were related to the students’ technology limitations (code 100), and the rest were about the institution’s limitations (code 150). This challenge is defined as lacking suitable Internet connectivity or equipment to participate in virtual education classes. Related quotes:
“There are not enough computers [for everybody] at home”
[C8P8_1]
“My brothers have to study online, and there are not enough computers for all of us”
[C24P8_2]
“Connection problems in peak hours”
[C48P6_3]
“Not all of us have the opportunity to have Internet access”
[C6P7_1]
“More than 50% of students do not have Internet access”
[C50P7_2]
“I think that internet access to both faculty and students is something…that could be improved”
[C1P7_1]
“[University] servers cannot cope with the traffic”
[C8P7_1]
  • C3—Home infrastructure and study environment
The third-largest cluster (17%) can be defined as the student’s lack of proper infrastructure (e.g., a desk) and study environment at home (e.g., lack of privacy, noisy family). Related quotes:
“Too much noise and little space to study at home”
[C36P8_2]
“I don’t have either a suitable chair or table, so I study in bed”
[C26P9_1]
“I don’t have a suitable place to listen to my classes. I ask [my family] to be quiet”
[C16P8_1]
“And there are three of us sitting at the same table”
[C19P8_3]
  • C4—Personal issues
This cluster included issues such as personal issues (e.g., physical exhaustion, code 800), organizational issues (e.g., time management, code 900), and mental health (code 1000). It can be defined as the set of challenges related to physical and cognitive issues at a personal level. Nine percent of students surveyed a reported difficulty concentrating and physical exhaustion, five percent expressed problems organizing their work and their family life, and six percent directly reported coping with mental issues such as depression. This group constitutes 20% of the total responses (the third largest category). Related quotes:
“I do not have spaces for either recreation or sharing with peers”
[C8P6_1]
“Get tired of spending so much time in front of a screen”
[C39P6_1]
“I pay little attention to the class”
[C26P8_2]
“I need to care for the little ones while my parents are at work”
[C34P8_2]
“Lockdown gets young people depressed”
[C11P6_5]
“[I have a] family, friends who are either sick or have died”
[C18P6_1]
“They [university] don’t care about our mental health”
[C20P7_4]
  • C5—Distance learning resources
This challenge cluster can be defined as the ability of the student to use and access the distance learning platform (code 300) and learning resources at large in the institution (code 600). There may be difficulties accessing the learning platform due to a lack of information and its extreme complexity. Additionally, students complained about the lack of access to physical and academic material (e.g., books, labs). About 3% considered the platform too cumbersome to be appropriately used, and 4% complained about the lack of access to library books. Related quotes:
“Lack of expertise to use the platform by both teachers and students”
[C50P6_6]
“I don’t have access to needed services (e.g., printer…)”
[C30P6_7]
“Not having access to library books”
[C18P6_1]
  • C6—Finances
This challenge can be defined as the student’s financial concerns that impact education. These concerns may be directly related to the student’s (code 850) or the family’s financial situation (code 1300) during the pandemic. This cluster constitutes the fourth most commonly reported challenge, 10% of the total. Related quotes:
“I struggle to pay monthly university fees”
[C31P6_2]
“[My family’s] economic problems [are] the main problem”
[C50P8_1]
“Salary reduction for the only family provider”
[C30P8_1]
  • C7—University administration and costs
This challenge cluster can be defined as those non-technical concerns related to the university (e.g., lack of leadership during the crisis, code 1200) and other miscellaneous issues (code 1100). These responses constituted 2.6% of the total answers. Related quotes:
“University tuition has not decreased even though we are not using their facilities anymore”
[C02P7_01, C41P7_01, C45P7_01]
“They [universities] have no concern for students economic situation. They ignore our requests to decrease tuition”
[C21P7_02]
“University authorities and faculty lack leadership”
[C51P7_01]
In summary, the four most prevalent challenges reported for distance learning are as follows:
  • Quality of instruction/learning;
  • Poor Internet connectivity and lack of proper equipment;
  • Personal and psychological issues;
  • Lack of appropriate home infrastructure.
The following three challenges were next in prevalence, although they were reported with less frequency:
  • Learning platform and access to resources;
  • Financial issues related to students and families;
  • General concerns related to the university and others.

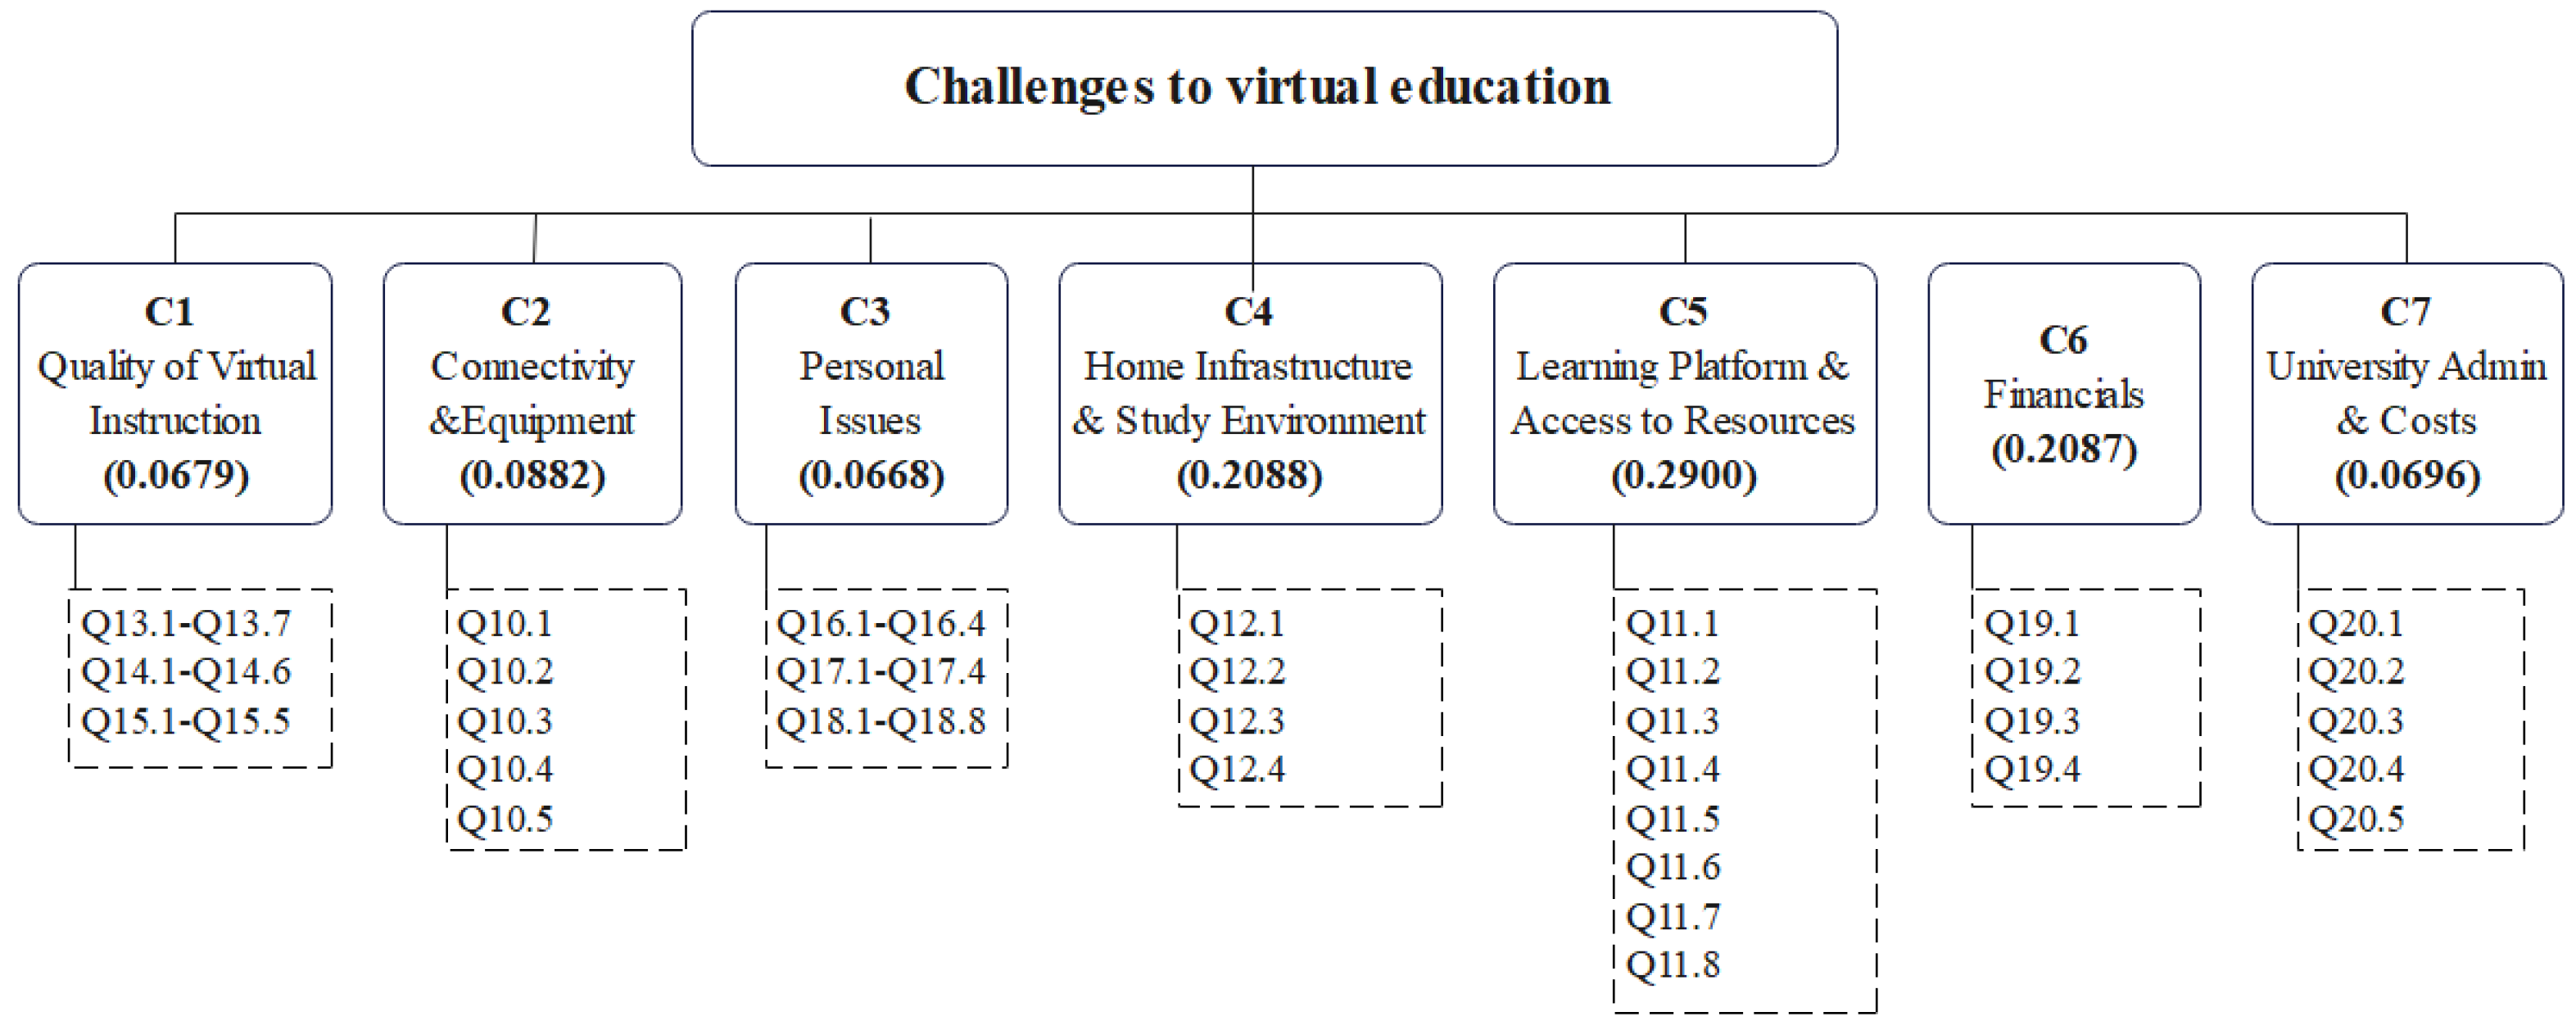
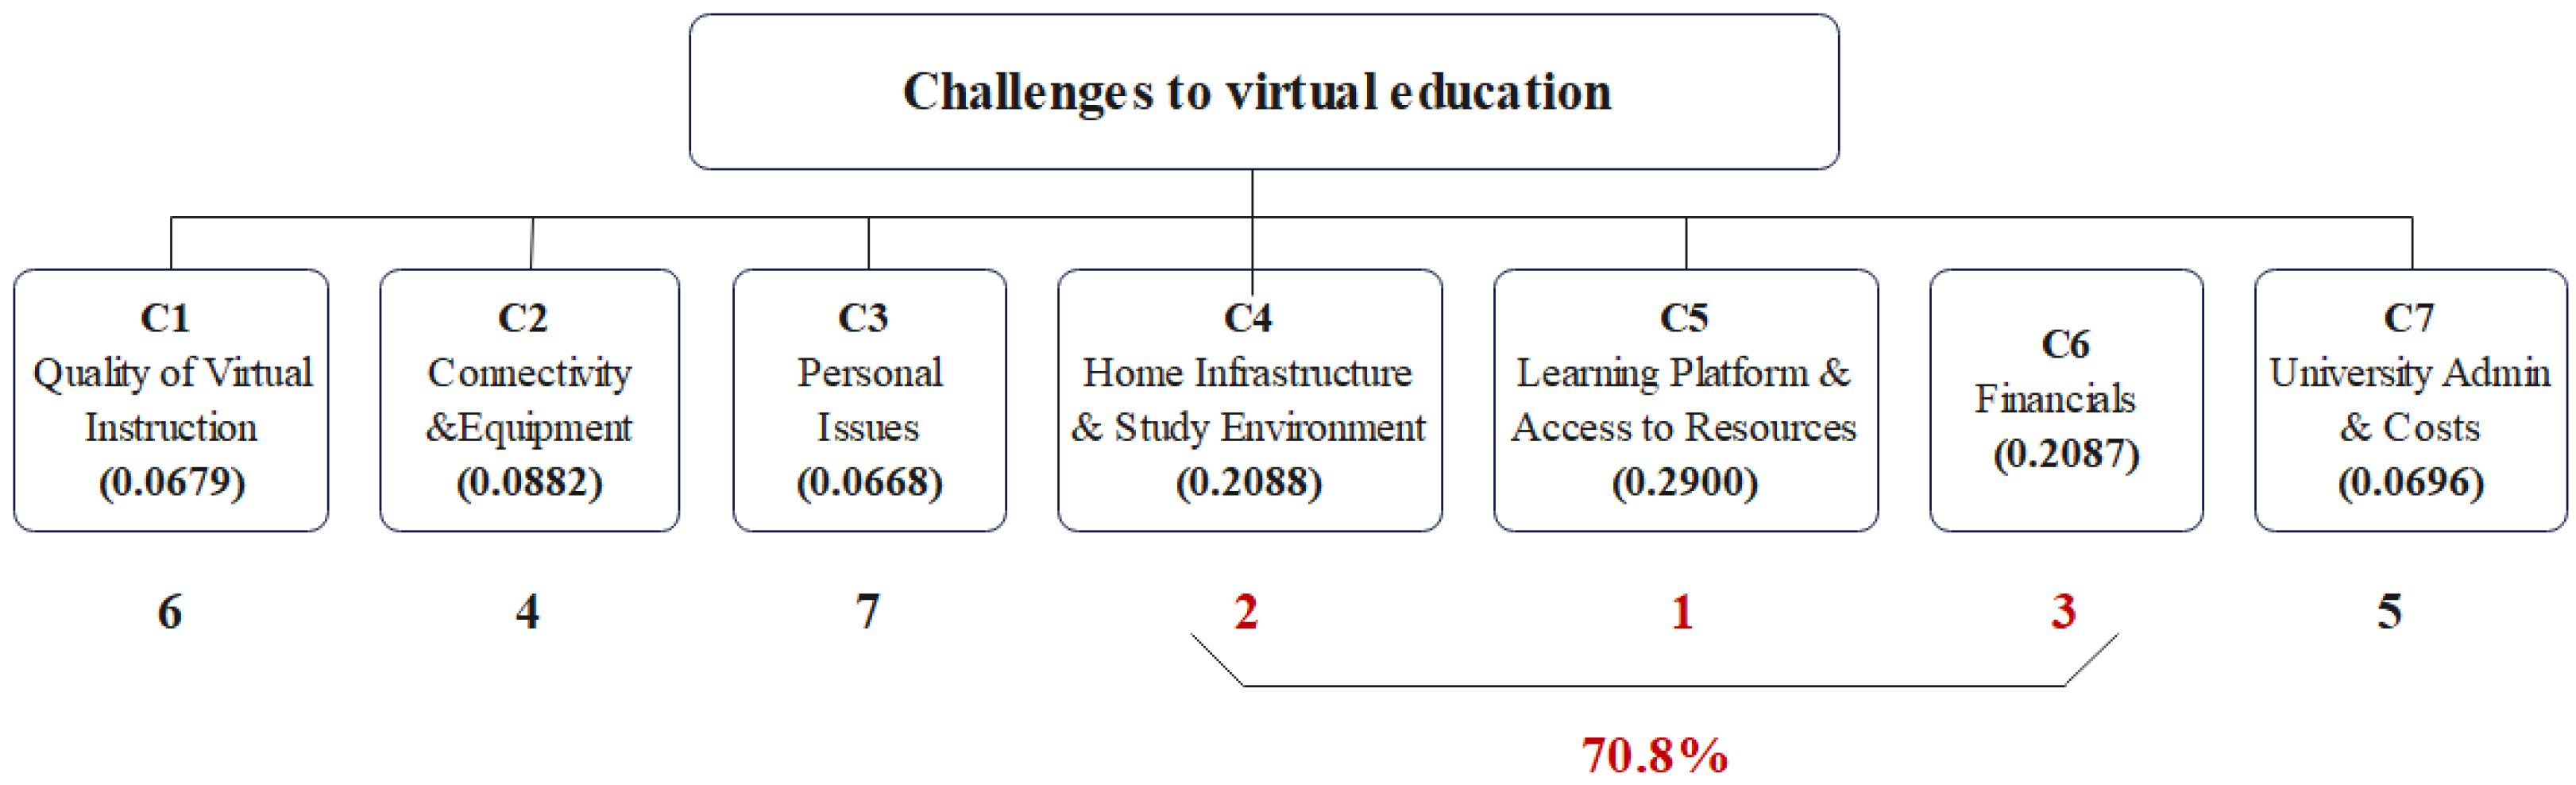
3.2. Phase II Results: Prioritization of Virtual Instruction Challenges

The first stage of this study identified the challenges faced by distance learning students. The frequency of quotes about these challenges allowed the researchers to identify the students’ everyday challenges but not their level of importance. Once the difficulties were identified and categorized, the second stage of the research aimed to prioritize the challenges based on the students’ perceptions.
In the first stage of this study, seven challenges (or clusters of challenges) were identified as follows: (C1) Learning and Instruction Quality, (C2) Connectivity and Equipment, (C3) Personal Issues, (C4) Home Infrastructure and Study Environment, (C5) Distance Learning Resources, (C6) Finances, and (C7) University Administration and Costs. The Analytic Hierarchy Process (AHP) method was applied to determine the relative importance of the presented challenges (C1–C7), and pairwise comparison questions were created. The first step in the AHP method requires formulating the prioritization as a hierarchical model, as shown in Figure 3 for this specific task.
The second step required asking the participant(s) a series of pairwise comparison questions related to the relative importance of the challenges. These data are used to derive the relative weights or importance of the challenges.
The comparison questions were formulated as follows: “with respect to the challenge importance3, which is more important for you?”; “C1—Learning & Instruction Quality” or “C2—Information Technology”? Once the more important criterion was determined, the question was, “To what extent…?” The participant had to select a relative intensity using Saaty’s fundamental scale from 1 to 9, which ranges from “Equally important” to “Extremely more important” (see Appendix B for an example of survey questions).
Following standard practice in AHP survey research to address consistency in group judgments, a minimum spanning tree approach was used, i.e., asking only comparison questions above the main diagonal [44]. This way, only six comparisons (C1:C2, C2:C3, C3:C4, C4:C5, C5:C6, and C6:C7) were needed, and a consistency ratio of 0 was assured. The other judgments in the pairwise comparison matrix were calculated (e.g., C1/C3 can be calculated as the result of multiplying the judgments (C1/C2) * (C2/C3)). This is common in similar studies because anonymous surveys do not allow for negotiating judgments with the individual participants to address consistency issues [45]. The pairwise comparison (PWC) matrices of all the survey respondents were combined using a geometric mean to create an aggregated PWC matrix. Finally, the overall priorities were calculated by simply normalizing the pairwise comparison matrix (see Appendix B for a more detailed explanation). The priority results are shown in Figure 4.
These results show that students consider the following challenges of virtual education as the most important (70.8% of the overall importance):
  • C4—Lack of proper home infrastructure and study environment (W4 = 0.2088);
  • C5—Learning platform and access to resources (W5 = 0.2900);
  • C6—Financial issues related to students and families (W6 = 0.2087).
These three challenges combined constitute 70.8% of the overall importance. On the other hand, the most commonly occurring issues, as reported by the students (Table 3), were C1 (quality of virtual instruction), C2 (connectivity and proper equipment), and C3 (personal issues). However, high counts of student reports of a challenge suggest prevalence, but not necessarily the level of importance, as this prioritization phase of the study unveils. In other words, an AHP analysis allows us to determine the priority or degree of importance(based on the stakeholders themselves) and which challenges must be addressed first due to their pressing importance.

3.3. Phase III Results: Development of a Virtual Instruction Challenge Assessment Framework

The development of a virtual instruction challenge assessment framework requires composite indicators and synthesis indices of individual indicators that have been widely used in policy analysis and public communication [39]. They have been beneficial for benchmarking country performances, and their number has been steadily increasing since the milestone survey review by Bandura [46].

3.3.1. Identification and Development of Relevant Indicators/Variables

The availability of usable data that could become relevant indicators constitutes one of the most challenging parts of the process. The advantage of the current study is identifying the variables directly from the stakeholders (survey respondents) during the first phase (qualitative approach) and quantifying them in phase II of the research. Standard statistical techniques such as listwise deletion for missing data were used to process the collected data and ensure their overall quality before use.
The approach to developing indicators based on stakeholders’ input uses the most frequently quoted statements as questions to assess each of the constructs (challenge clusters: C1 to C7) proposed in the study. This helps develop a tentative survey to determine this study’s challenge clusters (C1 to C7). The original set consists of 60 questions (indicators) unequally distributed among the seven categories, as shown in Figure 2.

3.3.2. Standardization of Variables to Allow Comparisons

There is a need to standardize or normalize the variables before aggregating them. A problem occurs when the different indicators correspond to other variables expressed in their units (e.g., income, population, age). However, standardization is not a problem for survey data collected through a standard scale. Furthermore, when using AHP rating models, the scales of the variables (C1 to C7) are further standardized to allow for the aggregation of the variables [47].

3.3.3. The Weighting of Assessment Variables

The aggregated variables (C1 to C7 in the study) must first be weighted. While it is not unusual to consider all the variables equally weighted for simplicity, these weights are vital because stakeholders do not consider the different dimensions to be equally important and because they seriously impact the overall assessment score. Additionally, it is reasonable to expect that not all the variables will have an equal impact or be considered equally important by the different stakeholders. Fortunately, the C1–C7 variables had already been weighted using an AHP approach through surveying students in the previous phase of this study (Figure 4).
One important consideration is the aggregation of the indicators used for each challenge category. While indicators have been collected for each variable, it is necessary to determine whether the indicators converge toward a single variable and can therefore be aggregated. Greco, Ishizaka [48] reviewed the issues surrounding composite indicators’ weighting, aggregation, and robustness. In particular, they identified many participatory methods for this purpose, such as the Analytic Hierarchy Process (AHP), the Budget Allocation Process, and Conjoint Analysis. They also identified data-driven weighting methods such as Correlation Analysis, Multiple Linear Regression Analysis, Data Envelopment Analysis (DEA), and Principal Component and Factor Analysis. Furthermore, they discussed the strengths and weaknesses of using these methods. They concluded that using one or the other depended on the nature and use of the assessment framework.
For this study, the decision was made to use principal component and exploratory factor analysis (EFA) to analyze the convergence of the individual indicators into their thematic variables or categories (C1 to C7), given that this is a common and well-known approach for this purpose. This approach allows for those indicators whose contribution to the variable scale (loading factors) may be too low to be considered, or whose contribution to the internal reliability of the variable (measured as scale reliability through Cronbach’s Alpha coefficient) may be detrimental to be discarded. Additionally, by determining an upper threshold for an indicator to be present as well as a lower threshold for an indicator to be discarded during the EFA (exploratory factor analysis) process, there is no need to take into account the now minor loading differences of the surviving indicators (survey items) of each construct. They can be equally aggregated to obtain each of their corresponding challenge variables. Loading factors of 0.4 are widely used as a lower threshold [49]. Another commonly used recommendation is that for a sample size of 100, the loading should be greater than 0.512; for 200, it should be greater than 0.364 [50]. The sample size for this study phase was between 100 and 200; therefore, the lower threshold of 0.4 was considered reasonable. Still, most factors’ loading was significantly above 0.512, usually in the 0.7–0.9 range (EFA original statistical results are shown in Appendix C). The summary of the scale reliability and measurement variables is given in Table 6.
On the other hand, the Analytic Hierarchy Process (AHP) was used to weight the significant categories (C1 to C7), which allows for the prioritization of the different challenge variables identified by stakeholders4 through pairwise comparisons. It can easily integrate each stakeholder’s weighting judgment into the prioritization process, which makes the AHP a highly convenient weighting process. Greco, Ishizaka [48] recognize this technique’s importance and popularity and argue that the only drawback is that the number of pairwise comparisons may be too high for the participants. By only asking for the minimum set of comparisons needed to calculate all the remaining ones, the total number of pairwise comparisons was six. The weighting of the different dimensions or challenge variables was already available from the prioritization of challenges in the previous phase of this research (Figure 4). As a result of the analysis in this section, the final AHP assessment framework can be defined as shown in Figure 5. The respective survey questions are provided in Appendix E.

3.3.4. Sensitivity Analysis

Given that the assessment index results may depend heavily on selecting, weighing, standardizing, and aggregating the variables, sensitivity tests are recommended when using assessment frameworks based on composite indicators [39,40]. The present study grouped the indicators into specific variables (challenge dimensions) according to their EFA construct loadings. The values of the variables were already standardized since the data were collected through a standard scale (1—least challenged to 5—most challenged). When using an assessment framework, it is good practice to explore how robust the results would be if the variable weights differed. For this purpose, the assessment process and related sensitivity analysis are illustrated in a case study in Appendix D.

4. Discussion

While other studies have found similar results in semi-structured surveys [28], this current study, due to the different phases of identification, prioritization, and statistical analysis of each challenge item as an assessment indicator, allows for a more refined discussion of the challenges of virtual instruction, not just within the context of the COVID-19 pandemic but also within the broader context of emergency remote teaching. Table 7 summarizes the results obtained in the present study based on the results of phase I and II of the present research and references in the literature.
The perception of the quality of virtual instruction/learning (C1) as being lesser than that of face-to-face learning was the most common claim by students in this study (Table 7) and has been recognized as an essential challenge for students (as well as for many teachers) by many researchers despite the extensive literature proving otherwise [12,51]. However, it was possible to identify two different types of student statements in the present study. Those related to objective claims such as “Class time is less than in physical sessions” and “Too many exam questions for such a short time” and those rather generic or subjective in nature, such as “instruction quality is lower” in the virtual mode. It is worth noting that in all these cases, virtual instruction is measured using the face-to-face methodology as the reference for good practices rather than accepting that they are different teaching delivery modes. Indeed, class time in virtual instruction may be less than in physical sessions because many practitioners argue that it is harder for students to stay focused for a long time in virtual sessions [52]. In other words, the length of a class is not a measure of its quality.
Similarly, the only way to assess whether a number of questions are suitable for a specific period depends on the level of difficulty both in content and form (e.g., short essay) of the questions. In summary, the perception of lower quality virtual instruction seems to have a significant component of mental model prejudice that considers face-to-face teaching as the ideal mode and compares the different processes of virtual instruction against them. Furthermore, this prejudicial perception of lower quality instruction should not be surprising among students who were forced to switch teaching delivery formats almost overnight due to the pandemic without any strategic assessment. The argument here is also supported by the fact that during the prioritization phase of the study, the students gave less importance to this category of Quality of Instruction (relative weight of 6.8%) than to the categories of Learning Platform and Access to Resources (29.0%), Home infrastructure and Learning Environment (20.9%), and Financial Issues (20.9%) as shown in Table 7. Another possible explanation for the results is that the prioritization phase took place a few weeks later than the identification phase. Either the perceived quality of instruction had improved in those few weeks, or the students had not accepted this lower quality mode of instruction (the alternative was no instruction at all) but were now more concerned about the practical issues just mentioned.
Technical issues have also been recognized as important, and by some researchers [28], as the most crucial challenge faced by students during the pandemic emergency remote teaching. The current study was able to dig deeper into this issue and identified two types of technical issues: Connectivity and Equipment (C2) and Learning Platform and Access (C5).The first technical challenge (C2) refers to the availability of proper Internet connectivity and suitable equipment to participate in virtual instruction. In contrast, (C5) refers to the ability to understand and access the course learning platforms and the university’s online resources. Availability of Internet connection and proper equipment (C2) is a key component of the digital divide which was expected to be aggravated by the pandemic [53]. During phase I of the current study (qualitative),the student participants frequently mentioned this challenge (ranked #2 in Table 7) with quotes such as “There are not enough computers at home,” “Connection problems in peak hours,”, etc., while the access to the learning platforms and resources (“Lack of expertise to use the platform by both teachers and students, ”I don’t have access to needed services [e.g., printers]”, “…library books”) was considered to be less of an issue (ranked #5). However, during phase II of this study, which took place two months after the first one, the survey of 165 students showed that Connectivity and Equipment was not (or no longer) the most important technical challenge for students (8.8% of importance), but rather the issues with the Learning Platform and Access to resources (29.0%) were more important as shown in Table 7. Why the difference from phase I to phase II? The ideal explanation would be that there were improvements to the digital divide and those who had problems obtaining Internet connectivity and equipment had solved their issues; however, a more likely explanation is that the students with these problems got accustomed to their limitations and due to this, the issues with the learning platforms as well as the access to academic resources became the next challenging technical online issue5 Additionally, keeping in mind that a large number of participating students (about half the students) had never had a single online course (as derived from the demographics section of the survey),their experience dealing with learning platforms was minimal. In other words, the issues with learning platforms may have been caused in many cases by their lack of familiarity or insufficient training rather than by technical issues. Access to resources, sometimes as essential as printers and library books, imposed a more critical challenge, particularly for students who required laboratory classes. This concern about laboratory access has been expressed by students pursuing science and engineering disciplines in other countries such as China [54].
The qualitative stage of this study (phase I) also allowed for the identification of Personal and Psychological Issues (C3), such as the impact of a lack social interaction with peers and friends. Student quotes such as “I don’t have spaces for recreation or sharing with peers,” “…get tired in front of a screen”, and ”Lockdown gets young people depressed” were ubiquitous and led to ranking these challenges as #3 in the qualitative phase of the study (Table 7). In all fairness, many of these challenges are mainly related to the emergency remote teaching environment created by the pandemic and associated lockdown more than by the nature of virtual teaching itself. Virtual education does not stop people from having a face-to-face social life with friends and family, but the pandemic lockdown did. Furthermore, the severity of the pandemic implied that students (and everyone) felt as ifCOVID-19 infection was a sword of Damocles hanging over everyone’s head (“[I have a] family, friends who are either sick or have died”). While the qualitative phase showed these personal issues to be significant (ranked #3 in Table 7), a few weeks later, they had become far less important (6.7%) than most of the other challenges, as shown in Figure 4. Still, the lesson is that these personal and psychological issues are critical and should be dealt with early in an emergency remote teaching situation.
One virtual challenge, particularly related to the context of developing countries, was given by identifying Home Infrastructure and Study Environment (C3) as a significant challenge for students. Some quotes, such as “Too much noise and little space to study at home”, “I don’t have a suitable chair, nor table, so I study in bed”, and “There are three of us sitting at the same table” showed the reality of many students struggling with the online classes during the pandemic in a developing country. Interestingly, this challenge was frequently mentioned during phase I of the present study (ranked #3 in Table 7). At the same time, it retained its importance during phase II, namely the prioritization of the challenges (20.9% of the relative importance in Figure 4). In hindsight, this makes sense because changes to a home infrastructure are not easily achieved or are not always possible. This challenge is the one that is most related to socio-economic considerations. Adding a room or study space to a house is not easy. Home Infrastructure was identified as an important challenge during phase I of the study (ranked #4 in Table 7), and it was prioritized as one of the top three concerns (20.9% of the importance in Figure 4) during phase II. Therefore, this is undoubtedly an essential consideration for students in emergency remote teaching environments in developing countries. This Home Infrastructure and Study Environment challenge has also been found in many other countries in the developing world such as countries in the African continent, exposing the problems of virtual education caused by socio-economic differences [55].
Another challenge of importance for students was the financial concerns related to not only paying university tuition6 but also the viability of their overall family subsistence. Quotes such as “I struggle to pay monthly university fees”, [My family] economic problems [is the] main problem”, and “Salary reduction for the only family provider” illustrate the great importance of Financial Issues related to students and families (C6). This challenge was prioritized as the third most crucial issue during phase II of the present study (20.9% in Figure 4) and the students’ sixth most frequently mentioned concern (Table 7). This challenge is related to problems derived from socio-economic status that were aggravated during the pandemic and were also identified by other researchers [29,55].
There were also challenges related to General Concerns with the University (C7) costs and attitudes. Students perceived that university tuition costs should have been decreased given that the physical facilities were not being used. In general, they complained that the universities were not as concerned as they should have been about the students’ economic situation (“…they ignore our requests…”, “University and faculty authorities lack leadership”). The study’s first phase showed this as the least ranked challenge (7th ranked, Table 7), similar to the prioritization during the second phase, which also showed it to be the least essential concern (about 7% of relative importance in Table 7).
Finally, a significant and novel contribution of the present study is that by using the derived information on the challenges faced by students through direct data collection during the two phases of the study (identification and prioritization), it was possible to develop an assessment framework (during their phase).This may allow the evaluation of the exposure of student communities in emergency remote teaching environments and the progress of interventions (by using the assessment framework before and after the intervention) to address the identified challenges. To our knowledge, no student perspective assessment frameworks have previously been developed. So far, the knowledge acquired during the COVID-19 pandemic is also applicable to other emergency remote teaching environments worldwide, particularly in developing countries.

5. Conclusions

During the pandemic, governments worldwide closed all educational institutions to control the spread of the SARS-CoV-2 virus. This forced educational institutions to adapt quickly and move forward by providing unplanned online learning, also called emergency remote teaching (ERT), directly impacting and challenging the students, teachers, and universities. At the beginning of the pandemic, when this study was started, there was no other research about ERT challenges within the context of a pandemic. This study aimed to identify the challenges students face in an ERT environment and in a developing country such as Peru, and to create an assessment framework to evaluate those challenges and to be used by communities of at-risk students in future ERT situations. Being able to systematically assess the extent of the challenges that students in a given community face contributes to the ability to pinpoint the specific issues that must be addressed in each case, which constitutes the significant contribution of this research. Furthermore, many of the findings and implications of this study are also applicable to other countries, even more developed countries.
The main contributions of this research are as follows:
  • The qualitative research performed using the survey method allowed for the identification of the most frequently reported challenges and difficulties faced by students studying online in ERT environments:
    • Perceived quality of virtual instruction (25%);
    • Poor Internet connectivity and lack of proper equipment (22%);
    • Lack of appropriate home infrastructure to study (17%);
    • Personal and psychological issues (9%).
  • The application of the Analytic Hierarchy Process helped prioritize the perceived importance of the most critical student challenges related to virtual education from the students’ perspective (three challenges constitute 70.8% of the overall significance):
    • Distance Learning Resources: learning platform and access to resources (29%);
    • Home Infrastructure: lack of proper home infrastructure (20.88%);
    • Finances: financial issues related to students and families (20.87%).
  • The use of the AHP and composite indictors have allowed for the development of an assessment framework to evaluate the nature and extent of the challenges faced by specific students or communities of students in ERT environments, making it possible to develop interventions to address those challenges.
Identifying possible approaches to address salient challenges was not part of the study. Moreover, several concerns expressed by the students could be addressed through well-known behavioral intervention strategies related to changes in perception or managerial initiatives. However, we would consider it a disservice to the practitioner community not to discuss possible actions to address the identified challenges based on observed practices and extant literature.
A series of possible considerations and actions that educational institutions and governments can use regarding the immediate and long-term adaptation to the changing environment of tertiary education may result in positive outcomes during this turbulent time. Concerning the challenges found in the presented research, the following actions/considerations can be applied:
  • Provide careful instructional design and planning, using a systematic model for design and development [56].
  • Consider online learning design options including the following nine dimensions: modality, pacing, student–instructor ratio, pedagogy, instructor role online, student role online, online communication synchrony, the role of online assessments, and source of feedback [51].
  • Provide structured and planned educational material (content, methodologies, and shared goals) and more adequate e-learning platforms by using suitable interactive digital learning resources (video, animations, quizzes, and games) to maintain students’ attention [53].
  • Survey students about their capacity to engage in remote learning, including areas such as equipment, family responsibilities, home environment, etc. This information is needed to understand how realistic it is for students to adapt to instructors’ plans for delivery and to work with instructors to adjust them according to student capacity to participate in distance learning [57,58].
  • Ensure the reliability of the selected technological delivery systems, the provision of and access to learner support systems, support for faculty professional development for online teaching pedagogies and tools, policy and governance issues related to distance program development, and quality assurance [12].
  • Identify weaknesses in infrastructure including power, broadband, and equipment that needs to be strengthened when possible or workarounds when it is not possible (e.g., providing access to hotspots, affordable devices such as tablets, computers) [53,58].
  • Implement a blended approach to reinforce a feeling of community belonging. Increasing interaction (student–content, student–student, and student–teacher) increases the learning outcomes when meaningfully integrated. According to experts, students need face-to-face interactions, so face-to-face lessons should complement online classes [53,59].
  • Provide the opportunity for teachers to develop blended teaching competencies to prepare them to teach in different formats, settings, and situations and support their ongoing learning and growth related to teaching with technology [33].
  • Incorporate a human-centered design approach into teacher education programs based on three premises: (a) building empathy, (b) engaging in pedagogical problem solving, and (c) establishing an online community of inquiry [60,61].
  • Develop more inclusive tools, platforms, and devices to make digital learning resources accessible to people with disabilities [53].
  • Consider dedicated (financial, logistical, and pedagogical) support programs for at-risk students [58].
Despite the presented challenges, the COVID-19 pandemic has fostered innovative solutions through digital transformation in various economic sectors, enriched campus-based programs with online activities, and developed learning and development opportunities for the university community. Students highlight gains on a personal level, such as greater self-discipline, better time management, responsibility, resilience, autonomy, and flexibility [62,63]. Teachers developed various new digital competencies and invested significant effort into building their students’ digital capabilities [64]. This effort has led to positive student attitudes and willingness to incorporate more online aspects into post-pandemic face-to-face learning [65]. For example, Whittle et al. [13] state that in an emergency remote teaching (ERT) environment, the educator must revisit and reevaluate their learning design frequently, both during and following the emergency situation, to determine the efficacy of the current approach and identify necessary adjustments as soon as possible. As variables such as technology access or standardized learning goals change, teachers must evaluate their current approach to determine what elements remain viable in the changing learning environment. As indicated by García-Morales et al. [27], the university system must strive to overcome this situation in order to be competitive and provide high-quality education in a scenario of digital transformation, disruptive technological innovations, and accelerated change. In emergencies and more planned contexts, the potential need for remote teaching must become part of a teacher’s skill set [66].
Finally, our newest contribution, the development of an assessment framework using composite indicators to evaluate the vulnerability of student groups concerning the identified challenges, may be helpful to plan interventions for emergency remote teaching environments beyond the specific context of this study. The authors intend to use these results as a reference for educators, universities, governments, and politicians to be more prepared for future crises and disasters.

Author Contributions

Conceptualization, E.M.; Formal analysis, E.M., A.F.-P. and M.P.-R.; Investigation, A.F.-P.; Supervision, E.M.; Validation, M.P.-R.; Writing—original draft, E.M.; Writing—review and editing, A.F.-P. All authors have read and agreed to the published version of the manuscript.

Funding

This research received no external funding.

Institutional Review Board Statement

We hereby certify that the present study was collected under institutional guidelines of data protection and confidentiality, reviewed and conducted by the Institute of Public Opinion (IOP) from CENTRUM and Pontificate Catholic University of Peru (PUCP), following the strictest ethical considerations PUCP ethical policies for this type of studies, namely the obtention of informed consent, confidentiality, and protection of personal data according to Law 29733. Letter Nr 002/009-2022 from PULSO UCP certifying the above statements is available upon request and on an as-needed basis.

Informed Consent Statement

The Institute of Public Opinion (IOP) from the Pontificate Catholic University of Peru (PUCP), following the IRB best practices and ethical considerations, informed the participants of the nature of the data collection and the purpose of the study, ensuring the anonymity of the participants and requesting informed consent before their survey participation.

Data Availability Statement

The datasets used and/or analyzed during the current study are available from the corresponding author upon reasonable request.

Acknowledgments

The authors wish to acknowledge the valuable assistance of the Institute of Public Opinion of Peru (now PULSO, Institute for Social Analytics and Strategic Intelligence), CENTRUM Católica Graduate Business School, Lima, Peru, and Pontificia Universidad Católica del Perú (PUCP), Lima, Peru for their unconditional support and assistance during the data collection process.

Conflicts of Interest

The authors declare no conflict of interest.

Appendix A

Appendix A.1. The Case of Peru

The worldwide pandemic of the SARS-CoV-2 virus forced governments in Peru and other countries to switch to virtual education. From 15 March 2020, when the Supreme Decree No 044-2020-PCM (and its later changes) was published, education at every level in Peru was continued remotely. On 11 November 2021, the Ministry of Education (MINEDU) ratified its decision to return to face-to-face classes in March 2022 [67,68]. Similar situations occurred worldwide. For almost two years, students did not experience education in classrooms, which did not allow many of them to continue schooling and brought about many new, never-before-experienced challenges. Education in Peru and other South American countries is divided according to financial capacity and the family’s place of residence. The wealthiest people have access to high-quality education, but the more significant, poorer part of society only has access to the public, underfunded institutions. For that reason, before the pandemic, only some private higher educational institutions in Peru, especially in big cities such as Lima with better access to information and communication technologies (ICTs), had some experience with distance learning since some courses were offered in that format.

Appendix A.2. Digital Divide and Education in Peru

According to figures from the Peruvian National Institute of Statistics and Informatics [69], households’ access to information and communication technology (ICT) is highest among those who have a higher university education (99.6%). The lower the level of education, the less access to ICT, although the distance is increasing, with 97.5% of households with secondary education and 87.8% of those with primary education and lower education having access to ICT. The number of homes with access to a computer and the Internet, according to the area of residence, is as follows: 36 of every 100 families have at least one computer, of which 94% are exclusively for family use (academic, professional, or study activities), 5.7% are for combined use for home and work, and 0.4% are used solely for work. According to the area of residence, 52.9% of households in Metropolitan Lima have at least one computer, 38.3% in other urban areas, and 7.5% in rural households. Concerning Internet service, 62.9% of households in Metropolitan Lima have service, 40.5% of other urban areas, and only 5.9% of homes in rural areas have Internet service. Compared to a similar quarter in 2019 (the previous year), Internet service nationwide increased by 3.4% (1.1% in Metropolitan Lima, 4.8% in other urban areas in Peru, and 2.2% in rural areas). In the third quarter of 2021, Internet access in the country’s homes reached 55%, increasing by 9.6% compared to the same quarter in 2020 [70].
Regarding enrollment in primary education, 7,834,543 students were enrolled in 2020, and 8,024,672 were registered in 2019. Likewise, by type of management, in 2020, the enrollment in private educational institutions decreased considerably compared to 2019, going from 2 million to 1.7 million students in the three levels of basic education (primary and secondary school). On the other hand, MINEDU reported that in 2020, 337,870 students transferred from private to public educational institutions; this absorption represented 18.7% in primary education (183,536 students), 17.5% in secondary education (92,700 students), and 11.5% in pre-schools (61,634 students). In summary, the educational inequality and dropout rates at each level result from economical family problems (COMEXPERU, 2020), inequality in access to ICT, and lack of knowledge on how to use the virtual platforms (INEI, 2021) for more than 75% of students. Professors face a similar situation in public educational institutions [71]. As presented by Huanca-Arohuanca, Supo-Condori [71], students in private universities have a greater possibility of access to ICTs.
In summary, the Peruvian reality shows that the academic strategies of virtual teaching implemented by state and private university authorities at the national level will not guarantee the effective learning of the thousands of students with provincial and indigenous ancestry. It is not easy to develop the expected students’ knowledge through virtual education at national universities because the high-end Internet service in these regions is one of the challenges that need to be resolved by educational agents in governments, universities, students, teachers, and civil society.

Appendix A.3. Virtual Education during the Pandemic in Peru

A search in SCOPUS identified 14 papers related to virtual education in Peru during the COVID-19 pandemic published from 2020–2022 (searched by title, abstract, and keywords). Only nine were directly related to this topic. Degollación-Cox and Rimac-Ventura [72] present the transformation of the perception and practice of teaching and highlight that knowledge of students’ daily experiences is fundamental to implementing strategies for virtual education. Aquino, Zuta [73] demonstrated the effectiveness of collaborative work in virtual breakout rooms; students’ autonomous work is based on asynchronous activities, especially with teacher accompaniment and feedback. Huamán-Romaní et al. reported that there are still problems with the materials the students share due to the lack of reading comprehension [74]. Using communication technology and the Internet, students can learn through self-learning. As presented by Rosario-Rodríguez, González-Rivera [63], and Lovón and Cisneros [75], virtual education demands more time dedicated to students than face-to-face education. Insufficient teacher preparation resulted in the overuse of tools such as forums, tasks, and readings, which caused stress and frustration among students. They ultimately left their studies due to academic overload. The students also experienced stress and anxiety due to the presence of minors in both their home and their teacher’s home in the virtual setting; however, they were also aware that the virtual teaching approach involved a significant effort from their teachers.

Appendix A.4. Virtual Education after the Pandemic in Peru

It is expected that many of the variables identified by the extant literature and the present study for virtual instruction success will remain key determinants of satisfaction and successful learning outcomes (e.g., financial concerns) of virtual education. In contrast, other pandemic-specific variables will drastically decrease in importance (e.g., stress and fear of relatives and family members getting seriously ill). While it is impossible to predict the future, it may be helpful to review some discussions of the future of education applicable to Peru after the pandemic.
The SARS-CoV-2 pandemic will leave countries with major economic problems to address, affecting different groups of society in different ways. We have created a world where inequity has made some people more vulnerable. The current crisis allows us to reflect on how this has happened and the opportunity to change direction. It will be essential for universities to participate in this discussion globally and locally [76]. Leading the tertiary education systems in the post-crisis world, especially in emerging countries such as Peru, policymakers, educational institutions, and teachers will need to focus on the most vulnerable students. They must ensure that teaching and learning solutions, technological setups, infrastructure investments, and funding modalities keep these students engaged and connected and support their learning process and outcomes [58]. Creating a sustainable collective future is challenging, especially during a pandemic, but this is a necessity that we can no longer ignore. Higher education institutions may be at the heart of positive societal change, which must also occur within higher education institutions. Sustainable development issues require reflection and action in every higher education institution, from how they are organized and funded to the content and methods of the teaching and research to how they engage in society [76].

Appendix B

Appendix B.1. The Analytic Hierarchy Process in the Present Study

The Analytic Hierarchy Process (AHP), the method used to build the virtual education challenge assessment framework, allows for the decomposition of a complex construct, such as virtual education challenges, into smaller conceptual parts organized into hierarchical levels. In this way, it is possible to show the logical structure of the problem.
The AHP can be used for selection, allocation of resources, prioritization, or assessment. Each of these areas has advantages as well as limitations. While there are many different multi-criteria methods for this purpose, the AHP is one of the most popular worldwide because it is easy to intuitively understand and allows for the inclusion of intangible variables.
The AHP was developed by Saaty [37] and combined concepts from mathematics and psychology. A wide range of decision problems has been solved with the help of the AHP method in almost every area of study. It differs from other multicriteria decision-making methods in several aspects: (a) it presents the structure of the problem in a hierarchical form, with the goal at the top of the hierarchy, while its criteria, sub-criteria, etc., and decision-making alternatives are at the lowest level; (b) it compares the items at each level of the hierarchical structure in pairs using a preference scale developed by Thomas L. Saaty; (c) it introduces a relative rating scale (priorities) to compare quantitative and qualitative concepts. The Analytic Hierarchy Process is based on three axioms. The first is the so-called axiom of inverse evaluations. The second is the axiom of homogeneity, which indicates that when constructing a hierarchical structure, one should remember the appropriate selection and grouping of comparable elements and avoid significant differences between them. The third axiom assumes that the priorities of the elements at a given hierarchy level do not depend on the priorities of the lower elements [47,77].
When used for assessment purposes, it is habitual to set up the overall encompassing construct, an index (e.g., virtual education challenges) connected to its composite dimensions (from challenge C1 to C7, as shown in Figure 3), as the goal. The next step is to ask the participants to compare the relative importance of these variables using a ratio scale from 1 to 9, developed by Saaty [37]. When there is a large number of participants (165 in this study), it is common to distribute a survey where the proper pairwise comparison questions are given, as shown in the example below from the present study.
Table A1. Sample Pairwise Comparison Question of C2 vs. C5.
Importance of Virtual Education Challenges
This survey intends to identify the importance of the challenges that college students face to succeed in their virtual learning in the context of the current pandemic. In this last section, we will ask you some questions regarding the relative importance of the above challenges.
21. What is more important to you: “The availability of adequate Internet and computer connectivity” or “An adequate educational platform and access to resources (e.g., library)?”
9. Regarding your answer to the previous question, how much more important is the chosen option? [Usethe intermediate values of the intensity scale if necessary]
1—Equally important
2
3—Moderately more important
4
5—Strongly more important
6
7—Very strongly more important
8
9—Extremely more important
Following common practices in group decision-making, the individual pairwise comparison judgments are combined by calculating the geometric mean of the comparison value which is representative of all the participants for the specific pairwise comparison [78]. Two important caveats in group decision-making are the need to minimize the number of comparisons and the need to negotiate the consistency ratio index, i.e., the extent to which transitivity judgments were violated.

Appendix B.2. Number of Comparisons

Given n elements to compare pairwise, the number of required comparisons is n (n − 1)/2. In our study, there are seven challenge dimensions to compare, which means that each participant must perform 7 * (7 − 1)/2 = 24 comparisons that, when assembled as in Exhibit A (2 questions per comparison), require the participant to answer 48 questions. Fortunately, there is a way to decrease this number. If only a selected number of comparisons is given, it is possible to calculate what the other comparisons would be. It is important to remember that every pairwise comparison constitutes a ratio. So, stating that C1 is “moderately more important” than C2 means that C1/C2 = 3. Similarly, if C2 is also “moderately more important” than C3, this also means C2/C3 = 3. Due to this, we can calculate that C1/C3 = (C1/C2) * (C2/C3) = 3 * 3 = 9. It can be shown that only n − 1 comparisons are needed to calculate the others. Using this approach, only six comparisons are needed for our seven challenges.

Appendix B.3. Group Consistency

Consistency in the AHP refers to the extent to which the participants do not violate the transitivity principle in their comparisons. A consistency ratio (CR) index measures this extent, where 0 means perfect consistency. Saaty has shown that for the results to be reliable, the CR must be less than or equal to 0.1. What does perfect consistency mean? For example, if C1 is judged to be “moderately more important” than C2, then C1 = 3 * C2 (from Saaty’s scale in Table A1), and then C2 is also considered to be “moderately more important” than C3, which means that C2 = 3 * C3. When the participant is asked about comparing the importance of C1 with respect to C3, the perfect mathematical answer is that C1 is “extremely more important” than C3; that is, C1 = 3 * 3 * C3 = 9 * C3. If the participant provides a different value for the C1/C3 comparison, e.g., 8, this value is not mathematically correct, but as long as the CR is less than/equal to 0.1, it is usable.
When working with a single participant, it is possible to review the most inconsistent judgments (those that lead to a CR above 0.1); however, when working with anonymous reviewers, it is not possible to do so. By using the approach of asking for the minimum (n-1) number of comparisons and calculating the missing ones, the consistency level will be perfect because, as shown above, the other comparisons are derived from the given ones.
Therefore, the minimum number of comparisons needed to minimize the number of questions and avoid the problem of consistency was found in the AHP approach used in this study, following best group practices [44].

Appendix B.4. Deriving Priorities

To derive the priorities for the relative importance of the challenges, it is necessary to assemble a pairwise comparison (PWC) matrix n * n. In the present study, a 7 × 7 matrix was created to record all the C1 to C7 comparison judgments aggregated from the survey questions. The missing comparison judgments were calculated as previously explained and entered into the PWC matrix. The matrix was normalized to obtain the priorities or relative importance of the challenges with the results shown in Figure 4 for the present study.

Appendix C

Exploratory Factor Analysis (EFA) for the Challenges of Virtual Education: C1 to C7.
Extraction Method: Principal Component Analysis. Rotation: Promax with Kaiser Normalization7.
Education 12 00704 i001
C1—Quality of Instruction and Learning breaks down into three factors, mainly along the original three sub-dimensions: C1.1 400—Quality of Teaching (Q13.1 to Q13.4)8; C1.2 700—Class Interaction/Activities (Q14.1 to Q14.6), and C1.3 500—Exams and Homework (assessment: Q15.1 to Q15.5).
C2—Poor Internet and Equipment holds on as a single factor (Q10.1 to Q10.5) with all of its indicators. None are discarded.
C3—Personal and Psychological Challenges are separated into four sub-dimensions: C3.1. Personal and Physical Issues (Q16.1–Q16.4, Q17.1,and Q17.4, the indicators Q17.2 and Q17.3 were discarded due to double loading), C3.2. Mental Health Concerns (Q18.1 to Q18.3), C3.3.Mental Health Environment (Q18.6 to Q18.8),andC3.4.Mental Health Sadness (Q18.4 and Q18.5).
C4—Home Infrastructure holds as a single factor with its indicators Q12.1 to Q12.4.
C5—Learning Platform and Resources is separated into its two original sub-dimensions: C5.1. Learning Platform (Q11.1 to Q11.4) and C5.2. Access to Resources (Q11.5 to Q11.8).
C6—Financial Issues are structured as a single factor (Q19.1 to Q19.4).
C7—University Administration and Costs separates into two factors constituted by the indicators Q20.1 to Q20.3 (Administration) and Q20.4 to Q20.5 (Costs). Since Q20.4 and Q20.5 refer to university tuition costs (because the survey was conducted mainly with students from private institutions), these indicators may not be applicable in public education contexts. Q20.1 initially constituted the university administration challenge of Q20.3; however, Q20.1 was deleted to increase Cronbach’s alpha from 0.548 (too low) to 0.717. Therefore, C7 is formed by the indicators Q20.2 and Q20.3.

Appendix D

Appendix D.1. Using the Challenge Assessment Framework

For the purpose of showing how to use the proposed assessment framework, two cases were selected as follows: case#18 represents a participant with one of the highest scores in terms of virtual education challenges (highest challenged), and case #39 represents one of the lowest scores (least challenged). Their original scores9 for each sub-dimension are shown in Table A2, which also shows the average values of each challenge for the total of participants.

Appendix D.2. Original Scenario

The total scores in the original scenario, applying the weights obtained from the survey, are shown in line 26 of Table A2. This shows that the extent of the virtual education challenge is 4.31 for case #18, which is entirely above the average of the participant group (2.69) as well as quite above 3.0, which would be the middle value in the scale range (1—least challenged to 5—most challenged) used to assess the extent of real challenges. On the other hand, case #39 has a total challenge index value of 2.09, which is quite below the sample average of 2.69 and the scale middle point of 3.0 but far from the ideal of 1.0. In other words, there is still room for improvement while being less challenged by virtual instruction than the average participant.
It is also possible to analyze the challenges of the individual participants in terms of specific dimensions or sub-dimensions. For example, Table 7 shows the lack of proper home infrastructure and study environment (line 14), physical issues(line 9) that may be derived from working in a challenging environment, and financial issues (line 20)that impede properly addressing the previous challenges faced by participant #18.

Appendix D.3. Sensitivity Scenario I

As previously indicated, performing a sensitivity analysis rather than blindly using the assessment index values is important. Table 7 (line 27) shows how the results would differ if all the challenges had the same weight (i.e., ignoring the importance derived by the survey participants). In case #18, the extent of the challenge would increase (from 4.31 to 4.44, about a 3% difference) due to some less weighted dimensions and those in which this participant has high levels of challenge (e.g., C1, C3, and C7 in lines 1, 8, and 22, respectively) now have a higher weight in the overall challenges index. Case #39 experiences a similar situation. Since this participant has a low extent of challenge for most dimensions, making them all equally important only improves the condition by decreasing its challenge exposure value (from 2.09 to 1.45, about a 28% improvement).

Appendix D.4. Sensitivity Scenario II

Another sensitivity scenario can be given by focusing only on challenges C4; Home Infrastructure and Study Environment (line 14), C5; Learning Platform and Access to Resources, and C6; Financial Issues (line 20). Together, these challenges constitute about 70% of the overall challenge index value. Since their relative weights are somewhat similar, they may be considered to be equally important (33.3% each) and as the only indicators that need to be considered. When doing this, the results of this scenario show (line 28) that the highest challenged participant (case #18) becomes even more challenged (4.75), and the least challenged participant (case #39) further increases its position (1.17); that is, becomes even less challenged.
In conclusion, the virtual education challenge index applied to cases #18 and #39 shows that these two participants are characterized by a large extent of challenge (4.31 and above the average) and a small extent of challenge (2.09 and below the norm), respectively. Furthermore, this is established in the context of sensitivity scenarios in which, first, all challenge dimensions/sub-dimensions are equally important (Scenario I). A situation in which the index is only composed of the three most important challenges (Scenario 2 with only C4, C5,and C6, equally weighted) shows that the situations of cases #18 and #39 remain the same in terms of being highly challenged since the case #18 index now becomes 4.75 (even higher above the average). Case #39 becomes even less challenged than before, given a further decrease in the virtual education challenge index to 1.17 (which further lowers the sample average). In other words, the index assessment is quite robust concerning criteria weight changes.
There are no rules concerning what scenarios to explore when performing a sensitivity analysis since the specific indicators and cases drive this decision. However, the general idea of equalizing the weights and focusing on the most important ones is standard practice in this area. A sensitivity analysis is essential to applying composite indicators and best practices [38].
Table A2. Assessment of challenges of virtual education for two cases.
LineChallengesGlobal WeightsHIGHEST
Challenged
Case #18 Responses
AVERAGE Challenged
Case
Responses
LEAST Challenged Case #39 Responses
1C.1. Quality of Virtual Instruction0.0679
2C.1.1. Teaching0.02263.751.761.00
3C.1.2. Interaction0.02265.002.803.13
4C.1.3. Assessment0.02264.202.522.80
6C.2. Connectivity & Equipment0.08823.001.661.00
8C.3. Personal Issues0.0668
9C.3.1. Physical0.01675.003.133.50
10C.3.2. Health Concerns0.01674.333.063.33
11C.3.3. Health Environment0.01675.002.752.00
12C.3.4. Health Sadness0.01674.003.532.00
14C.4. Home Infrastructure & Study Environment0.20885.002.581.00
16C.5. Learning Platform & Access to Resources0.29
17C.5.1. Learning Platform0.14503.501.651.00
18C.5.2. Access to Resources0.14505.002.751.00
20C.6. Financial Problems0.20875.002.971.50
22C.7. University Admin. & Costs0.0696
23C.7.1. University Administration0.03483.502.402.50
24C.7.2. University Costs0.03484.004.063.50
26Original Scenario Total Scores
(Weighted from survey responses)
4.312.692.09
27Sensitivity Scenario I (All criteria equally weighted) 4.442.521.45
28Sensitivity Scenario II
(Only C4-C6 with equal weights)
4.752.581.17

Appendix E

Appendix E.1. Challenges to Virtual Education Assessment10

  • C1—Challenges to the Quality of Virtual Instruction
In this section, we will focus on the different educational aspects that affect the quality of virtual instruction, such as the knowledge of the virtual teaching methodology of teachers and students (code 400)11, the interactivity of the class (code 700), as well as the appropriateness of assignments and tests (code 500).
C1.1. Teaching Quality.
IndexEnglish QuestionSurveySpanish Question
C1.1.1Teachers are not trained to teach a virtual class in a didactic wayQ13.1Los profesores no están capacitados para dictar una clase virtual en forma didáctica.
C1.1.2Students do not have knowledge of how to study in a virtual classQ13.2Los alumnos no tienen conocimiento de como estudiar en una clase virtual
C1.1.3Teachers teach fewer hours than they shouldQ13.3Los profesores dictan menos horas de las que deberían
C1.1.4Teachers are not motivated to teach classes onlineQ13.4Los profesores no están motivados a dictar clases en línea
C1.2. Interaction.
IndexEnglish QuestionSurveySpanish Question
C1.2.1Interactivity in the class between classmates is very littleQ14.1La interactividad en la clase entre compañeros de clase es muy poca
C1.2.2Interaction in class with the teacher is very littleQ14.2La interacción en clase con el profesor es muy poca
C1.2.3It is very difficult to do group tasksQ14.3Es muy difícil realizar tareas grupales
C1.2.4No spaces to interact with classmatesQ14.4No hay espacios para interactuar con los compañeros de clase
C1.2.5It is not possible to form study groupsQ14.5No es posible formar grupos de estudio
C1.2.6The interaction in a virtual class is less than in a face-to-face classQ14.6La interacción en una clase virtual es menor que en una clase presencial
C.1.3. Assessment.
IndexEnglish QuestionSurveySpanish Question
C1.3.1There is an academic overload for students in virtual classesQ15.1Hay una sobrecarga académica para los alumnos en las clases virtuales
C1.3.2Exams are not suitable for online classesQ15.2Los exámenes no son adecuados para clases en línea
C1.3.3There is no good feedback on the assignmentsQ15.3No hay una buena retroalimentación de las tareas
C1.3.4There is no flexibility of teachers in terms of deadlinesQ15.4No hay flexibilidad de los profesores en los plazos de entrega
C1.3.5The quality of assignments and exams is lower in virtual classesQ15.5La calidad de las tareas y exámenes es inferior en las clases virtuales
  • C2—Connectivity and Equipment
Adequate connectivity and computers are the two main components necessary for virtual education by the student (code 100) and the institution (code 150). In this section, we will ask some questions related to this topic.
IndexEnglish QuestionSurveySpanish Question
C2.1I do not have (or have limited) access to the internet where I liveQ10.1No tengo acceso (o es limitado) al internet donde vivo
C2.2My internet speed is not adequate for my classesQ10.2Mi velocidad de internet no es adecuada para mis clases
C2.3I do not have access (or it is rather limited) to a computer at homeQ10.3No tengo acceso (o es limitado) a un computador en mi vivienda
C2.4There are many technical problems while accessing classes or study materialQ10.4Hay muchos problemas técnicos durante el acceso a clases o material de estudio
C2.5My educational institution does not have the appropriate computer equipment (e.g., servers) for virtual teachingQ10.5Mi institución educativa no tiene el equipo de cómputo (p. ej. servidores) adecuado para la enseñanza virtual
  • C3—Personal Issues
Our performance in virtual education can also be affected by personal aspects such as physical (code 800), organizational (code 900), or psychological (code 1000) situations. This section refers to these types of challenges.
C3.1. Physical Issues.
IndexEnglish QuestionSurveySpanish Question
C3.1.1It is difficult to concentrate because there are many distractions such as cell phones, noises and interruptions from other people in the houseQ16.1Es difícil concentrarse porque hay muchas distracciones tales como celulares, ruidos e interrupciones de otras personas en la casa
C3.1.2Long hours in front of the computer cause back pain, vision and physical fatigue in generalQ16.2Largas horas frente al computador producen dolor de espalda, cansancio de visión y físico en general
C3.1.3It is difficult to accept the new virtual contextQ16.3Es difícil aceptar el nuevo contexto virtual
C3.1.4It is not easy to stay motivated in virtual classesQ16.4No es fácil mantenerse motivados en las clases virtuales
C3.2. Health Concerns.
IndexEnglish QuestionSurveySpanish Question
C3.2.1Quarantine is depressingQ18.1La cuarentena es deprimente
C3.2.2I have not been able to carry out my medical examinations/treatment(s)Q18.2No he podido llevar a cabo mis exámenes/tratamiento médico(s)
C3.2.3I am concerned about family/friends who have become illQ18.3Estoy preocupado por familiares/amigos que han enfermado
C3.3. Health Environment.
IndexEnglish QuestionSurveySpanish Question
C3.3.1The school/university does not care about the mental health of the studentsQ18.6A la escuela/universidad no les importa la salud mental de los estudiantes
C3.3.2Virtual classes do not provide recreation spacesQ18.7Las clases virtuales no dan espacios de recreación
C3.3.3Virtual classes, in general, cause more stress than face-to-face classesQ18.8Las clases virtuales, en general, causan másestrés que las presenciales
C3.4. Health Sadness.
IndexEnglish QuestionSurveySpanish Question
C3.4.1I am sad for family/friends who have passed awayQ18.4Estoy preocupado por familiares/amigos que han enfermado
C3.4.2The school/university does not care about the mental health of the studentsQ18.5Estoy triste por familiares/amigos que han fallecido
  • C4—Home Infrastructure and Study Environment.
IndexEnglish QuestionSurveySpanish Question
C4.1My home does not have adequate physical space for my virtual classesQ12.1Mi vivienda no tiene espacio físico adecuado para mis clases virtuales
C4.2Activities of other people at home produce a lot of noise and interruptionsQ12.2Actividades de las demás personas en casa produce mucho ruido e interrupciones
C4.3I do not have adequate furniture at home (eg desk, chair) for my virtual classesQ12.3No tengo el mobiliario adecuado en casa (p. ej. escritorio, silla) para mis clases virtuales
C4.4The physical infrastructure that one has at home for virtual classes is less than in the educational institutionQ12.4La infraestructura física que uno dispone en casa para las clases virtuales es menor que en la institución educativa
  • C5—Learning Platform and Access to Resources
The following observations refer to the educational platform for teaching/accessing classes and virtual material (code 300). The availability of other teaching resources (code 600) is also explored.
C5.1. Learning Platform.
IndexEnglish QuestionSurveySpanish Question
C5.1.1The educational platform in use is not suitable for virtual instructionQ11.1La plataforma educativa en uso no es adecuada para la instrucción virtual
C5.1.2Teachers do not know how to use the platformQ11.2Los profesores no saben usar la plataforma
C5.1.3Students do not know how to use the platformQ11.3Los alumnos no saben usar la plataforma
C5.1.4There is no information about the use of the platformQ11.4No hay información acerca del uso de la plataforma
C5.2. Access to Resources.
IndexEnglish QuestionSurveySpanish Question
C5.2.1Lack of access to library books is a severe limitationQ11.5La falta de acceso a los libros de la biblioteca constituye una seria limitación
C5.2.2Lack of access to laboratories is a problemQ11.6La falta de acceso a los laboratorios constituye un problema
C5.2.3It is necessary to have access to more study material (e.g., PPTs) in addition to the recordings of the classQ11.7Hace falta tener acceso a más material de estudio (p. ej. PPTs) además de las grabaciones de la clase
C5.2.4Access to teaching resources is less in virtual instructionQ11.8El acceso a recursos de enseñanza es menor en la instrucción virtual
  • C6—Financial Issues
Personal financial aspects (code 850) and those of the family (code 1300) also constitute a challenge for success in virtual education. In this section, we will discuss some of them.
C6. Financial Issues.
IndexEnglish QuestionSurveySpanish Question
C6.1I am worried about my financial situationQ19.1Estoy preocupado por mi situacióneconómica
C6.2The economic situation of my family is uncertainQ19.2La situacióneconómica de mi familia es incierta
C6.3I am not sure I will be able to continue studying, given the economic uncertaintyQ19.3No estoy seguro de poder continuar estudiando dada la incertidumbre económica
C6.4I think the costs associated with school/university are too highQ19.4Pienso que los costos asociados a la escuela/universidad son muy altos
  • C7—University Administration and Costs
In this section, we will review aspects related to the educational institution (code 1200) and others (code 1100).
C7.1. University Administration.
IndexEnglish QuestionSurveySpanish Question
C7.1.1My university/school does not pay attention to the economic situation of the studentsQ20.2Mi universidad/escuela no presta atención a la situacióneconómica de los estudiantes
C7.1.2Authorities and teachers have no leadership for the current transformationQ20.3Autoridades y docentes no tienen liderazgo para la transformación actual
C7.2. University Costs.
IndexEnglish QuestionSurveySpanish Question
C7.2.1Schools/universities that charge for tuition should lower prices because the facilities are not usedQ20.4Escuelas/universidades que cobran por la enseñanza deben bajar precios porque no se usan las instalaciones
C7.2.2In general, virtual classes require less cost from institutions than face-to-face classesQ20.5En general, las clases virtuales demandan menos costos de las instituciones que las clases presenciales

Notes

1
The “Institute for Public Opinion” (IOP), currently Instituto for Social Analytics and Strategic Intelligence (PULSO), is an organization that polls public opinion as a way of conducting and supporting social research in the country.
2
The letter/number combination in brackets identifies the location of the quote within the dataset.
3
The qualitative part of the study was framed to discuss the problems students faced in their virtual instruction; however, for the survey questionnaire, a decision was made to frame the survey questions in terms of challenges or issues to avoid creating a response bias due to the negative connotation of the word “problems.” Therefore, for survey stages II and III, the terms financial issues, personal challenges, and so forth were used.
4
In this study, the terms category, thematic variable, challenge, construct, or variable are used interchangeably. The reason for using several different terms rather than a single one is an attempt to respect the names used in the different theoretical areas of survey research, composite indicators development, statistics, and MCDA.
5
A third, more dramatic—although less likely—possibility is that of self-selection; that is, those who were not able to solve their fundamental connectivity and equipment issues were not in the pool of online students who would answer the survey questions a few weeks later. It would be necessary to check the non-returning ratio of students for this purpose.
6
The data collection for this study was mainly among students from the largest private college in the country.
7
Values shown are only those above 0.4.
8
Q13-5 to Q13-7 were originally expected to be part of this group of C1.1 Quality of teaching but they were rather loaded into the group of C1.2 Class Interaction/Activities. However, in spite of being slightly above the lower threshold of 0.4, their impact was far lower than those of Q14.1 to Q14.6, and for this reason they were not included in the final list of C1.2 indicators.
9
The original score for each of the challenge dimensions/sub-dimension is obtained through an arithmetic averaging of all the response values of the questions corresponding to the specific challenge. For example, the score of C.1.1 Teaching is the average of the responses to the four questions from Q13.1 to Q13.4.
10
The present study was conducted in Spanish. A preliminary English translation of the questions is provided for your convenience, but the reader is advised to ensure it is adequate for the researcher’s needs.
11
The challenge codes are provided here so the reader can connect these questions with the challenge assessment framework (Figure 5) and the original qualitative study (Table 3 and Table 4).

References

  1. Alavi, M.; Leidner, D.E. Research Commentary: Technology-Mediated Learning-Call for Greater Depth and Breadth of Research. Inf. Syst. Res. 2001, 12, 1–10. [Google Scholar] [CrossRef]
  2. Eom, S.; Ashill, N. The Determinants of Students’ Perceived Learning Outcomes and Satisfaction in University Online Education: An Update. Decis. Sci. J. Innov. Educ. 2016, 14, 185–215. [Google Scholar] [CrossRef]
  3. Burnett, K.; Bonnici, L.J.; Miksa, S.D.; Kim, J. Frequency, Intensity and Topicality in Online Learning: An Exploration of the Interaction Dimensions That Contribute to Student Satisfaction in Online Learning. J. Educ. Libr. Inf. Sci. 2007, 48, 21–35. [Google Scholar]
  4. Jung, I. Building a theoretical framework of web-based instruction in the context of distance-education. Br. J. Educ. Technol. 2001, 32, 523–534. [Google Scholar] [CrossRef]
  5. Hill, J.R. Distance Learning Environments Via World Wide Web, in Web-Based Instruction; Khan, B.H., Ed.; Educational Technology Publications: Englewood Cliffs, NJ, USA, 1997. [Google Scholar]
  6. Wagner, J.G. Assessing Online Learning; National Business Education Association: Reston, VA, USA, 2001. [Google Scholar]
  7. Callister, R.R.; Love, M.S. A Comparison of Learning Outcomes in Skills-Based Courses: Online versus Face-to-Face Formats. Decis. Sci. J. Innov. Educ. 2016, 14, 243–256. [Google Scholar] [CrossRef]
  8. Parahoo, S.K.; Santally, M.I.; Rajabalee, Y.; Harvey, H.L. Designing a predictive model of student satisfaction in online learning. J. Mark. High. Educ. 2015, 26, 1–19. [Google Scholar] [CrossRef]
  9. Turoff, M. Alternative Futures for Distance Learning: The Force and the Darkside. In Proceedings of the UNESCO/OPEN UNIVERSITY International Colloquium: Virtual Learning Environments and the Role of the Teacher, Milton Keynes, UK, 27–29 April 1997. [Google Scholar]
  10. Olcott, D.J.; Wright, S.J. An institutional support framework for increasing faculty participation in postsecondary distance education. Am. J. Distance Educ. 1995, 9, 5–17. [Google Scholar] [CrossRef]
  11. Pedró, J. COVID-19 y educación superior en América Latina y el Caribe: Efectos, impactos y recomendaciones políticas. Análisis Carol. 2020, 36, 1–15. [Google Scholar] [CrossRef]
  12. Hodges, C.B.; Moore, S.; Lockee, B.B.; Trust, T.; Bond, M.A. The Difference between Emergency Remote Teaching and OnLine Learning. Educ. Rev. 2020. Available online: https://er.educause.edu/articles/2020/3/the-difference-between-emergency-remote-teaching-and-online-learning (accessed on 4 August 2021).
  13. Whittle, C.; Tiwari, S.; Yan, S.; Williams, J. Emergency remote teaching environment: A conceptual framework for responsive online teaching crises. Inf. Learn. Sci. 2020, 121, 311–319. [Google Scholar] [CrossRef]
  14. Marinoni, G.; Van’t Land, H.; Jensen, T. The Impact of COVID-19 in Higher Education Around the Worlds. In IAU Global Survey Report; International Association of Universities: Paris, France, 2020. [Google Scholar]
  15. Dutta, S.; Smita, M.K. The Impact of COVID-19 Pandemic on Tertiary Education in Bangladesh: Students’ Perspectives. Open J. Soc. Sci. 2020, 8, 53–68. [Google Scholar] [CrossRef]
  16. Agaton, C.B.; Cueto, L.J. Learning at home: Parents’ lived experiences on distance learning during COVID-19 pandemic in the Philippines. Int. J. Eval. Res. Educ. 2021, 10, 901–911. [Google Scholar] [CrossRef]
  17. Chunyan, Y. Online Teaching Self-Efficacy, Social–Emotional Learning (SEL) Competencies, and Compassion Fatigue Among Educators During the COVID-19 Pandemic. Sch. Psychol. Rev. 2021, 50, 505–518. [Google Scholar]
  18. Morse, A.R.; Banfield, M.; Batterham, P.J.; Gulliver, A.; McCallum, S.; Cherbuin, N.; Farrer, L.M.; Calear, A.L. What could we do differently next time? Australian parents’ experiences of the short-term and long-term impacts of home schooling during the COVID-19 pandemic. BMC Public Health 2022, 22, 80. [Google Scholar] [CrossRef] [PubMed]
  19. Tzankova, I.; Compare, C.; Marzana, D.; Guarino, A.; Napoli, I.D.; Rochira, A.; Calandri, E.; Barbieri, I.; Procentese, F.; Gatti, F.; et al. Emergency online school learning during COVID-19 lockdown: A qualitative study of adolescents’ experiences in Italy. Curr. Psychol. 2022, 1–13. [Google Scholar] [CrossRef] [PubMed]
  20. Rekha, G. COVID-19: The Effects and Implications on Students Mental Health and Wellbeing. In Impact and Role of Digital Technologies in Adolescent Lives; Malik, S., Bansal, R., Tyagi, A.K., Eds.; IGI Global: Hershey, PA, USA, 2022. [Google Scholar]
  21. Antonova, E.; Schlosser, K.; Pandey, R.; Kumari, V. Coping With COVID-19: Mindfulness-Based Approaches for Mitigating Mental Health Crisis. Front. Psychiatry 2021, 12, 563417. [Google Scholar] [CrossRef] [PubMed]
  22. Bozkurt, A.; Jung, I.; Xiao, J.; Vladimirschi, V.; Schuwer, R.; Egorov, G.; Lambert, S.; Al-Freih, M.; Pete, J.; Olcott, D., Jr.; et al. A global outlook to the interruption of education due to COVID-19 Pandemic: Navigating in a time of uncertainty and crisis. Asian J. Distance Educ. 2020, 15, 1–126. [Google Scholar]
  23. Carretero-Gómez, S.; Napierała, J.; Bessios, A.; Magi, E.; Pugacewicz, A.; Ranieri, M.; Triquet, K.; Lombaerts, K.; Bottcher, N.R.; Montanari, M.; et al. What did We Learn from Schooling Practices during the COVID-19 Lockdown; Publications Office of the European Union: Luxembourg, 2021. [Google Scholar]
  24. Farris, D.G.; Kibbey, M.M.; Fedorenko, E.J.; Dibello, A.M. Qualitative Study of COVID-19 Distress in University Students. Emerg. Adulthood 2021, 9, 462–478. [Google Scholar] [CrossRef]
  25. Gómez-Salgado, J.; Andrés-Villas, M.; Domínguez-Salas, S.; Díaz-Milanés, D.; Ruiz-Frutos, C. Related Health Factors of Psychological Distress During the COVID-19 Pandemic in Spain. Int. J. Env. Res. Public Health 2020, 17, 3947. [Google Scholar] [CrossRef]
  26. Arora, A.; Jha, A.K.; Alat, P.; Das, S.S. Understanding coronaphobia. Asian J. Psychiatry 2020, 54, 102384. [Google Scholar] [CrossRef]
  27. García-Morales, V.J.; Garrido-Moreno, A.; Martín-Rojas, R. The Transformation of Higher Education After the COVID Disruption: Emerging Challenges in an Online Learning Scenario. Front. Psychol. 2021, 12, 616059. [Google Scholar] [CrossRef]
  28. Mishra, I.; Gupta, T.; Shree, A. Online teaching-learning in higher education during the lockdown period of COVID-19 pandemic. Int. J. Educ. Res. 2020, 1, 100012. [Google Scholar] [CrossRef] [PubMed]
  29. Govindarajan, V.; Srivastava, A. What the Shift to Virtual Learning Could Mean for the Future of Higher Education. Harv. Bus. Rev. 2020, 31, 3–8. [Google Scholar]
  30. Canaza-Choque, F.A. Educación superior en la cuarentena global: Disrupciones y transiciones. Rev. Digit. De Investig. En Docencia Univ. 2020, 14, e1315. Available online: http://www.scielo.org.pe/pdf/ridu/v14n2/2223-2516-ridu-14-02-e1315.pdf (accessed on 4 August 2021). [CrossRef]
  31. Liang, S.W.; Chen, R.N.; Liu, L.L.; Li, X.G.; Chen, J.B.; Tang, S.Y.; Zhao, J.B. The Impact of COVID-19 epidemic on Guangdong College students: The difference between seeking and not seeking psychological help. Front. Psychol. 2020. Available online: https://pubmed.ncbi.nlm.nih.gov/33013582/ (accessed on 4 August 2021).
  32. Fülop, M.T.; Breaz, T.O.; He, X.; Ionescu, C.A.; Cordoş, G.S.; Stanescu, S.G. The role of universities’ sustainability, teachers’ wellbeing, and attitudes toward e-learning during COVID-19. Front. Public Health 2022, 10, 981593. [Google Scholar] [CrossRef] [PubMed]
  33. Trust, T.; Whalen, J. Should Teachers be Trained in Emergency Remote Teaching? Lessons Learned from the COVID-19 Pandemic. J. Technol. Teach. Educ. 2020, 28, 189–199. [Google Scholar]
  34. Cresswell, J.W.; Plano Clark, V.L. Designing and Conducting Mixed Methods Research; SAGE Publications, Inc.: Thousand Oaks, CA, USA, 2011. [Google Scholar]
  35. Charmaz, K. Constructing Grounded Theory: A Practical Guide Through Qualitative Analysis; SAGE Publications, Ltd.: London, UK, 2006. [Google Scholar]
  36. Saldaña, J. The Coding Manual for Qualitative Researchers; Sage Publications Ltd.: New York, NY, USA, 2009. [Google Scholar]
  37. Saaty, T.L. Decision Making for Leaders: The Analytic Hierarchy Process; McGraw-Hill: New York, NY, USA, 1980. [Google Scholar]
  38. Mu, E.; Cooper, O.; Peasley, M. Best Practices in Analytic Network Process Studies. Expert Syst. Appl. 2020, 159, 113536. [Google Scholar] [CrossRef]
  39. Freundenberg, M. Composite Indicators of Country Performance: A Critical Assessment. In OECD Science, Technology and Industry Working Papers; Organisation for Economic Co-operation and Development (OECD): Paris, France, 2003; Volume 16. [Google Scholar]
  40. OECD. Handbook on Constructing Composite Indicators: Methodology and User Guide; OECD: Paris, France, 2008. [Google Scholar]
  41. Mu, E.; Stern, H. The City of Pittsburgh goes to the cloud: A case study of cloud strategic selection and deployment. J. Inf. Technol. Teach. Cases 2014, 4, 70–85. [Google Scholar] [CrossRef]
  42. Saaty, T.L. Theory and Applications of the Analytic Network Process; RWS Publications: Pittsburgh, PA, USA, 2005. [Google Scholar]
  43. Leon, Y.L.; Mu, E. Organizational MIndfulness Assessment and Its Impact on Rational Decision Making. Mathematics 2021, 9, 1851. [Google Scholar] [CrossRef]
  44. Saaty, T.L.; Peniwati, K. Group Decision Making: Drawing out and Reconciling Differences; RWS Publications: Pittsburgh, PA, USA, 2008. [Google Scholar]
  45. Mu, E.; Pereyra-Rojas, M. Practical Decision Making Using Super Decisions v3: An Introduction to the Analytic Hierarchy Process. In Springer Briefs in Operations Research; Springer International Publishing AG: Berlin/Heidelberg, Germany, 2018. [Google Scholar]
  46. Bandura, R. A Survey of Composite Indices Measuring Country Performance: 2006 Update. 2009. Available online: https://www.eldis.org/document/A43097 (accessed on 4 August 2021).
  47. Saaty, T.L. Multicriteria Decision Making—The Analytic Hierarchy Process; Extended Edition; AHP Series; RWS Publications: Pittsburgh, PA, USA, 1990; Volume 1. [Google Scholar]
  48. Greco, S.; Ishizaka, A.; Tasiou, M.; Torrisi, G. On the Methodological Framework of Composite Indices: A Review of the Issues of Weighting, Aggregation, and Robustness. Soc. Indic. Res. 2019, 141, 61–94. [Google Scholar] [CrossRef] [Green Version]
  49. Field, A. Discovering Statistics Using SPSS, 3rd ed.; Sage: London, UK, 2009. [Google Scholar]
  50. Stevens, J.P. Applied Multivariate Statistics for the Social Sciences, 4th ed.; Erlbaum: Hillsdale, NJ, USA, 2002. [Google Scholar]
  51. Means, B.; Bakia, M.; Murphy, R. Learning Online: What Research Tells Us about Whether, When and How; Routledge: New York, NY, USA, 2014. [Google Scholar]
  52. Network, S.E. Should Remote Teaching Sessions Be Shorter than Classroom Sessions? Academia Stack Exchange. 2022. Available online: https://academia.stackexchange.com/ (accessed on 4 August 2021).
  53. Ferri, F.; Grifoni, P.; Guzzo, T. Online Learning and Emergency Remote Teaching: Opportunities and Challenges in Emergency Situations. Societies 2020, 10, 86. [Google Scholar] [CrossRef]
  54. Huang, J. Successes and Challenges: Teaching and Learning Chemistry in Higher Education in China in the Time of COVID-19. J. Chem. Educ. 2020, 97, 2810–2814. [Google Scholar] [CrossRef]
  55. Sonn, I.K.; Du Plessis, M.; Jansen Van Vuuren, C.D.; Marais, J.; Wagener, E.; Roman, N.V. Achievements and Challenges for Higher Education during the COVID-19 Pandemic: A Rapid Review of Media in Africa. Int. J. Environ. Res. Public Health 2021, 18, 12888. [Google Scholar] [CrossRef]
  56. Branch, R.M.; Dousay, T.A. Survey of Instructional Design Models, 5th ed.; Association for Educational Communications and Technology (AECT): Bloomington, IN, USA, 2015. [Google Scholar]
  57. Guncaga, J.; Lopuchova, J.; Ferdianova, V.; Zacek, M.; Ashimov, Y. Survey on Online Learning at Universities of Slovakia, Czech Republic and Kazakhstan during the COVID-19 Pandemic. Educ. Sci. 2022, 12, 458. [Google Scholar] [CrossRef]
  58. World Bank. The COVID-19 Crisis Response: Supporting Tertiary Education for Continuity, Adaptation, and Innovation; World Bank: Washington, DC, USA, 2020. [Google Scholar]
  59. Bernard, R.M.; Abrami, P.C.; Borokhovski, E.; Wade, C.A.; Tamim, R.M.; Surkes, M.A.; Bethel, E.C. A Meta-Analysis of Three Types of Interaction Treatments in Distance Education. Rev. Educ. Res. 2009, 79, 243–289. [Google Scholar] [CrossRef]
  60. Baran, E.; Alzoubi, D. Human-Centered Design as a Frame for Transition to Remote Teaching during the COVID-19 Pandemic. J. Technol. TEacher Educ. 2020, 28, 365–372. [Google Scholar]
  61. Bouton, B. Empathy research and teacher preparation: Benefits and obstacles. SRATE J. 2016, 25, 16–25. [Google Scholar]
  62. Portillo, S.; Pierra, L.I.C.; González, Ó.U.R.; Nogales, O.I.G. Enseñanza remota de emergencia ante la pandemia COVID-19 en Educación Media Superior y Educación Superior. Propósitos y Representaciones. Rev. De Psicol. Educ. 2020, 8, e589. [Google Scholar]
  63. Rosario-Rodríguez, A.; González-Rivera, J.A.; Cruz-Santos, A.; Rodríguez-Ríos, L. Demandas tecnológicas, académicas y psicológicas en estudiantes universitarios durante la pandemia por COVID-19. Rev. Caribeña De Psicol. 2020, 4, 176–185. [Google Scholar] [CrossRef]
  64. Falloon, G. From digital literacy to digital competence: The teacher digital competency (TDC) framework. Educ. Tech. Res. Dev. 2020, 68, 2449–2472. [Google Scholar] [CrossRef] [Green Version]
  65. Quispe-Prieto, S.; Cavalcanti-Bandos, M.F.; Caipa-Ramos, M.; Paucar-Caceres, A.; Rojas-Jiménez, H.H. A Systemic Framework to Evaluate Student Satisfaction in Latin American Universities under the COVID-19 Pandemic. Systems 2021, 9, 15. [Google Scholar] [CrossRef]
  66. Hodges, C.B.; Barbour, M.; Ferdig, R.E. A 2025 Vision for Building Access to K-12 Online and Blended Learning in Pre-service Teacher Education. J. Technol. Teach. Educ. 2022, 30, 201–216. [Google Scholar]
  67. MINEDU. Retorno a clases presenciales será en marzo del 2022 y al 100%. In El Peruano; Ministerio de Educación—MINEDU: Lima, Perú, 2021. [Google Scholar]
  68. MINEDU. Marco normativo para el retorno Seguro. In Resolución Ministerial N° 048-2022-MINEDU 2022; Ministerio de Educación: Lima, Perú, 2022. [Google Scholar]
  69. INEI. Informe Técnico: Estadísticas de Las Tecnologías de Información y Comunicación en Los Hogares; Instituto Nacional de Estadística e Informática: Lima, Perú, 2020. [Google Scholar]
  70. INEI. El 55.0% de Los Hogares del País Accedieron a Internet en el Tercer Trimestre del 2021; Instituto Nacional de Estadística e Informática: Lima, Perú, 2021. [Google Scholar]
  71. Huanca-Arohuanca, J.; Supo-Condori, F.; Leon, R.S.; Quispe, L.A.S. El problema social de la educación virtual universitaria en tiempos de pandemia, Perú. Rev. Innov. Educ. 2020, 22, 115–128. [Google Scholar] [CrossRef]
  72. Degollación-Cox, A.P.; Rimac-Ventura, E. Teacher reflection on knowledge management in law teaching in times of COVID-19. Rev. Venez. De Gerenc. 2022, 27, 44–57. [Google Scholar]
  73. Aquino, O.F.; Zuta, P.M.; Cao, E.R. Remote teaching in professor training: Three Latin American experiences in times of COVID-19 pandemic. Educ. Sci. 2021, 11, 818. [Google Scholar] [CrossRef]
  74. Huamán-Romaní, Y.L.; Estrada-Pantía, J.; Olivares-Rivera, O.; Rodas-Guizado, E.; Fuentes-Bernedo, F. Use of Technological Equipment for E-learning in Peruvian University Students in Times of Covid-19. Int. J. Emerg. Technol. Learn. 2021, 16, 119–133. [Google Scholar] [CrossRef]
  75. Lovón, M.A.; Cisneros, S.A. Repercusiones de las clases virtuales en los estudiantes universitarios en el contexto de la cuarentena por COVID-19: El caso de la PUCP. Propósitos Y Represent. 2020, 8, 28. [Google Scholar] [CrossRef]
  76. European Commission; European Education and Culture Executive Agency (EACEA); Eurydice. The European Higher Education Area in 2020: Bologna Process Implementation Report; European Commission, European Education and Culture Executive Agency (EACEA), Eurydice, Eds.; Publications Office of the European Union: Luxembourg, 2020. [Google Scholar]
  77. Florek-Pazkowska, A. Wielokryterialne Problemy Decyzyjne W Proekologicznych Działaniach Produktowych Przedsiębiorstw in Działania Ekologiczne W Polityce Produktowej Przedsiębiorstw; Adamczyk, W., Ed.; Akapit: Toruń, Poland, 2013; pp. 121–141. [Google Scholar]
  78. Mu, E.; Pereyra-Rojas, M. Toma de Decisiones Prácticas: Una Introducción al Proceso Jerárquico Analítico (AHP) Usando SuperDecisions v2 y v3; MPR Trade: Pittsburgh, PA, USA, 2020. [Google Scholar]
Figure 1. Methods and Materials for the three phases of the research study.
Education 12 00704 g001
Figure 2. AHP preliminary assessment framework for virtual instruction challenges.
Education 12 00704 g002
Figure 3. Prioritization hierarchy for the challenges of virtual education.
Education 12 00704 g003
Figure 4. Priorities of the challenges of virtual education.
Education 12 00704 g004
Figure 5. Final AHP assessment framework for virtual instruction challenges.
Education 12 00704 g005
Table 1. Qualitative participant demographics (N = 50).
DemographicsCharacteristicsNo%
AgeLess than 20 years old1530%
21–24 years old2550%
25–29 years old48%
More/egual 30 years old612%
GenderFemale3264%
Male1836%
DisciplineAdministration510%
Economy36%
Engineering12%
Others4182%
Table 2. Prioritization survey demographics (N = 165).
DemographicsCharacteristicsNo%
AgeLess than 20 years old10.63%
25–29 years old2515%
30–34 years old4527.5%
GenderMore than 34 years old9457%
Male10464%
Female5436%
Table 3. Open question theme codes and their count.
Theme CodeThemesCount% Count
100Internet connectivity and lack of equipment by students
Internet connectivity and lack of equipment by Hi-Ed institutions
9920%
150112%
201Inadequate physical facilities to study (e.g., study in bed)
Inadequate environment to study (e.g., constant interruptions)
5511%
203296%
300Learning Platform (e.g., too cumbersome)143%
400Quality of Teaching (e.g., teachers untrained for virtual education)
Exams (e.g., not enough time)
9619%
50061%
600Access to Resources (e.g., library books)224%
700Lack of class interaction with students and teachers265%
800Personal Problems (e.g., physical exhaustion, lack of focus)479%
850Financial problems (student)61%
900Personal Organization Problems
Mental Health
235%
1000286%
1100University Admin
University Costs
41%
120092%
1300Financial problems (family)204%
Grand Total495100%
Table 4. Partial coding example.
600Access to Resources
601Lack of access to libraries
602Presentations are needed in addition to videos
603Insufficient study material
604lack of access to laboratories
605Lack of access to class resources due to lack of programs
606Lack of access to needed services (e.g., printing)
607Lack of access to the specific course material (e.g., design)
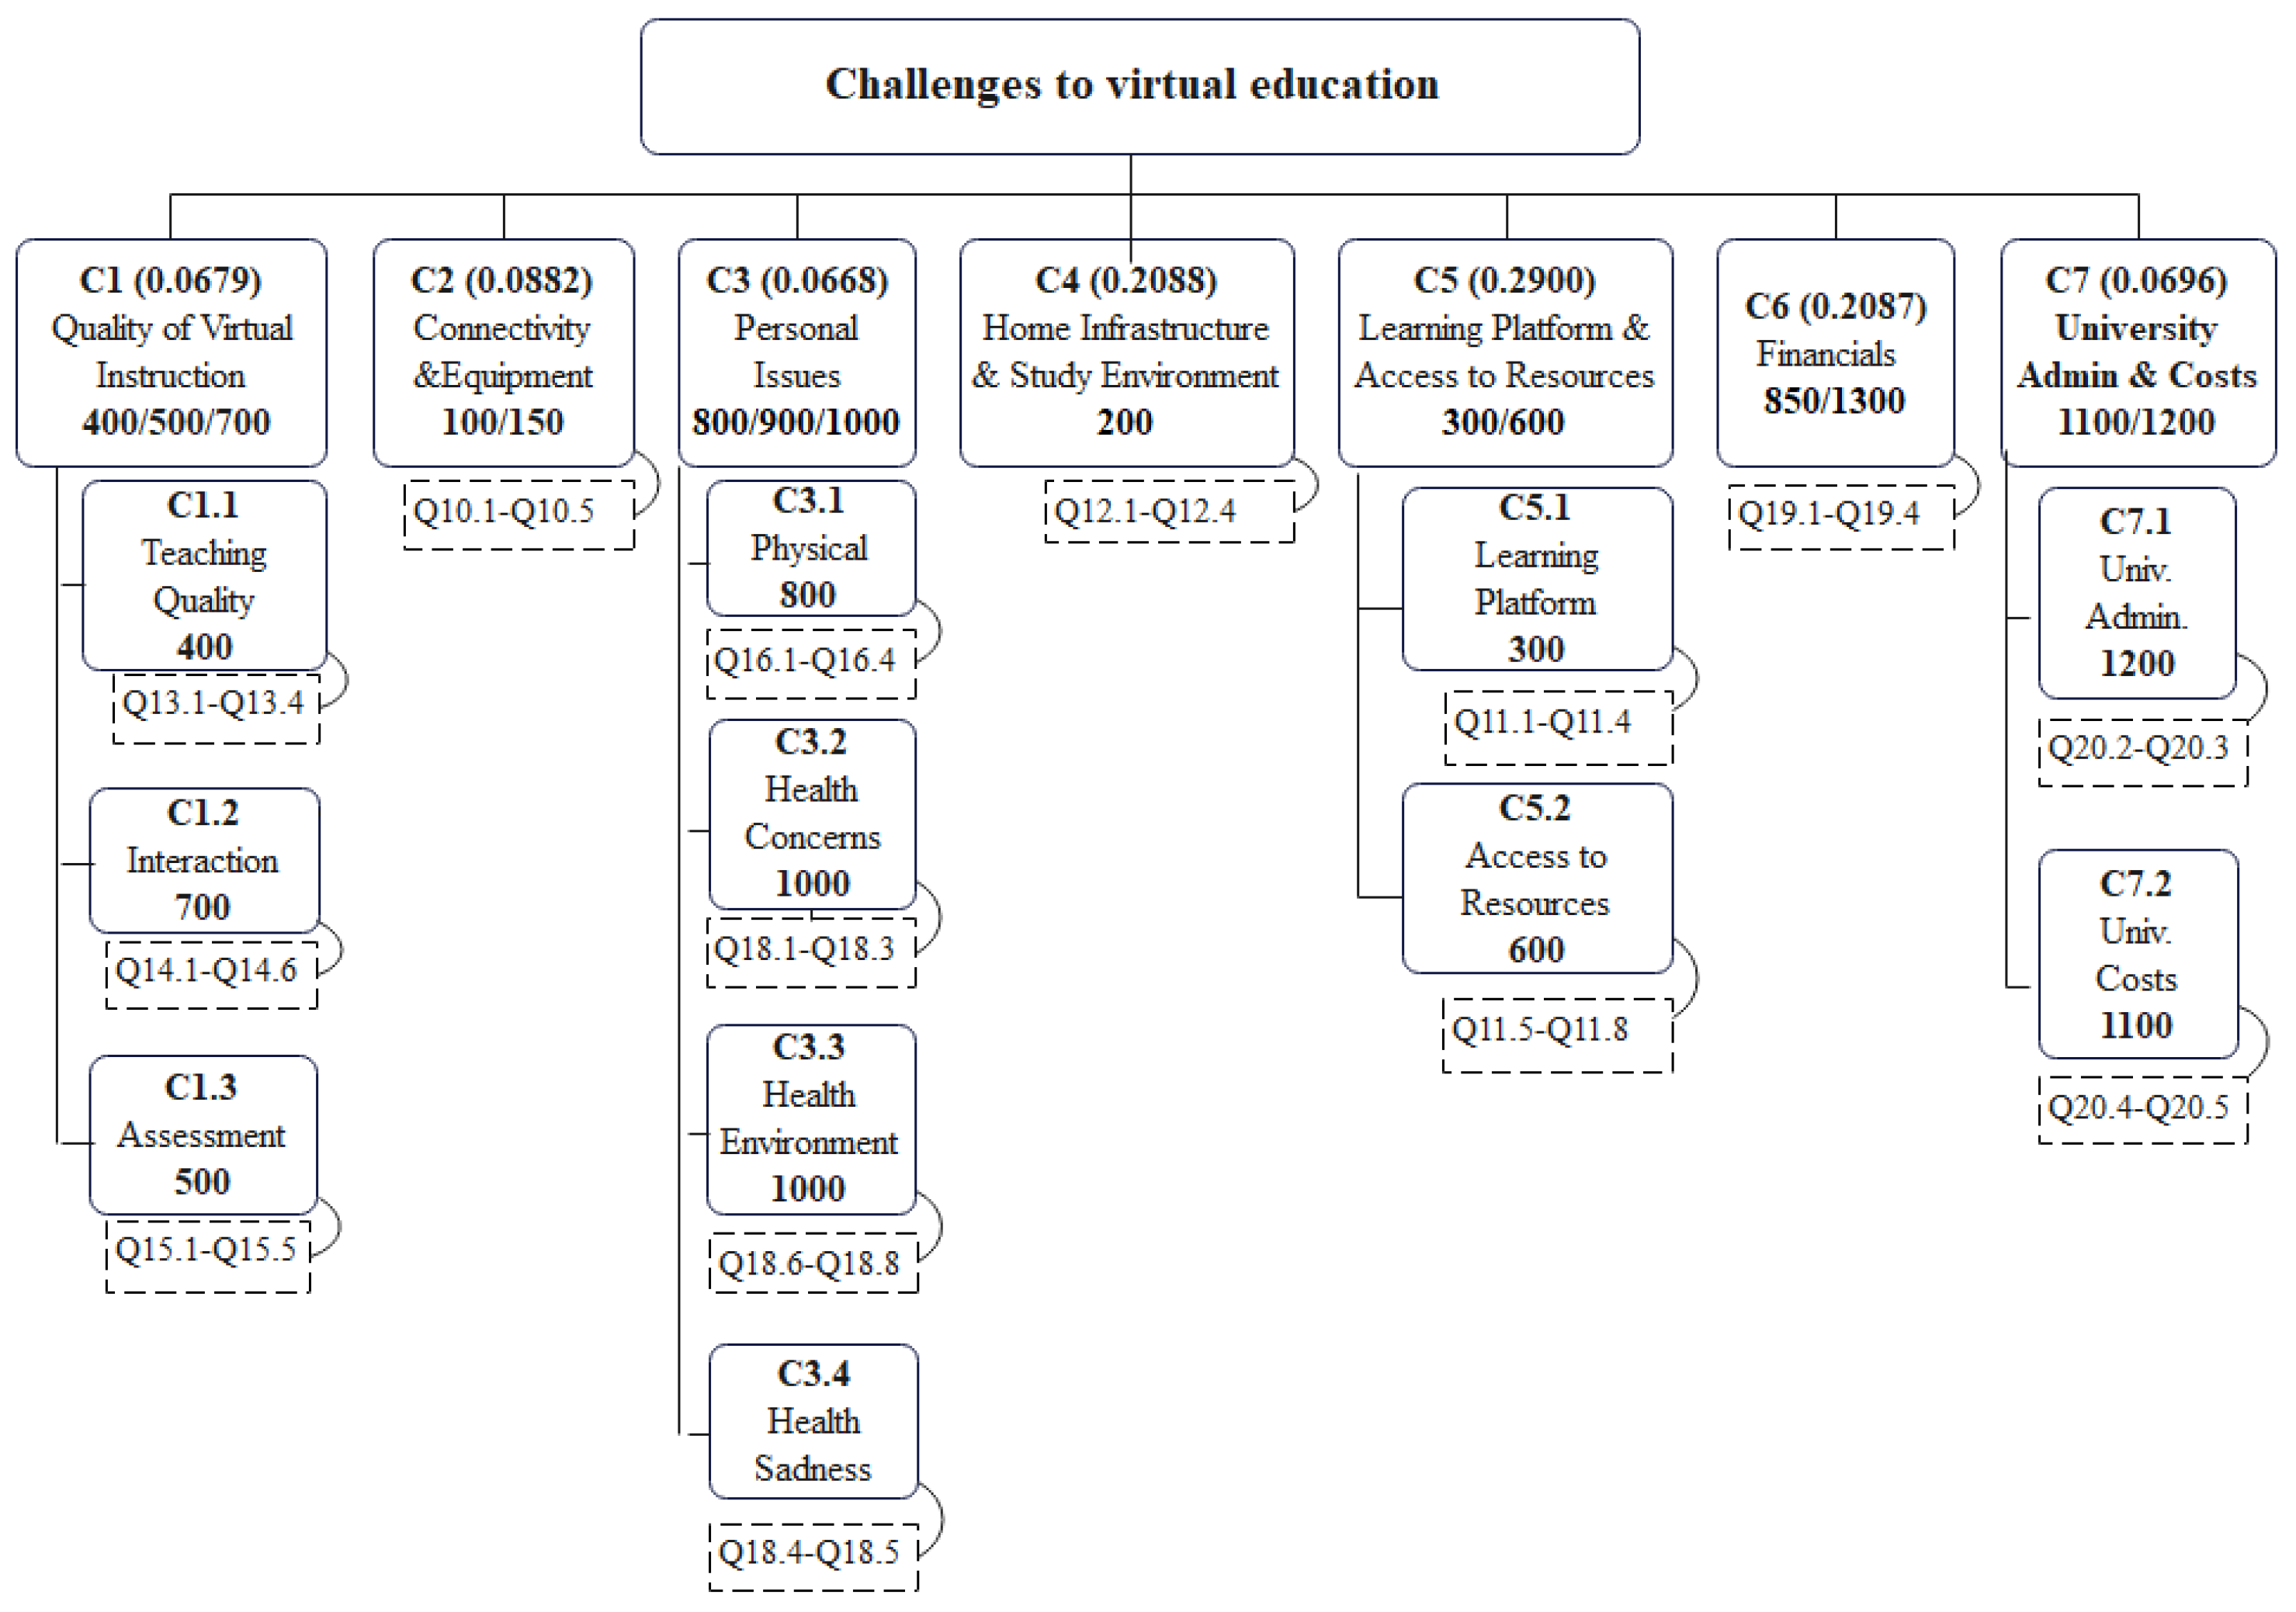
Table 5. Challenges for virtual education.
IDTheme CodesChallenge CategoriesCount% Total
C1400/500/700Quality of Virtual Instruction12826%
C2100/150Connectivity &Equipment11022%
C3800/900/1000Personal Issues9820%
C4200Home Infrastructure & Study Environment8417%
C5300/600Learning Platform & Access to Resources367%
C6850/1300Financial Problems 265%
C71100/1200University Admin &Costs133%
Grand Total4951
Table 6. Scale reliability and descriptive statistics.
12345678910111213#
VariableItemsAlphaMeanSDC1.1C1.2C1.3C2C3.1C3.2C3.3C3.4C4C5.1C5.2C6C7.1C7.2
1C1.1.QUALITY40.8411.7870.9161
2C1.2.INTERACTION90.9142.7801.1060.622 **1
3C1.3.ASSESSMENT50.8172.5280.9830.571 **0.714 **1
4C2.EQUIPMENT50.7911.6300.7840.248 **0.1740.205 *1
5C3.1PERSONAL60.8343.1541.0190.528 **0.691 **0.619 **0.239 *1
6C3.2MENTAL CONCERNS30.7303.0611.0610.277 **0.404 **0.387 **0.267 **0.339 **1
7C3.3MENTAL ENVIRONMT30.7252.7691.0590.460 **0.507 **0.635 **0.0680.550 **0.344 *1
8C3.4MENTAL SADNESS20.7203.5351.1360.0770.0530.1190.1340.0840.421 **0.0911
9C4HOME INFRASTR.40.8452.5771.2010.555 **0.482 **0.440 **0.358 **0.604 **0.1720.410 **0.0571
10C5.1LEARNING PLATFORM40.7221.7020.7310.662 **0.425 **0.373 **0.470 **0.380 **0.346 **0.276 **0.1290.471 **1
11C5.2ACCESS TO RESOURCES40.8152.7151.1280.557 **0.590 **0.547 **0.261 **0.505 **0.328 **0.387 **0.0720.466 **0.492 **1
12C6FINANCIALS40.8172.9151.0190.229 *0.379 **0.385 **0.366 **0.306 **0.401 **0.260 **0.223 *0.297 **0.214 *0.302 **1
13C7.1UNIVERSITY ADMIN20.7172.3981.0670.536 **0.498 **0.603 **0.130.388 **0.337 **0.472 **0.1470.317 **0.369 **0.499 **0.365 **1
14C7.2.UNIVERSITY COSTS20.8194.0401.0910.1810.289 **0.225 *0.0620.311 **0.311 **0.215 *0.213 *0.140.266 **0.318 **0.308 **0.269 **1
Listwise N = 117; ** Significant at 0.1 level (two-tailed); * Significant at 0.5 level (two-tailed).
Table 7. Virtual Teaching Challenge Themes during the Pandemic (Phase I and II).
Challenge
ID
DescriptionChallenge Rank *
Phase I
Importance
Priority
Phase II
Priority
Rank **
Phase II
C1Perceived quality of instruction/learning10.06796
C2Poor Internet connectivity and lack of proper equipment20.08824
C3Personal and psychological issues30.06687
C4Lack of appropriate home infrastructure40.20882
C5Learning platform and access to resources50.29001
C6Financial issues related to students and families60.20873
C7General concerns related to the university and others70.06965
Note—* ranked by frequency of quotes,** Ranked by priority.
Publisher’s Note: MDPI stays neutral with regard to jurisdictional claims in published maps and institutional affiliations.

