Modeling and Measuring Pre-Service Teachers’ Assessment Literacy Regarding Experimentation Competences in Biology

Abstract
:1. Introduction
1.1. Assessment Literacy as Part of Professional Knowledge
1.2. Assessment of Students’ Experimentation Competences
1.3. Research Questions and Hypotheses
2. Methods
2.1. Participants and Data Collection
2.2. Measurement Instrument
2.3. Coding of Knowledge of What to Assess Regarding Experimentation Competences
2.4. Validation Instruments
2.5. IRT Modeling and Further Analyses
3. Results
3.1. Modeling and Measuring Knowledge of What to Assess Regarding Experimentation Competences
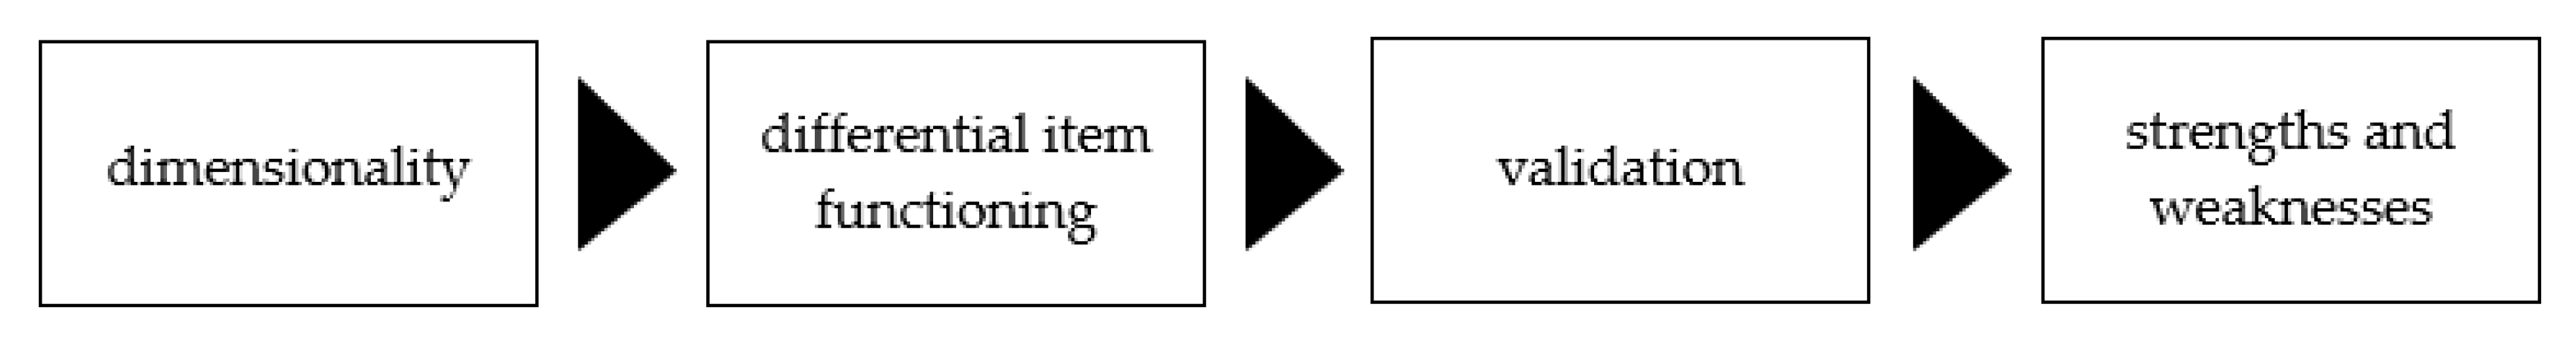
3.1.1. Dimensionality
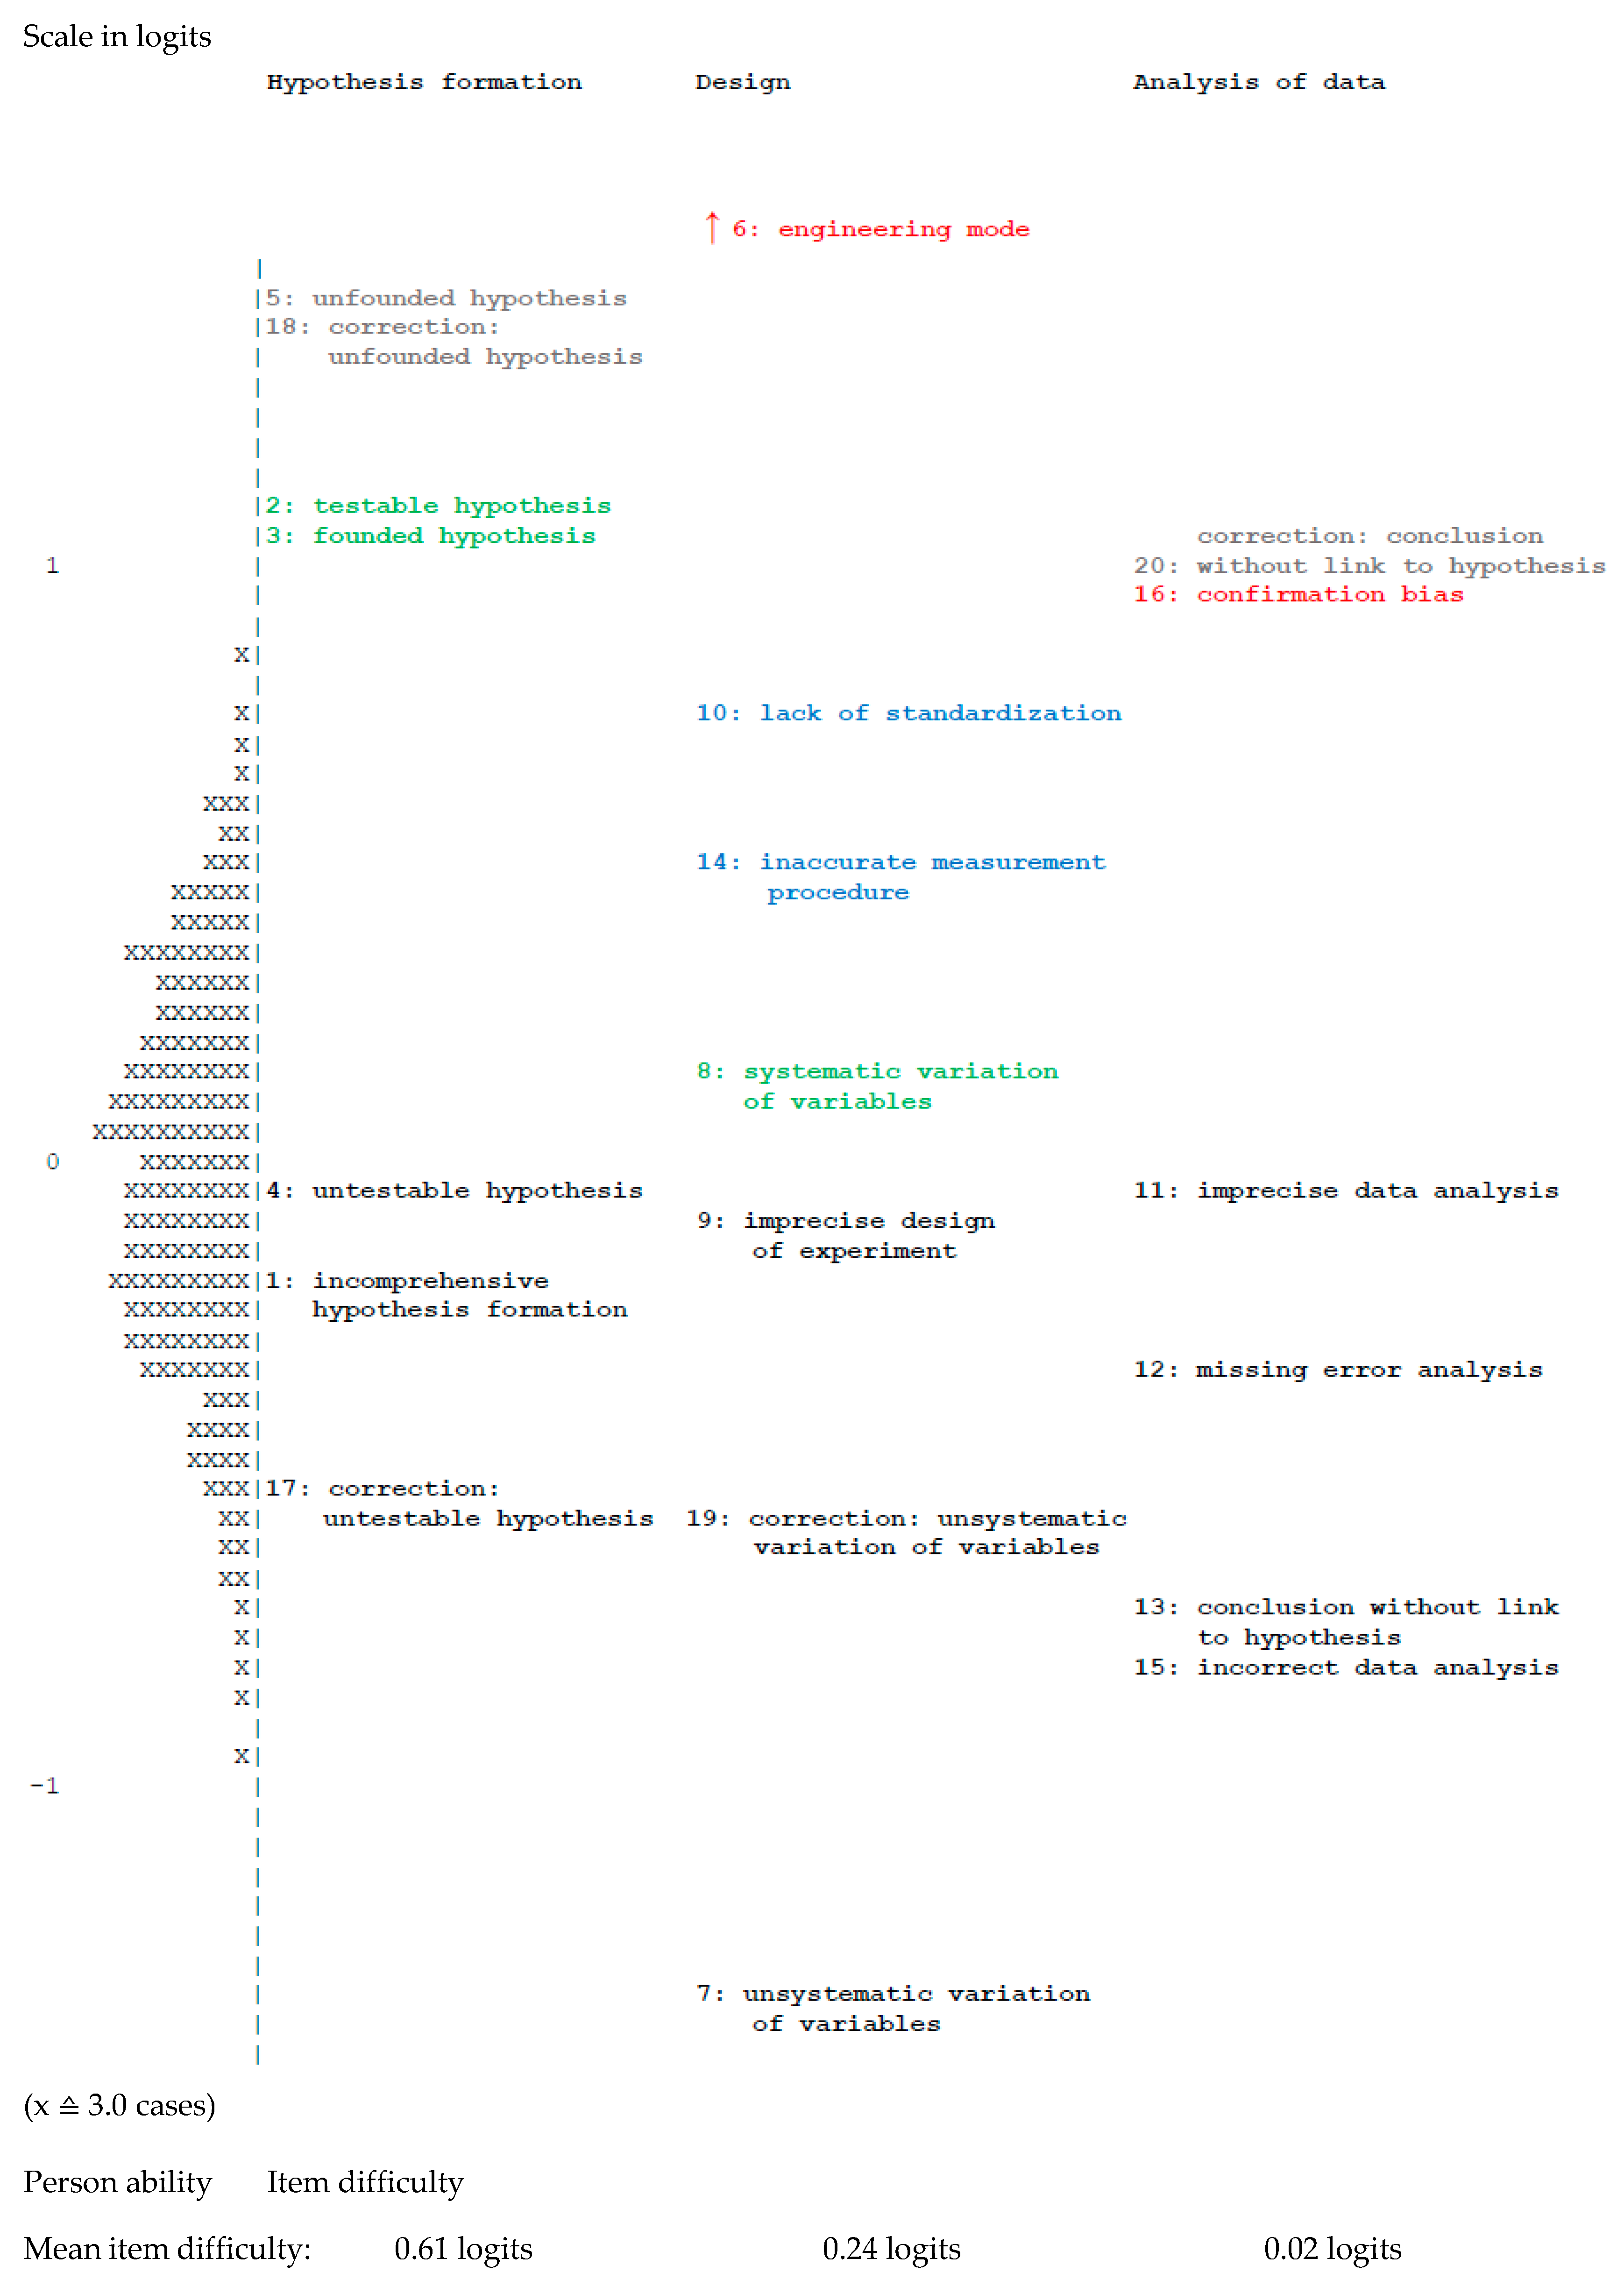
3.1.2. Test and Item Parameters
3.1.3. Differential Item Functioning
3.2. Validation of Knowledge of What to Assess with Related Constructs, Educational Outcomes, and Comparison of Known Groups
3.2.1. Relationship to Related Constructs
3.2.2. Relationship to Grades and Learning Opportunities
3.2.3. Comparison of Known Groups
3.3. Strengths and Weaknesses Concerning Knowledge of What to Assess Regarding Experimentation Competences
4. Discussion
4.1. Dimensionality and Test Quality
4.2. Validation
4.3. Strengths and Weaknesses of Pre-Service Biology Teachers Regarding Knowledge of What to Assess Regarding Experimentation Competences
4.4. Limitations
5. Conclusions
Author Contributions
Funding
Acknowledgments
Conflicts of Interest
Appendix A

 |
 |
References
- Black, P.; Wiliam, D. Assessment and Classroom Learning. Assess. Educ. 1998, 5, 7–74. [Google Scholar] [CrossRef]
- Abell, S.K.; Volkmann, M.J. Seamless Assessment in Science: A Guide for Elementary and Middle School Teachers; Heinemann: Portsmouth, NH, USA, 2006; ISBN 978-0-325-00769-4. [Google Scholar]
- Hattie, J.; Jaeger, R. Assessment and Classroom Learning: A deductive approach. Assess. Educ. 1998, 5, 111–122. [Google Scholar] [CrossRef]
- Kultusministerkonferenz, K.M.K. (Ed.) Bildungsstandards im Fach Biologie für den Mittleren Schulabschluss; Wolters Kluwer Deutschland GmbH: München, Germany, 2005. [Google Scholar]
- National Research Council. National Science Education Standards; The National Academies Press: Washington, DC, USA, 1996; ISBN 978-0-309-05326-6. [Google Scholar]
- Hammann, M. Kompetenzentwicklungsmodelle: Merkmale und ihre Bedeutung—Dargestellt anhand von Kompetenzen beim Experimentieren. MNU 2004, 57, 196–203. [Google Scholar]
- Hammann, M.; Phan, T.T.H.; Ehmer, M.; Bayrhuber, H. Fehlerfrei Experimentieren. MNU 2006, 59, 292–299. [Google Scholar]
- Xu, Y.; Brown, G.T.L. Teacher assessment literacy in practice: A reconceptualization. Teach. Teach. Educ. 2016, 58, 149–162. [Google Scholar] [CrossRef]
- Klieme, E.; Avenarius, H.; Blum, W.; Döbrich, P.; Gruber, H.; Prenzel, M.; Reiss, K.; Riquarts, K.; Rost, J.; Tenorth, H.-E.; et al. The Development of National Education Standards: An Expertise; Bundesministerium für Bildung und Forschung: Berlin, Germany, 2004.
- Winterton, J.; Delamare-Le Deist, F.; Stringfellow, E. Typology of Knowledge, Skills, and Competences: Clarification of the Concept and Prototype; Office for Official Publications of the European Communities: Luxembourg, 2006; ISBN 92-896-0427-1.
- Méhaut, P.; Winch, C. The European Qualification Framework: Skills, Competences or Knowledge? Eur. Educ. Res. J. 2012, 11, 369–381. [Google Scholar] [CrossRef]
- der Kultusministerkonferenz, B. (Ed.) Ländergemeinsame inhaltliche Anforderungen für die Fachwissenschaften und Fachdidaktiken in der Lehrerbildung. Available online: https://www.kmk.org/fileadmin/Dateien/veroeffentlichungen_beschluesse/2008/2008_10_16-Fachprofile-Lehrerbildung.pdf (accessed on 16 March 2020).
- Stiggins, R. Assessment Literacy. Phi Delta Kappan 1991, 72, 534–539. [Google Scholar]
- Dübbelde, G. Diagnostische Kompetenzen angehender Biologie-Lehrkräfte im Bereich der naturwissenschaftlichen Erkenntnisgewinnung. Ph.D. Thesis, Universität Kassel, Kassel, Germany, 2013. Available online: https://kobra.uni-kassel.de/handle/123456789/2013122044701 (accessed on 16 March 2020).
- Magnusson, S.; Krajcik, J.; Borko, H. Nature, Sources and Development of Pedagogical Content Knowledge for Science Teaching. In Examining Pedagogical Content Knowledge; Gess-Newsome, J., Lederman, N.G., Eds.; Springer: Dordrecht, The Netherlands, 1999; pp. 95–132. ISBN 978-0-7923-5903-6. [Google Scholar]
- Abell, S.K.; Siegel, M.A. Assessment Literacy: What Science Teachers Need to Know and Be Able to Do. In The Professional Knowledge Base of Science Teaching; Corrigan, D., Dillon, J., Gunstone, R., Eds.; Springer: Dordrecht, The Netherlands, 2011; pp. 205–221. ISBN 978-90-481-3926-2. [Google Scholar]
- OECD. PISA for Development Science Framework. In PISA for Development Assessment and Analytical Framework: Reading, Mathematics and Science; OECD Publishing: Paris, France, 2018; pp. 71–97. [Google Scholar] [CrossRef]
- Schulz, A.; Wirtz, M.; Starauschek, E. Das Experiment in den Naturwissenschaften. In Experimentieren im Mathematisch-Naturwissenschaftlichen Unterricht; Rieß, W., Wirtz, M., Barzel, B., Schulz, A., Eds.; Waxmann: Münster, Germany, 2012; pp. 15–18. [Google Scholar]
- Klautke, S. Ist das Experimentieren im Biologieunterricht noch zeitgemäß? MNU 1997, 50, 323–329. [Google Scholar]
- Klahr, D. Exploring Science: The Cognition and Development of Discovery Processes; The MIT Press: Cambridge, MA, USA, 2000. [Google Scholar]
- Li, J.; Klahr, D. The Psychology of Scientific Thinking: Implications for Science Teaching and Learning. In Teaching Science in the 21st Century; Rhoton, J., Shane, P., Eds.; NSTA Press: Arlington, VA, USA, 2006; pp. 307–328. [Google Scholar]
- Wellnitz, N. Kompetenzstruktur und -Niveaus von Methoden Naturwissenschaftlicher Erkenntnisgewinnung; Logos: Berlin, Germany, 2012. [Google Scholar]
- Ehmer, M. Förderung von kognitiven Fähigkeiten beim Experimentieren im Biologieunterricht der 6. Klasse: Eine Untersuchung zur Wirksamkeit von methodischem, epistemologischem und negativem Wissen. Ph.D. Thesis, Christian-Albrechts-Universität Kiel, Kiel, Germany, 2008. Available online: https://macau.uni-kiel.de/servlets/MCRFileNodeServlet/dissertation_derivate_00002469/diss_ehmer.pdf (accessed on 16 March 2020).
- Koslowski, B. Theory and Evidence: The Development of Scientific Reasoning; The MIT Press: Cambridge, MA, USA, 1996. [Google Scholar]
- Mayer, J.; Ziemek, H.-P. Offenes Experimentieren: Forschendes Lernen im Biologieunterricht. Unterr. Biol. 2006, 317, 4–12. [Google Scholar]
- Krüger, D. Bezaubernde Biologie—Mit Hypothesen der Lösung auf der Spur. MNU 2009, 62, 41–46. [Google Scholar]
- Schauble, L.; Klopfer, E.; Raghaven, K. Students’ Transition from an Engineering Model to a Science Model of Experimentation. J. Res. Sci. Teach. 1991, 9, 859–882. [Google Scholar] [CrossRef]
- Köhler, K. Welche fachgemäßen Arbeitsweisen werden im Biologieunterricht eingesetzt? In Biologie Didaktik. Praxishandbuch für die Sekundarstufe I und II; Spörhase-Eichmann, U., Ruppert, W., Eds.; Cornelsen: Berlin, Germany, 2004; pp. 146–159. [Google Scholar]
- Straube, P. Modellierung und Erfassung von Kompetenzen naturwissenschaftlicher Erkenntnisgewinnung bei (Lehramts-) Studierenden im Fach Physik; Logos: Berlin, Germany, 2016. [Google Scholar]
- Bouffard-Bouchard, T.; Parent, S.; Larivee, S. Influence of Self-Efficacy on Self-Regulation and Performance among Junior and Senior High-School Age Students. Int. J. Behav. Dev. 1991, 14, 153–164. [Google Scholar] [CrossRef]
- Tschannen-Moran, M.; Woolfolk Hoy, A.; Hoy, W.K. Teacher Efficacy: Its Meaning and Measure. Rev. Educ. Res. 1998, 68, 202–248. [Google Scholar] [CrossRef]
- Saklofske, D.; Michaluk, B.; Randhawa, B. Teachers’ Efficacy and Teaching Behaviors. Psychol. Rep. 1988, 63, 407–414. [Google Scholar] [CrossRef]
- Grube, C.R. Kompetenzen naturwissenschaftlicher Erkenntnisgewinnung: Untersuchung der Struktur und Entwicklung des wissenschaftlichen Denkens bei Schülerinnen und Schülern der Sekundarstufe I. Ph.D. Thesis, Universität Kassel, Kassel, Germany, 2010. Available online: https://kobra.uni-kassel.de/handle/123456789/2011041537247 (accessed on 16 March 2020).
- Hammann, M.; Phan, T.T.H.; Bayrhuber, H. Experimentieren als Problemlösen: Lässt sich das SDDS-Modell nutzen, um unterschiedliche Dimensionen beim Experimentieren zu messen? Z. Erzieh. 2007, 8, 33–49. [Google Scholar]
- Krüger, D.; Upmeier zu Belzen, A.; Nordmeier, V.; Tiemann, R.; Hartmann, S.; Mathesius, S.; Stiller, J.; Straube, P. Kooperation der Projekte Ko-WADiS und ExMo. Unpublished.
- Bögeholz, S.; Joachim, C.; Hasse, S.; Hammann, M. Kompetenzen von (angehenden) Biologielehrkräften zur Beurteilung von Experimentierkompetenzen. Unterrichtswissenschaft 2016, 44, 40–54. [Google Scholar]
- List, M.K. Testbearbeitungsverhalten in Leistungstests: Modellierung von Testabbruch und Leistungsabfall. Ph.D. Thesis, Christian-Albrechts-Universität Kiel, Kiel, Germany, 2018. Available online: https://macau.uni-kiel.de/servlets/MCRFileNodeServlet/dissertation_derivate_00007735/diss_mk_list_testbearbeitungsverhalten_in_leistungstests.pdf (accessed on 16 March 2020).
- Kultusministerium, N. (Ed.) Kerncurriculum für das Gymnasium Schuljahrgänge 5 -10: Naturwissenschaften. 2007. Available online: http://db2.nibis.de/1db/cuvo/datei/kc_gym_nws_07_nib.pdf (accessed on 16 March 2020).
- Mayring, P. Qualitative Inhaltsanalyse: Grundlagen und Techniken; Beltz: Weinheim, Germany, 2010. [Google Scholar]
- Donner, A.; Rotondi, M.A. Sample Size Requirements for Interval Estimation of the Kappa Statistic for Interobserver Agreement Studies with a Binary Outcome and Multiple Raters. Int. J. Biostat. 2010, 6. [Google Scholar] [CrossRef] [Green Version]
- De Swert, K. Calculating Inter-Coder Reliability in Media Content Analysis Using Krippendorff’s Alpha. Available online: https://www.polcomm.org/wp-content/uploads/ICR01022012.pdf (accessed on 16 March 2020).
- Mahler, H. Selbstwirksamkeitserwartungen angehender Biologielehrkräfte—Entwicklung eines Messinstrumentes. Master’s Thesis, Georg-August-Universität Göttingen, Göttingen, Germany, 2014. Unpublished. [Google Scholar]
- Masters, G.N. A Rasch model for partial credit scoring. Psychometrika 1982, 47, 149–174. [Google Scholar] [CrossRef]
- Wu, M.L.; Adams, R.J.; Wilson, M.R.; Haldane, S.A. ACER ConQuest Version 2.0: Generalised Item Response Modelling Software; Australian Council for Educational Research: Camberwell, Victoria, Australia, 2007. [Google Scholar]
- Boone, W.J.; Staver, J.R.; Yale, M.S. Rasch Analysis in the Human Sciences; Springer: Dordrecht, The Netherlands, 2014. [Google Scholar]
- Bond, T.G.; Fox, C.M. Applying the Rasch Model; Routledge: New York, NY, USA, 2015. [Google Scholar]
- OECD. PISA 2006 Technical Report; OECD: Paris, France, 2009. [Google Scholar]
- Pohl, S.; Carstensen, C.H. NEPS Technical Report—Scaling the Data of the Competence Tests (NEPS Working Paper No. 14); Otto-Friedrich-Universität, Nationales Bildungspanel: Bamberg, Germany, 2012. [Google Scholar]
- Schecker, H.; Parchmann, I. Modellierung naturwissenschaftlicher Kompetenz. ZfDN 2006, 12, 45–66. [Google Scholar]
- Velten, S.; Nitzschke, A.; Nickolaus, R.; Walker, F. Die Fachkompetenzstruktur von Technikern für Elektrotechnik und Einflussfaktoren auf ihre Kompetenzentwicklung. J. Technol. Educ. 2018, 6, 201–222. [Google Scholar]
- Kultusministerium, N. (Ed.) Kerncurriculum für das Gymnasium Schuljahrgänge 5–10: Naturwissenschaften. 2015. Available online: https://db2.nibis.de/1db/cuvo/datei/nw_gym_si_kc_druck.pdf (accessed on 16 March 2020).
- Völzke, K.; Arnold, J.; Kremer, K. Denken und Verstehen beim naturwissenschaftlichen Problemlösen. Eine explorative Studie. Z. Interpret. Schul Unterr. 2013, 2, 58–86. [Google Scholar] [CrossRef]
- Chen, Z.; Klahr, D. All Other Things Being Equal: Acquisition and Transfer of the Control of Variables Strategy. Child Dev. 1999, 70, 1098–1120. [Google Scholar] [CrossRef] [PubMed] [Green Version]
- University of Washington. Understanding Item Analyses. Available online: https://www.washington.edu/assessment/scanning-scoring/scoring/reports/item-analysis/ (accessed on 16 March 2020).
- Baack, K.; Steinert, K. Natura 7/8 Biologie für Gymnasien, Niedersachsen; Klett: Stuttgart, Germany, 2015. [Google Scholar]
- Hammann, M. Experimentieren. In Biologie-Methodik. Handbuch für die Sekundarstufe I und II; Spörhase, U., Ruppert, W., Eds.; Cornelsen: Berlin, Germany, 2014; pp. 102–106. [Google Scholar]
- Bayrhuber, H.; Hammann, M. (Eds.) Linder Biologie: Abi-Aufgabentrainer, Wissen Anwenden und Kompetenzen Einüben; Schroedel: Braunschweig, Germany, 2013. [Google Scholar]
- Bühner, M. Einführung in die Test- und Fragebogenkonstruktion; Pearson: Hallbergmoos, Germany, 2011. [Google Scholar]
- Stecher, B.M.; Klein, S.P. The Cost of Science Performance Assessments in Large-Scale Testing Programs. Educ. Eval. Policy Anal. 1997, 10, 1–14. [Google Scholar] [CrossRef]
- Shavelson, R.F. Measuring College Learning Responsibly: Accountability in a New Era; Stanford University Press: Stanford, CA, USA, 2009. [Google Scholar]
- Bundesministerium für Bildung und Forschung. Qualitätsoffensive Lehrerbildung. Available online: https://www.qualitaetsoffensive-lehrerbildung.de/de/fachwissenschaften-fachdidaktik-und-bildungswissenschaften-1803.html (accessed on 10 February 2020).
- Eggert, S.; Bögeholz, S. Students’ Use of Decision-Making Strategies With Regard to Socioscientific Issues: An Application of the Rasch Partial Credit Model. Sci. Educ. 2010, 94, 230–258. [Google Scholar] [CrossRef]
- Arnold, J.; Kremer, K.; Mayer, J. Wissenschaftliches Denken beim Experimentieren – Kompetenzdiagnose in der Sekundarstufe II. Erkenn. Biol. 2012, 11, 7–20. [Google Scholar]
- Mayer, J.; Grube, C.; Möller, A. Kompetenzmodell naturwissenschaftlicher Erkenntnisgewinnung. In Lehr- und Lernforschung in der Biologiedidaktik (Band 3); Harms, U., Sandmann, A., Eds.; StudienVerlag: Innsbruck, Austria, 2008; pp. 63–78. [Google Scholar]
- Hasse, S.; Joachim, C.; Bögeholz, S.; Hammann, M. Assessing teaching and assessment competences of biology teacher trainees: Lessons from item development. Int. J. Educ. Math. Sci. Technol. 2014, 2, 191–205. [Google Scholar] [CrossRef] [Green Version]


| Seed Germination | Photosynthesis | Enzymology | |
|---|---|---|---|
| Hypothesis formation | Scenario 1 with items 1, 2, 3 | Scenario 4 with items 4, 5, 17, 18 | |
| Design of an experiment | Scenario 2 with items 6, 7, 19 | Scenario 5 with items 13, 14, 20 | Scenario 6 with items 8, 9, 10 |
| Analysis of data | Scenario 3 with items 11, 12 | Scenario 7 with items 15, 16 |
| Scoring | Exemplary Answers | ||||||||
|---|---|---|---|---|---|---|---|---|---|
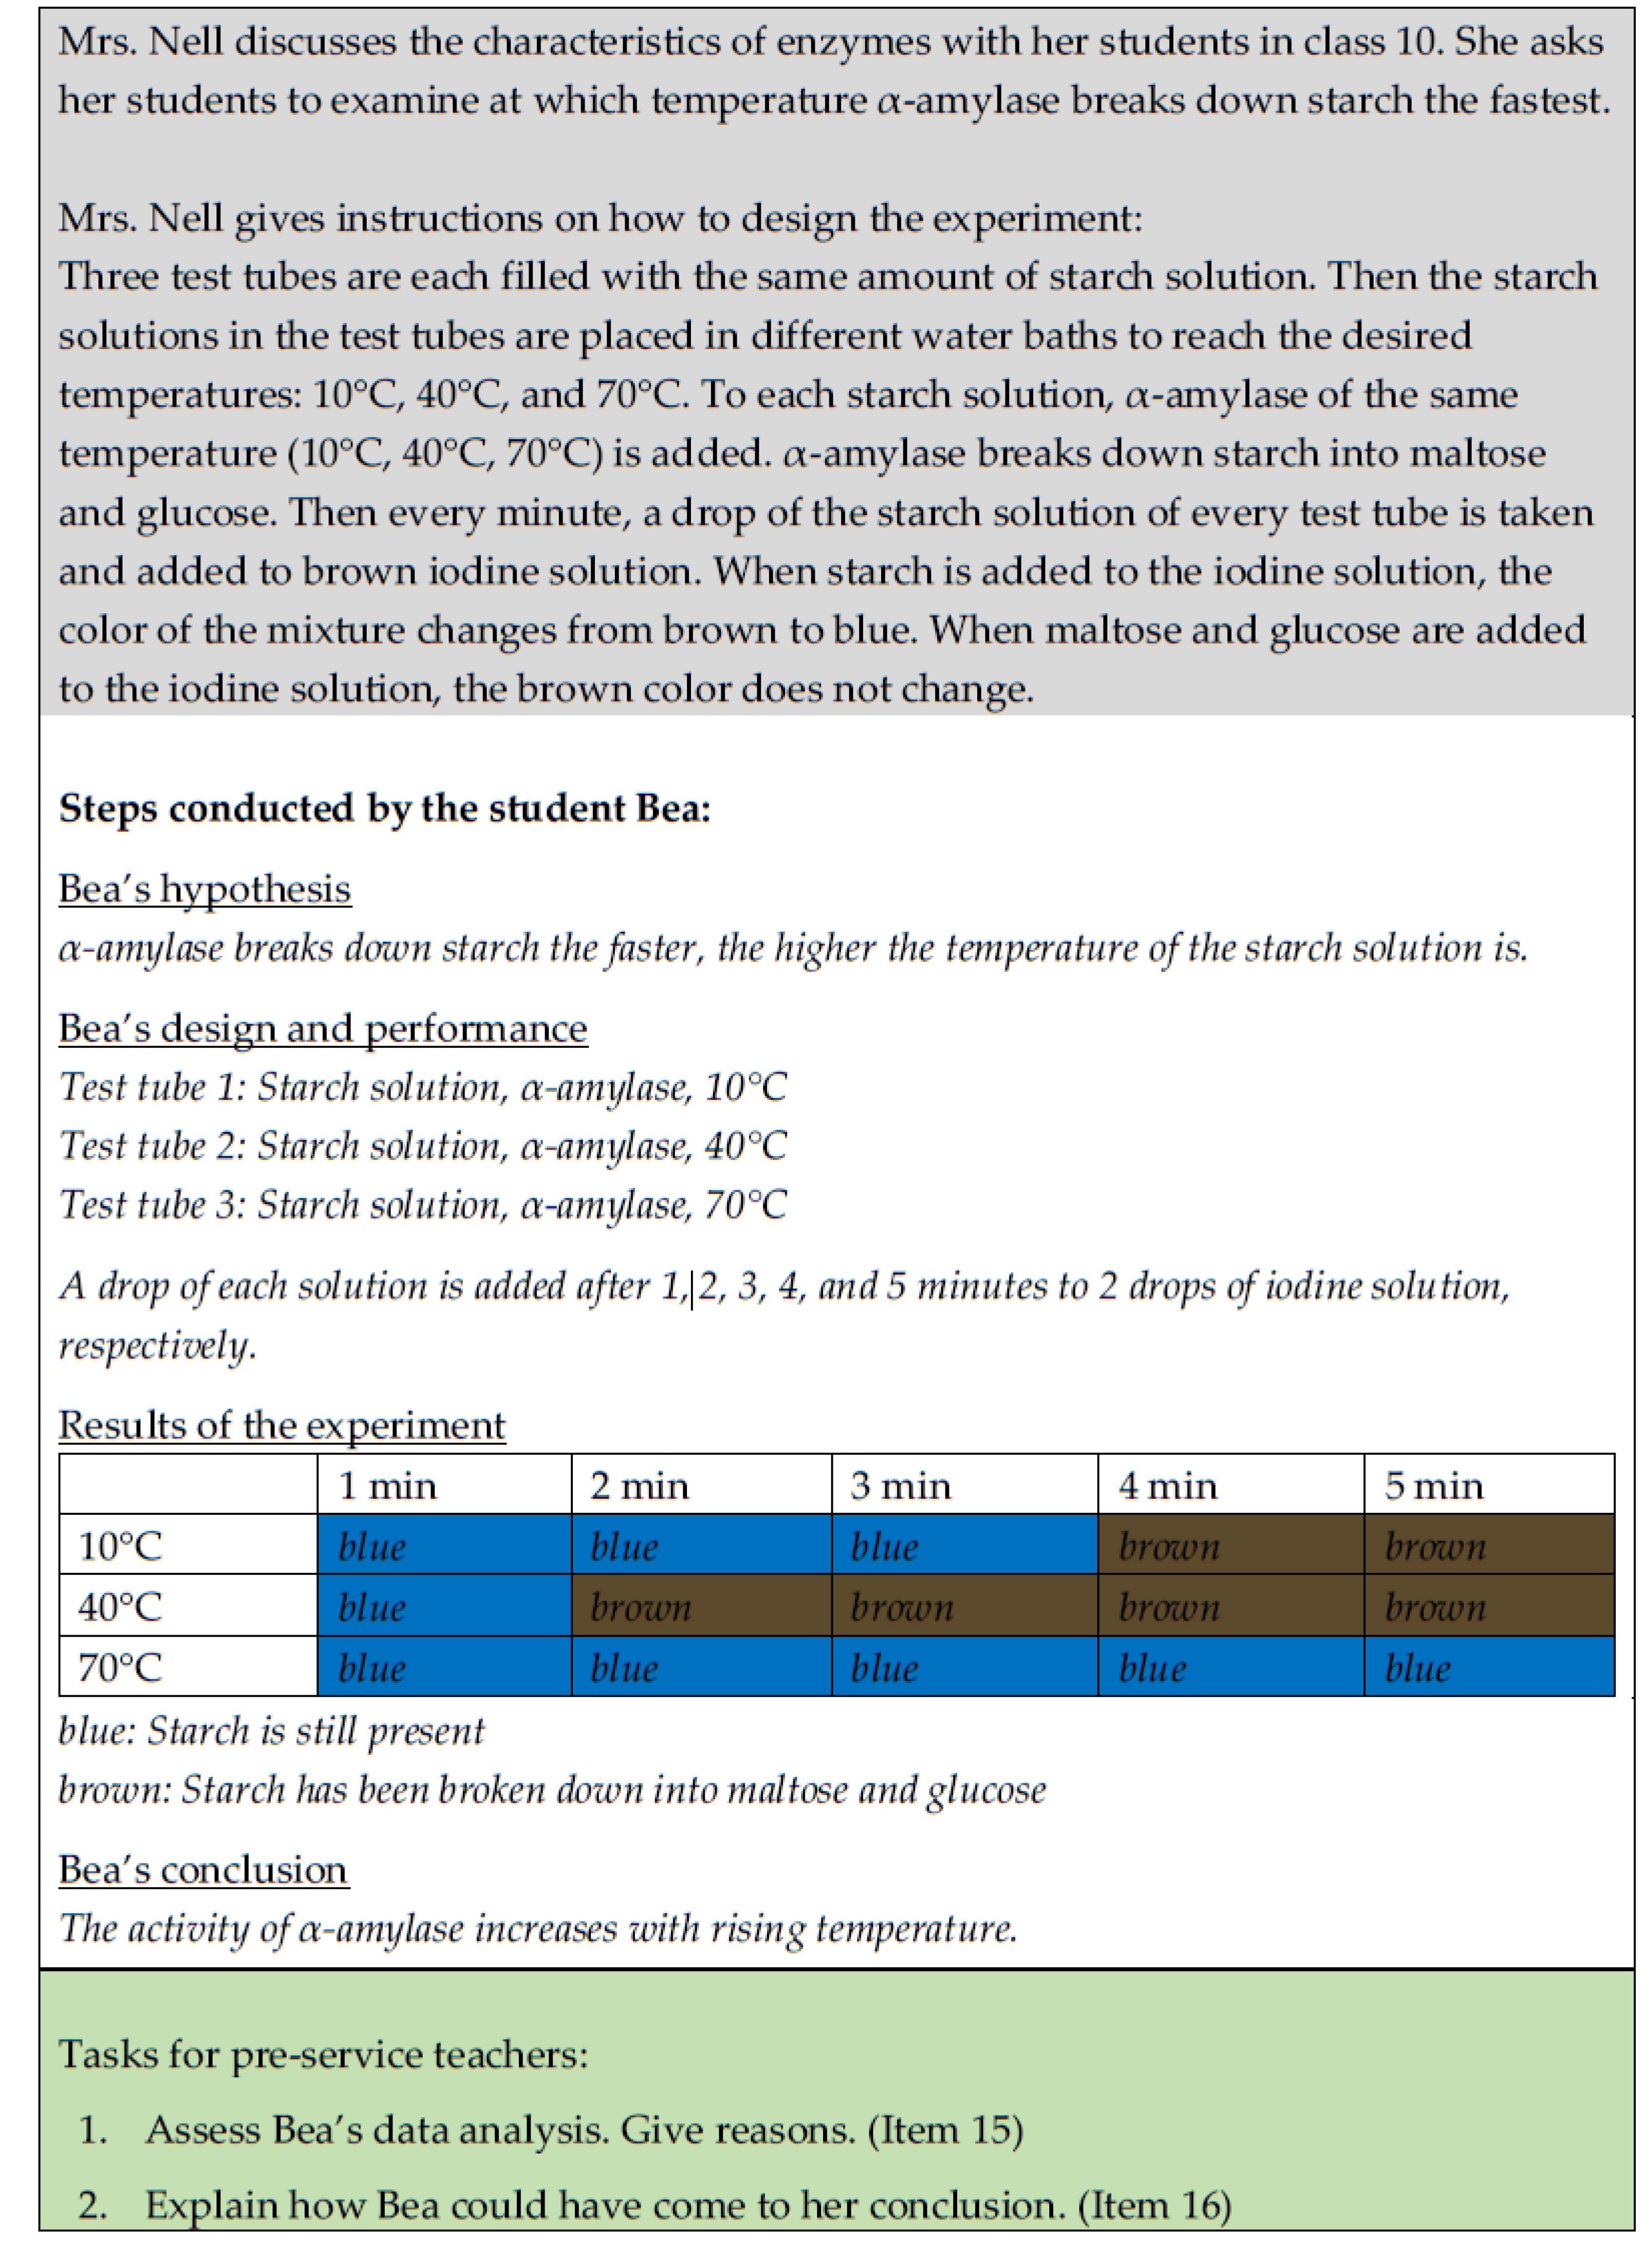
| Score 2 | The criterion is named and explained. | The data analysis is wrong. No transformation could also be detected at 70 °C. (1.11) Bea’s data analysis is not detailed enough. The efficiency of α-amylase increases up to 40 °C, but above that, no splitting takes place at all. Therefore, Bea’s conclusion is wrong. (1.13) | |||||||
| Score 1 | The criterion is named. | The data analysis is incomplete since not all data have been taken into account. (1.9) Her conclusion is wrong. It is possible that the relationship is not clear to her: that higher enzyme activity can explain the splitting of starch and therewith the change to a brown color. (1.17) | |||||||
| Score 0 | The criterion is neither named nor explained. | The table would have been better the other way around. | |||||||
| 10 °C | 40 °C | 70 °C | 10 °C | 40 °C | 70 °C | ||||
| 1 min | x | x | x | 4 min | o | ||||
| 2 min | x | 5 min | o | ||||||
| 3 min | x | ||||||||
| (1.1) | |||||||||
| The data analysis in a table is good. The intervals increase constantly and everywhere equally. (1.7) | |||||||||
| Scoring | Exemplary Answers | |
|---|---|---|
| Score 2 | The criterion is explained completely. The explanation includes both of the following aspects: (1) student ignores the observation (of the 70 °C test tube) OR the student does not consider the result (of the 70 °C test tube) due to certain reasons. (2) student has a specific belief concerning the outcome of the experiment OR the student tends to confirm the hypothesis. | Bea looks for clues that confirm her hypothesis. She ignores other results of her experiment since they don’t fit her belief. (confirmation bias effect?) (1.16) She might conclude, due to previous knowledge, that reactions take place faster at higher temperatures. With the experiment, she verifies her own expectations and ignores contradicting results. (1.70) |
| Score 1 | The criterion is explained in parts. The explanation includes one of the two following aspects: (1) student ignores the observation (of the 70 °C test tube) OR the student does not consider the result (of the 70 °C test tube) due to certain reasons. (2) student has a particular belief concerning the outcome of the experiment OR the student tends to confirm the hypothesis. | Bea ignored the results of the 70 °C test tube. (1.13) Bea might have only compared the 10 °C and 40 °C and excluded 70 °C as a mistake. (1.111) |
| Score 0 | The criterion is not explained. | Maybe she read her table falsely. To the right there are more and more brown fields that indicate that starch has been broken down. (1.1) Bea might have mixed up the variables time and temperature in her statement. (1.9) |
| Models | Deviance | Parameter | BIC | AIC |
|---|---|---|---|---|
| 1D | 13,279 | 31 | 13,471.10 | 13,340.76 |
| 3D | 13,263 | 36 | 13,486.45 | 13,335.08 |
| Hypothesis Formation | Design | |
|---|---|---|
| Hypothesis formation | --- | |
| Design | 0.68 | --- |
| Analysis of data | 0.57 | 0.80 |
| 1D Model | |
|---|---|
| Total Number of items (dichotomous/trichotomous) | 20 (10/10) |
| EAP/PV reliability, item separation reliability | 0.60, 0.99 |
| Variance | 0.14 |
| Item difficulty: min to max | −1.34–2.22 |
| Person ability: min to max | −2.85–1.33 |
| wMNSQ: min to max | 0.92–1.06 |
| T value: min to max | −0.9–1.7 |
| Discrimination: min to max | 0.15–0.45 |
| Mean | Variance | EAP/PV | |
|---|---|---|---|
| Knowledge of what to assess | −0.14 | 0.09 | 0.58 |
| Diagnostic competence | 1.10 | 0.27 | 0.45 |
| Examining competence | 0.16 | 0.29 | 0.59 |
| Knowledge of What to Assess | |
|---|---|
| Diagnostic competence | 0.37 |
| Examining competence | 0.78 |
| High School | University | |||
|---|---|---|---|---|
| Variable | Last grade in biology in high school | Average grade in university courses in biology | Average grade in university courses in biology teacher education | Number of com-pleted courses in biology teacher education |
| Person ability | 0.192s (n = 446) | −0.162s (n = 377) | −0.282s (n = 265) | 0.212p (n = 406) |
© 2020 by the authors. Licensee MDPI, Basel, Switzerland. This article is an open access article distributed under the terms and conditions of the Creative Commons Attribution (CC BY) license (http://creativecommons.org/licenses/by/4.0/).
Share and Cite
Joachim, C.; Hammann, M.; Carstensen, C.H.; Bögeholz, S. Modeling and Measuring Pre-Service Teachers’ Assessment Literacy Regarding Experimentation Competences in Biology. Educ. Sci. 2020, 10, 140. https://doi.org/10.3390/educsci10050140
Joachim C, Hammann M, Carstensen CH, Bögeholz S. Modeling and Measuring Pre-Service Teachers’ Assessment Literacy Regarding Experimentation Competences in Biology. Education Sciences. 2020; 10(5):140. https://doi.org/10.3390/educsci10050140
Chicago/Turabian StyleJoachim, Cora, Marcus Hammann, Claus H. Carstensen, and Susanne Bögeholz. 2020. "Modeling and Measuring Pre-Service Teachers’ Assessment Literacy Regarding Experimentation Competences in Biology" Education Sciences 10, no. 5: 140. https://doi.org/10.3390/educsci10050140