An Engineering-Problem-Based Short Experiment Project on Finite Element Method for Undergraduate Students

Abstract
:1. Introduction
2. Overview of the Finite Element Experiment
2.1. Teaching Objectives of this Course
- Students are required to have a good understanding of the basic principles of finite element, the construction of shape functions, the selection of element types, and various numerical methods and to be able to use computer programs and finite element software to realize large-scale finite element calculation.
- Students should carry out effective experimental research and have the basic ability to solve complex problems in practical engineering.
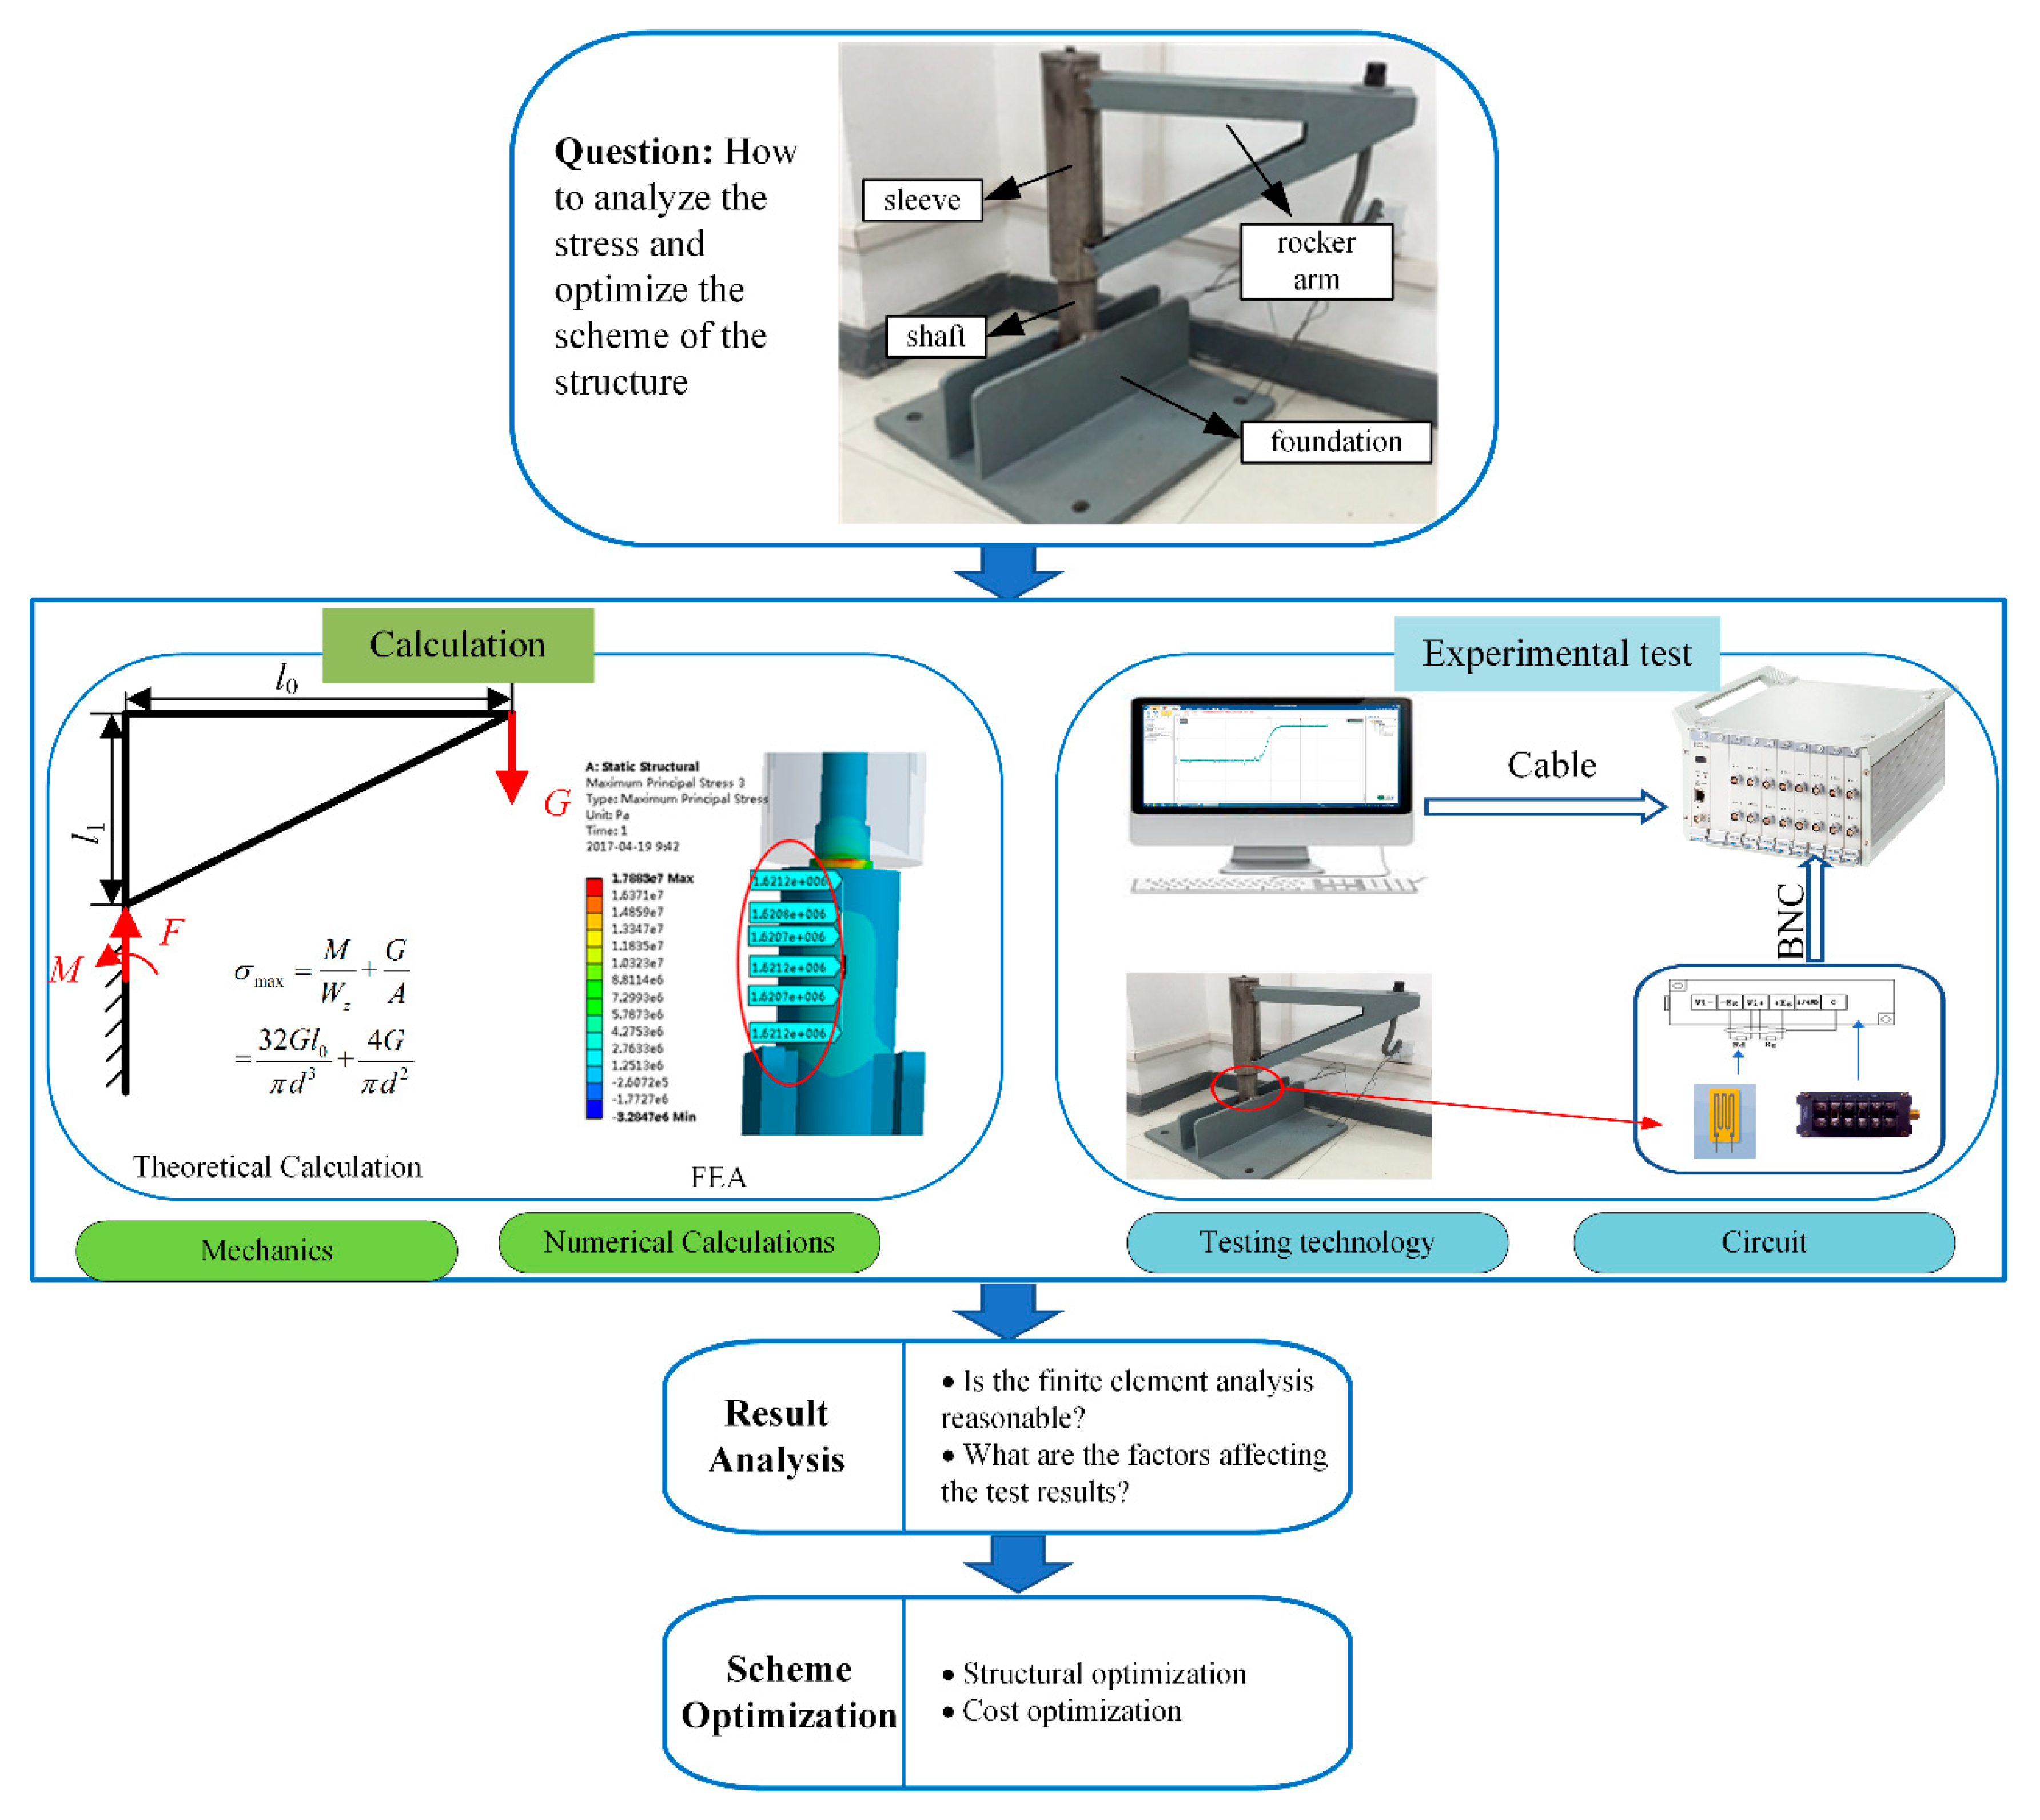
2.2. The Process of Experiment
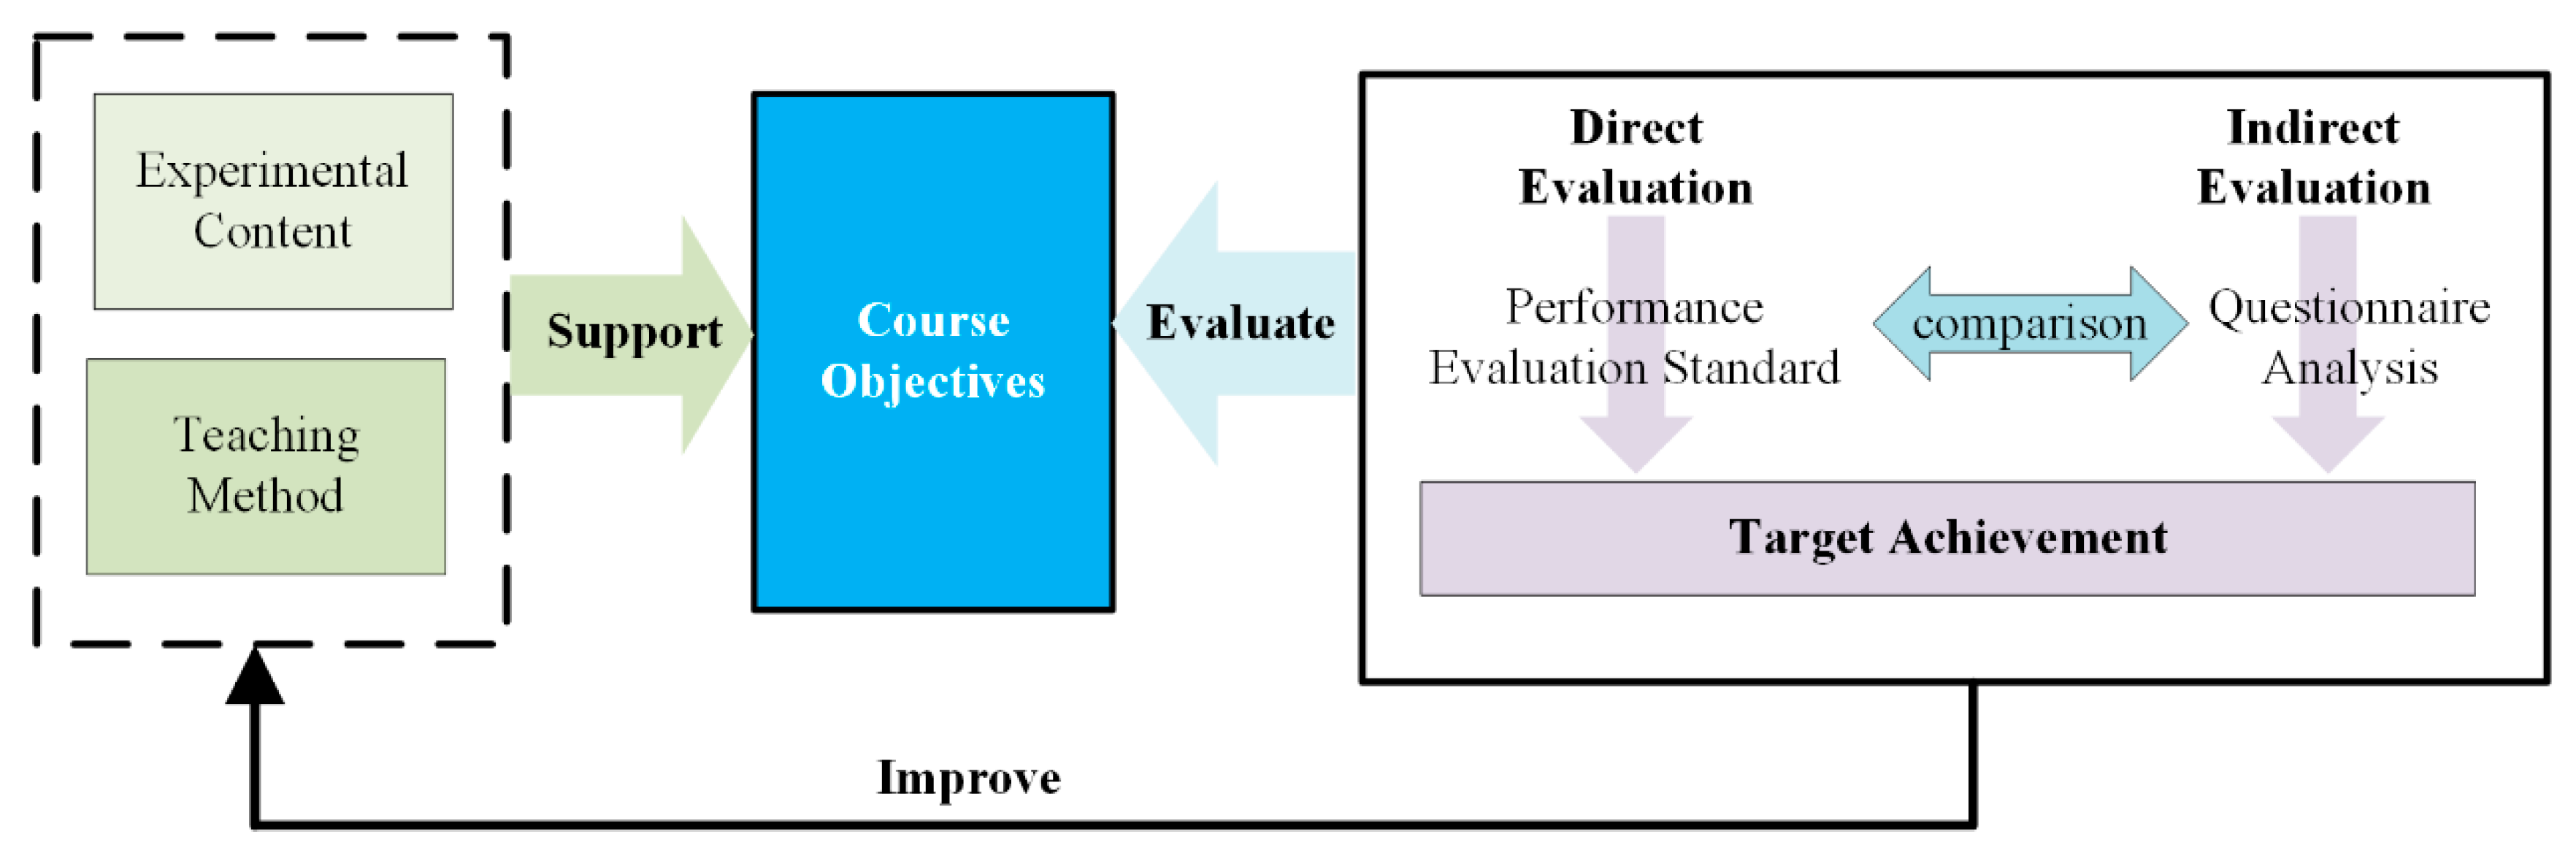
2.3. Evaluation Approaches
- Simplify the mechanics model and calculate the stress and strain using theoretical mechanics. (2.5 points)
- 2.5 points: Calculate the right answer on your own using theoretical mechanics.
- 1.25 points: Calculate the right answer under the guidance of the teacher using theoretical mechanics.
- 1)
- Standardization of equipment operation (25 points)
- 25 points: Do the experiment independently.
- 22.5 points: Complete the experiment under the guidance of the teacher.
- 18.5 points: Complete the experiment with the help of the teacher.
- 12.5 points: Master the experimental method but do not get the correct testing results.
- 2)
- Selection of the experimental method (10 points)
- 10 points: Complete two basic measurement circuits.
- 5 points: Complete one basic measurement circuits.
- +1.25 points: Using strain flowmetry.
- 1)
- Capability of problem analysis (10 points)
- 10 points: Establish a finite element model of the experiment object that is accurate and effective.
- 8.5 points: Establish a finite element model of the experiment object that can be identified in the finite element software.
- 7.5 points: Establish a finite element model of the experiment object that cannot be identified in the finite element software.
- 6 points: Use the finite element software and get reasonable results with the help of the teacher.
- 2)
- Use modern information technology and tools (12.5 points)
- 12.5 points: Perform an analysis using the finite element software and obtain reasonable results.
- 9 points: Perform an analysis using the finite element software and obtain reasonable results by adjusting.
- 7.5 points: Use the finite element software and obtain reasonable results with the guidance of the teacher.
- 6 points: Use the finite element software and obtain reasonable results with the help of the teacher.
- 1)
- Structure optimization (12.5 points)
- 12.5 points: Apply the basic principles and methods of mathematics, natural science, and engineering science to rationally optimize the experimental object according to the test and analysis results and give feasible suggestions and finite element analysis verification.
- 9 points: Apply the basic principles and methods of mathematics, natural science and engineering science; based on the test and analysis results, optimize the experimental object.
- 6 points: Under the guidance of teachers, apply the basic principles and methods of mathematics, natural science, and engineering science according to the test and analysis results and optimize the experimental object.
- 2)
- Temperature influence (6.5 points)
- 6.5 points: In the experimental report, the results were compared, and the temperature influence is summarized correctly.
- 5.2 points: In the experimental report, the results were compared, and how the temperature should affect the result is summarized.
- 3)
- Result analysis (21 points)
- 21 points: In the experimental report, the finite element results and the test results can be compared and analyzed. The reason for the difference between the finite element and the test results is properly summarized.
- 19 points: In the experimental report, the finite element results and the test results can be compared and analyzed. Part of the reason for the finite element and the test results is properly summarized.
- 17 points: In the experimental report, the finite element results and the test results can be simply compared and analyzed.
2.4. The Teaching Method
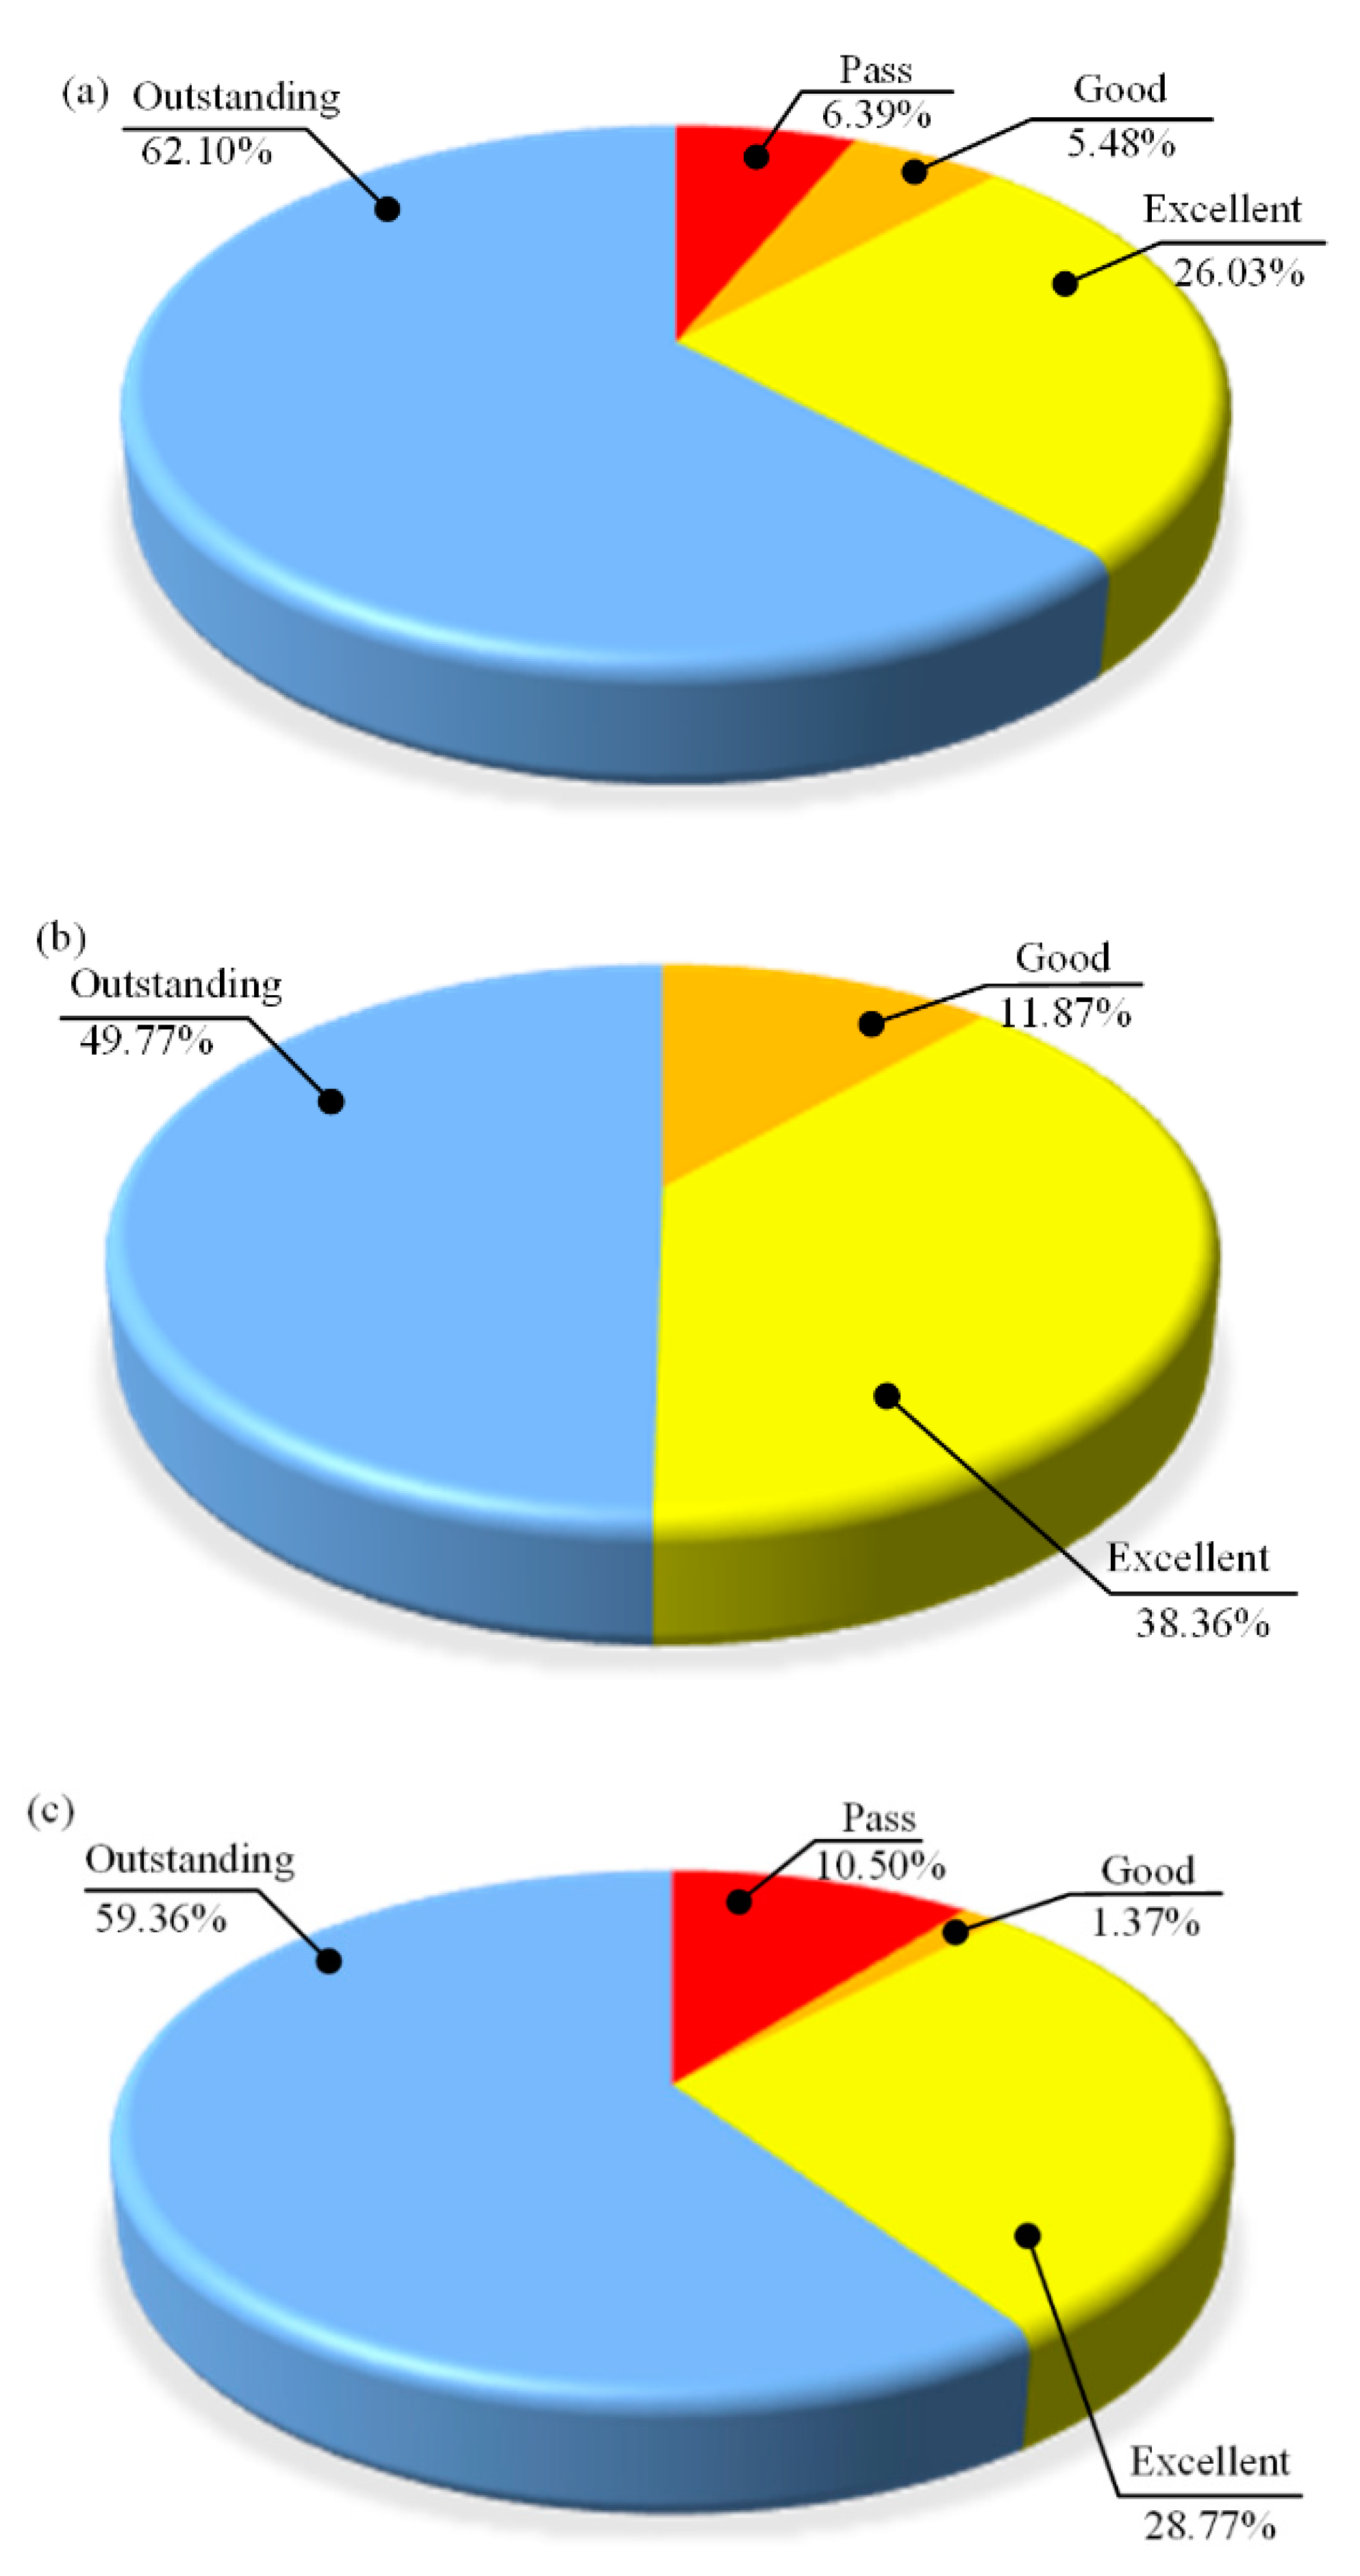
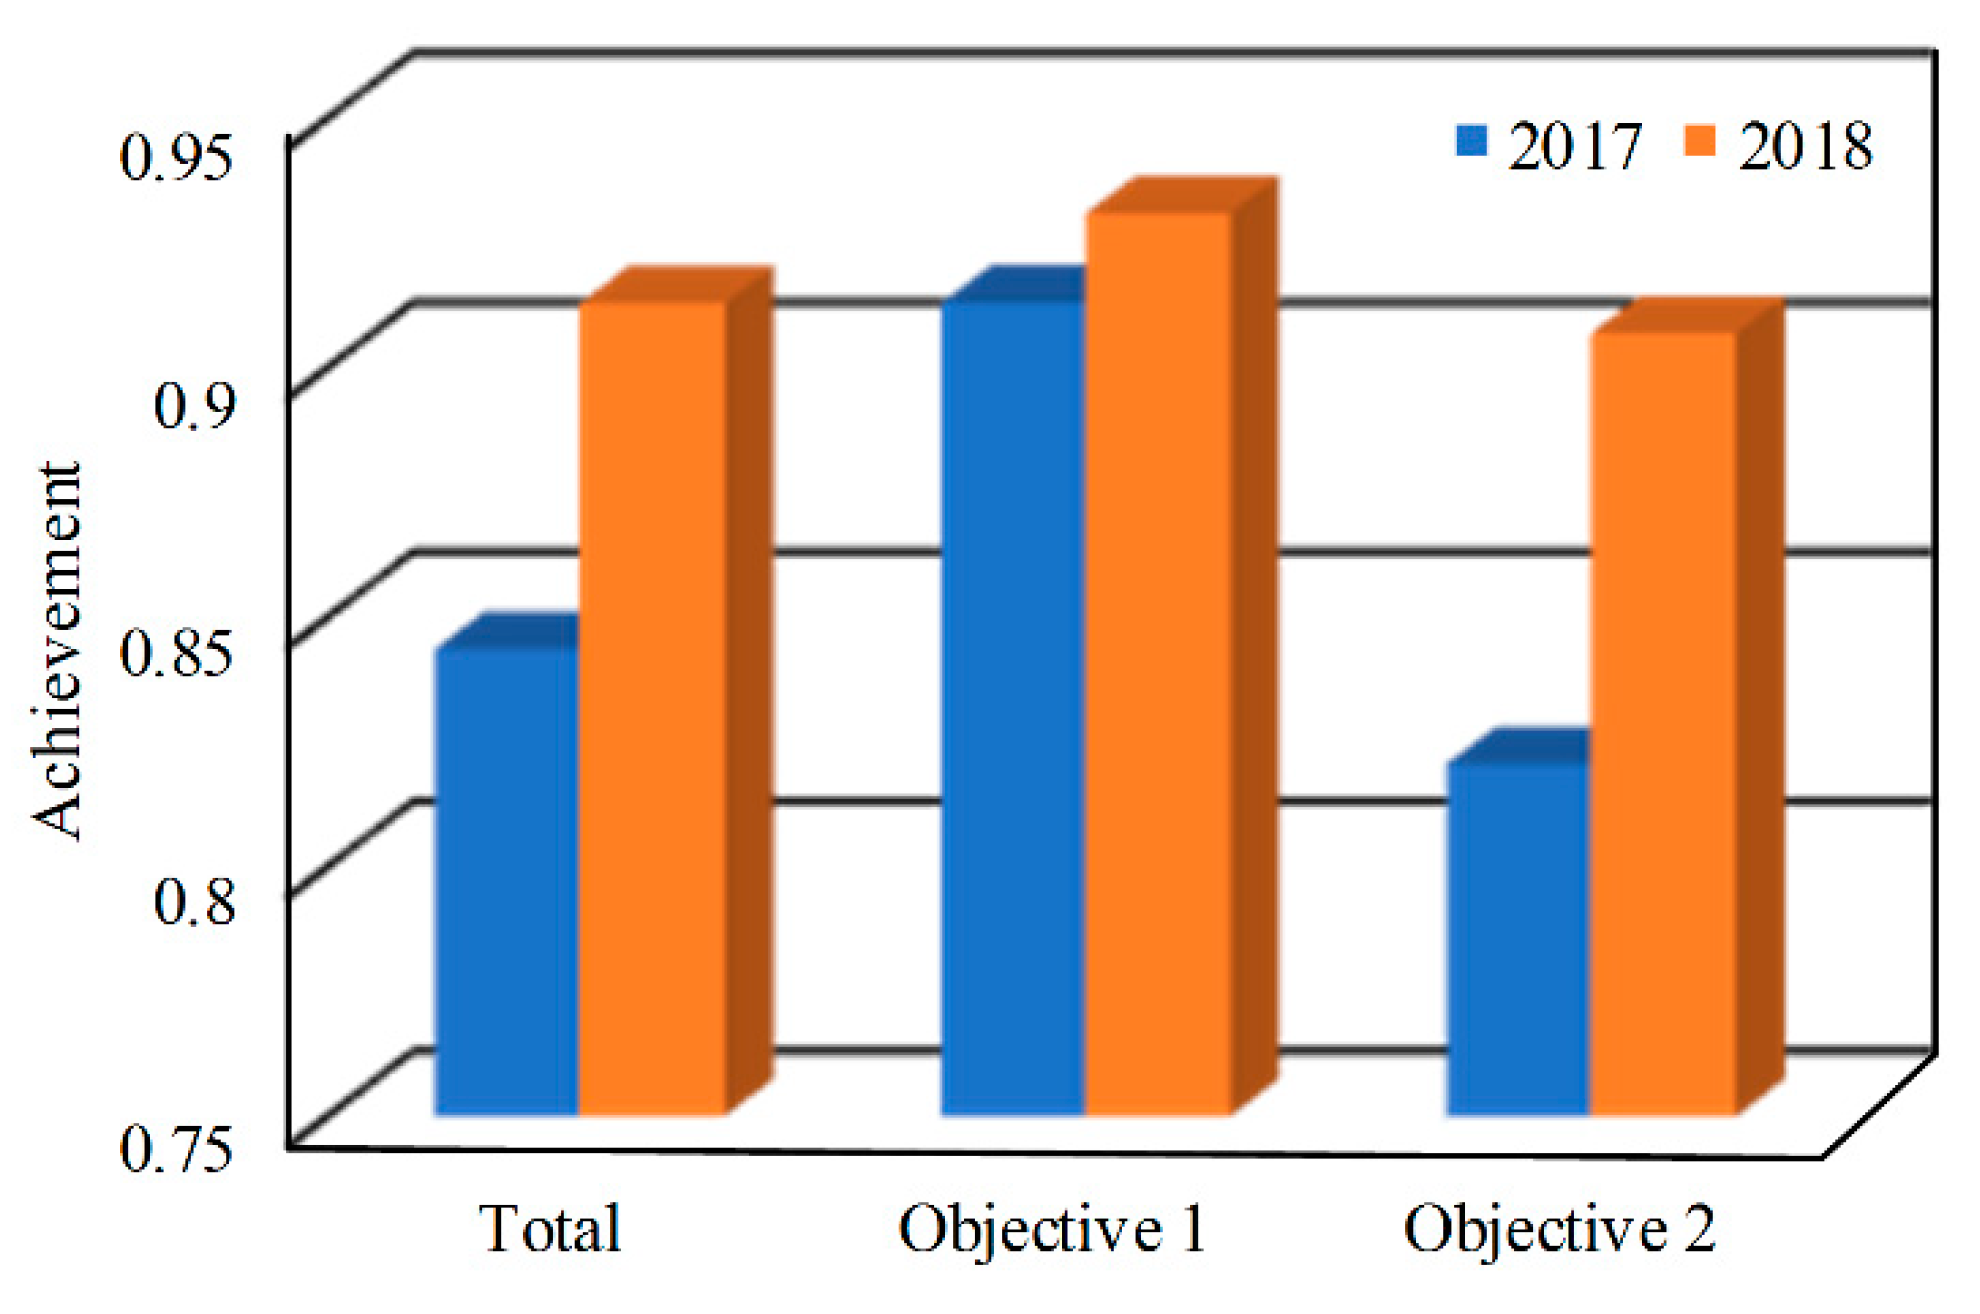
3. Evaluation and Student Feedback
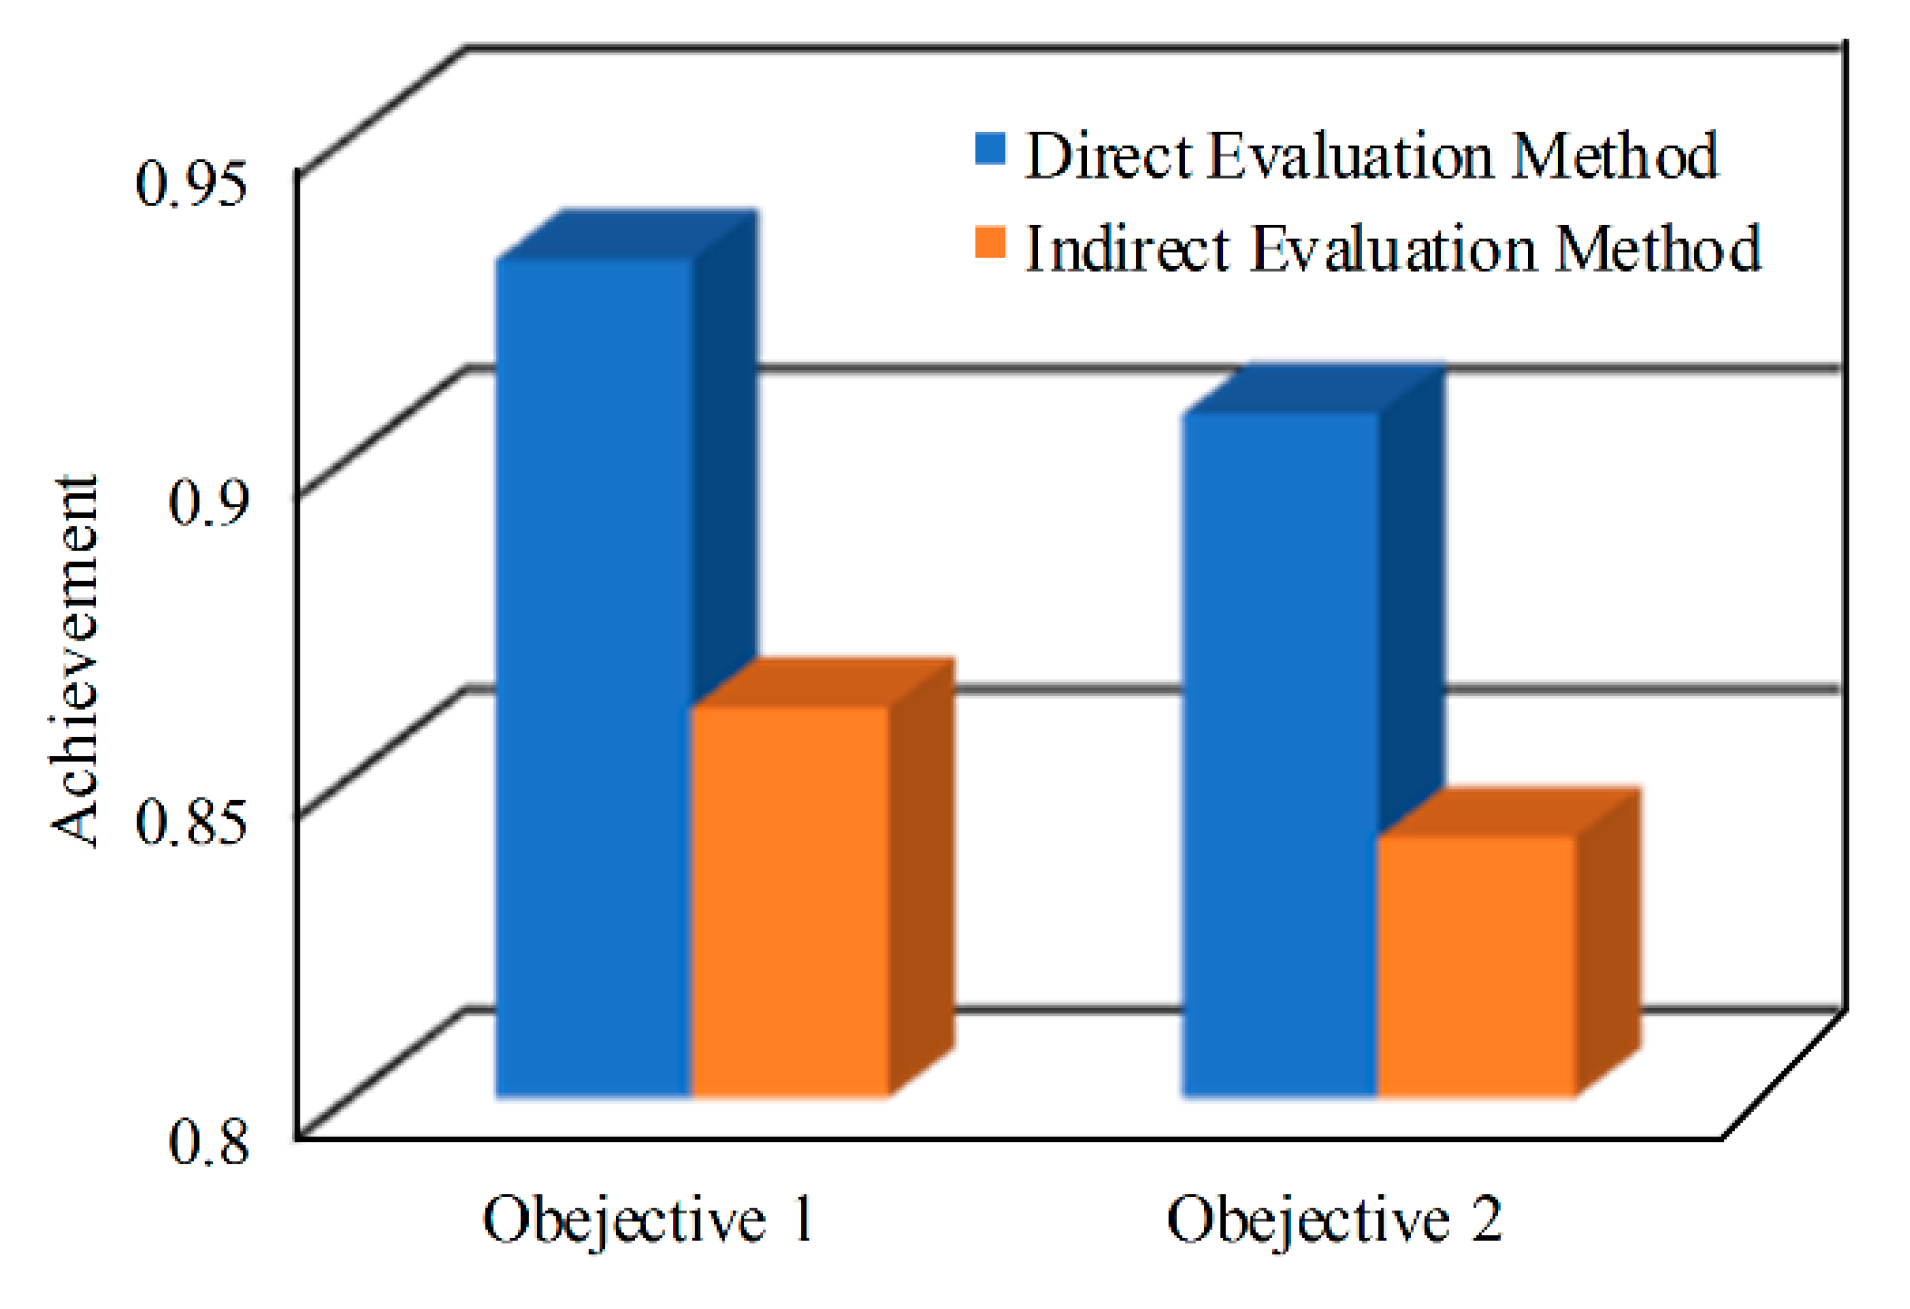
3.1. Direct Evaluation Method
3.2. Indirect Evaluation Method
4. Conclusions
Author Contributions
Funding
Conflicts of Interest
References
- Pan, Z.; Wang, X.; Teng, R.; Cao, X. Computer-aided design-while-engineering technology in top-down modeling of mechanical product. Comput. Ind. 2016, 75, 151–161. [Google Scholar] [CrossRef]
- Chen, Q.; Wang, G.; Pindera, M.J. Homogenization and localization of nanoporous composites: A critical review and new developments. Compos. Part B Eng. 2018, 155, 329–368. [Google Scholar] [CrossRef]
- Chen, Q.; Wang, G.; Chen, X.; Geng, J. Finite-volume homogenization of elastic/viscoelastic periodic materials. Compos. Struct. 2017, 182, 457–470. [Google Scholar] [CrossRef]
- Brown, S.; Burnham, J. Engineering Student’s Mathematics Self-Efficacy Development in a Freshmen Engineering Mathematics Course. Int. J. Eng. Educ. 2012, 28, 113–129. [Google Scholar]
- Rüde, U.; Willcox, K.; McInnes, L.C.; Sterck, H.D. Research and Education in Computational Science and Engineering. Siam Rev. 2018, 60, 707–754. [Google Scholar] [CrossRef] [PubMed]
- Wu, A.; Hou, Y.F.; Yang, Q.B.; Hao, J. Accelerating Development and Construction of Emerging Engineering, Taking Initiative to Adapt to and Lead the New Economy. Higher Eng. Educ. Res. 2017, 10, 1–14. [Google Scholar]
- Li, P. What’s New for New Engineering Education. Higher Eng. Educ. Res. 2017, 4, 1–4. [Google Scholar]
- Han, X.; Appelbaum, R.P. China’s science, technology, engineering, and mathematics (STEM) research environment: A snapshot. PLoS ONE 2018, 13, e0195347. [Google Scholar] [CrossRef] [Green Version]
- NSF. Investing in Science, Engineering, and Education for the Nation’s Future, Strategic Plan for 2014–2018; Report of the NSF; NSF: Arlington, VA, USA, 2014. Available online: www.nsf.gov/pubs/2014/nsf14043/nsf14043.pdf (accessed on 20 February 2020).
- Besterfield-Sacre, M.; Cox, M.F.; Borrego, M.; Beddoes, K.; Zhu, J. Changing Engineering Education: Views of U.S. Faculty, Chairs, and Deans. J. Eng. Educ. 2014, 103, 193–219. [Google Scholar] [CrossRef]
- Sierpinska, A.; Kilpatrick, J.; Balacheff, N.; Howson, A.G.; Sfard, A.; Steinbring, H. What is research in mathematics education, and what are its result. J. Res. Math. Educ. 1993, 24, 274–278. [Google Scholar] [CrossRef]
- Damaj, I.; Yousafzai, J. Effective Assessment of Student Outcomes in Computer Engineering Programs using a Minimalistic Framework. Int. J. Eng. Educ. 2019, 35, 59–75. [Google Scholar]
- Chinese Mechanical Engineering Society. Available online: http://meea.cmes.org/ (accessed on 20 February 2020).
- Accreditation Board for Engineering and Technology. Available online: https://www.abet.org/ (accessed on 20 February 2020).
- Shuman, L.J.; Besterfield-Sacre, M.; McGourty, J. The ABET ‘professional skills’ can they be taught? Can they be assessed? J. Eng. Educ. 2005, 94, 41–55. [Google Scholar] [CrossRef]
- Al-Yahya, S.A.; Abdel-halim, M.A. A Successful Experience of ABET Accreditation of an Electrical Engineering Program. IEEE Trans. Educ. 2013, 56, 165–173. [Google Scholar] [CrossRef]
- Anwar, A.A.; Richards, D.J. Comparison of EC and ABET Accreditation Criteria. J. Prof. Issues Eng. Educ. Pract. 2018, 144, 06018001. [Google Scholar] [CrossRef]
- School of Mechanical engineering of Xi’an Jiaotong University. Available online: http://mec.xjtu.edu.cn/ (accessed on 20 February 2020).
- Jensen, C.G.; Haslam, J.D.; Hoeh, J.A.; Thompson, M.B. Project based computer-aided engineering applications. In Proceedings of the 30th Annual Frontiers in Education Conference. Building on a Century of Progress in Engineering Education, Kansas, MO, USA, 18–20 October 2000. [Google Scholar]
- Clark, M.R.; Mahboobin, A. Scaffolding to Support Problem-Solving Performance in a Bioengineering Lab-A. Case Study. IEEE Trans. Educ. 2018, 61, 109–118. [Google Scholar] [CrossRef]
- Chen, Q.; Tu, W.; Liu, R.; Chen, X. Parametric multiphysics finite-volume theory for periodic composites with thermo-electro-elastic phases. J. Intell. Mater. Syst. Struct. 2018, 29, 530–552. [Google Scholar] [CrossRef]
- Chen, S.; Qian, G.; Yang, L. Precise control of surface texture on carbon film by ion etching through filter: Optimization of texture size for improving tribological behavior. Surf. Coat. Technol. 2019, 362, 105–112. [Google Scholar] [CrossRef]
- Yang, L.; Diao, D. Contact Stress-Induced Micromagnetic Behavior in Magnetic Recording Disk. Tribol. Lett. 2014, 54, 287–295. [Google Scholar] [CrossRef]
- He, Z.; Liu, Q.; Yang, K.; Pest, N.; Xu, B.; Kerrigan, J.; Pindera, M.J. Interactive Educational Testbed for Statics and Mechanics of Materials. In Proceedings of the ASME2018 International Mechanical Engineering Congress and Exposition IMECE 2018, Pittsburgh, PA, USA, 9–15 November 2018. [Google Scholar]
- Simulation—Based Engineering Science: Revolutionizing Engineering Science through Simulation, Report of the NSF Blue Ribbon Panel. 2006. Available online: https://www.nsf.gov/pubs/reports/sbes_final_report.pdf (accessed on 20 February 2020).
- Grange, L.L. (Re)thinking outcomes-based education: From arborescent to rhizomatic conceptions of outcomes (based-education). Perspect. Educ. 2007, 25, 79–85. [Google Scholar]
- Heer, D.; Traylor, R.L.; Thompson, T.; Fiez, T.S. Enhancing the freshman and sophomore ECE student experience using a platform for learning (TM). IEEE Trans. Educ. 2003, 46, 434–443. [Google Scholar] [CrossRef]
- Adams, N.E. Bloom’s taxonomy of cognitive learning objectives. J. Med. Libr. Assoc. 2015, 103, 152–153. [Google Scholar] [CrossRef] [PubMed]
- Felder, R.M.; Brent, R. Designing and Teaching Courses to Satisfy the ABET Engineering Criteria. J. Eng. Educ. 2003, 92, 7–25. [Google Scholar] [CrossRef]
- Corno, F.; De, L.R. Training Engineers for the Ambient Intelligence Challenge. IEEE Trans. Educ. 2017, 60, 40–49. [Google Scholar] [CrossRef] [Green Version]
- Revelo, R.A.; Schmitz, C.D.; Le, D.T.; Loui, M.C. Self-Efficacy as a Long-Term Outcome of a General Education Course on Digital Technologies. IEEE Trans. Educ. 2017, 60, 198–204. [Google Scholar] [CrossRef]


| The Stress in the Vertical Direction | Major Principal Stress | ||
|---|---|---|---|
| Theoretical Calculation Value (MPa) | 1.621 | FEM Calculation Value (MPa) | 1.621 |
| Test Value (MPa) | 1.651 | Test Value (MPa) | 1.675 |
| Error (%) | 1.85 | Error (%) | 3.33 |
| Experimental Procedure | Experimental Content | Time | |
|---|---|---|---|
| 1 | Preview | Preview the method of stress-strain measurement, stress calculation method and finite element analysis software operation procedure. | 30 min |
| 2 | Introduce | Introduce the basic principles and methods of stress measurement and the principle of finite element analysis | 20 min |
| 3 | Interaction | Question and interact with the students in the difficulty of the experiment. | 10 min |
| 4 | Operation | Students survey and map the experiment components; Test the steps of the experiment; | 3 hrs |
| 5 | Analysis | The analysis of the experimental subject. | 3 hrs |
| 6 | Report submitting | Students analyze the experimental results and submit reports and instructors review the reports | 1hr |
| Step | Content | Course Objectives |
|---|---|---|
| 1: Structural mechanics analysis | 1. Get the abstract structure 2. Calculate the stress and strain using theoretical mechanics | 1 |
| 2: Experimental test | 1. Link the experiment data collection system 2. Install strain adapters and strain sensors 3. Operate the experiment software | 2 |
| 3: The structure analysis by FE software | 1. Abstract the three-dimension models 2. Mesh the models 3. Determine the boundary conditions and load 4. Calculate the numerical result | 1 |
| 4: The result analysis and structure optimization | 1. Compare the results of the three methods 2. Optimize the structure design | 2 |
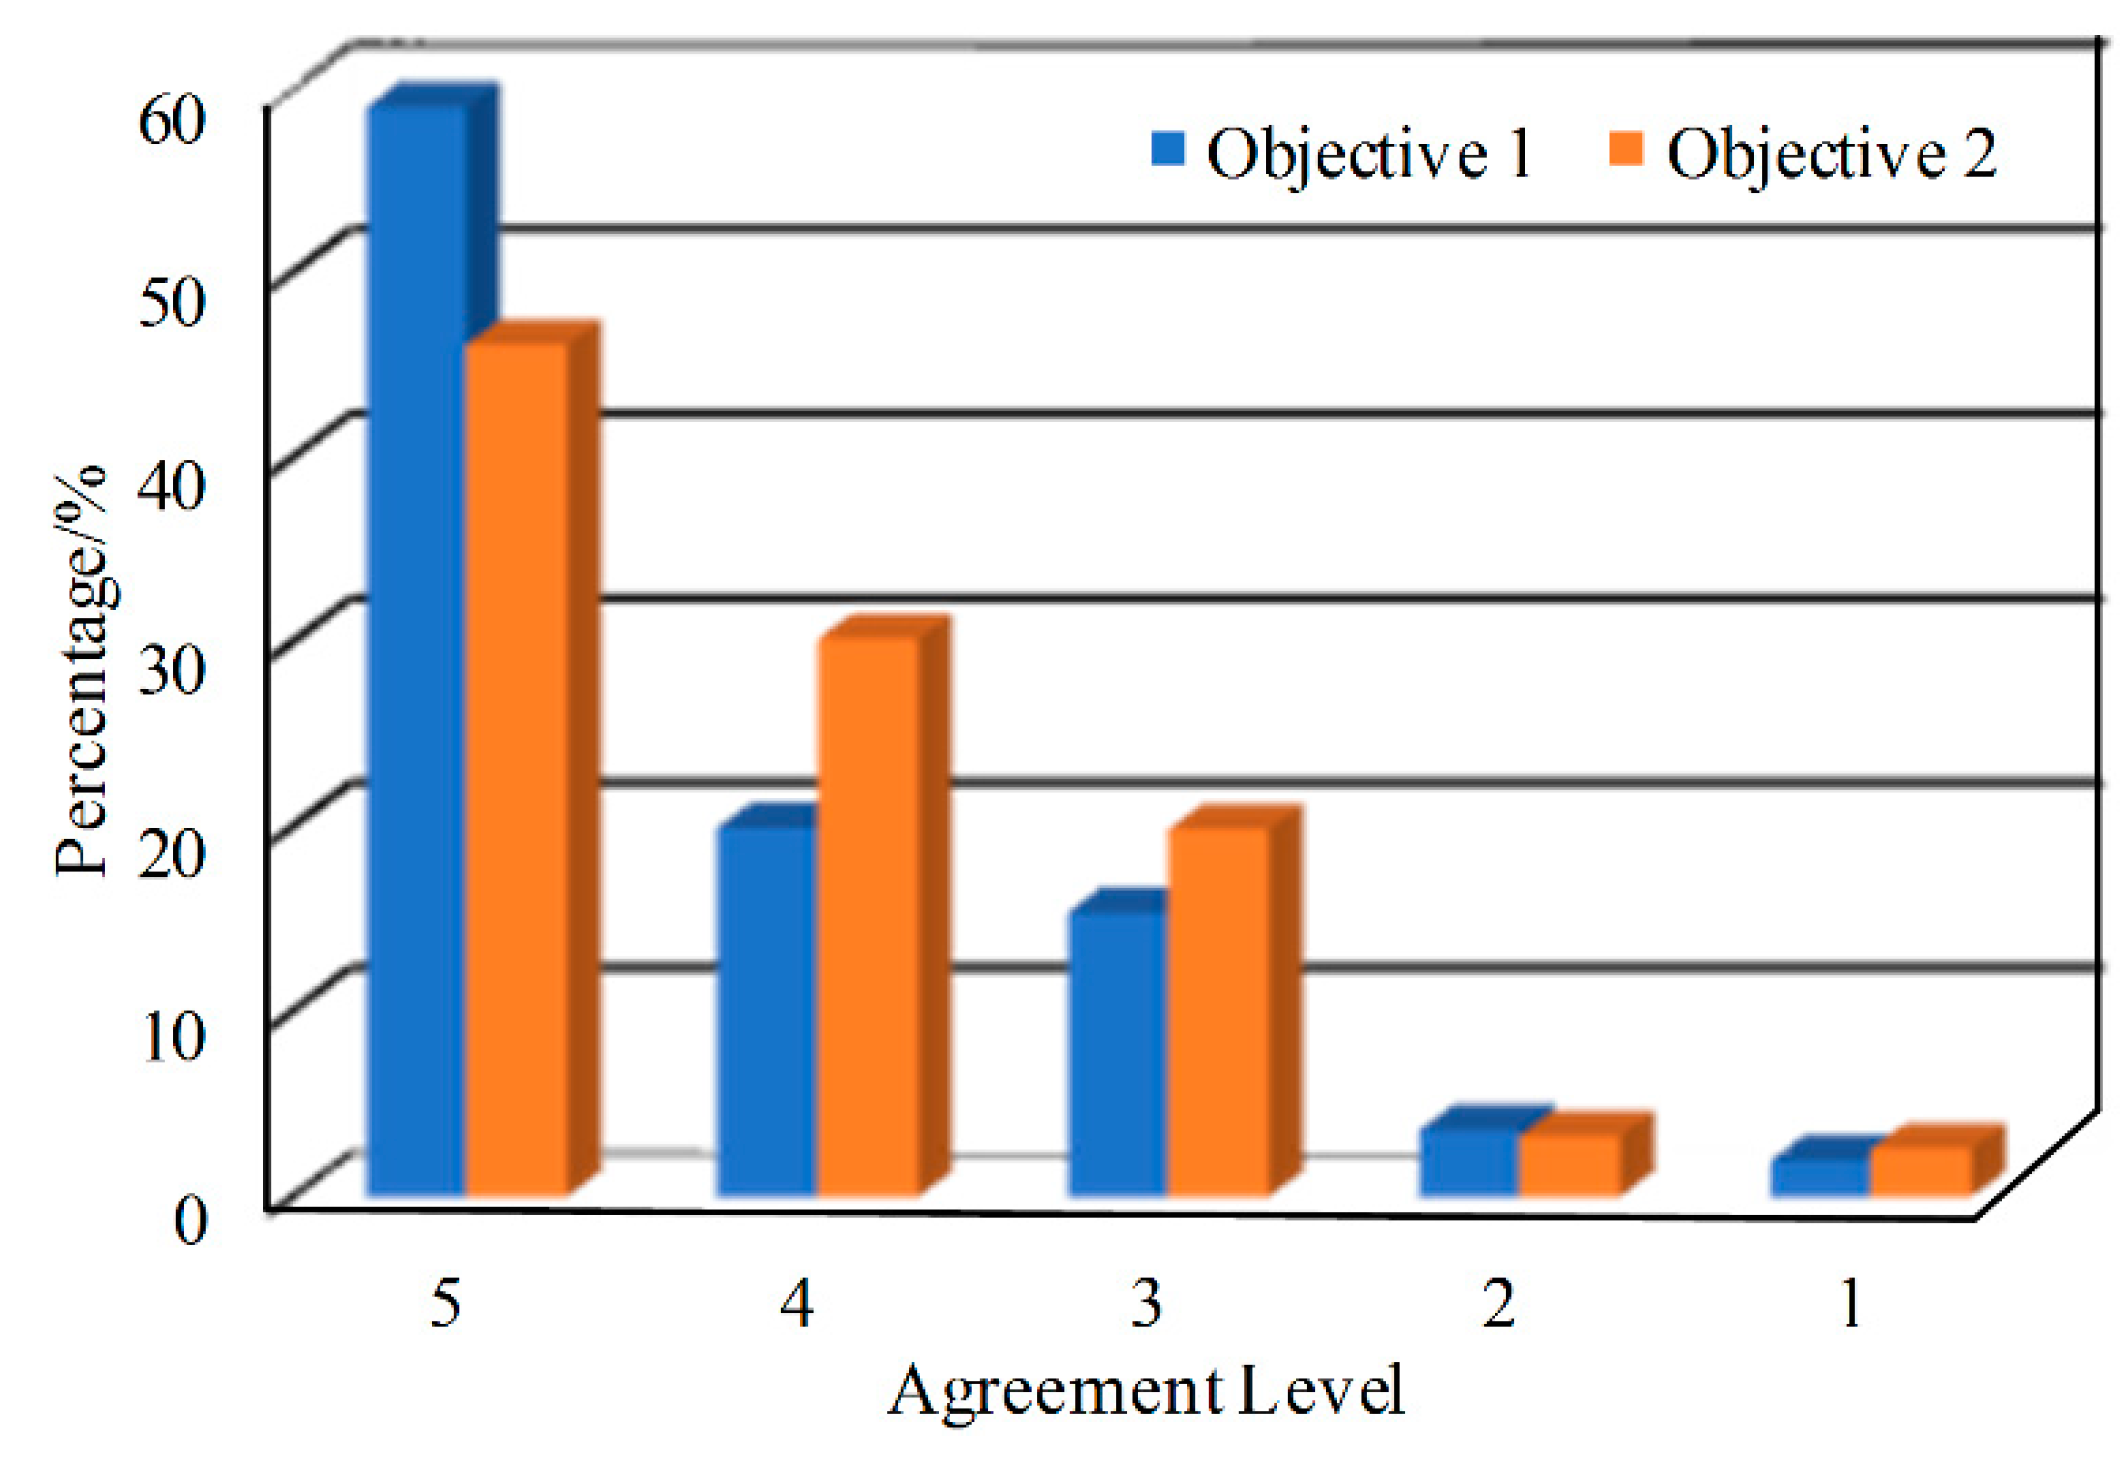
| Variable | Topic | Agreement Level | ||||
|---|---|---|---|---|---|---|
| 5 | 4 | 3 | 2 | 1 | ||
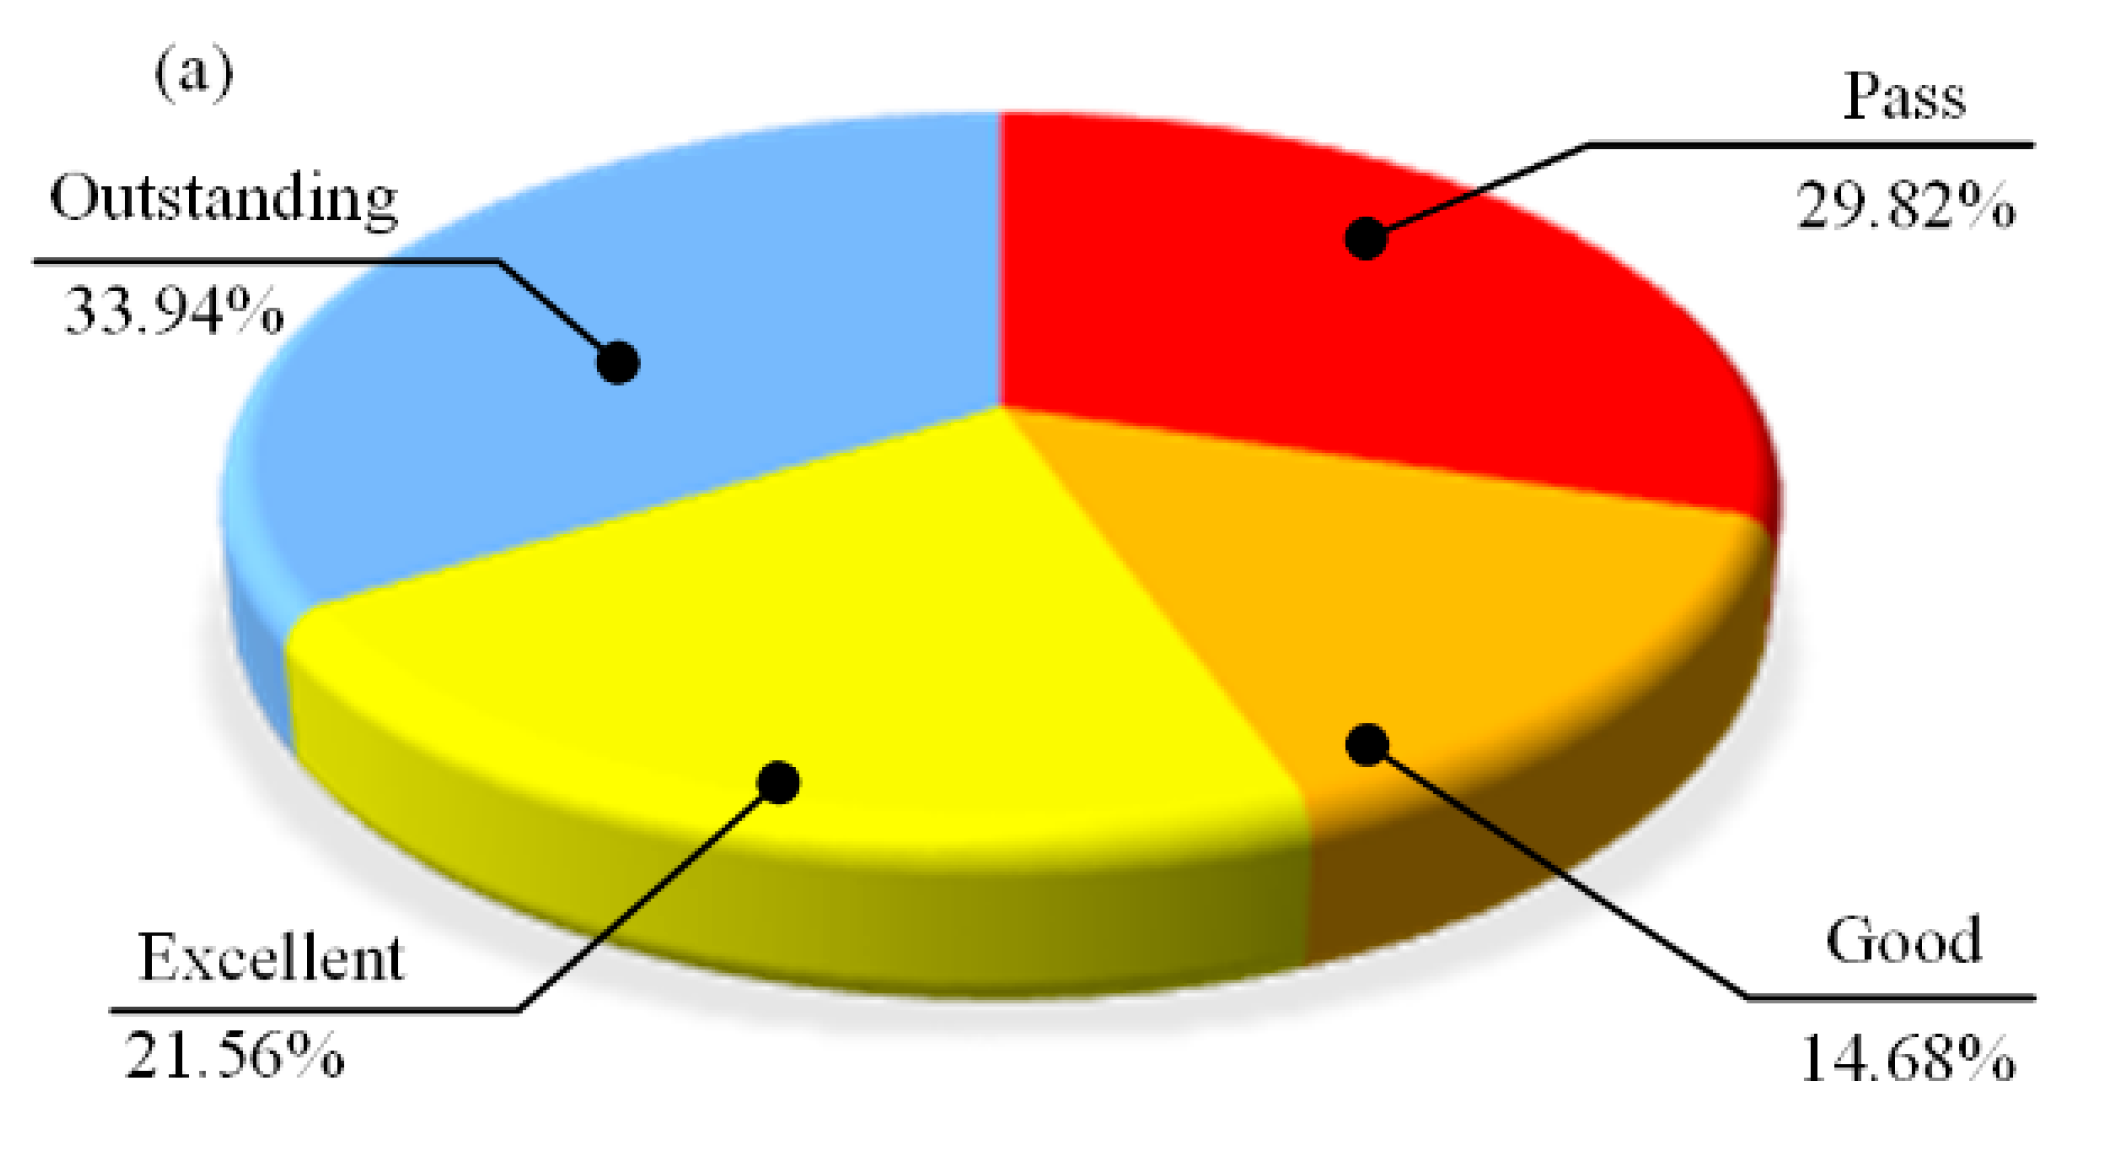
| Objective 1 | ● I think that, through the experimental class, it is possible to achieve finite element calculation using the computer program. | 0.66 | 0.16 | 0.15 | 0.02 | 0.02 |
| ● I am able to accurately and efficiently build a finite element model of the test subject. | 0.54 | 0.20 | 0.18 | 0.07 | 0.02 | |
| ● I can get reasonable results from the stress analysis of the experimental model through finite element analysis. | 0.59 | 0.21 | 0.13 | 0.05 | 0.02 | |
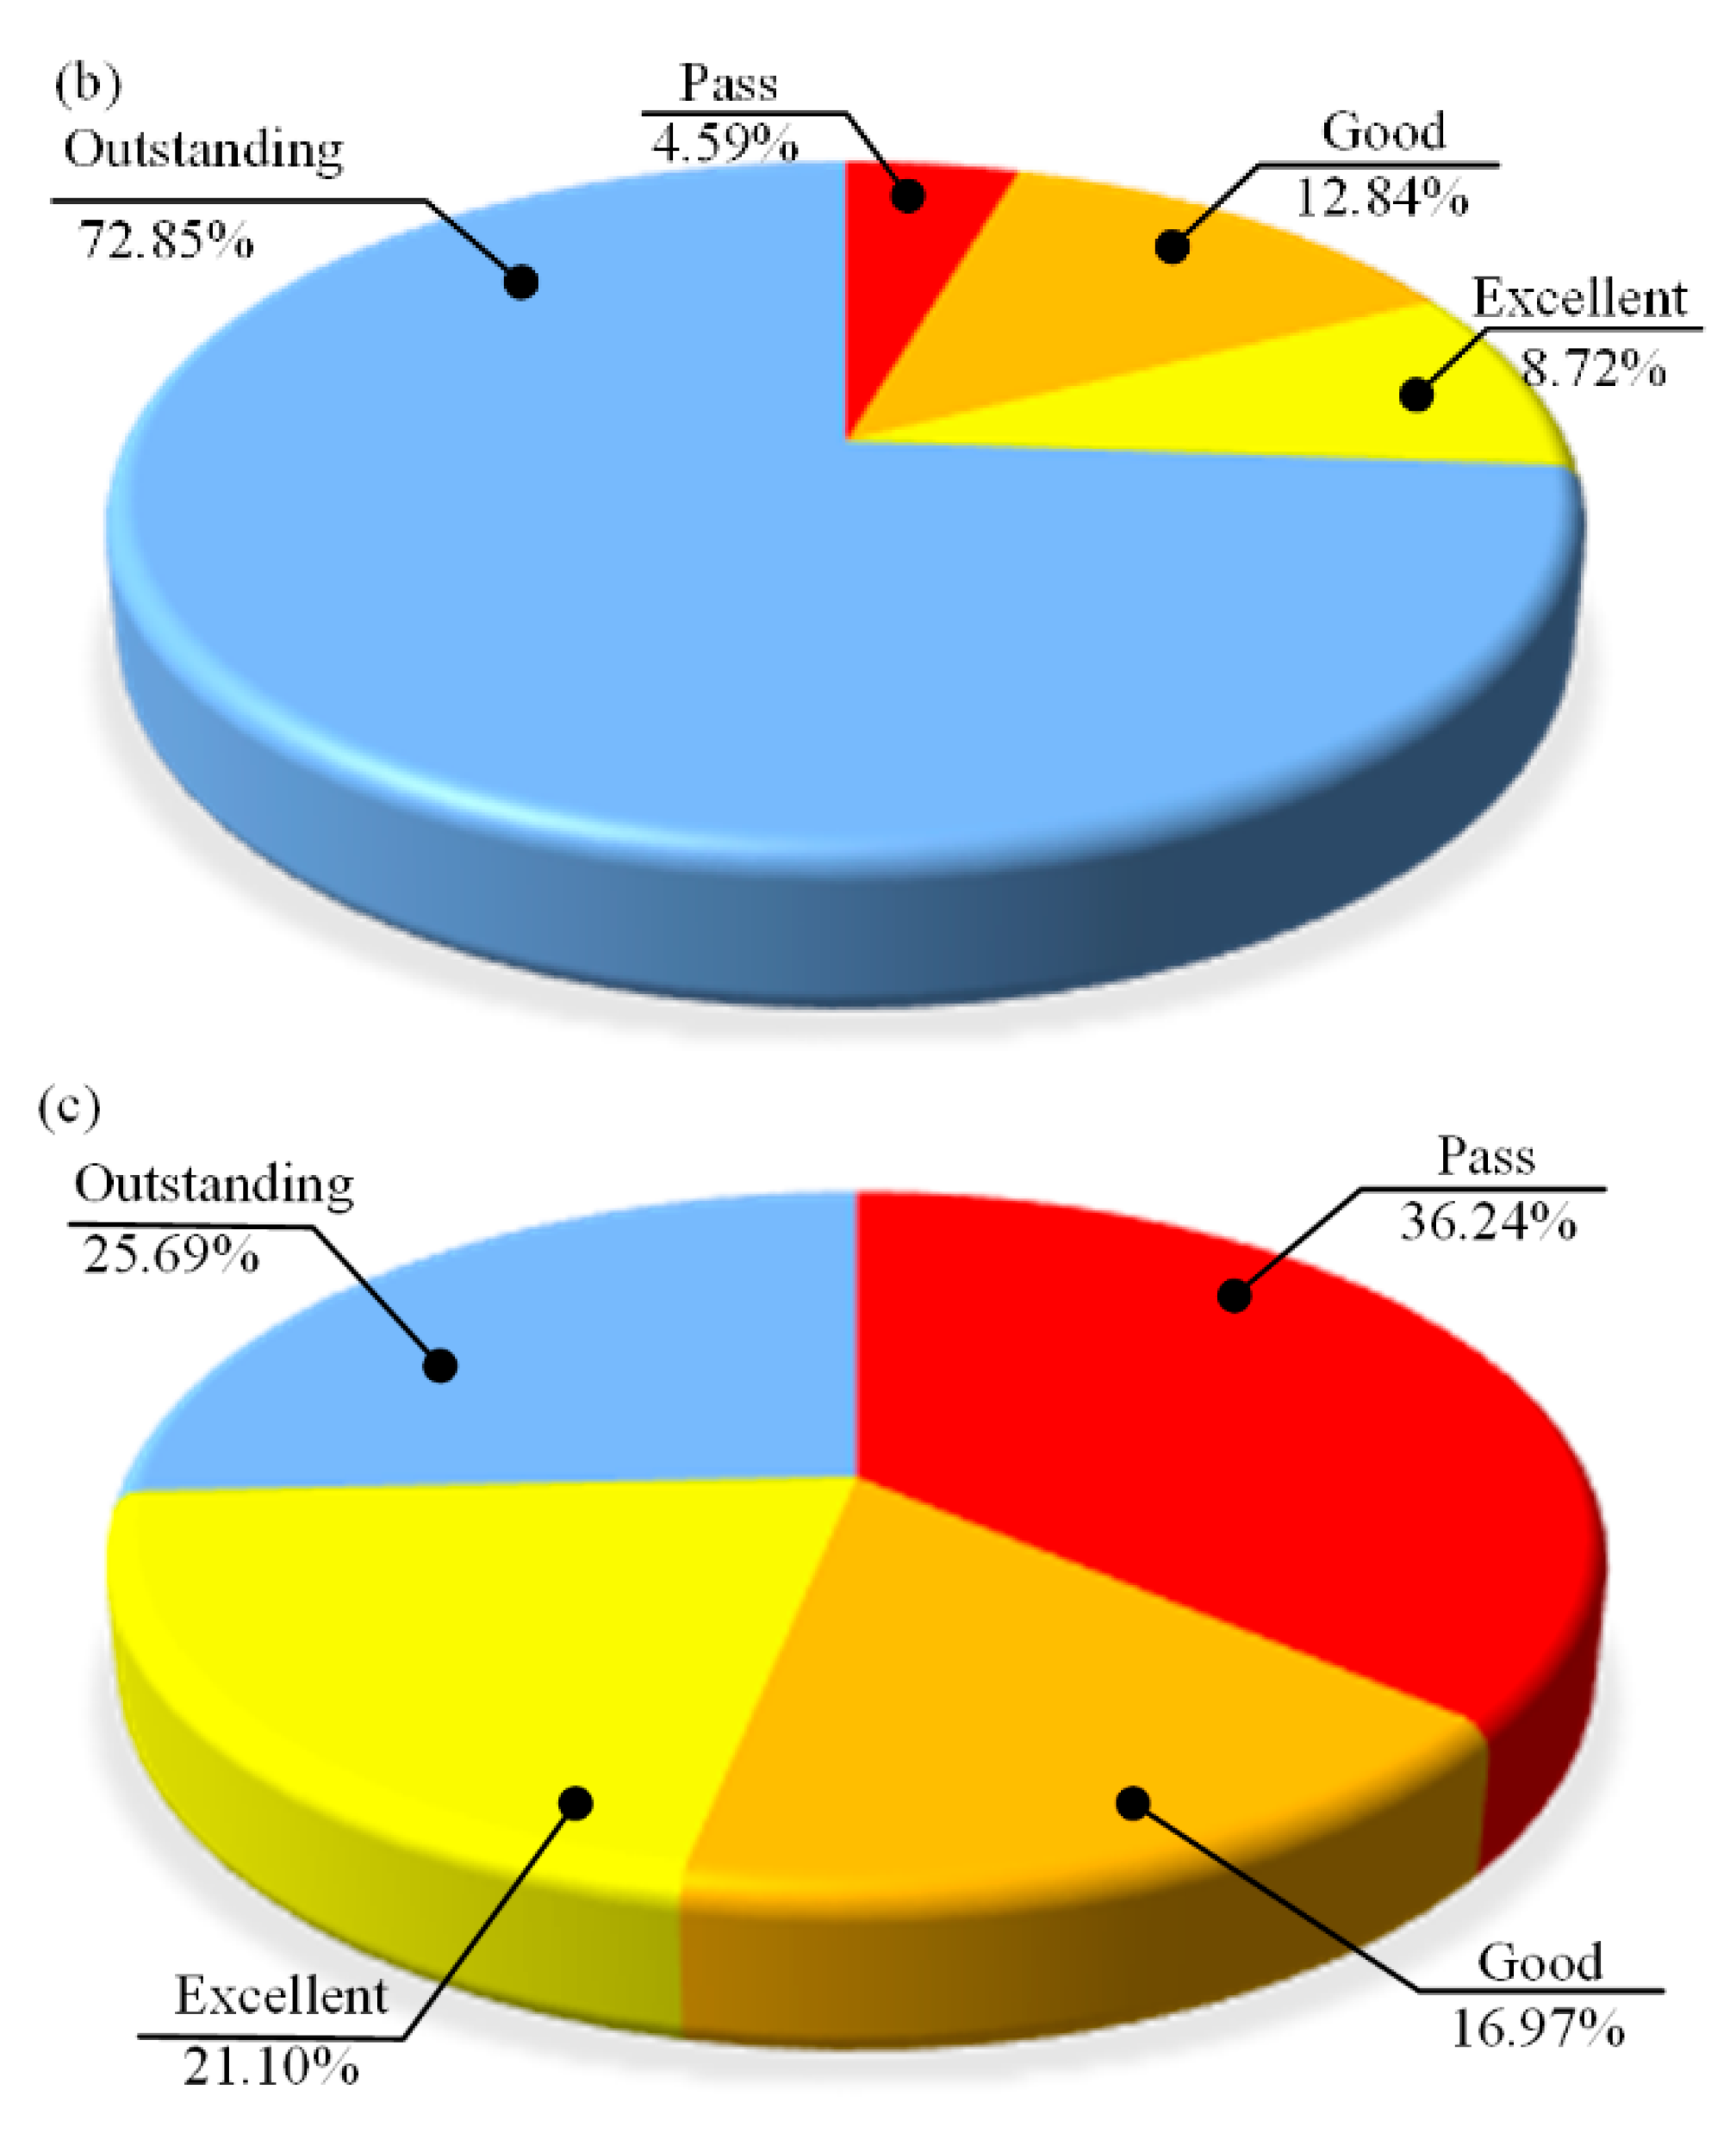
| Objective 2 | ● I was able to select the appropriate circuit from the given stress-strain measurement circuit for measurement. | 0.46 | 0.28 | 0.18 | 0.07 | 0.02 |
| ● I am able to standardize the installation of measuring sensors. | 0.26 | 0.28 | 0.25 | 0.00 | 0.05 | |
| ● I can standardize the experimental circuit. | 0.44 | 0.34 | 0.16 | 0.03 | 0.02 | |
| ● I can standardize the measurement of accurate and reliable experimental values. | 0.39 | 0.39 | 0.15 | 0.03 | 0.03 | |
| ● I was able to compare the experimental results with the finite element results and analyze the reasons for the gap. | 0.49 | 0.30 | 0.16 | 0.03 | 0.02 | |
| ● Based on the test and analysis results, I can reasonably optimize the experimental objects and give feasible suggestions and finite element analysis verification. | 0.44 | 0.33 | 0.16 | 0.03 | 0.03 | |
© 2020 by the authors. Licensee MDPI, Basel, Switzerland. This article is an open access article distributed under the terms and conditions of the Creative Commons Attribution (CC BY) license (http://creativecommons.org/licenses/by/4.0/).
Share and Cite
Guo, Y.; Yang, L.; Chen, X.; Yang, L. An Engineering-Problem-Based Short Experiment Project on Finite Element Method for Undergraduate Students. Educ. Sci. 2020, 10, 45. https://doi.org/10.3390/educsci10020045
Guo Y, Yang L, Chen X, Yang L. An Engineering-Problem-Based Short Experiment Project on Finite Element Method for Undergraduate Students. Education Sciences. 2020; 10(2):45. https://doi.org/10.3390/educsci10020045
Chicago/Turabian StyleGuo, Yanjie, Lijuan Yang, Xuefeng Chen, and Lei Yang. 2020. "An Engineering-Problem-Based Short Experiment Project on Finite Element Method for Undergraduate Students" Education Sciences 10, no. 2: 45. https://doi.org/10.3390/educsci10020045