1. Introduction
Collaborating online in creating knowledge and meaning is perceived as an essential skill for individuals and groups [
1]. This has become even more evident as the world’s encounter with COVID-19 gave rise to new, unprecedented challenges, which require the integration of multiple points of view as well as a constant flow of new data and information [
2], mediated by technology. More than ever before, online collaborations have become an inherent component of knowledge creation and innovation in the educational, academic, professional, and civic arenas [
3,
4,
5,
6].
The importance of incorporating the practice of online collaborative discussion into the curricula is gaining recognition but poses some new challenges. One major challenge is assessing the performance beyond the individual, and the quality of a collective knowledge product. As traditional quantitative assessment methods focus on individual performance, this requires the development of new paradigms and methods alike [
1,
7,
8].
A prevalent way to address the quality of online collaborations is to focus on the quality of the students’ interaction with fellow learners and the content they produce [
9,
10,
11]. However, going beyond the social interactions that underly collaborative processes, the work presented here seeks to add another layer of observation: the network of content and its structure. Adopting a network perspective in the study of collaborative discussion content allows a bird’s-eye view of the group-level product and enables the capture of complex, dynamic, and bottom-up emergent structures within the content network [
12]. The view of the network as a whole complies with the perception of collective work as a shared product that can be greater than the sum of its parts and exceeds the cognition of any participating individual, as well as the sum of the individual cognitions [
13].
This exploratory work aims to investigate quantitative measures for evaluating the process and products of large group online collaborations for shared meaning-making and collective knowledge creation, at the collective product level, based on their structural qualities. It focuses on networks that emerge through active linking of content, in the format of collaborative concept-mapping. Network analysis tools were applied to these networks, to produce quantitative measures that reflect the richness and the complexity of their structures. This strategy stems from the idea that the structure of the formed concept network is indicative of its merits: a more ‘networked’ concept-map represents a more complex organization of the content, including non-hierarchical multi-level and inter-domain connections, which imply a more meaningful learning process [
14,
15,
16]. Such measures could be used to complement qualitative analyses of content produced in collaborative discussions, including the use of text analysis methods. In the current research, we introduce indicators for network structures, extracted using network analysis techniques, that could shed a light on the quality of the generated concept-maps. This approach has two main advantages: first, it can be applied at a scale, to a concept map formed via a mass collaborative process. Second, applying network-analysis tools may also provide insights towards more complex features of the networks formed, which cannot be identified manually or even by using other types of quantitative measures.
This research differs from previous related work in several aspects: (1) It focuses on the content network: many studies of online multi-participant discussions in learning environments utilize network analysis tools. However, most of these are applied to the underlying social network of connections between learners, to content networks constructed using text analysis techniques, or to various combinations of the two [
17,
18,
19,
20,
21]. This work uses a crucial feature within the discussion platform which enables cross-linking and the formation of a networked discussion [
12]. This enabled us to focus on the features of the content that was produced by the students through the collaborative process, and on the way that collaborative efforts affected its organization. (2) It focuses on large, asynchronous groups: consistent with much of the work within the CSCW (Computer-Supported Collaborative Learning) field, research on collaborative concept-mapping tends to focus on small, co-located groups [
22,
23]. Previous works conducted structural analyses of concept-maps qualitatively, by looking at the maps formed by either individual students or small groups working together [
14,
15,
24]. By using network analysis techniques, the current work was able to study the concept-mapping of larger groups (25–60), working asynchronously from multiple distant locations. In that, it is closer to the ideas of Networked Learning [
25]. (3) It focuses on graduate-level students: much of the work that has been done on collaborative concept-mapping in educational settings addresses school-aged children. The work presented here is based on data from graduate-level courses, offering an opportunity for a potentially more mature discussion and the capability of grasping the complexity of relations between concepts.
The paper is structured as follows: (1) the Theoretical Background first describes the idea behind collaborative concept-mapping as a practice for representing the process of knowledge construction, in individuals and groups, and then establishes the notion that more ‘networked’ concept-maps represent a higher quality of collaborative knowledge construction work. Next is an account of how the ‘networkedness’ of a concept-map can be assessed, based on previous work in this direction that addressed smaller-scale concept-maps and mainly applied qualitative analysis. (2) the Methods and Materials section presents quantitative metrics for describing structural network-level metrics that are commonly used in the field of social network analysis (SNA) and explains how these can be adapted to collaborative concept-maps. (3) the Results section presents findings from implementing the proposed methods in the analysis of data from six online discussions held in academic settings, while the Discussion and Conclusions sections address the study’s limitations and suggest directions for further research, and elaborate on this work’s possible implications and applications.
1.1. Theoretical Background
1.1.1. Concept Mapping: Learning as the Emergence of Structures in Conceptual Networks
In the cognitive sciences, a network that encompasses concepts and their relations is called a semantic network [
26,
27,
28,
29]. A semantic network is essentially a graph representing knowledge as patterns of interconnected nodes and arcs [
30]. The links, represented by the arcs, are labeled with the semantic relation type [
26,
30]. Novak built on similar ideas to develop specific guidelines for a pedagogical practice called “concept mapping” [
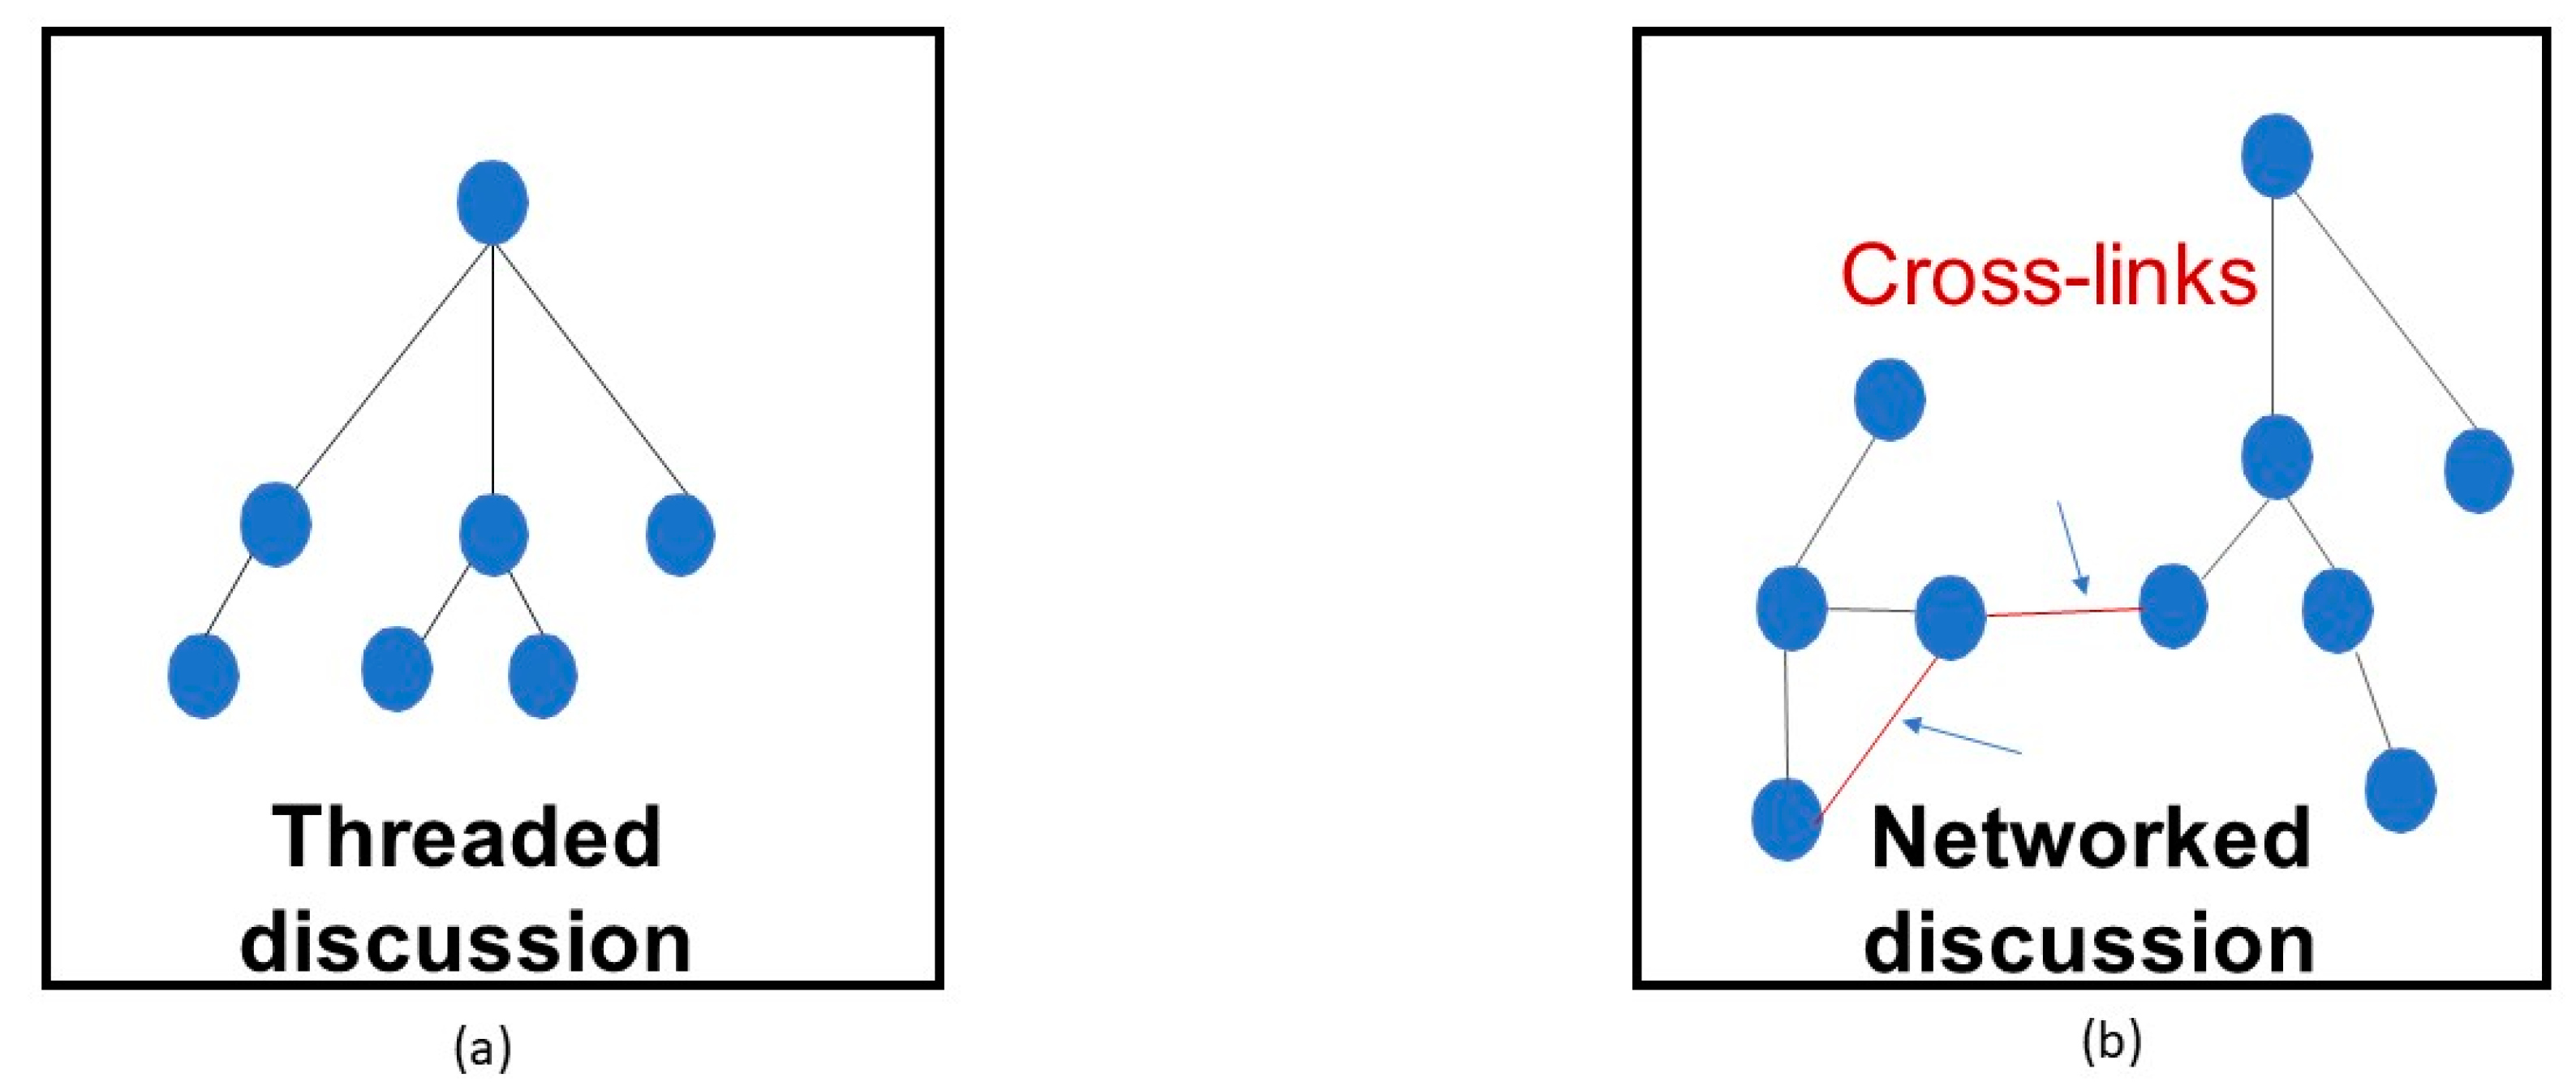
31]. Concept-mapping was devised as a means for creating an external visual representation of the learner’s perception of the relations between different concepts that make up a knowledge domain by using a map in which each concept is represented by text (typically one word), and the concepts are actively linked by the learner. Each link describes the relations between the linked concepts (e.g., “shows that”, “includes”). These maps can be viewed as networks, which consist of nodes (the concepts) and links. Novak’s concept maps include another important feature: cross-links. Cross-links can be added between any two existing nodes in the graph (see
Figure 1). They can be used for connecting concepts belonging to different domains represented as areas in the map, and therefore are considered to represent creative leaps [
32]. Creating the links between concept units is a means of organizing them into meaningful and more integrated knowledge structures. From a network perspective, they enable the formation of maps that are complex and non-linear [
12].
Concept-mapping was originally designed for representing the learning processes of individual students. It was later extended for the use of small groups working collaboratively, first in classroom settings, and later on in online settings [
23,
33]. These practices stem from the notion that collaboration can be a means of forming knowledge, and not only exchanging or sharing it. Further development of the use of concept-mapping in an online collaborative learning environment is described in Rafaeli and Kent (2015). In their work, larger groups of students (up to 70), used a networked online discussion platform to generate large scale concept-maps through an asynchronous collaborative discussion. They further demonstrated that in this environment, “concepts” can be more complex entities, comprising entire posts that contain text, media, and even external links. By incorporating the feature of cross-links into discussions, online collaborative concept mapping stands out from traditional tree-shaped discussions in forums such as the ones widely used in Learning Management Systems (LMSs) or Massive Open Online Courses (MOOCs), due to the non-linear and non-hierarchical structures which they allow. This makes them particularly adequate for investigating collaborative knowledge construction.
1.1.2. Assessing the Quality of Concept-maps Based on Network Structures
Earlier work on the assessment of concept mapping focused on the extent to which the maps reflected a student’s understanding of a subject matter in regards to relational links between the concepts comprising it [
34,
35]. Later work, however, includes a relation to concept-maps as indicators of a learning process rather than just an end product. Consistent with the view of learning as emergent [
36], the changes in the concept-maps’ network structures are considered to reflect the development in the state of the knowledge of an individual or a group over time. Kinchin, Hay, and Adams proposed to assess the quality of this learning process by classifying the formed concept-map according to its structure [
14]. The most basic structure they describe is a spoke, comprising of simple, one level associations. It is considered to be over-simplistic, and an indication of superficial learning. The second identifiable structure is a chain comprised of multiple levels and represents a hierarchical conceptualization. A chain formation reflects an attempt to organize the knowledge, but it does not capture the complexity and interactive relations between concepts. Moreover, the structure cannot cope with new additions and is difficult to reorganize in light of new information. The third structure, which is considered an indication of meaningful learning, is the network. It includes multiple levels as well as connections between conceptual units at different levels and different domains, breaking the hierarchical tree-shaped formation. A network-shaped concept map is considered to be of high integrity, with high adaptability to change and update and high complexity [
15,
16]. This approach to the assessment of learning emphasizes complex structures as indicators of high-quality learning. When applied to the work of groups, it is considered an indication of the group process of learning and sense-making. While these observations regarding concept-maps were done manually and qualitatively, the current work attempts to suggest means for evaluating the network quality of collaborative concept-maps quantitatively using network analysis tools.
2. Materials and Methods
2.1. Network Measures
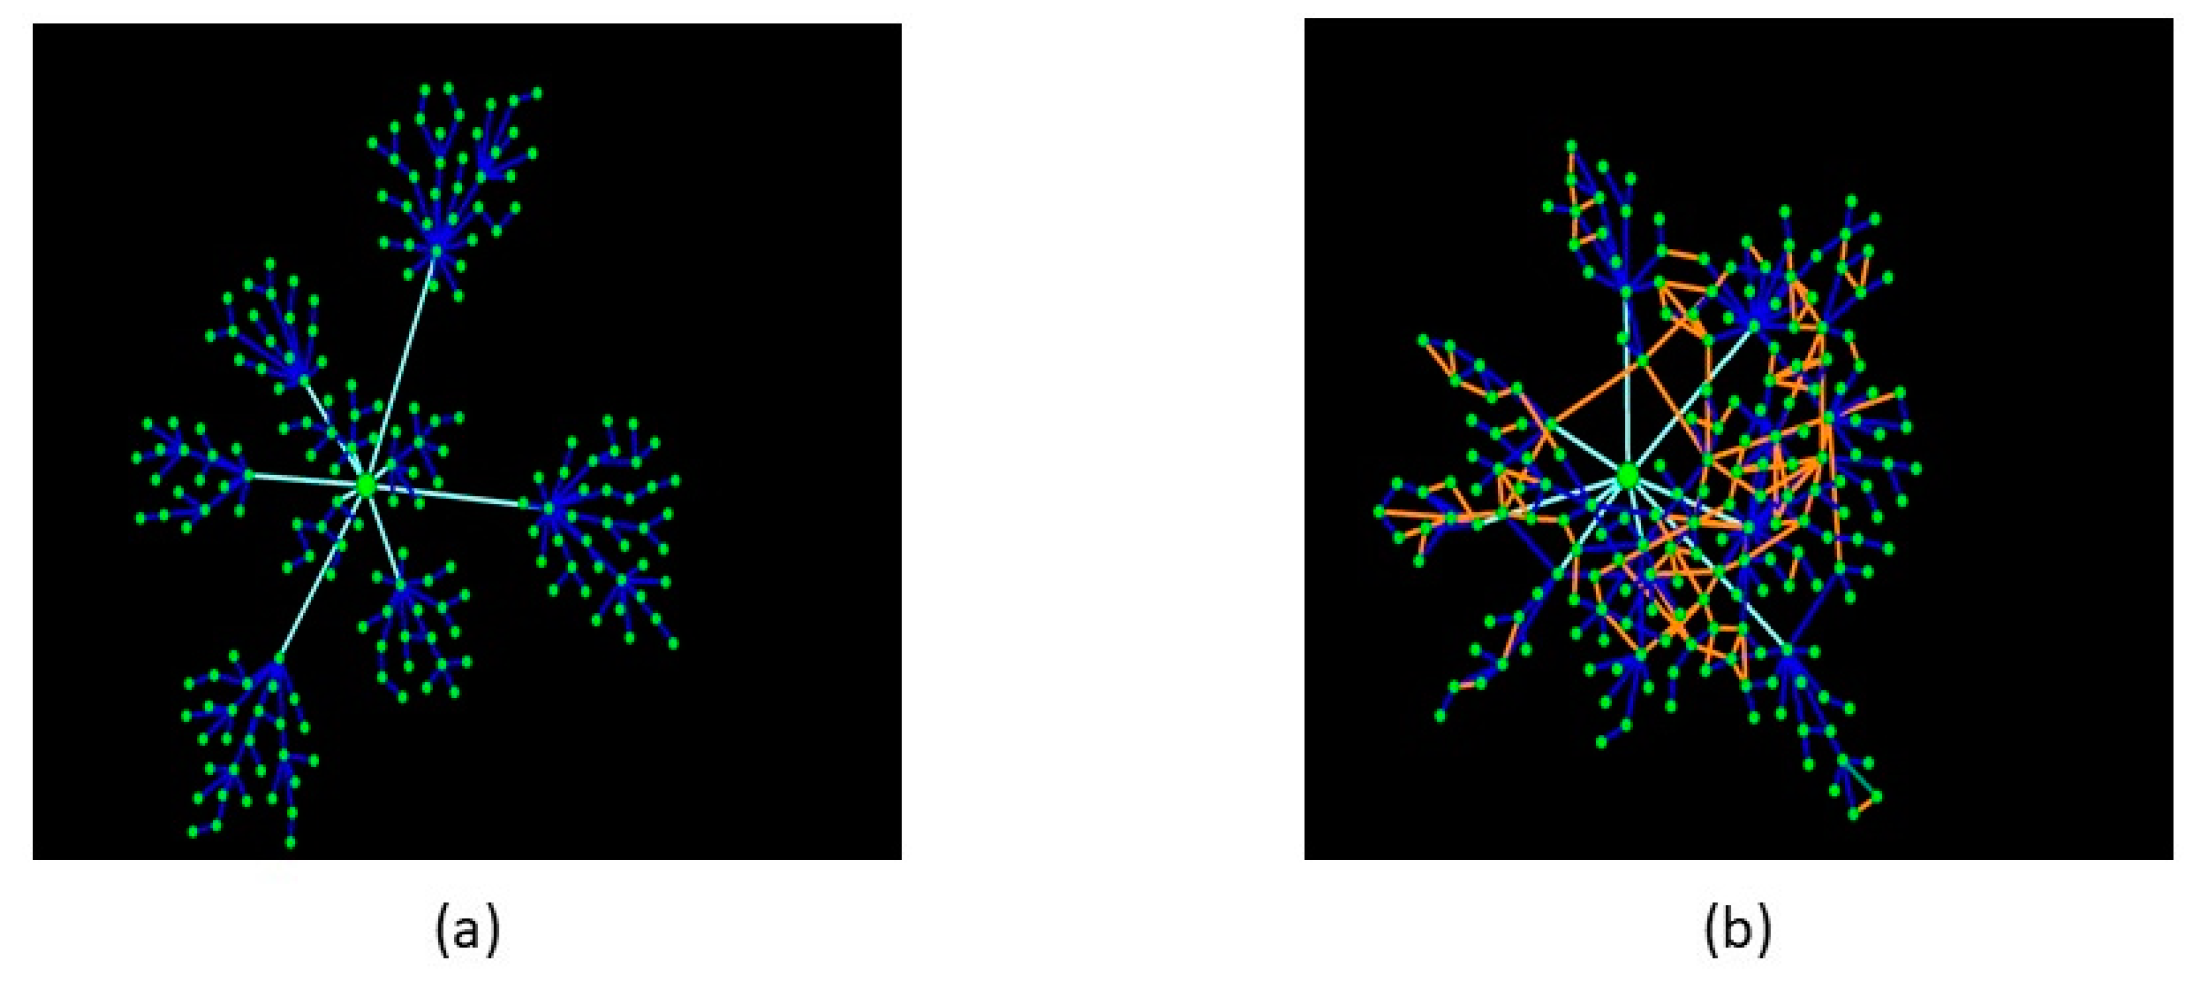
Concept-maps that include network formations are considered more sophisticated regarding the organization of knowledge. They represent the complex interconnectedness and indicate a richer collaborative learning process. Importantly, the “networkedness” of concept maps is enabled through cross-linking. By adding cross-links, participants form conceptual connections. At the macro-level of the entire map, this leads to emergent organizations reflected in the maps’ structures. Unlike sequential links progressing from one concept to another, cross-links give rise to a non-linear, non-hierarchical structure that deviates from the spoke formation, the chain formation, and even hierarchical dendrograms. They create closed cycles as clusters of more densely connected concepts and form less-centralized graphs (
Figure 2). In the current work, we describe some network parameters that are indicative of such phenomena, selected out of a range of network structure metrics. Other metrics could be added to offer more insight into the structural qualities of the maps.
2.1.1. Degree Distribution
The degree of a node in a network graph is the number of connections it has to other nodes. The degree distribution of a graph is the distribution of probabilities of graph nodes to be connected to a given number of nodes [
37]. This distribution is partially indicative of the overall network structure. For instance, a spoke formation includes one node with a very high degree (the center of the spoke), and the rest of the nodes will have a degree of one because they are only connected to the center. In a perfect chain structure, all nodes but the first and last in the chain will be connected to two nodes, each stemming from a chronologically previous node and leading to the next linearly (a degree of two). In a networked structure, however, the degree distribution should indicate several more central nodes, with significantly more links, but then some more nodes with multiple links, in deteriorating numbers, usually followed by a long tail of nodes with a degree of one. The more ‘networked’ a concept map is, the lower the ratio of nodes with only one link, as new concepts are integrated into the map and become connected to related concepts by cross-links.
2.1.2. Global Clustering Coefficient
Breaking the linearity of the map by cross-linking allows the participants to connect related concepts. This functions as an organizing instrument by grouping together related units of knowledge and converging them [
12]. From a network perspective, this is represented by transitivity. In the context of a concept map, transitivity means that if one concept is connected to two others, these two are more likely to be connected. The overall transitivity level of the network can be measured using the global clustering coefficient. This is the rate of closed “triangles” out of all possible “triangles” in the graph, or the percentage of nodes that are linked to each other, giver that they are both linked to a third node. A higher global clustering coefficient would indicate that concepts in the map have become more converged and organized based on their relatedness, similar to the ideas behind mental semantic networks [
29]. Note that without cross-links, the clustering coefficient equals 0 because no triangles can be formed.
2.1.3. Connectedness of Components
In hierarchical organizational formations, such as a spoke or dendrogram (a tree-shaped graph that spans out from one parent node, without closed cycles), removal of the nodes that are higher up in the hierarchy leads to full or partial disintegration of the graph. Networked concept maps are of higher integrity [
14], a result of links that provide alternative “routes” between concepts based on the participants cross-linking. From a structural perspective, this is manifested in the number of components that remain weakly connected after removing central nodes. Weakly connected components are sub-graphs in which all the nodes can be reached from all other nodes by some path. The more integrated and connected a map is, the less fragmented it should become when the central concept node is removed. For example, in the extremely centralized spoke formation, removal of the central concept node would result in the complete disintegration of the graph: there will be no components of two or more concept nodes, but rather a collection of multiple one-node components of unattached concepts. Meanwhile, the more interconnected a map is, the more likely that the removal of the central node will result in less detached small components. Since the cross-links are the factor that affects the connectedness of the concept map, the relevant comparison would be between two versions of the graph without the central concept node: with the cross-links and without them. The more integrated the map is, the higher the difference between the number of separate components should be.
2.2. The Online Discussion Platform
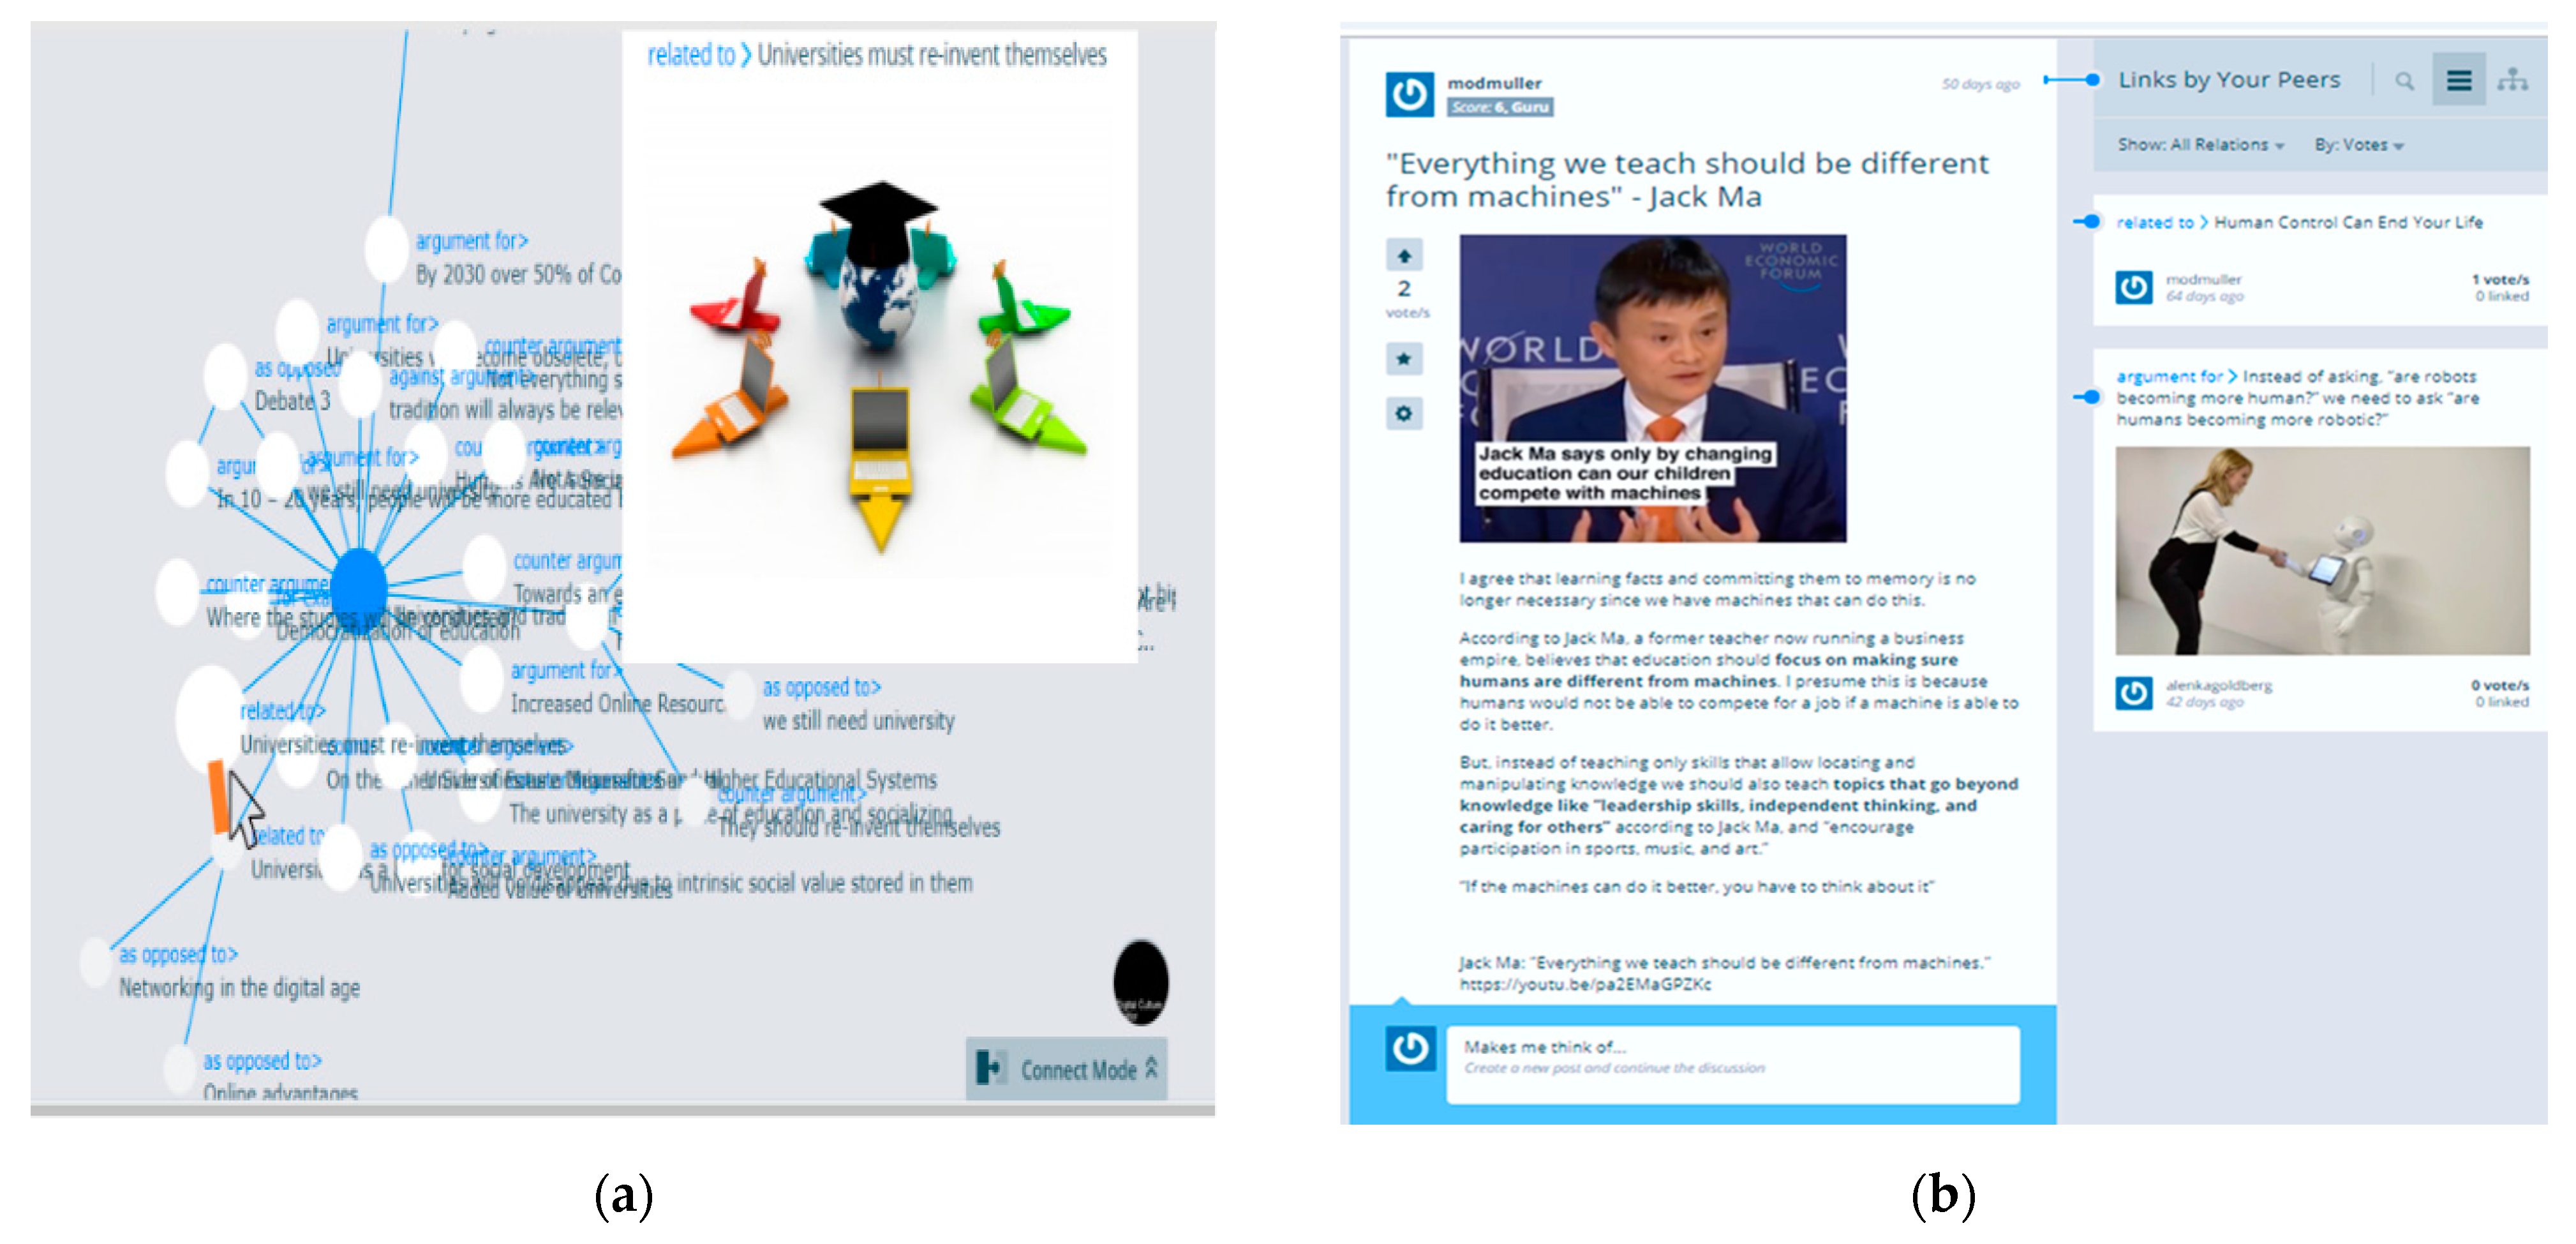
The platform used for creating the collaborative concept maps is called Ligilo. Created as a means for communities to engage in multi-participant, asynchronous discussions, Ligilo was designed following the idea of concept maps based on the principles proposed by Novak [
32,
38]. In particular, the platform allows for cross-linking, a feature that differentiates it from most academic online discussion platforms. Posts in Ligilo can include text, multimedia, and external links, and each new post must be linked to a prior post, forming a sequence. The platform also offers a visual network display of the discussion [
19]. Cross-links can be added within the visual network display. Adding them induces two changes: first, it reshapes the network of posts, by including the new link and “pulling” the newly connected nodes closer together as well as nodes previously connected to them, forming new visible structures. Second, after the connection is made the posts become “gateways” for each other. While navigating in a discussion-like view of the network, opening a post for reading directs the participant to all other posts connected to it, including cross-linked posts. Accordingly, the new link affects subsequent readers’ flow of posts.
Figure 3 displays screenshots from Ligilo.
2.3. Courses and Collaborative Concept-Mapping Assignment
The data presented here is based on six collaborative concept maps from five academic courses. All discussions were asynchronous and held for 8–12 weeks, with the number of participants ranging between 30–60. The classes included four blended courses that incorporated frontal sessions and the discussion assignment (two courses on virtual communities for Information and Knowledge Management graduate students, and two courses on Electronic Markets for Master of Business Administration students) and one fully online course which included two separate discussion environments within the platform. The 15-week course, which addressed life in the digital era, was hosted on the edX.org platform. Students that participated in the concept mapping assignment were directed to their discussion arena on Ligilo. The discussions included mostly university students from several departments, taking the course for credit, but also some international participants who were taking the course without credit, in a MOOC format.
Table 1 summarizes the attributes of the six discussions.
2.4. The Collaborative Concept Mapping Assignment
In all five courses, the assignment was similar. The discussion arena was pre-seeded with the main topics addressed in the course (e.g., communities in business; privacy and trust). The students were given lists of concepts, including key thinkers, which are relevant for each topic. They were instructed to select a concept from each topic, add it to the map, and elaborate on it throughout the term, including with a text definition and examples. They were encouraged to add supportive media such as images or video and to add external relevant web links. Students were also encouraged to create cross-links between concepts in the map but were not rewarded for this in terms of grading. Students could also contribute freely to the discussion by posting their thoughts, ideas, associations, or anything else they thought relevant. In the online course discussions, students were also requested to contribute multiple choice questions for the course exam and to link them to their context within the map based on content. In the two MBA courses, students were assigned to small groups (2–4 students), and each group chose a topic and posted all the relevant concepts within their topic.
2.5. Constructing the Graphs
The map graphs were constructed based on the data from Ligilo, using the R igraph package [
39]. Each post in the discussion was represented as a node in the graph, while each link was represented as an edge. In graphs 5 and 6, contributions by the staff, that were added during the discussion, were removed (less than 5% of posts). These graphs also included two sections that were removed from the final graphs, as they were not an integral part of the concept-maps: a Q&A section and a self-introduction section. In graph 5, several self-introduction posts that were mistakenly linked to the concept map were also removed.
The maps were defined as undirected graphs, that is, graphs in which the edges have no directions: if A and B are connected nodes in the graph, A can be reached from B and vice versa. This was decided for two reasons: 1. Once posted, navigation along graph posts through their links is bi-directional. Participants can move from a post to any other post connected to it, regardless of the original direction of the link. 2. On a theoretical level, the association between ideas is not a one-way street. The current research views the concept map formed through the discussion as a holistic product, which is why we are concerned with the eventual network of connections between all posts, and not the directionality of their formation.
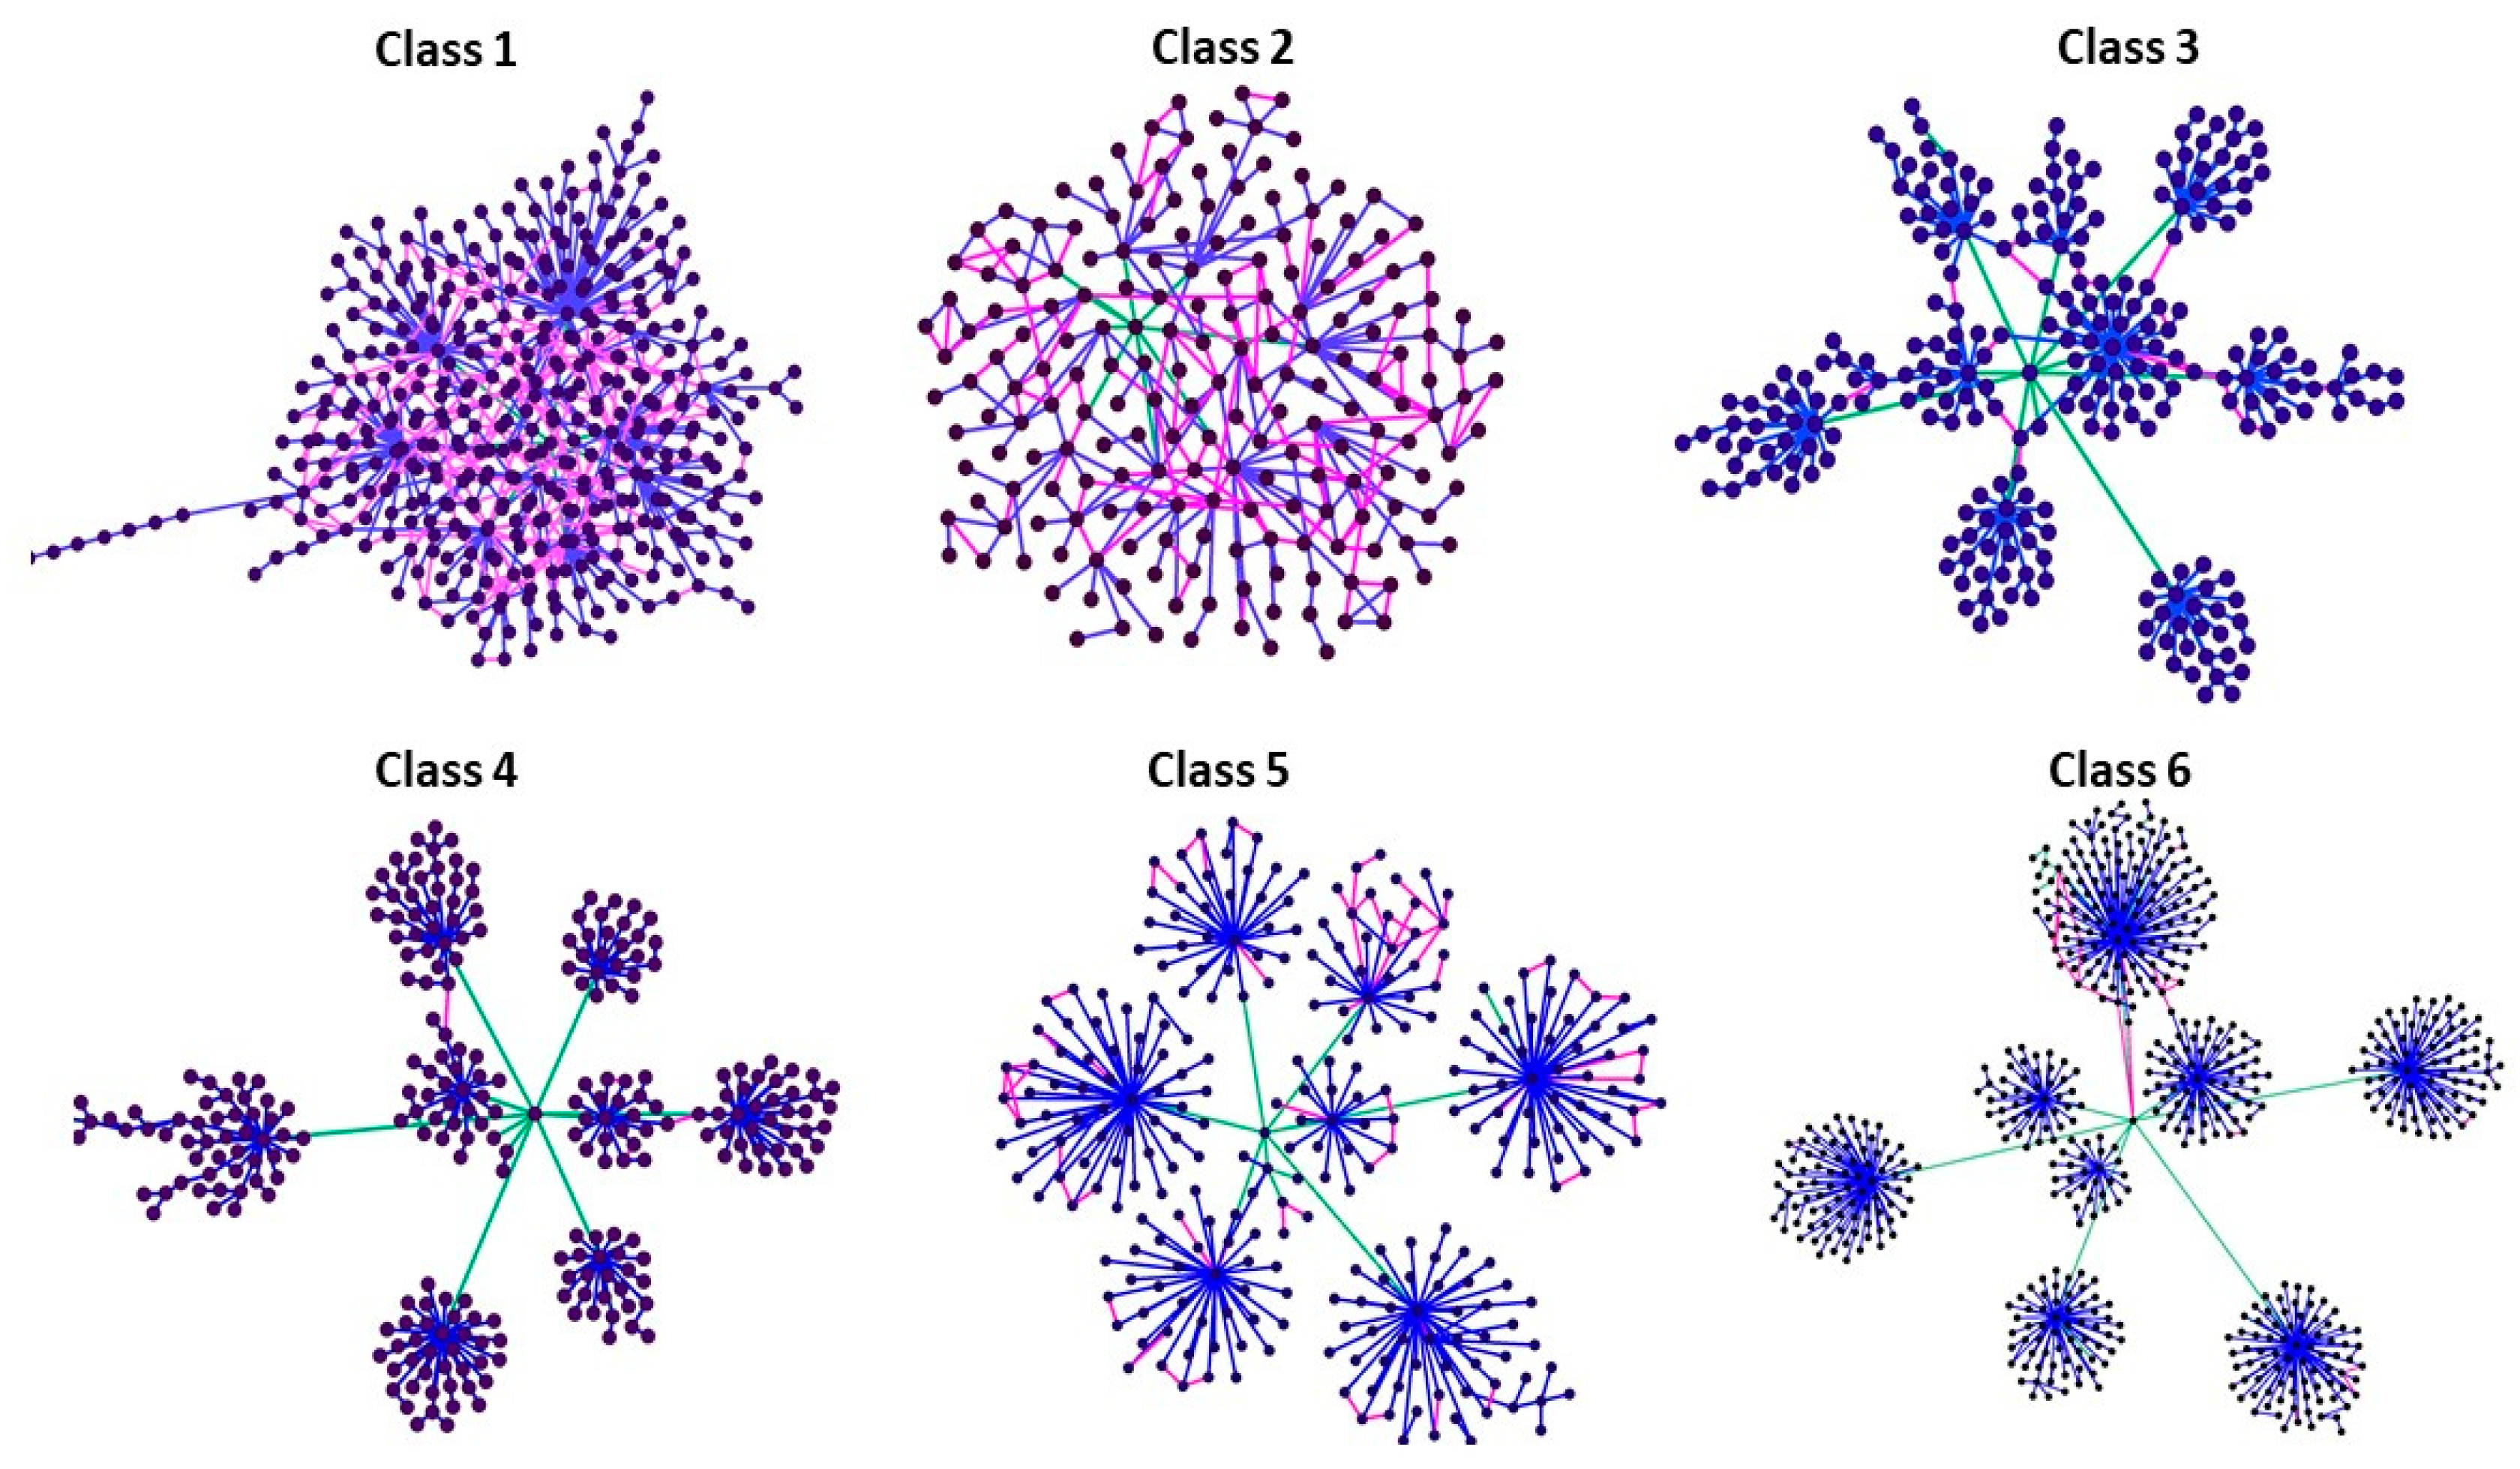
Figure 4 presents the graphs constructed based on the concept-map discussion data and
Table 2 presents a summary of the graphs’ basic metrics.
3. Results
3.1. Network Measures
For each graph, the network measures described above were extracted. Calculations were performed using either Gephi 0.9.2 [
40] or the R igraph package [
39].
3.1.1. Degree Distribution
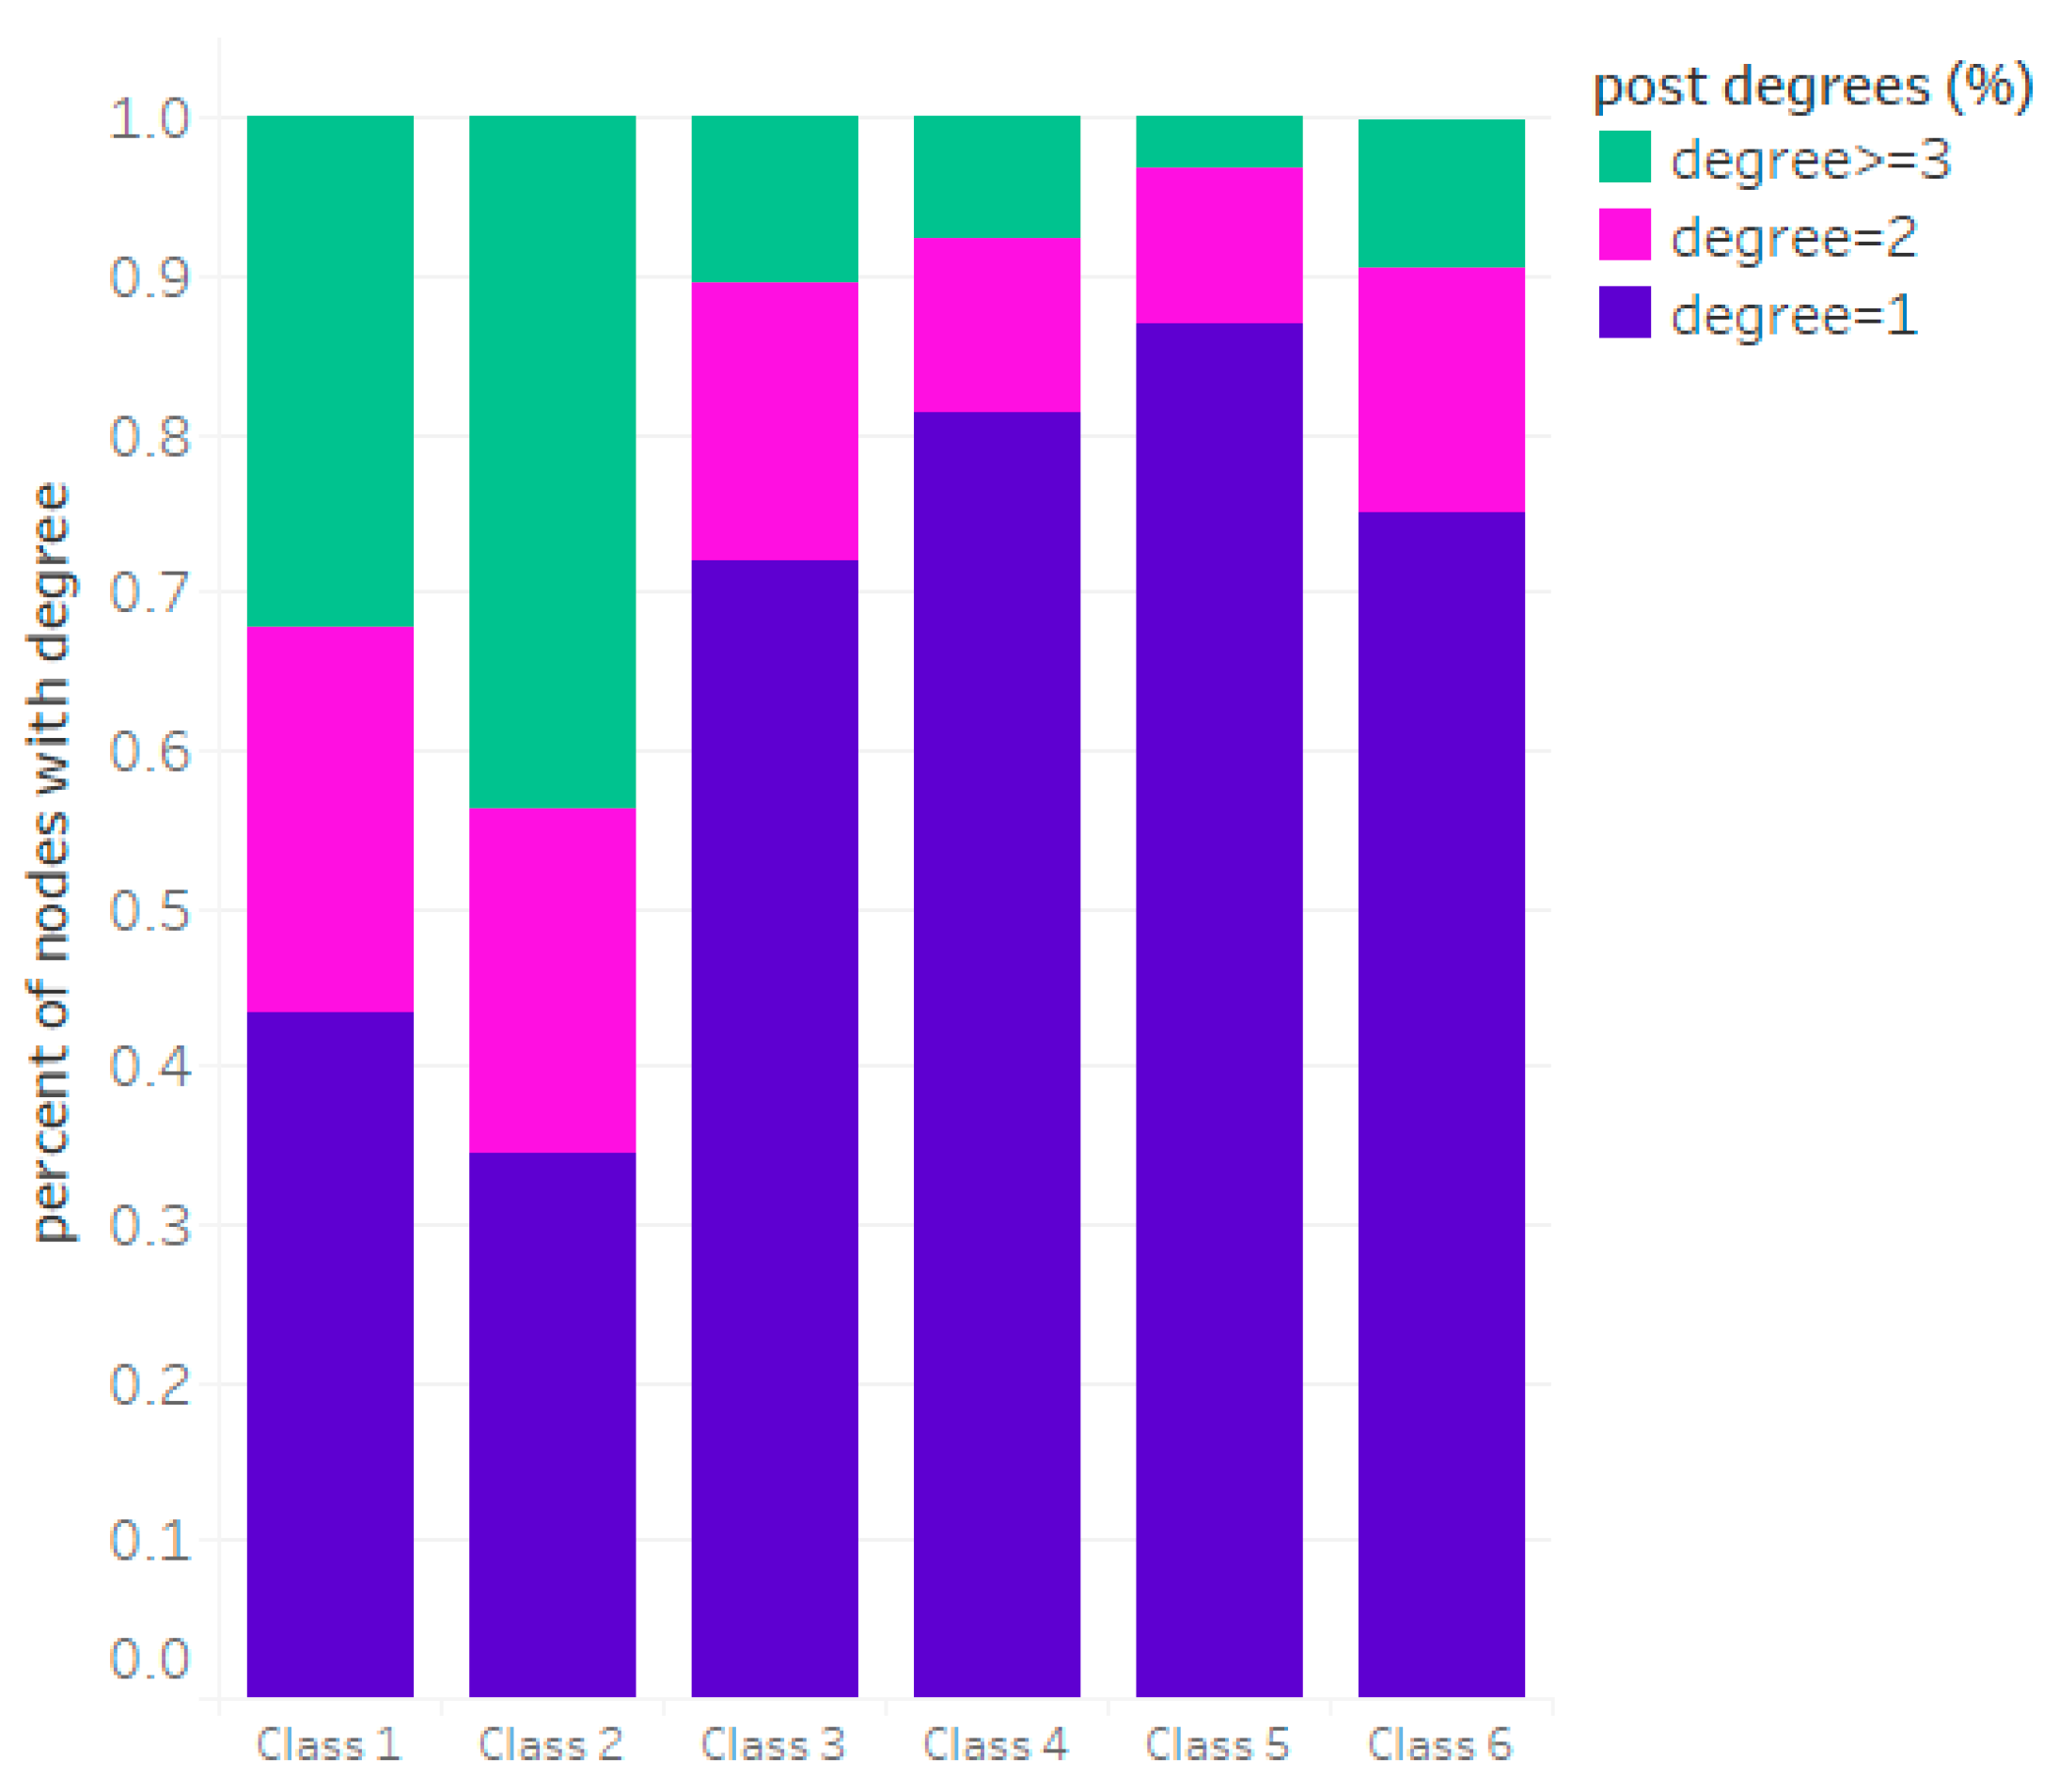
The discussion graphs all start with an initial seed post and several “opening posts” created by the course staff, that initiate the discussion. These naturally receive the highest amount of connections. The analysis aimed to identify the emergence of new focal points resulting from student-generated posts that became more central through the discussion. Accordingly, the degree indicators were only calculated for student-generated posts. The following indicators of degree-distribution were calculated: 1. The rate of nodes with a degree of 1, representing posts that were “dead ends” in the discussion and were neither replied to nor cross-linked; 2. The rate of nodes with a degree of 2, representing posts that either received one reply or were cross-linked with one other post; 3. The rate of nodes with a degree of 3 and more, representing posts that emerged as local focal points within the map.
Table 3 summarizes the distribution of posts with degrees of 1, 2, or 3 and higher, and
Figure 5 charts these measures for comparison between the graphs.
3.1.2. Global Clustering Coefficient
The graph’s clustering coefficients represent the extent to which proximate posts in the map became interconnected through cross-links. Clustering coefficients can be calculated either globally, i.e., the ratio of connected triangles of nodes out of all possible triangles (two nodes connected to the same node), or locally for each node, and then averaged across all nodes. In our data, only a small portion of the nodes (posts) had two connections, because many posts did not lead to further discussion. Accordingly, the local clustering coefficient was not an adequate measure, and the global clustering coefficients were calculated. The maps that were analyzed differed greatly in their global clustering coefficients, suggesting a variation in the amount of clustering.
In the maps, the clustering coefficients are dependent on two factors: the prevalence of cross-links, and the share of these cross-links that are placed to connect concepts that were close by in the map, in a manner that “closes” a triangle of three posts. Across the maps, it appears that many of the cross-links were placed by the students in a position that forms a triangle, ranging between 44% and 75% of all cross-links. In most of the maps, about half of the cross-links connect concepts that were nearby on the map and share a connection to another post.
Table 4 summarizes the clustering measures: 1. global clustering coefficient; 2. The total number of closed triangles of posts within the map; and 3. The percent of cross-links that formed a triangle.
Connecting posts that are proximate in the graph creates clusters of closely related concepts. These clusters can act as an emergent organizing mechanism that facilitates navigation within the map, similar to the organization of cognitive representations and semantic maps held by individuals [
41,
42]. Accordingly, the use of cross-links in forming clusters can be viewed as an indication of organizing efforts in the creation of the collective concept map. This took place in all of the maps that were analyzed. The variation in the clustering coefficients seems to be mainly based on the use of cross-links in general, but establishing this relation statistically requires further research with many more graphs.
3.1.3. Connectedness of Components
The connectedness of components represents the extent to which distant posts in the map became connected based on cross-links, to create larger “chunks” of connected concepts. This is consistent with maps that are less fragmented and more integrated.
Identifying the weakly connected components: the collaborative concept maps were pre-set with a central seed post, created by the course staff, from which all the discussion topics branch out. One of the indications for the emergence of a cross-topic concept-network is the connectedness of the network after removing this seed: if connections were formed only within the original boundaries of the course topics, then removing the seed post should cause the post network to disintegrate, breaking into sub-networks comprising the different units. However, if after the removal of the central-seed parts of the network remain connected, this indicates that connections across topics and pre-defined content units were generated by the students. For each graph, we first removed the central seed, causing the graph to disintegrate. We then calculated the amount of weakly connected components, i.e., subgraphs in which there are paths from any node to any other node, twice: first, for the full map, including the cross-links, and second, for the same maps without the cross-links which were removed from the graph. We then created a convergence indicator: the reversed ratio between the number of components in the full graph and the number of components in the matching no cross-link graph. A higher number suggests that cross-linking had a greater impact on the convergence of separated areas in the map that were not connected in the original topical setting of the course, and resulted in the re-arrangement of the map as new paths between concepts emerged.
Table 5 displays the convergence indicator and the convergence ratio of the graphs with the cross-links, compared to the same graphs without cross-links.
The analysis revealed that the maps varied substantially in their convergence indicators. In class 1, cross-links merged all 15 subgraphs, creating connecting paths between all areas of the map. In class 6, in comparison, the original 13 subgraphs merged into 7. Interestingly, in class 4, where only four cross-links were formed all together, two of them were of proximate posts and resulted in triangles, while the other two connected separate subgraphs, reducing the total number from 10 to 8, and in Class 5 only one cross-link connected between separate components.
The cross-links that join together subgraphs can be referred to as bridging links that connect different areas of the map. In the collaborative concept maps, these associations shape the overall structure of the conceptual space and define its level of integration and cohesiveness. In the classes that produced higher convergence indicators, cross-links reshaped the maps to the extent that the original topic division became obsolete, and integrated themes emerged. For instance, in class 1 on the subject of Virtual Communities, the topics of “communities in business” and “crowdsourcing” became connected through the concept of cryptocurrency.
3.2. Comparing the Graphs
The three measures that we described in the previous sections provide insights on specific aspects of the networks’ properties: the ratio of posts with multiple degrees reflect the emergence of local focal points within the map, the global clustering coefficient reflects the level of integration and cohesion within small regions of the map, and the convergence index represents the joining of components in the map through the collaborative process. All of these processes depend on the participants’ cross-linking activity and its application within the collaborative concept mapping. From this exploratory analysis of the data, it appears that two of the maps seem to be more ‘networked’ than the others overall, that is they stood out as being higher on all measures, while one map stood out as being under-networked.
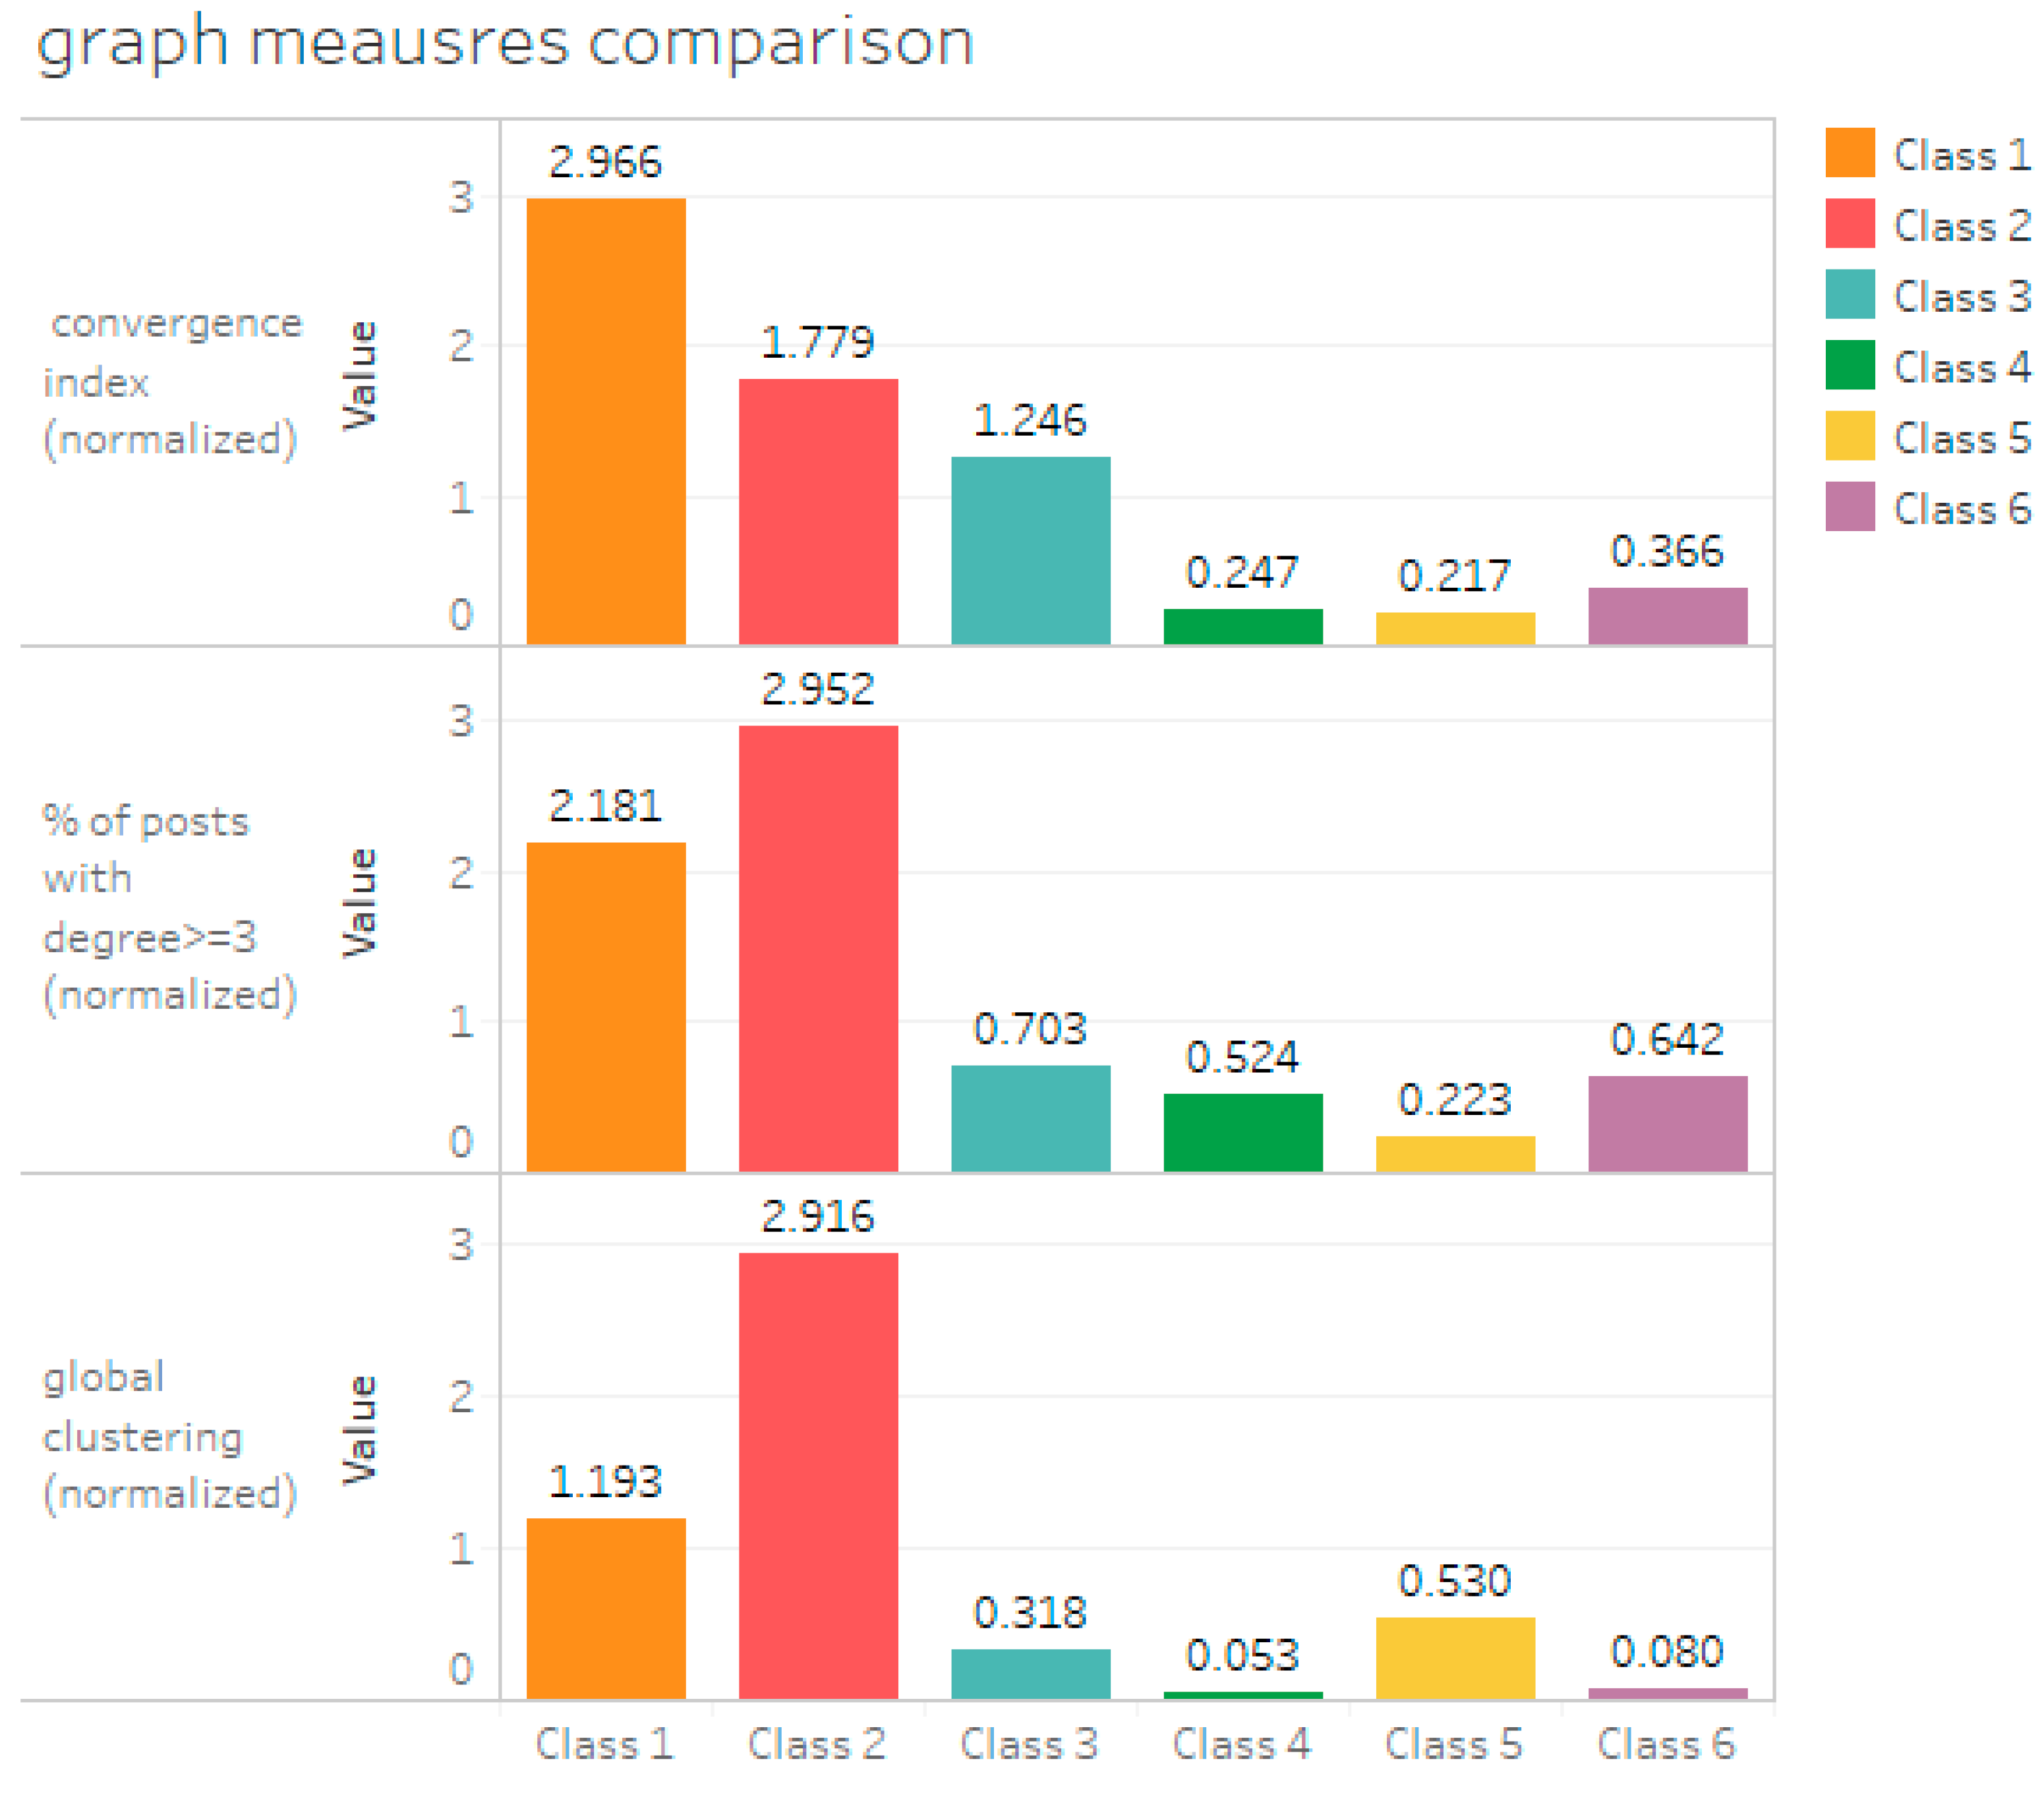
The following
Figure 6 charts all six class concept-maps on three parameters: 1. The percentage of posts with a degree of 3 or higher; 2. The global clustering coefficient; 3. The convergence index. The measures were normalized by dividing them by the standard deviation across the six maps for each metric, so they could be represented effectively in a unified chart.
Figure 6 attempts to demonstrate how the metrics presented here can provide insight into the quality of online collaborative processes. While the classes differed on several important aspects such as modality, the composition of students, and the precise definition of the collaborative assignment, the overall comparison gives some direction towards answering the question of which classes were overall more successful regarding the collaborative concept-mapping task. More indicative comparisons can be made between pairs of classes that had more similar settings: classes 1 and 2, classes 3 and 4, and classes 5 and 6.
Figure 6 indicates that the maps produced by classes 1 and 2 showed higher overall ‘networkedness’ in comparison to the rest (also, see
Figure 4). These two classes consisted of students in the Information and Knowledge Management track and addressed the topic of Virtual Communities. Possibly, these students may have been more inclined to participate in a collaborative activity of knowledge creation, as their professional background and personal interests typically entail some cultural familiarity with the narrative of knowledge sharing. The classes did differ in the specific measures, with class 1′s discussion being higher on convergence and integration, but lower on local organizing structures (clustering) and local focal points. Classes 5 and 6 were completely virtual, and the initial structure of the course was also slightly different and bigger at scale. It seems that class 5, which had a substantial proportion of cross-links, was relatively effective in terms of clustering, or local organizing structures, but cross-links were not used for connecting across sections of the discussion, yielding a particularly low convergence index. Judging by the low ratio of posts with a degree of 3 or higher, it seems that local focal points did not emerge as much in this class as in the other classes. Class 6, with a much lower rate of cross-links overall, seems to have had an opposite pattern, with a very low clustering coefficient, a slightly higher convergence indicator, and a larger proportion of highly connected posts. Classes 3 and 4 were held concurrently for two separate groups of MBA students, and both addressed the topic of online commerce. The students in class 4 hardly used cross-linking, which resulted in a less networked formation. While we do not know what led to an obvious difference in their collaborative network construction, these findings suggest that something in the dynamics of class 4 was sub-optimal compared to class 3 despite their similar settings. Further inquiry would be needed to understand what happened in this class and what could be improved, but the metrics presented here may help raise a helpful flag.
4. Discussion
Building on past work on the network features of a concept map as indicators for quality that was based on qualitative impressions [
14], we sought to investigate quantitative measures that could be appropriate for this task. The focus of the research was set on the holistic product of a learning community, rather than on the contributions of individuals.
Turning to network analysis tools, we used the metrics degree distribution, clustering coefficient, and connectedness of graph components. These metrics were applied to the networks of content that were generated by communities of students, in the form of rich collaborative concept maps. These enabled us to capture the “networkedness” of concept maps, stemming from the perception that higher-quality concept maps are ones that deviate from simple hierarchical and centralized structures. The findings highlight the role of connections between posts that were added by participants posterior to their creation: the cross-links. These were the enablers of the structural changes to the organization of content that were described here, and subsequently on the connecting of otherwise unrelated topics, on the shaping of the maps, and their network qualities. While cross-links are crucial for networked structures to emerge in the first place, it is the way these links are applied that affects the types of formations that will eventually appear. The comparison between the graphs revealed that cross-links vary both in number and in use across different discussions, resulting in differently shaped networks. These differences not only point to the general quality of the discussion but can also facilitate the recognition of more specific traits such as de-centralization, local organization, and integration.
Some of the limitations of the work presented here include:
The data was collected from a single platform that was specifically designed for collaborative concept mapping. Extending the analysis method to more sources of data would require some adaptations to discussion platforms to support cross-linking, or developing other ways to extract cross-links such as reliance on cross-references, hyperlinking, etc.
The metrics proposed here are only a demonstration of how the rich world of network analysis can be applied to large-scale collaborative concept maps. More metrics could be adopted and adapted for this purpose.
Being initial and exploratory, this work was based on a small number of maps, which can only provide some preliminary insight. To apply these methods in an assessment or evaluation setting, much more work is needed. Benchmarks need to be constructed based on a large number of representative graphs.
The work presented here is focused solely on the group-level product and is not indicative of the participants’ individual learning. Assessing individual benefits within a context of collaboration or the interplay between individual learning and the collective product requires a different approach [
43].
Some directions for future work include a fine-tuning of the measures presented here and the definition of benchmarks for high-quality maps. While our results indicate the variation between different discussions on all of the measures we examined, applying these and other network metrics to a large number of networks formed by the content of online discussions, varying in sizes and contexts, specifically in experimental settings, can provide a clearer understanding of the meaning of different values regarding the quality of the discussion. Such analyses should also be augmented and validated using qualitative examinations of the discussions, as well as text analysis metrics.
Another important direction to pursue is the role of specific participants in the forming of the map as a network. Based on the data presented here, it appears that like many online phenomena, a small percentage of participants have a significant influence on the shaping of the conversation. While this was not within the scope of the current work, further research could shed light on the activities of these participants, their motivations, and their perceptions of the collaborative concept-mapping process. This could be a step towards recognizing the value of this form of a contribution to online discussions that exceeds posting and is a part of meaning-making and organizing the discussion. Past work has recognized the informativeness of the underlying social-network structure of online discussions in identifying student roles [
21]. Our work adds the perspective of the way the students’ contribution is reflected in the network of content. Future work could attempt to investigate the relations between the two by constructing and analyzing both kinds of networks.
The current work joins some of our previous work [
12] in highlighting the crucial role of cross-linking in shaping online multi-participant discussions. At the macro level, from the standpoint that knowledge is emergent rather than transmissible [
44], cross-links are essential for the emergence of novel knowledge via the collaborative process by enabling the combination of units of knowledge in new ways, to produce new meanings and a collective output that exceeds a mere aggregation of the collection of inputs by group members [
45]. Importantly, cross-links are not limited to concept-maps. They can take on different forms depending on the features of the discussion platform and the group’s discussion culture. Future work could further explore similar phenomena in other online settings such as forums and social media.
5. Conclusions
This work aimed to explore ways for describing collaborative concept maps in network terms and to examine some quantitative metrics for this purpose. This was done from a standpoint that collaborative knowledge construction is a complex, non-linear phenomenon that requires appropriate measures that can capture some of its most important attributes, and that these measures must be applicable at a scale. In that context, the work presented here offers a new, scalable approach for assessing the network qualities of concept maps created through large online collaborations.
The findings presented in this work imply that collaborative concept maps do vary on the measures that were considered. Based on this exploratory study, and building on the perception of the structure of the network as an indication of quality, we conclude that incorporating quantitative content network analyses in the assessment of large-scale online concept mapping discussions may be informative and provide insight towards the quality of a collaboratively constructed concept map, in terms of its structure.
The use of quantitative measures in the analysis of collaborative concept maps in educational settings can be applied for several purposes. Among these are following the progress of an ongoing collaborative concept-mapping discussion and identifying emergent themes and focal points, comparing the work of different groups with a focus on the collective product rather than on the sum of individual works, and assessing the quality of the group-work process over time in large, multi-located groups. Hopefully, this kind of insight could help educators who incorporate large scale discussions in their courses to form an idea of how well a class is doing on a collaborative task in terms of creating coherent, connected and organized knowledge.
From a theoretical viewpoint, this work has turned the spotlight to the key role of cross-links in the collaborative production of networked concept maps. Cross-links are fundamental to the idea of concept-mapping as originally proposed by Novak because they represent the forming of connections that reflect the learning taking place within the individual through the combination and the structuring of ideas. In a group, these connections are shared among members and are a central part of the collaborative learning process. In the transition from small, co-located groups to large, disperse, and asynchronous online collaborative discussions, our work demonstrates how the ability to share these connections as a part of the discussion, which creates the potential for a substantial impact on the produced map in terms of the complexity of its structure.
From a broader perspective, the approach presented here is inspired by work on individual cognitive systems and applied to the equivalent of a collective cognitive system [
13]. This direction can be further developed for the study of other processes at the collective content level.


