Article

European Union Innovation Efficiency Assessment Based on Data Envelopment Analysis

by
Meda Andrijauskiene
1,*,
Dimosthenis Ioannidis
2,
Daiva Dumciuviene
1,
Asimina Dimara
2,3,
Napoleon Bezas
2,
Alexios Papaioannou
2 and
Stelios Krinidis
2
1
School of Economics and Business, Kaunas University of Technology, LT-44029 Kaunas, Lithuania
2
Centre for Research and Technology (CERTH)—Hellas, Information Technologies Institute, 57001 Thessaloniki, Greece
3
Intelligent Systems Lab, Department of Cultural Technology and Communication, University of the Aegean, 81100 Mytilene, Greece
*
Author to whom correspondence should be addressed.
Economies 2023, 11(6), 163; https://doi.org/10.3390/economies11060163
Submission received: 25 April 2023 / Revised: 1 June 2023 / Accepted: 5 June 2023 / Published: 9 June 2023
(This article belongs to the Special Issue Innovation, Productivity and Economic Growth: New Insights)

Abstract

:
Though much attention is dedicated to the development of its research and innovation policy, the European Union constantly struggles to match the level of the strongest innovators in the world. Therefore, there is a necessity to analyze the individual efforts and conditions of the 27 member states that might determine their final innovative performance. The results of a scientific literature review showed that there is a growing interest in the usage of artificial intelligence when seeking to improve decision-making processes. Data envelopment analysis, as a branch of computational intelligence methods, has proved to be a reliable tool for innovation efficiency evaluation. Therefore, this paper aimed to apply DEA for the assessment of the European Union’s innovation efficiency from 2000 to 2020, when innovation was measured by patent, trademark, and design applications. The findings showed that the general EU innovation efficiency situation has improved over time, meaning that each programming period was more successful than the previous one. On the other hand, visible disparities were found across the member states, showing that Luxembourg is an absolute innovation efficiency leader, while Greece and Portugal achieved the lowest average efficiency scores. Both the application of the DEA method and the gathered results may act as viable guidelines on how to improve R&I policies and select future investment directions.

1. Introduction

Innovation is important for driving economic growth, creating jobs, advancing technology, and increasing international competitiveness. However, though the European Union (EU) regularly increases its budget for research and innovation (R&I) policy measures, the strongest global innovators, such as Australia, Canada, South Korea, and the United States, continue to have a performance advantage over the EU (European Commission 2022a). As the development of a country’s innovation capacity benefits from the improvement of its innovation efficiency (Erdin and Çağlar 2022), there is a necessity to evaluate the individual 27 member states’ capabilities to produce innovative outputs.
Innovation should be considered a dynamic phenomenon that is affected by socio-technical, socio-economic, and socio-political environments (Carayannis et al. 2016). According to Haefner et al. (2021), artificial intelligence (AI)-based methods can evaluate complex and changing situations. In addition, AI overcomes human limitations in information processing and is of great use in supporting such strategic planning tasks as priority setting and resource allocation and in determining directions to invest in (Gil et al. 2020). Scholars agree that data envelopment analysis (DEA), as a part of computational intelligence methods, has a full potential to work as a reliable tool for the assessment of innovation efficiency (Narayanan et al. 2022; Lee et al. 2019; Anderson and Stejskal 2019).
Though at first glance it might look that the subject of the EU innovation efficiency is explicitly covered, a systematic review of the usage of DEA in the analysis of innovation performance by Narayanan et al. (2022) proved that there is still room for future research. According to Narayanan et al. (2022), whose literature review was obtained from Google Scholar, Web of Science, and Scopus databases searched from 2010 to 2021, more attention to cross-country studies, especially with comparative analyses, should be given. Moreover, there is a necessity to evaluate whether the EU member states are able to use their capacities (including the incoming EU financial flows for research and innovation) in the most efficient way. Measuring the efficiency changes both in the matter of the member states and in a time frame is essential in this context.
Therefore, this study aimed to apply DEA for the assessment of the European Union’s innovation efficiency, taking three innovative outputs—patent, trademark, and design applications—into consideration. The paper is organized as follows: Section 2 provides an overview of the literature, Section 3 describes the methodology, i.e., the process of selecting the variables and choosing the empirical approach, Section 4 summarizes the results, Section 5 provides a discussion of the findings and a basis for future research, and Section 6 outlines the conclusions.

2. Literature Review

Data envelopment analysis works especially well in cases where investment policy decisions, both at the business and at the government levels, have to be made. For example, Li (2019) attempted to evaluate the green innovation efficiency of provincial industrial enterprises seeking to achieve sustainable economic development, and Zhu et al. (2021) assessed the situation in energy-intensive industries. Long et al. (2020) analyzed the Yangtze River Economic Belt (YREB) strategy for sustainable growth. They proposed a DEA model to measure the green innovation efficiency of 11 provinces and cities and empirically evaluated the influencing factors. One of the core results was that government financial support is among the leading forces that can enhance green technology innovation development in YREB cities. Fernández-Uclés et al. (2020) applied DEA to measure the economic efficiency of Tunisian olive oil firms and found the organizational and technological variables that are directly associated with greater efficiency.
If the European region is considered, there were multiple attempts to evaluate the efficiency of innovation by employing DEA (e.g., Kalapouti et al. 2020; Anderson and Stejskal 2019; Dzemydaitė et al. 2016; Juřičková et al. 2019; Xu et al. 2023; Gavurová et al. 2019). However, different angles of approach to the same object were chosen. For example, Xu et al. (2023), who investigated the sustainable innovation efficiency in EU regions, considered not only “traditional” indicators of innovation, but also the negative environmental outputs, such as carbon dioxide emissions. The results showed that the EU has visible regional differences in the context of sustainable innovation.
Kalapouti et al. (2020) and Anderson and Stejskal (2019) focused on the efficiency in the diffusion of innovation. Kalapouti et al. (2020) analyzed whether the EU regions could leverage their innovative capacity to absorb and simulate the knowledge diffused from their neighbors in the period of 1995–2006. Meanwhile, Anderson and Stejskal (2019) found that Sweden, though being the leader in innovative output, was the least efficient in diffusing innovation. Gavurová et al. (2019) used DEA to analyze the research and innovation potential of the EU28 countries during 2010–2015. The findings demonstrated that the most efficient countries were Bulgaria, Romania, Cyprus, Croatia, and the United Kingdom.
Finally, Dzemydaitė et al. (2016) and Juřičková et al. (2019) concentrated on the efficiency of the member states’ innovation systems. Dzemydaitė et al.’s (2016) findings showed that out of all analyzed Eastern and Central EU regions, the Baltic States had a relatively large portion of their population with tertiary education, yet this did not help in generating a significantly higher GDP per capita. The research by Juřičková et al. (2019), covering the period of 2005–2016, also obtained quite unusual results: Germany, the best EU performer in patent rankings, was classified as an inefficient unit with a 0.50 efficiency scale.
In regard to the assessment of the EU innovation policy measures, experts and scholars are using a variety of different methods. Surveys, interviews, and case studies are usually employed for gathering primary data, while statistical databases, e.g., Horizon 2020 monitoring data, OECD, or Eurostat, are the sources for secondary data (European Commission 2021). When the data have been collected, the official evaluations tend to employ such quantitative methods as econometric modelling (European Commission 2017, 2018), bibliometric analysis (European Commission 2017), or simple descriptive statistics (European Parliament 2018). However, the EU is seeking to enable the development and uptake of AI (European Commission 2022c) to improve the innovation policy evaluation processes.

3. Methodology

Having the above-described challenges in mind, data envelopment analysis was chosen as a core method to examine which EU member states use their own as well as EU R&I policy-added capacities in the most efficient way.

3.1. Selection of the Variables

The full definitions of the indicators and their sources may be found in Appendix A. To begin with, since this study took the EU context into account and the EU Framework Programs for Research and Innovation (FPs) are the most extensive scientific and technological programs in the world, one of the core variables was EU R&I investment (see Table A1). This variable covers the money flows to individual member states, channeled through the funds of the EU FPs, i.e., the 6th FP, the 7th FP, and the Horizon 2020.
Other input variables choices were based on the logic of the redeveloped national innovative capacity model (Andrijauskiene et al. 2021). The initial statistical data were updated for this research, considering the period from 2000 to 2020. The first dimension of common innovation infrastructure that was chosen reflects the nation’s background in public R&D, education, and ICT knowledge. Next, a cluster-specific environment for innovation describes the sectorial distribution in the country and its private sector contribution to R&D and non-R&D. To continue with, the dimension of quality of linkages includes venture capital that increases the ability to compete with the so-called ‘superstar firms’ and the capacity for collaboration between the public and private sectors. The fourth dimension considers international economic activities that are critical for knowledge spillovers. Following are diversity and equality as catalysts for the provision of complementary ideas that lead to the creation of new products and processes. As a better regulatory quality might target more efficient R&D projects and the inventor’s trust in the legal system is essential to incentivize innovation, the sixth dimension was legal and political strength. The last chosen dimension of input variables includes general socio-economic conditions that are reflected by GDP and the size of the labor force in a particular country.
The output variables’ side in this research consisted of patent, trademark, and design applications. Many scholars claim that a patent is the only evident indicator of inventive activity with a well-grounded universality (Foray and Hollanders 2015; Furman et al. 2002; Malik 2023; Zang et al. 2019). Patents reflect advancements in various fields, from pharmaceuticals and biotechnology to electronics and software. Tracking patent activity can provide insights into emerging trends, areas of research focus, and technological developments within industries (Law et al. 2018; Ryan and Schneider 2016; Varga and Sebestyén 2017). However, according to Martin (2016, p. 434), a certain type of innovations exists that “have been ignored or are essentially invisible in terms of conventional indicators.” This type is identified as ‘dark innovation’ or ‘hidden innovation’ and may include such examples as innovations based on design or branding. Trademarks, in general, are the most extensively used intellectual property (IP) rights across various economic sectors and firms (Castaldi 2018) but remain a much-undervalued type of IP in the empirical research of innovation (van den Besselaar et al. 2018).
Another much under-researched type of innovation is design. Product and industrial design typically involve significant levels of scientific input (Sunley et al. 2008). Yet, according to Apostolos et al. (2017), despite the growing recognition of this IP, only a few studies attempted to use this variable as an innovative output or to quantify its contribution to the performance of a company or to national economic growth. To sum up, three types of intellectual property rights (i.e., patent, trademark, and design applications) were chosen as output variables to obtain a more comprehensive view of a country’s innovation activity and to reflect both technological and non-technological innovation.

3.2. Correlation Analysis

In practice, a generic rule of thumb (n ≥ max {m × s, 3 × (m + s)}, where n is the number of decision-making units (DMUs), and m and s are the inputs and outputs, respectively)) was used to achieve a reasonable level of discrimination. In other words, a principle for DEA is that the number of DMUs has to be equal to or larger than the number of performance factors (Toloo et al. 2021). Therefore, a correlation test was firstly completed, seeking to (1) minimize the number of the initial input variables and (2) find the combinations of the variables that shared positive and relatively strong relationships so that they later could be included into DEA.
Pearson’s correlation coefficient was computed between each set of variables. Pearson’s correlation coefficient (Sotos et al. 2009), denoted by the letter r, is a score that calculates the strength of a linear relationship between two variables by dividing their covariance by the product of their standard deviations. Given a pair of random variables (x, y), the formula for r is:
r = ( x x ^ ) ( y y ^ ) ( x x ^ ) 2 ( y y ) 2
Pearson’s coefficient is based on two assumptions: first, that the variables have a normal or Gaussian distribution, and second, that the two variables under consideration have a linear relationship. It is a normalized measure of covariance, with the result always falling between −1 and 1. A coefficient of −1.0 represents a perfect negative correlation, while a coefficient of 1.0 reflects a perfect positive correlation. A coefficient of 0.0, on the other hand, indicates that there is no linear correlation between the variables.

3.3. Data Envelopment Analysis

DEA is a linear non-parametric method that is used to compare the relative efficiency of multiple similar instances or groups of decision-making units (DMUs) with multiple inputs and outputs (Cooper et al. 2007). The task of measuring efficiency in DEA consists of solving linear programming tasks for each of the instances which are under analysis. The procedure can be described by the following formula (Charnes–Cooper–Rhodes (CCR)):
M a x i m i z e h k = r = 1 s y r k u r i = 1 m x i k v i ,
w h e r e   r = 1 s y r j u r i = 1 m x i j v i 1 ,
a n d   j = 1,2 , j k , , n ,
u r ε ,   r = 1,2 , , s , v i ε ,   i = 1,2 , , m
u r ε ,   r = 1,2 , , s v i ε ,   i = 1,2 , , m
Here, h k is the relative efficiency of D M U k , v i is the weight given to input i , u r is the weight given to output r , y r j is the amount of output r from unit j , x i j is the amount of input i to unit j , n is the number of units or instances, s is the number of outputs, m is the number of inputs, and ε is a small positive value. The relative efficiency h k for each DMU based on the above conditions has to be smaller or equal to 1. When the maximum value h k of a unit k equals 1, efficiency has been achieved, meaning that D M U k is efficient relative to the other units in that case. On the other hand, h k < 1 means that D M U k is not efficient. Within DEA, different models can be applied, including the CCR, BCC (Banker–Charnes–Cooper), and SBM (Super-Efficiency-Based Measure) models. The CCR model assumes constant returns to scale (CRS) and is widely used due to its simplicity and computational efficiency. The BCC model allows for variable returns to scale and provides greater flexibility by accounting for variations in the scale of operations. The SBM model introduces the concept of super-efficiency and identifies a reference set of efficient DMUs. For this paper, the CCR-DEA was selected as it offers a significant advantage by eliminating the need for subjective weighting procedures when benchmarking comparable units and determining an overall performance score for a DMU (Egilmez and McAvoy 2013). Additionally, the CCR model allows for both input-oriented and output-oriented efficiency analysis. Unlike other methods, DEA does not rely on the decision-maker’s subjective judgment to assign weights to inputs and outputs. Instead, the weights are determined by the calculation model itself, ensuring that the DMU’s efficiency is always maximized (Fancello et al. 2020). This feature enhances the objectivity and fairness of the analysis by removing potential biases in the weighting process.

4. Results

This section presents and explains the results of the correlation and data envelopment analyses.

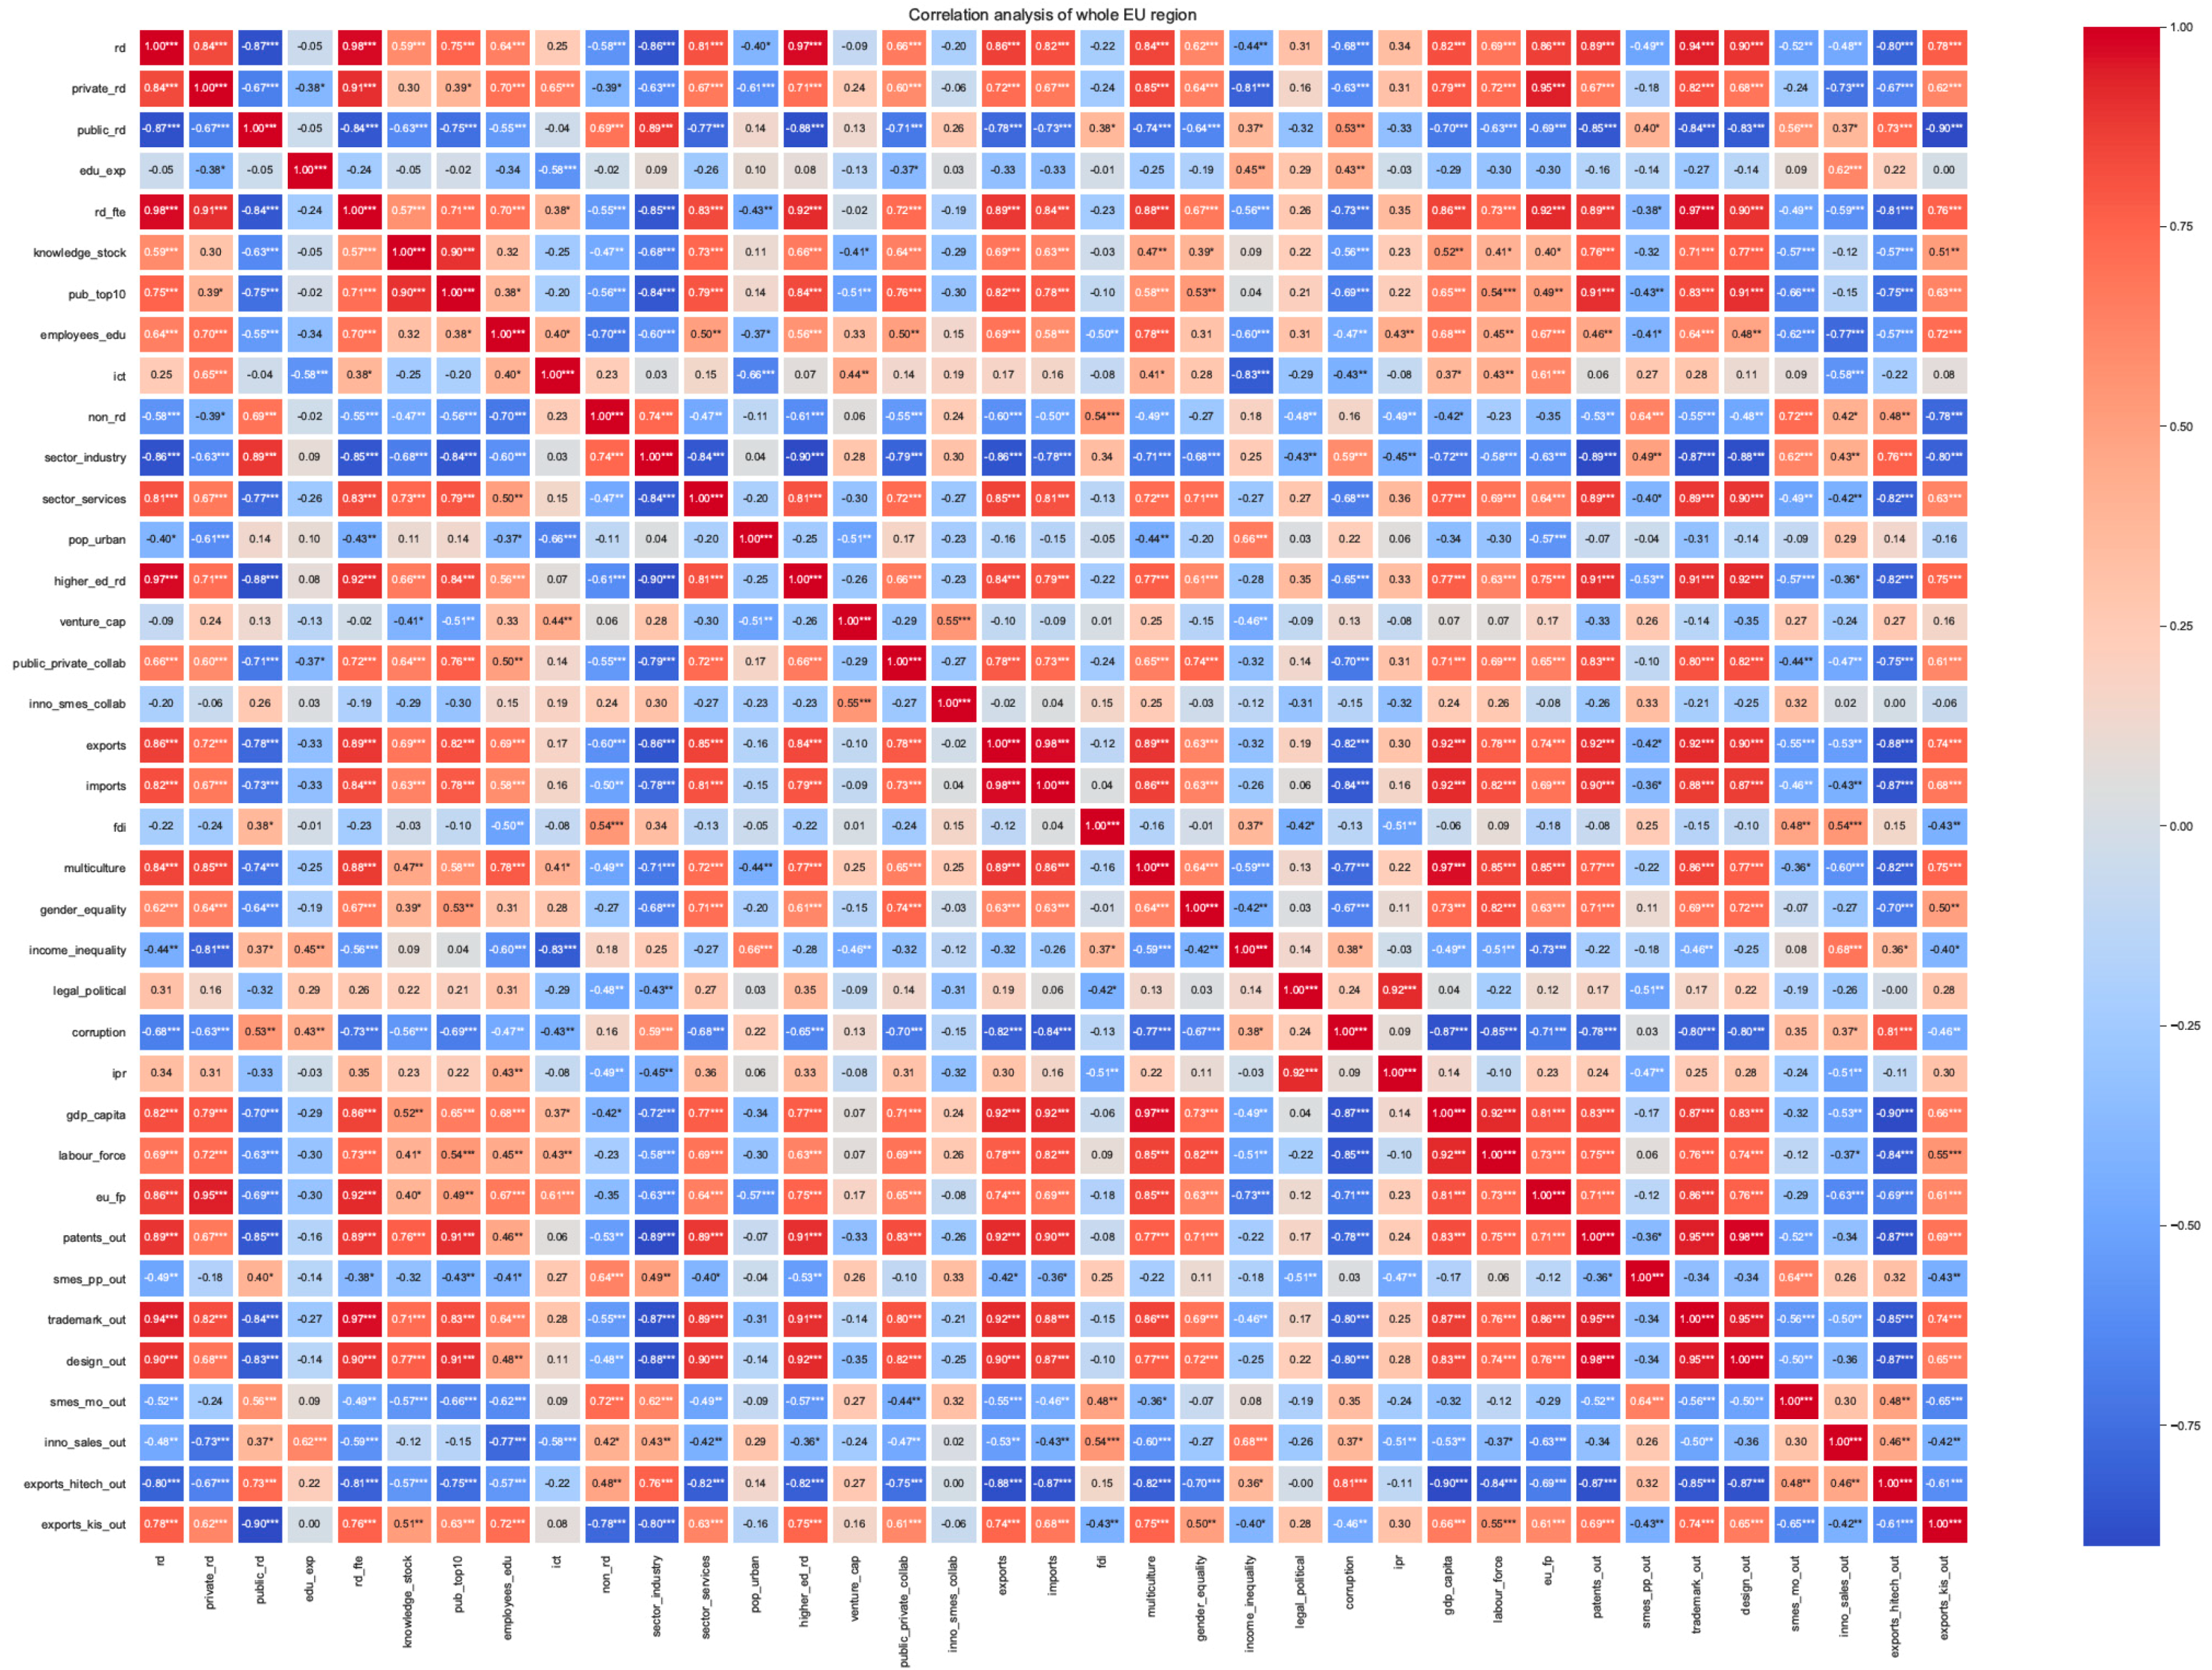
4.1. Findings of the Correlation Analysis

Figure 1 shows the statistically significant correlation between the input variables and the output variable “patents”. To begin with, EU R&I Framework programs’ financial flows had a positive relationship with the output (see eu_fp, correlation coef. 0.71). To continue, we observed a strong and positive relationship with the indicators of an open economy (i.e., exports and imports, coef. ≥ 0.9).
In addition, quite naturally, a number of R&D personnel (coef. 0.89), the share of scientific publications among the top 10% most cited publications worldwide (pub_top10, coef. 0.91), and the knowledge stock (coef. 0.76)—all representing a country’s common innovation infrastructure—as well showed a positive association with the output. The analysis proved that the number of patent applications is positively related to R&D investment in higher education (coef. 0.91) and private (coef. 0.67) sectors. Along with the already mentioned indicators, cultural diversity and gender equality are important factors when we talk about technological innovation (correlation coef. 0.77 and 0.71, respectively).
Continuing with the significant negative correlations, we observed the share of the industry sector (coef. −0.89, though this result can be explained by the positive correlation with the service sector (coef. 0.89)), a relatively inefficient public R&D investment (coef. −0.85), corruption (coef. −0.78), and non-R&D investment (coef. −0.53).
Figure 2 shows the statistically significant correlation between the input variables and the output variable “trademarks”. EU investment directed to research and innovation appeared to be positively and significantly related (coef. 0.86), indicating that it is even more crucial than in the case of patents. Other correlations found to be significant were with R&D personnel (coef. 0.97) and R&D investment, generally in a country (coef. 0.94) and both in the higher education and in private sectors (coef. 0.91 and 0.82, respectively). Exports (coef. 0.92) and imports (coef. 0.88) likewise seemed to be important variables. Having in mind that trademarks are more “soft” innovative output, also the result of the correlation with the services’ sector (coef. 0.89) appeared rational.
Figure 2 also indicates that public–private collaboration, expressed by public–private co-authored research publications, as well showed a significant strong positive correlation (coef. 0.80). Knowledge stock, which is usually described as a pool of a country’s knowledge, had a correlation coef. of 0.71. Other relevant input variables belonged to the section of general socio-economic conditions that are represented by GDP per capita (coef. 0.87) and the labor force (coef. 0.76). Similarly to the case of patents, cultural diversity as also revealed to have an important role (coef. 0.86). Finally, a moderate positive correlation was found between the trademarks and gender equality (coef. 0.69) and employees with tertiary education (coef. 0.64).
The variables of income inequality and corruption showed logical negative correlation outcomes (coef. −0.46 and −0.80, respectively). There was a similar observation for public R&D and the industry sector, as in the case of patents (coef. −0.84 and −0.87, respectively). However, quite surprisingly, non-R&D investment was also negatively related to trademarks (coef. −0.55), though it usually includes expenditures for such fields as market research and feasibility studies, customer surveys, or consultancy assignments that are inevitable in the process of development and application of a trademark.
Figure 3 shows the statistically significant correlation between the input variables and the output variable “designs”. Here, we saw a strong positive correlation (coef. 0.76) with the EU R&I investment. Going through the different sections of the national innovative capacity elements, it is visible that half of the variables that reflect the common innovation infrastructure were positively associated with the number of design applications (pub_top 10 (coef. 0.91), rd (coef. 0.90), rd_fte (coef. 0.90)), and knowledge stock (coef. 0.77)). Out of five cluster-specific environment variables, only two turned out to be significantly related to the output (sector_services (coef. 0.90) and private rd (coef. 0.68)). To continue, R&D investment in the higher education sector and public–private collaboration that represent the quality of linkages also turned out to be positively related with designs (coef. 0.92 and 0.82, respectively). Other significant correlations between the output and the inputs were found with international economic activities (exports (coef. 0.90) and imports (coef. 0.87)), multiculturalism (coef. 0.77), gender equality (coef. 0.72), and the general socio-economic environment (expressed by GDP per capita (coef. 0.83) and the size of the labor force (coef. 0.74)).
The results in Figure 3 also indicated that the intramural R&D investment in the public sector once again seemed to be ineffective in the process of innovation development (coef. −0.83), comparably to the case of patents and trademarks. Other significant strongly negative correlations between designs and input variables were determined with corruption (coef. −0.80) and the industry sector (coef. −0.88). Though moderate, a negative correlation was found with non-R&D investment (coef. −0.48). Besides the already mentioned financing types, non-R&D innovation investment also includes machinery, computer hardware and software, tooling up, design, and production engineering. Therefore, this result may be considered paradoxical because these processes are very important in design development and acquisition.

4.2. Findings of the Data Envelopment Analysis

There were three stages for variables to be included as inputs into the data envelopment analysis:
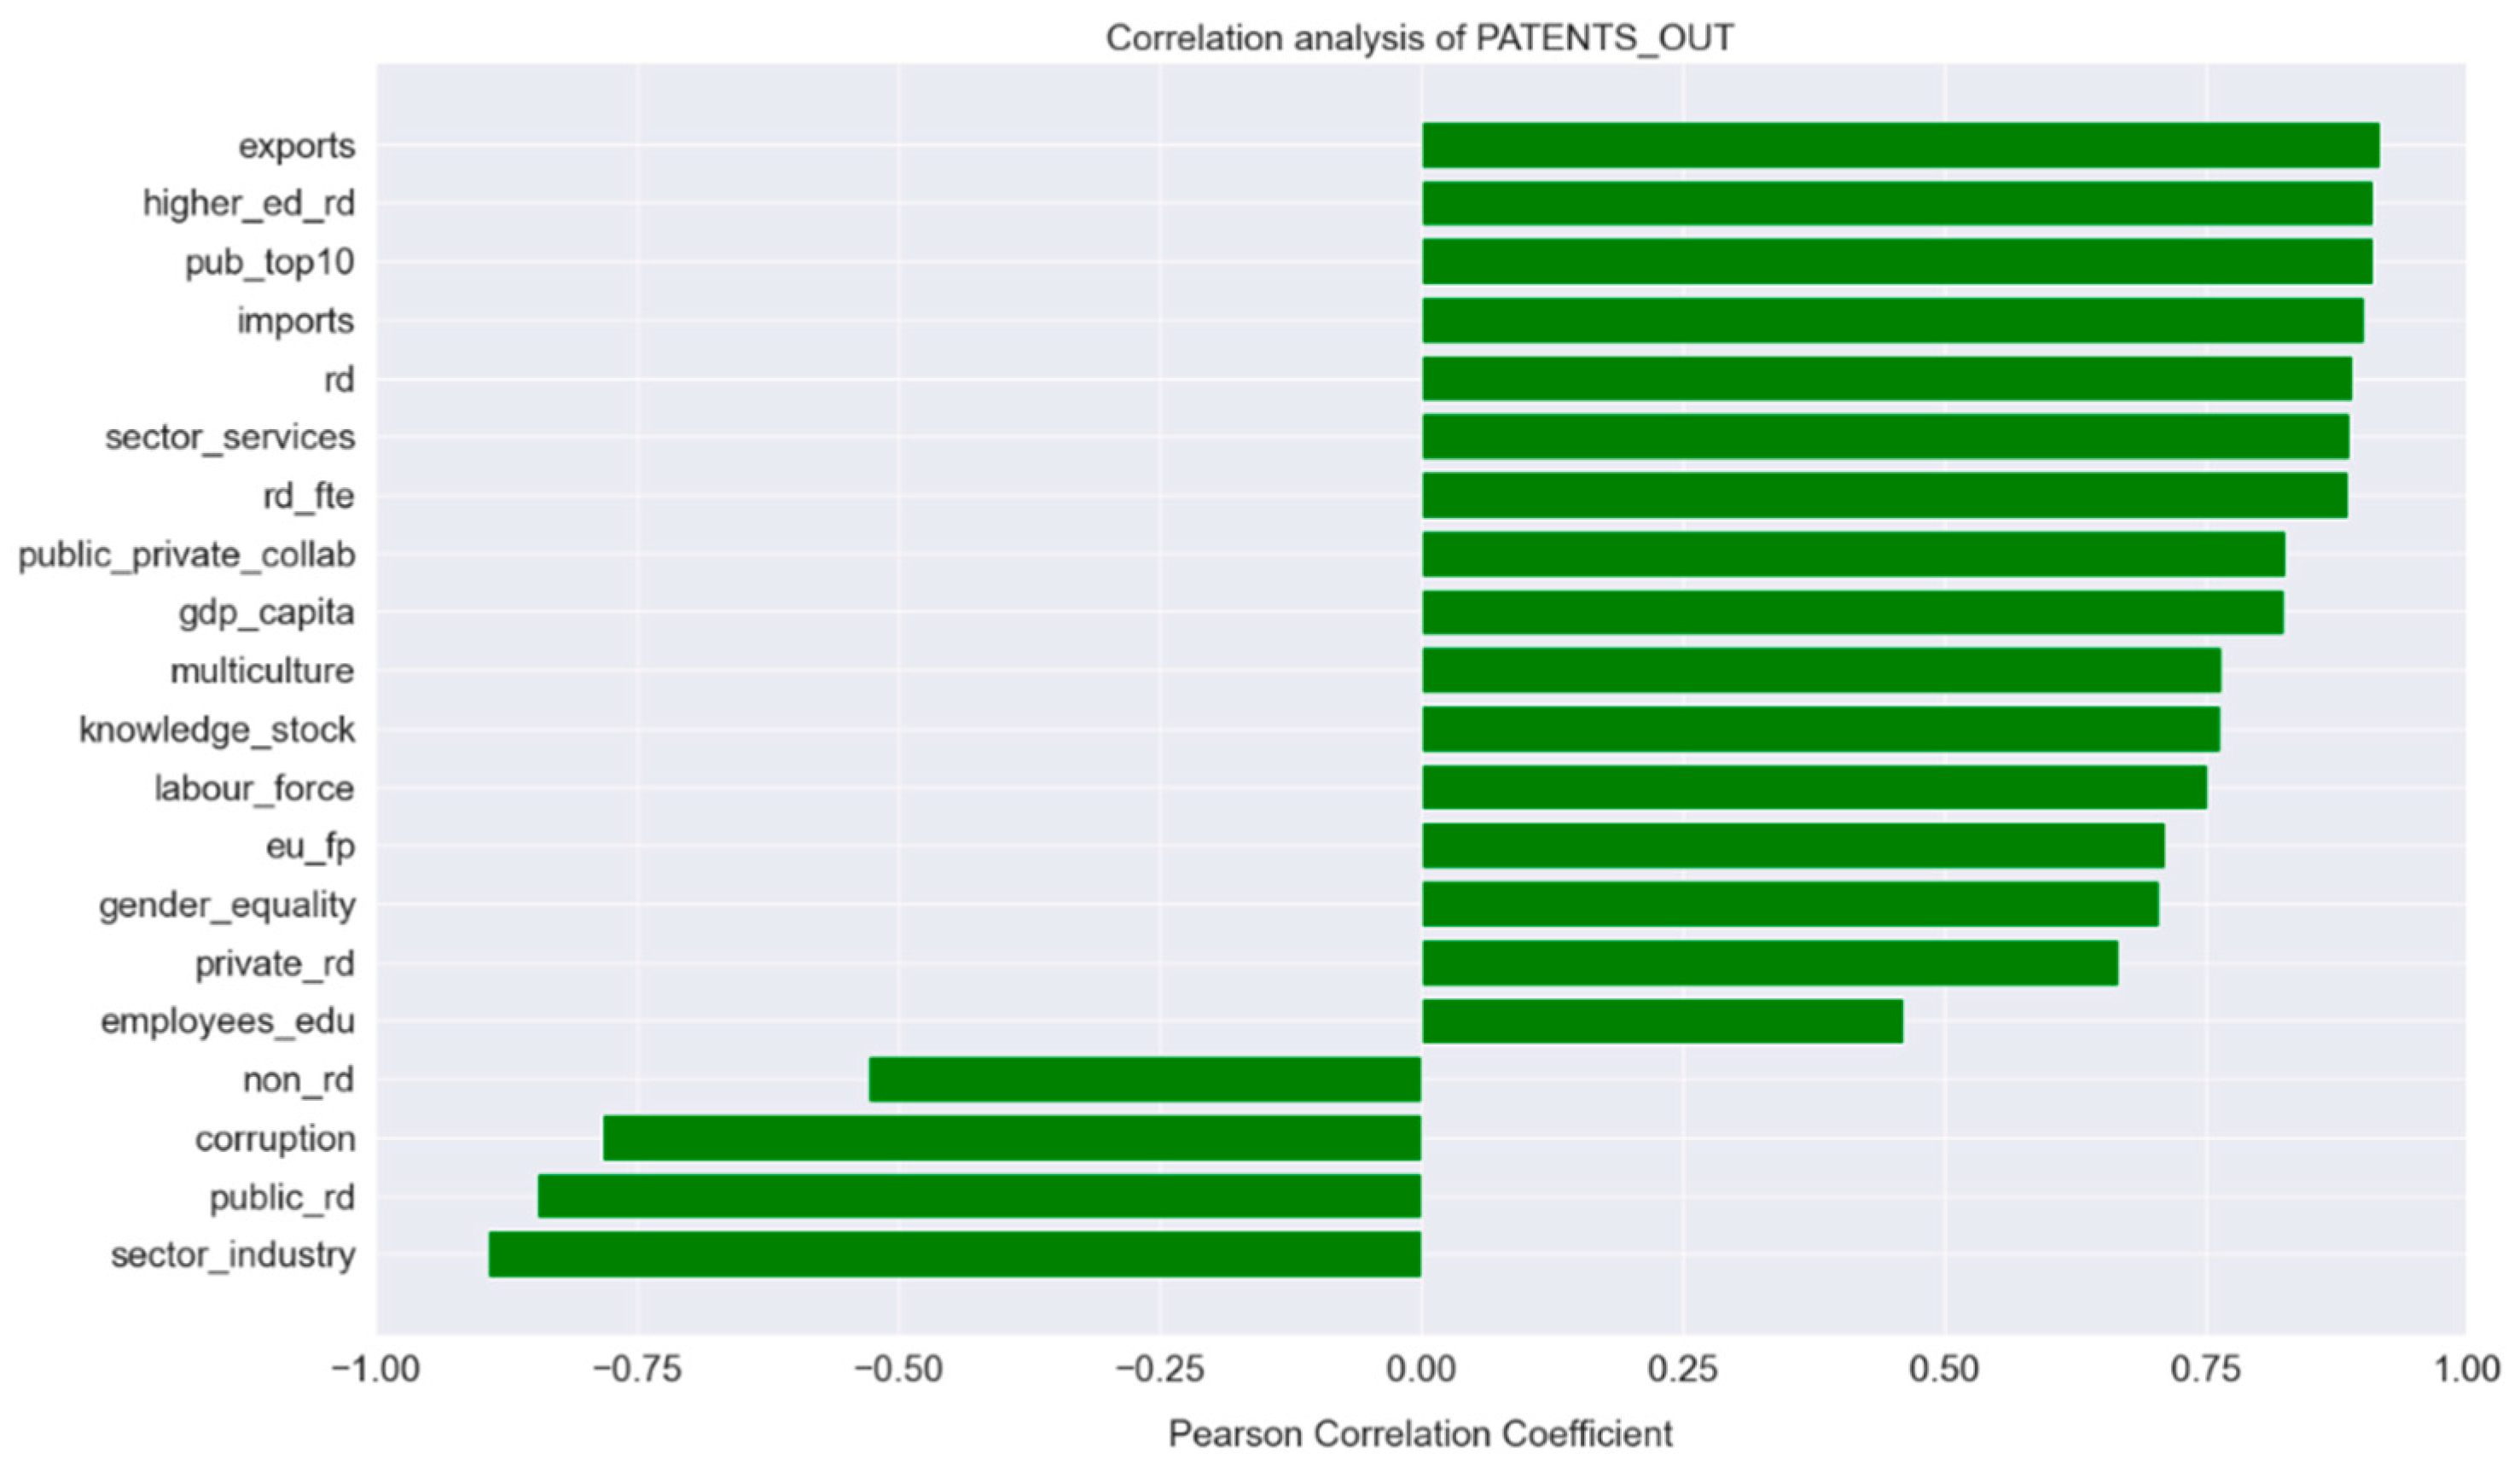
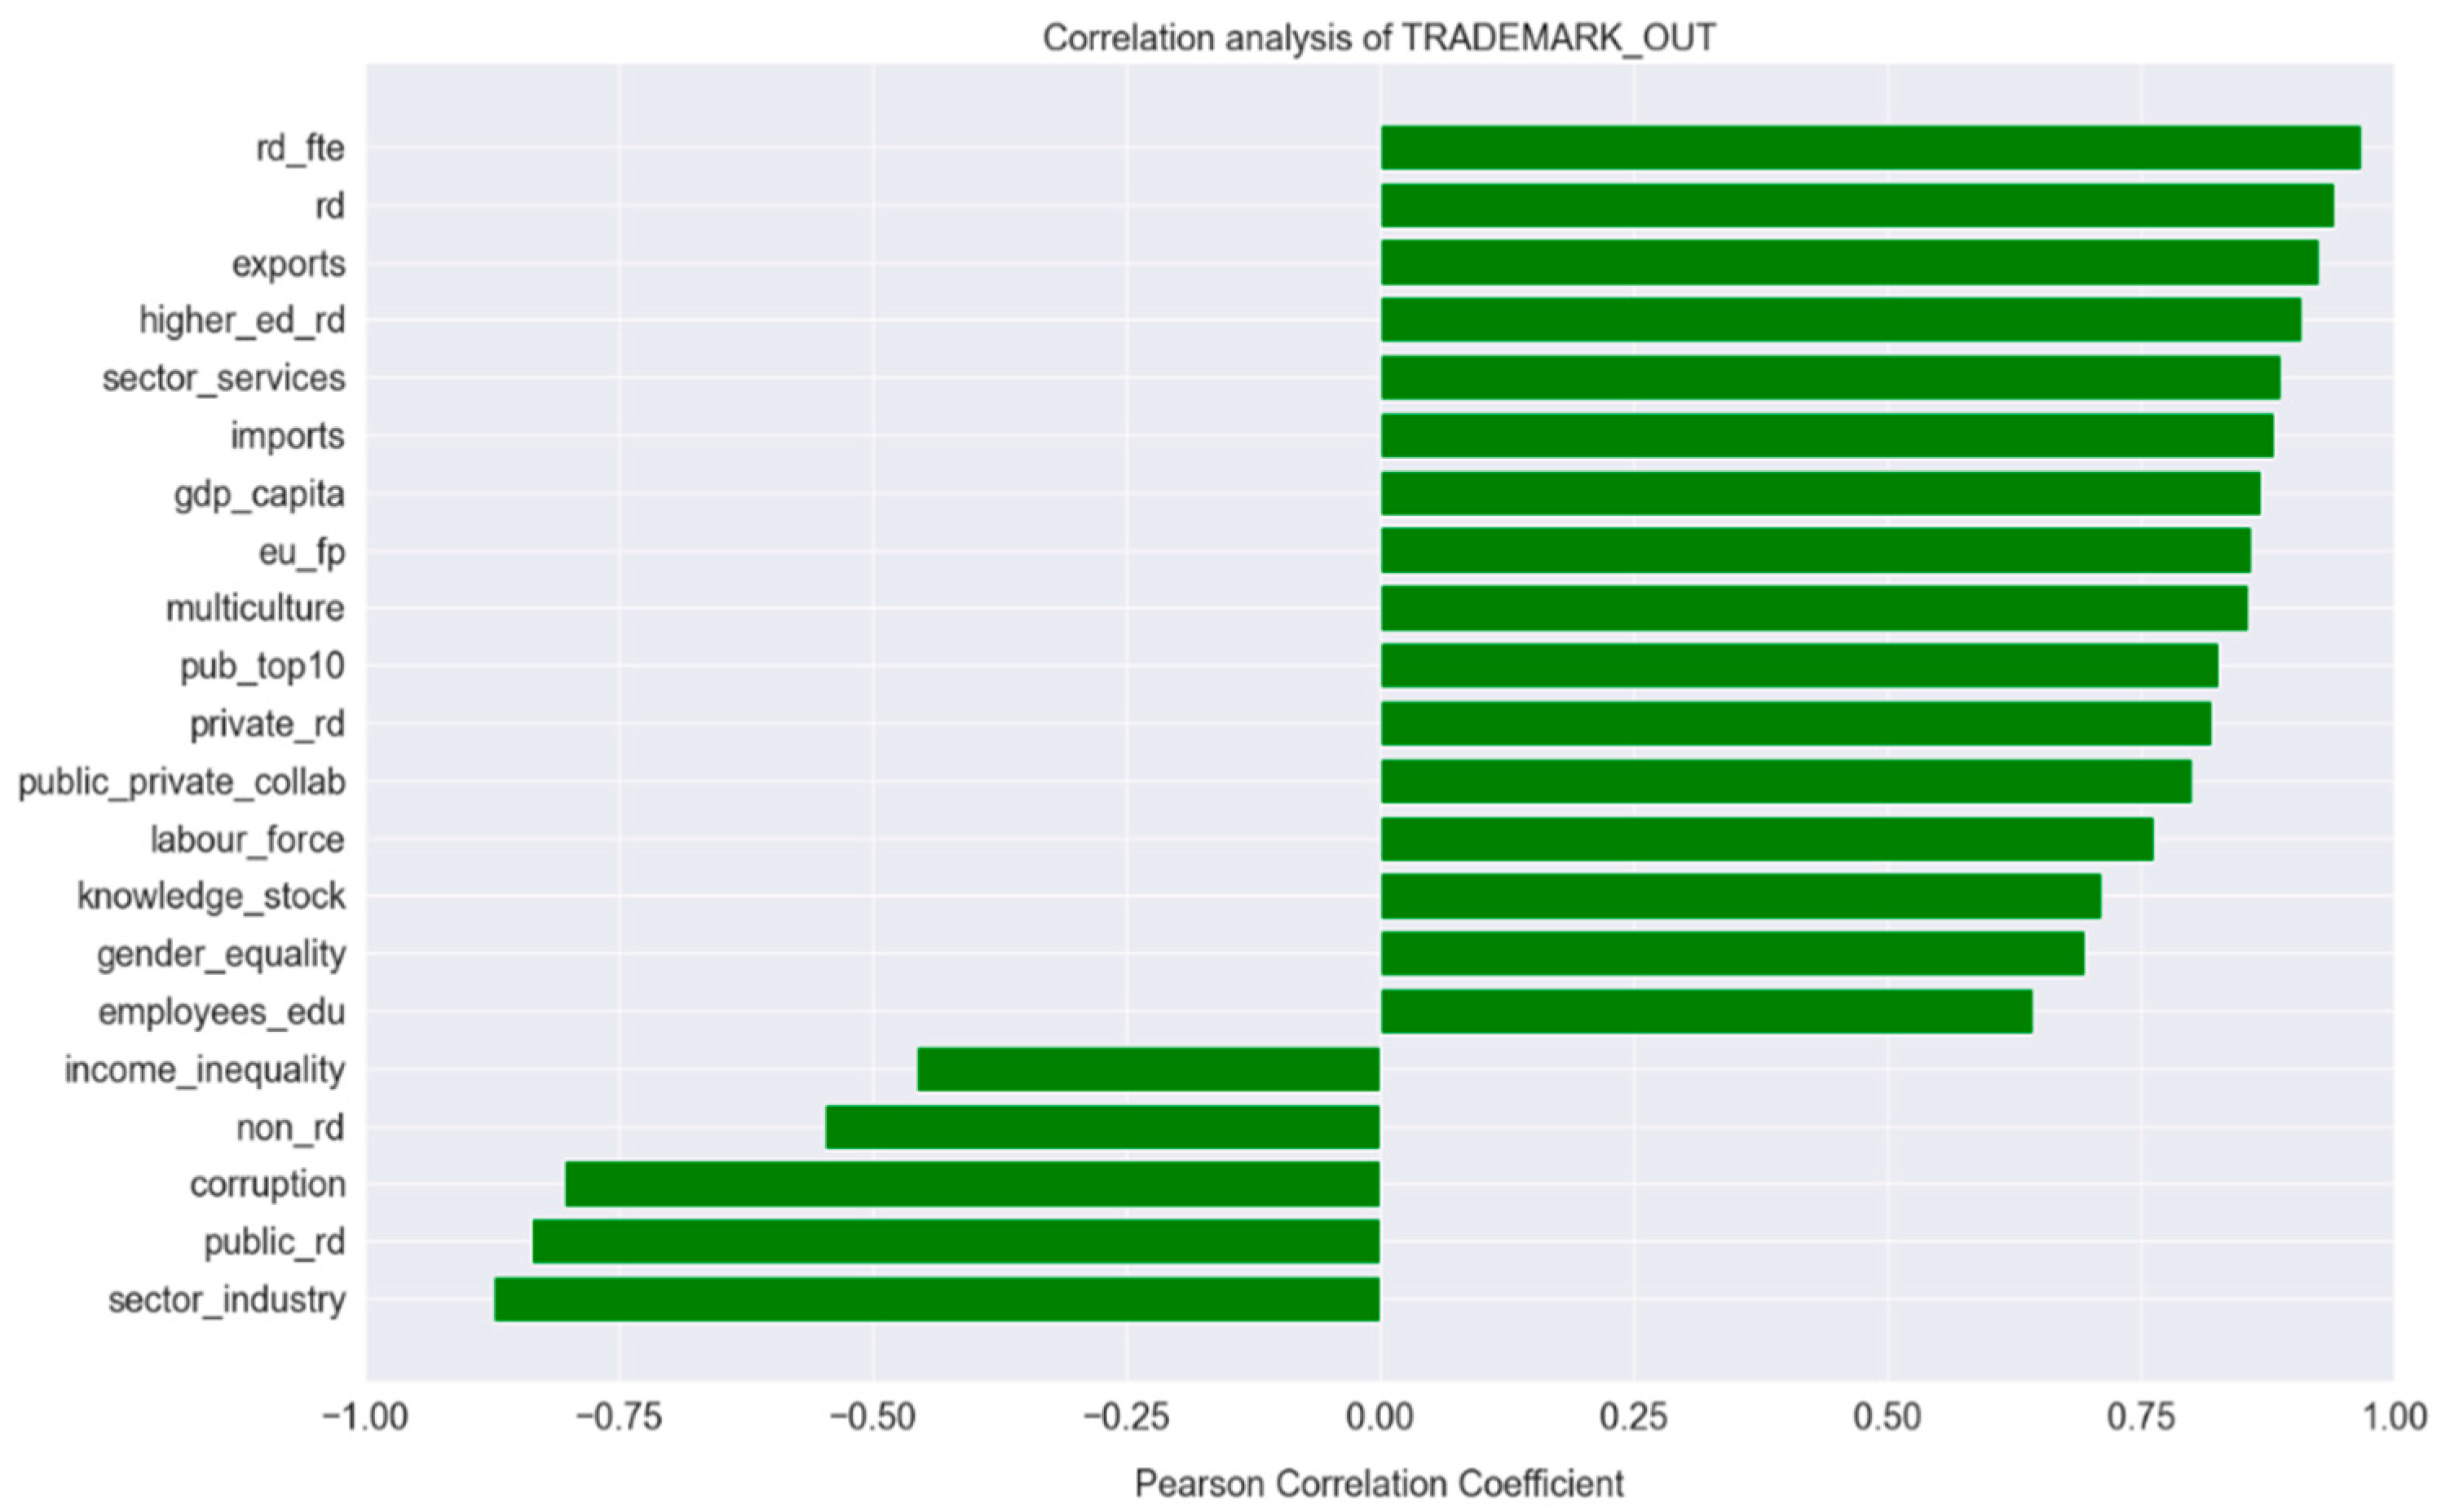
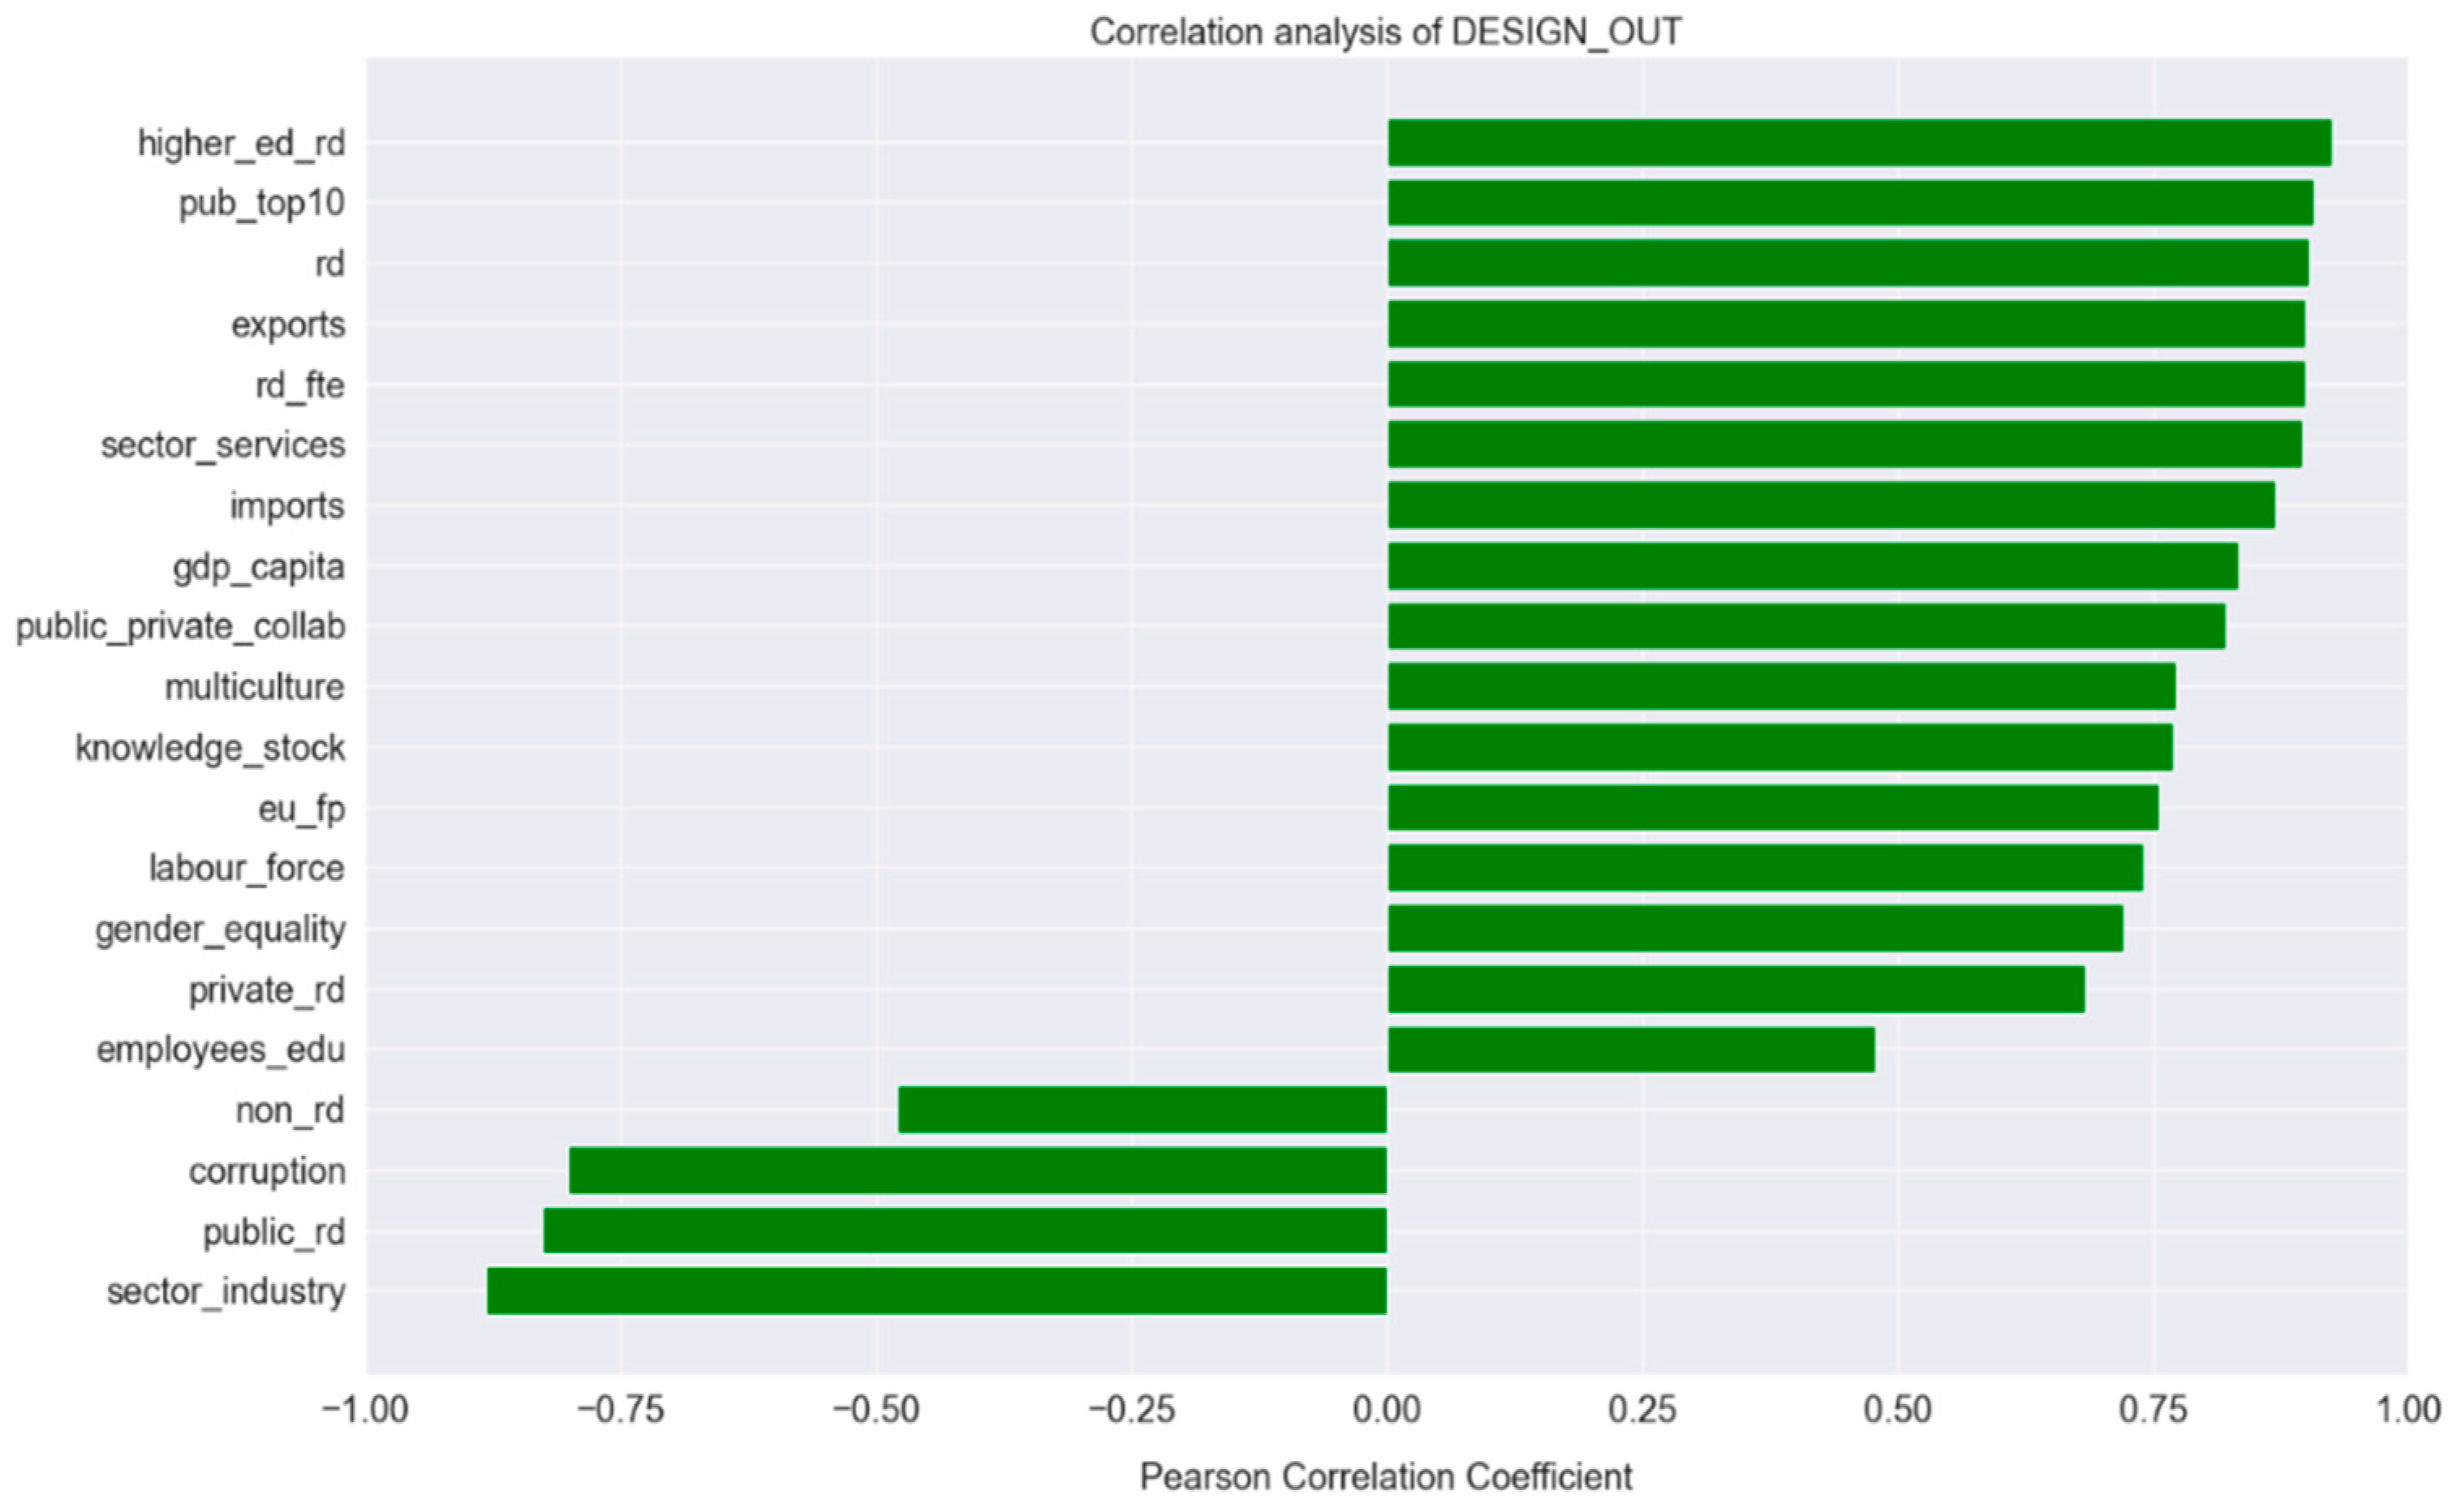
  • As DEA is based on the input–output logic, the input indicators that were negatively associated with the outputs were not included in the further investigation (e.g., in the case of design applications, these were intramural R&D investment in the public sector (coef. −0.83), corruption (coef. −0.80), the share of the industry sector (coef. −0.88), and non-R&D investment (coef. −0.48)).
  • There had to be a statistically significant positive relationship of a coef. > 0.5 with the output variable (i.e., (1) patents, (2) trademarks, and (3) designs)), e.g., in the patents’ case, employees_edu, non_rd, corruption, public_rd, and sector_industry were omitted from the analysis (see Section 4.1. for more information).
  • If any multicollinearity (coef. > 0.9) between the input variables was captured, the input variable with the weaker relationship with the output variable was excluded from the later analysis (see the extended correlation results in Appendix B).
As Figure 4 shows, the inputs for DEA represented different national innovative capacity elements as well as EU R&I investment. The output represented three distinct types of innovation, namely, patents, trademarks, and design. Since most of the results of R&I activities can only be captured in the longer term, a time lag of +1 year was used for the outputs. It is important to emphasize that the data of applications for IPR were chosen instead of granted IPR, since they provide a timelier account of innovative activity (Schneider 2005) and are entirely suitable for cross-country comparative econometric analysie (Rodríguez-Pose and Wilkie 2019).
The next sub-sections provide an overview of the outcomes of the DEA method application. A relative efficiency of 1 indicated that efficiency was achieved, while relative efficiency of less than 1 indicated that DMU was inefficient, as explained in Section 3.3. Moreover, the variable with the highest efficiency value could be used as a reference to evaluate the efficiency of the other variables and to set targets for the enhancement of the performance of the other variables.

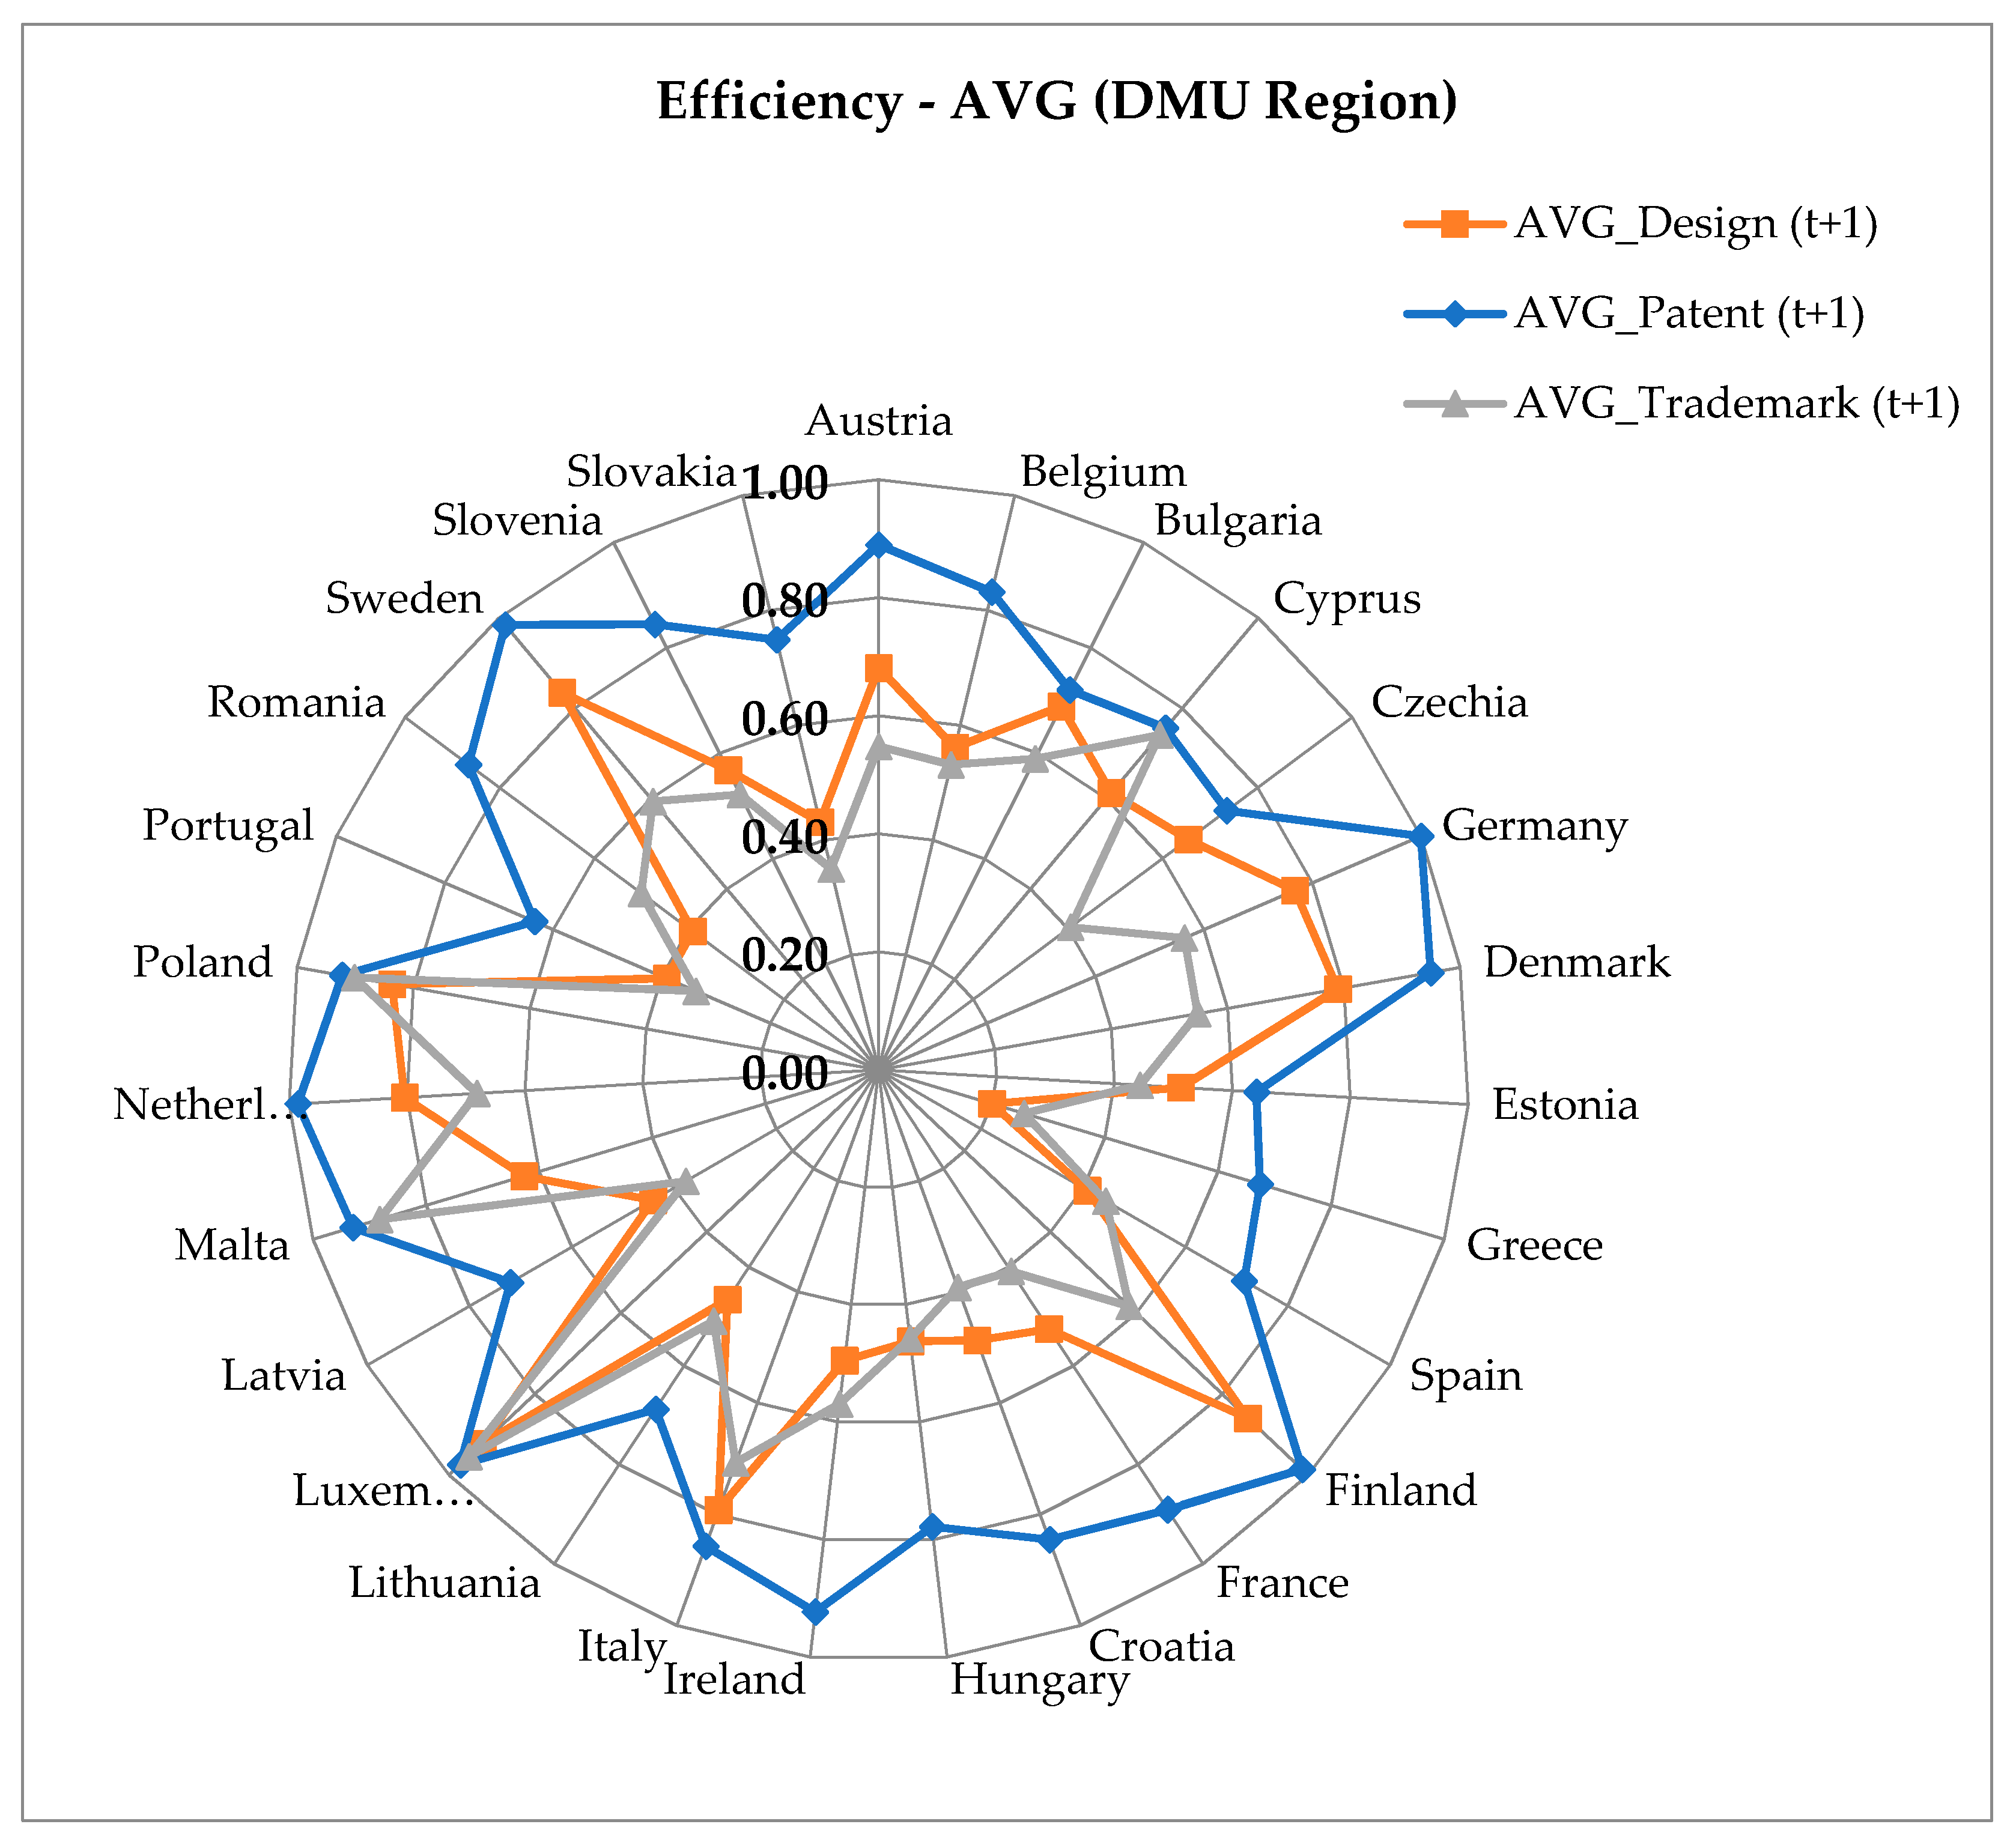
4.2.1. EU Innovation Efficiency across the Member States

Figure 5 illustrates the results of the application of the DEA method using member states (regions) as decision-making units (DMU). In general, it can be stated that the member states used their own capacities as well as EU R&I investment most efficiently for the development of patents (average efficiency level (AEL) 0.83)), while the situation was worse in the case of designs (AEL 0.60) and trademarks (AEL 0.55). In addition to this, major differences were observed in the levels of efficiency across the individual countries: for example, if we considered all three analyzed outputs (i.e., patents, trademarks, and designs), Luxembourg appeared as an absolute efficiency leader. On the contrary, so-called red flags had to be assigned to Greece and Portugal, where the average efficiency levels were the lowest across the whole European Union.
If the outputs were investigated separately, the results in Figure 5 showed that Luxembourg (AEL 0.92), Finland (AEL 0.86), Poland (AEL 0.84), Sweden (AEL 0.83), and the Netherlands (AEL 0.80) managed to achieve the highest average efficiency results in the context of patents. Differently, the least efficient member states were Slovakia (AEL 0.43), Spain (AEL 0.41), Romania (AEL 0.39), Portugal (AEL 0.39), and Greece (AEL 0.20).
Considering the efficiency in using innovative capacity to attain higher numbers of patent applications, the most achieving “players” were Germany (AEL 0.99), Finland (AEL 0.99), the Netherlands (AEL 0.98), Sweden (AEL 0.98), and Luxembourg (AEL 0.97). Countries with the lowest scores were Spain (AEL 0.71), Lithuania (AEL 0.69), Greece (AEL 0.67), Estonia (AEL 0.64), and Portugal (AEL 0.63).
Finally, when analyzing trademark applications, the highest efficiency levels were observed for Luxembourg (AEL 0.95), Poland (AEL 0.90), Malta (AEL 0.88), Cyprus (AEL 0.74), and Italy (AEL 0.71). The bottom five countries were Croatia (AEL 0.39), Latvia (AEL 0.38), Slovakia (AEL 0.35), Portugal (AEL 0.34), and Greece (AEL 0.26).
Experiments were conducted using different models of DEA, including CCR-DEA, BCC-DEA, and SBM-DEA, to check the robustness of the findings. The obtained results from the CCR, BCC, and SBM DEA models are presented in Table 1. When comparing the efficiency scores obtained from these different models, it is important to consider the underlying assumptions and characteristics of each model. The CCR (Charnes–Cooper–Rhodes) model tends to yield higher efficiency scores compared to the BCC (Banker–Charnes–Cooper) and the SBM (Slacks-Based Measure) models. This is primarily because the CCR model assumes constant returns to scale (CRS) and does not consider scale efficiency. By assuming CRS, the CCR model allows for potential scale advantages, resulting in higher efficiency scores.
On the other hand, the BCC and SBM models offer a more comprehensive analysis by considering both technical efficiency and scale efficiency. These models take into account the possibility of variable returns to scale (VRS) and evaluate the performance of each decision-making unit in terms of both utilizing inputs efficiently and operating at an optimal scale. This more comprehensive analysis can potentially lead to lower efficiency scores compared to the CCR model.
Despite the differences in assumptions and considerations, it can be observed that all three models led to similar results. This suggests the robustness of the selected model in capturing the performance and efficiency of the decision-making units under evaluation. The similarity in results indicated that the efficiency scores obtained from these models were in agreement, providing a consistent evaluation of the decision-making units. Therefore, the comparable results across the CCR, BCC, and SBM models highlighted the robustness and reliability of the selected model in assessing the efficiency of the evaluated units.

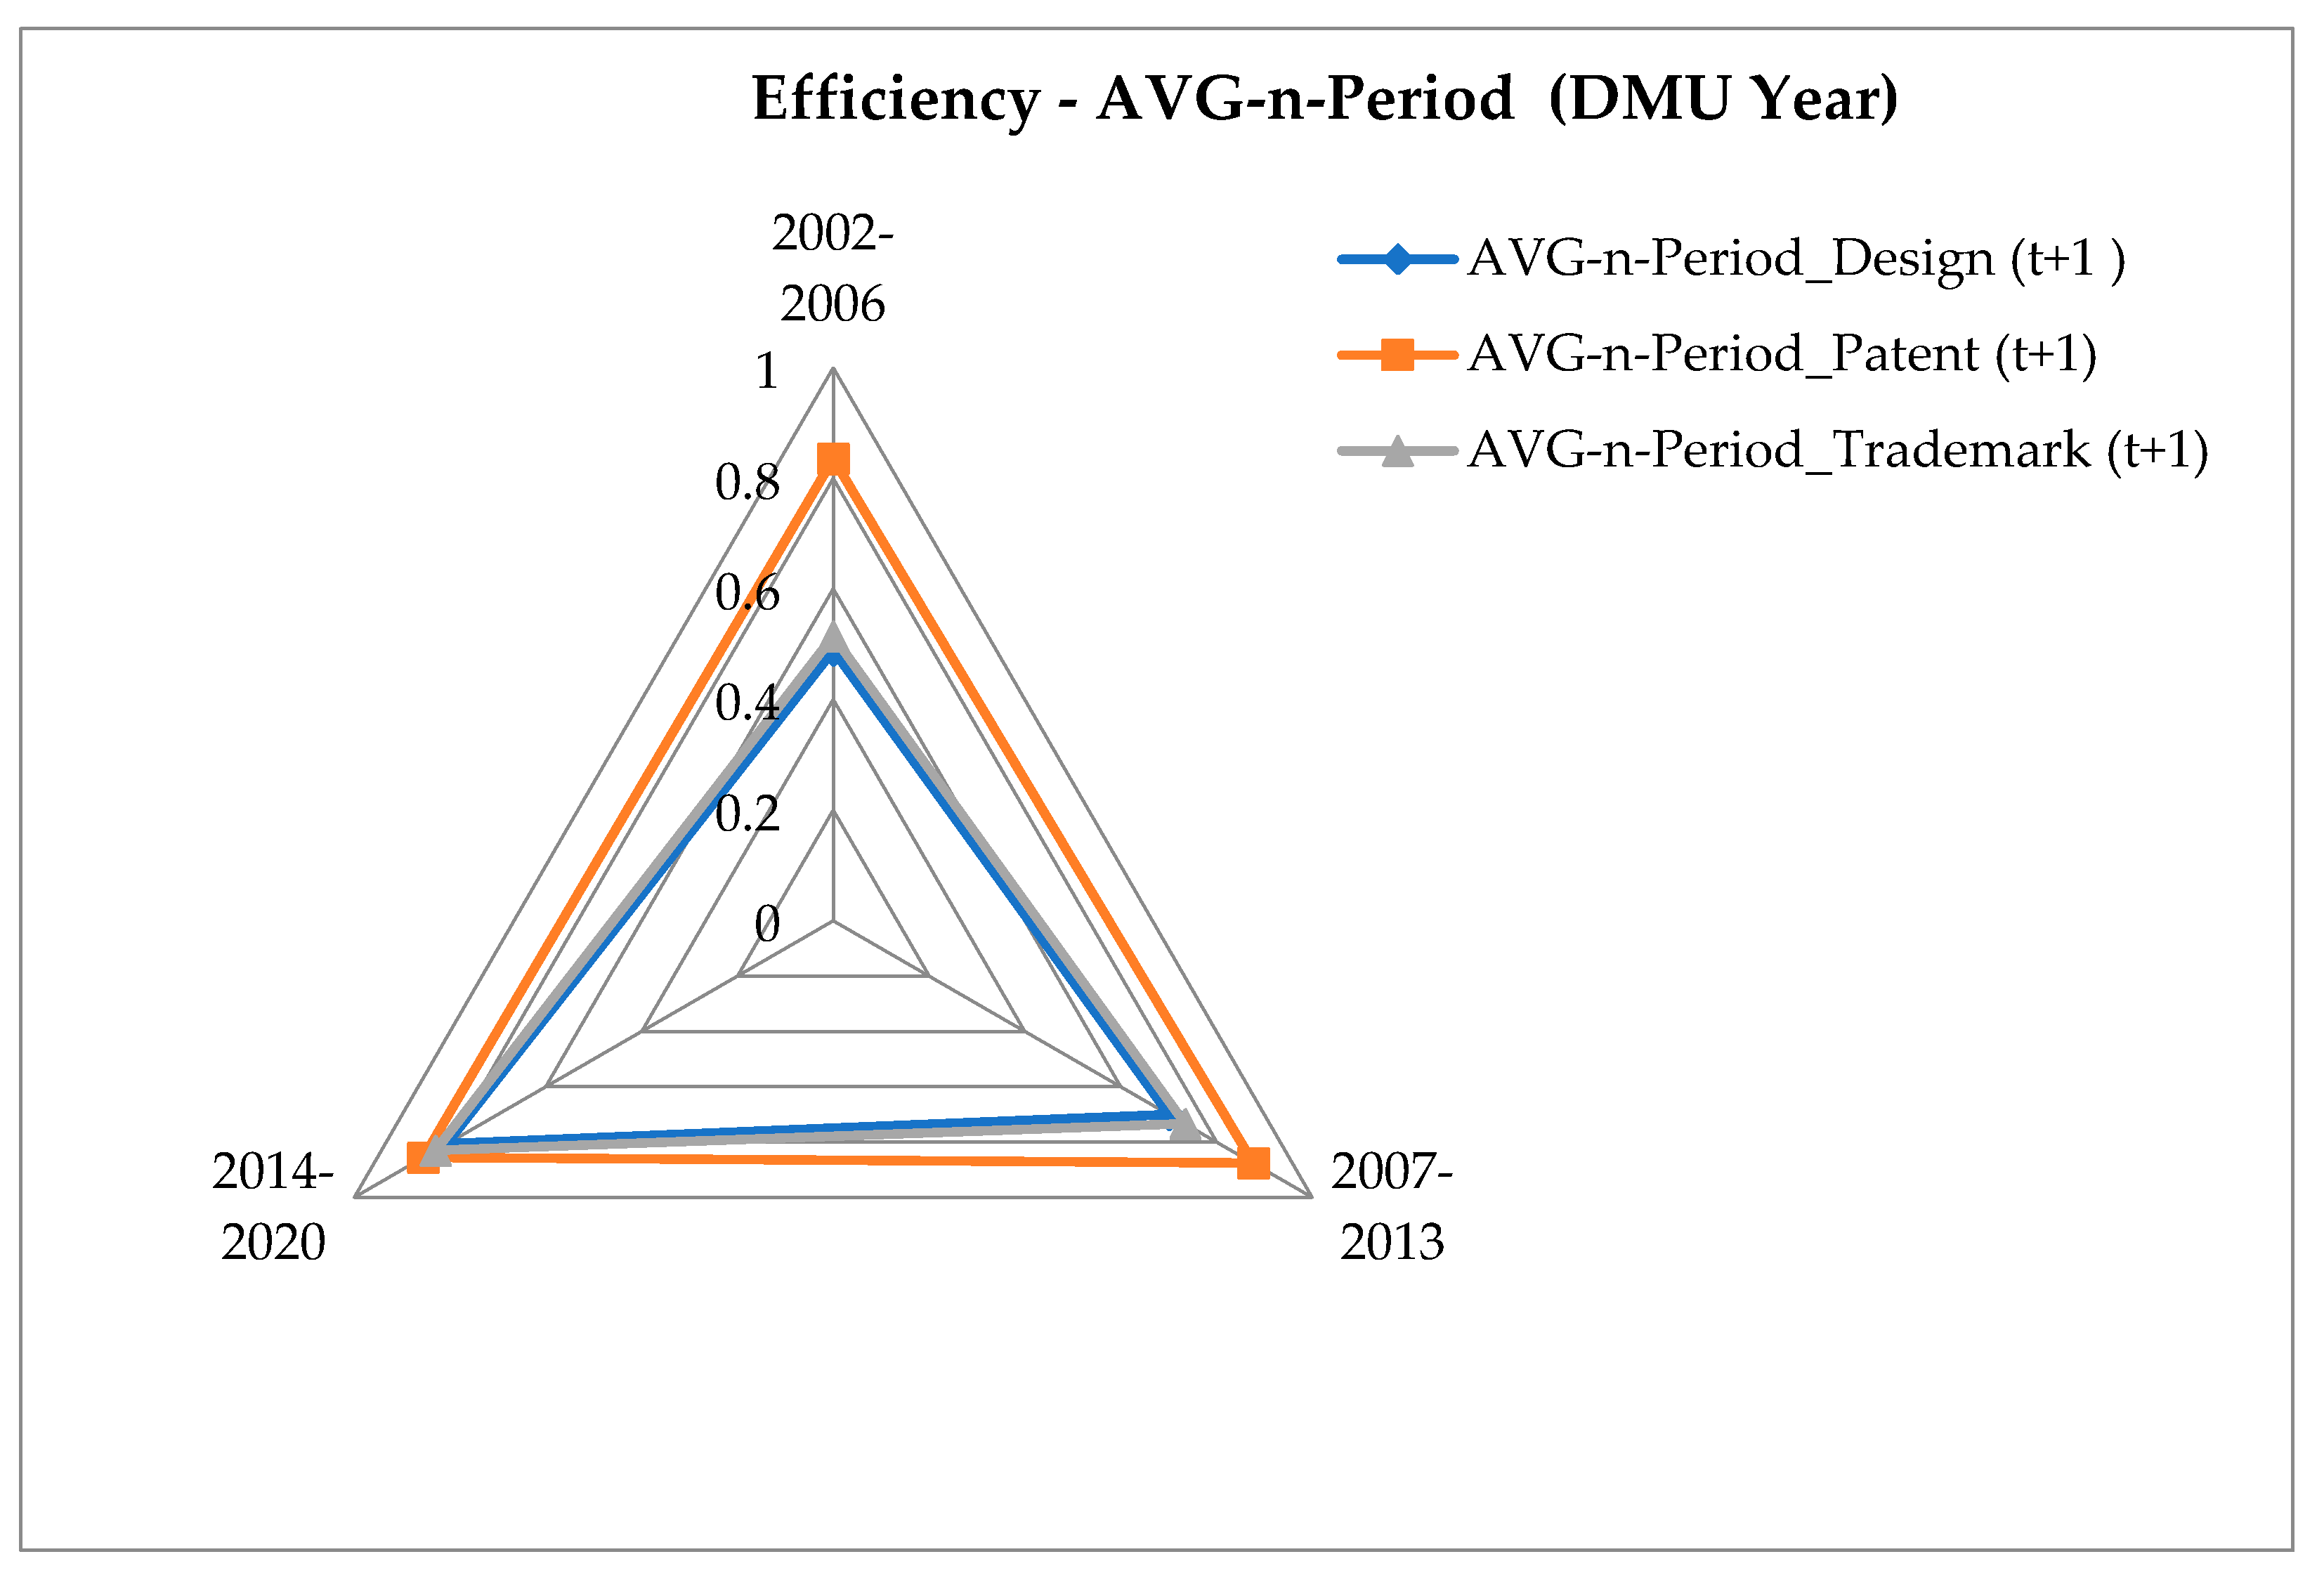
4.2.2. EU Innovation Efficiency throughout the Programming Periods

Figure 6 represents the situation during each programming period, including 2002–2006, 2007–2013, and 2014–2020 (full results over the years are presented in Appendix C).
The general state of efficiency assessing patent applications can be considered very good (86%) and did not vary much over time. During the years of the last analyzed framework program (2014–2020), it reached 88%. In the context of EU investment, these results may not be very surprising because the EU R&I policy was always much oriented toward technological innovation. An especially useful pointer for European Union policy-makers is that the recent substantial focus on non-technological innovation has “paid off”, since each programming period was more and more advantageous in terms of trademark and design applications. Regarding trademarks, the average efficiency level in the first FP was 51% and reached 83% in the last analyzed FP. Likewise, for design applications, it was 49% in 2002–2006 and 81% in 2014–2020.
To conclude the findings of the DEA application in the context of EU innovation efficiency, it can be claimed that the situation has improved over time, meaning that each programming period was more successful than the previous one. On the other hand, we found visible disparities across the member states, which requires a special attention by policymakers.

5. Discussion

The EU is a large and diverse economic and political unit, with many different countries and cultures. Therefore, it is a “relative utopia” to coordinate and successfully implement unified policies to promote innovation. Naturally, the national backgrounds and abilities to use internal assets in the most competent way play a vital role here. Our analysis showed that Greece and Portugal were the least efficient when considering all three output indicators.
Though direct comparisons were not possible because of the distinct choices of variables and methods, the results of multiple research articles also showed that Greece stood in the last rows in innovation efficiency rankings. For example, Erdin and Çağlar (2022) and Feng et al. (2021) showed that Greece’s performance in using innovation resources efficiently to generate innovation outputs was below the average. Kanellopoulos and Tsekouras (2023), who analyzed the micro level and the dataset of 1274 innovative manufacturing firms, found that Greek companies could produce the same innovation outputs using significantly fewer innovation resources. To be precise, Aytekin et al. (2022) estimated that Greece lacks knowledge, technology, and creative output and should be able to produce 3.14% more outputs with the current input levels. According to the authors, Greece should take Italy, Montenegro, Serbia, and Turkey as effective role models in this case.
Portugal is as well quite often identified as a country that is lagging behind in the context of innovation efficiency. The research by Faria et al. (2020), who employed data from 206 European regions and applied a stochastic production frontier methodology, demonstrated that all Portuguese regional innovation systems (except Lisbon’s) performed slightly below the average of their EU counterparts. Similarly, studies by Liu et al. (2019) and Feng et al. (2021) highlighted that Portugal’s innovation efficiency values are below the EU average.
Feng et al. (2021) assumed that since Portugal and Greece are located in southern Europe, this relatively low performance might be linked to issues of economic development (e.g., the tiny scale of the industry and the backward technology). Other factors may include absorptive capacity, collaboration, and networking. Particularly, Kontolaimou et al. (2016) findings revealed the existence of constraints in knowledge flows from the European metafrontier (such as Austria, Denmark, Germany, or Iceland) to group-specific frontiers. Other factors that might distort the final results could be related to such challenges as bureaucracy or corruption. When corruption becomes perceived as the norm, individuals become less inclined to combat it, leading to its easier proliferation within the society (Wawrosz 2019). Therefore, corruption weakens the trust of innovators in the legal system (Dincer 2019) and undermines the foundational pillars of the governing institutions that are essential for fostering increased levels of innovative activity. To be specific, Portugal ranked 33rd, and Greece was 51st among 180 countries for the corruption perception index, in relation to which, the country ranked first is perceived to have the most honest public sector (Transparency International 2022).
Without a doubt, the results of this paper provide a basis for future research. It would be relevant to investigate the situation at a member state level and to create individual profiles that would help find the underlying reasons for the currently gathered average efficiency results. Such methods as Bayesian neural network, fuzzy-set qualitative comparative analysis, self-organizing neural maps, and multi-output neural networks can also be well applicable to that case. Bacon et al. (2019), for instance, suggested a machine learning (ML) approach for national innovation performance data analysis. They used a Bayesian neural network for decomposing and predicting the innovation output. The results showed that the ML method is extremely useful to identify the key determinants of innovative output and evaluate the long-term effects of particular factors, such as R&I investment. Proksch et al. (2017), on the other hand, applied a fuzzy-set qualitative comparative analysis to 17 European countries and identified different strategies that might lead to a high national innovative capacity (NIC) by combining certain determinants (e.g., Italy and Spain lacked private R&D funding).
All in all, it is obvious that the designing process of the specific computational intelligence-based instruments for innovation efficiency evaluation should be continued. It would help in overcoming such methodological challenges as attribution/contribution problems (innovations are developed in the context of a broader environment which also influences the final R&I results) and big amounts of data (problems that are difficult to handle by manpower might be solved).

6. Conclusions

Enhancing innovation efficiency should be a priority for the EU to increase its global competitiveness. Therefore, this paper aimed to evaluate whether the EU member states are using their capacities, including the incoming EU financial flows for R&I, in the most efficient way. The efficiency changes were also assessed in a time frame.
To begin with, the study incorporated the EU R&I investment in the context of other important national innovative capacity input indicators (see Appendix A and Appendix B). To capture a more comprehensive and nuanced view of innovation performance, both technological and non-technological indicators were employed (i.e., patent, trademark, and design applications). Afterward, correlation analysis and data envelopment analysis were used to provide scientifically justified results.
Statistical correlations between the selected variables were determined to measure the strength of the relationship between them. Certain correlation findings indicated that EU R&I investment has a positive relationship with all three analyzed output variables—patent, trademark, and design applications. Patents were most positively associated with exports, R&D expenditures in the higher education sector, and high-quality journal publications. Besides EU investment, the trademarks’ variable showed the greatest correlation with R&D personnel, general intramural R&D expenditures, and exports. Design applications had the strongest relationship with R&D expenditures in the higher education sector. However, all three output variables were negatively associated with the share of the industrial sector in the country, corruption, non-R&D expenditures, as well as R&D expenditures in the public sector.
The correlation results were used as a basis to perform the data envelopment analysis, excluding variables that had a low association with the tested output variables and those that had multicollinearity. DEA revealed that the EU member states leverage their innovative capacities for patent development most effectively, whilst not so much for trademarks and designs. The country that is the most efficient in the development of all three analyzed types of innovation—patent, trademark, and design applications—is Luxemburg. On the contrary, Greece and Portugal seemed to be the least efficient in exploiting their own capabilities as well as R&I investment for the before-mentioned innovative outputs. Finally, as far as the efficiency was assessed throughout a time frame, a considerable improvement in the last years was observed, especially in the case of trademark and design applications. With regard to trademarks, the average efficiency level in the first Framework Programme (2002–2006) was 51% and reached 83% in the last FP (2014–2020). Concerning design applications, it was 49% in the 1st FP and increased to 81% in the Horizon 2020 period.

Author Contributions

M.A.: Conceptualization, Methodology, Data curation, Software, Investigation, Writing—Original draft preparation, Project administration, Funding acquisition; D.I.: Methodology, Supervision; D.D.: Supervision, Writing—Reviewing and Editing; A.D.: Methodology, Visualization, Investigation; N.B.: Data curation, Software, Investigation, Validation; A.P.: Data curation, Software, Investigation; S.K.: Supervision, Writing—Reviewing and Editing. All authors have read and agreed to the published version of the manuscript.

Funding

This research and the APC were funded by the European Social Fund under the No 09.3.3-LMT-K-712 “Development of Competences of Scientists, other Researchers and Students through Practical Research Activities” measure. Project no.: 09.3.3-LMT-K-712-23-0172.

Data Availability Statement

Public statistics.

Conflicts of Interest

The authors declare no conflict of interest. The funders had no role in the design of the study; in the collection, analyses, or interpretation of data; in the writing of the manuscript; or in the decision to publish the results.

Appendix A

Table A1. Input variables (adapted for this research, based on Andrijauskiene et al. 2021).
NameDefinitionSource
EU R&I investment
eu_fpEU R&I investment channeled through the Framework Programs (euro per capita).European Commission (2022b)
Common innovation infrastructure
rdResearch and development investment (% of GDP). All R&D investment plus gross fixed investment for R&D performed within a country during a specific year.Eurostat (2022)
public_rdIntramural R&D investment in the public sector (% of GDP).Eurostat (2022)
edu_expTotal public investment on education (% of GDP).Eurostat (2022)
rd_fteTotal R&D personnel and researchers by all sectors of performance (% of total employment)—numerator in full-time equivalent (FTE)Eurostat (2022)
knowledge_stockCumulative variable formed from granted patents stock, granted trademarks stock and granted designs stock. Method used: factor analysis.World Intellectual Property Organization (WIPO) (2022)
pub_top10Scientific publications among the top 10% most cited publications worldwide (% of total scientific publications of the country).Web of Science (2022)
employees_eduEmployees with tertiary education (% of total employees)Eurostat (2022)
ictInformation and communication technologies (ICT) use index.World Bank (2022)
Cluster-specific environment for innovation
private_rdIntramural R&D investment in the business sector (% of GDP)Eurostat (2022)
non_rdNon-R&D innovation investment (% total turnover).Eurostat (2022)
sector_industryEmployment in the industry sector (% total employment).World Bank (2022)
sector_servicesEmployment in the services sector (% of total employment).World Bank (2022)
pop_urbanUrban population (% of total population)World Bank (2022)
Quality of the linkages
higher_ed_rdIntramural R&D investment in the higher education sector (% of GDP)Eurostat (2022)
venture_capVenture capital (% of GDP)Eurostat (2022)
public_private_collabNumber of public–private co-authored research publications (per capita). Publications were assigned to the country/countries in which the business companies or other private sector organizations were locatedWeb of Science (2022)
inno_smes_collabInnovative SMEs collaborating with others (% of SMEs).Eurostat (2022)
International economic activities
exportsExports of goods and services (% of GDP)Eurostat (2022)
importsImports of goods and services (% of GDP)World Bank (2022)
fdiInward foreign direct investment (% of GDP)World Bank (2022)
Diversity and equality
multicultureForeign country or stateless population (% total population).Eurostat (2022)
gender_equalityFemale share of employment in senior and middle management (%)World Bank (2022)
income_inequalityPeople at risk of poverty or social exclusion (% of population)Eurostat (2022)
Legal and political strength
legal_politicalStrength of the legal and political environment—judicial independence, rule of law, political stability. 1(worst)–7 (best)World Bank (2022)
corruptionCorruption perception index. Reversed ranking (Excel RANK.AVG function) was applied, meaning that the higher the rank, the more corrupted the country was.Eurostat (2022)
iprProtection of intellectual property rights, patent protection, copyright protection.Property Rights Alliance (2022)
General socio-economic conditions
gdp_capitaGross domestic product (euro per capita).Eurostat (2022)
labour_forceEmployment and activity (thousands of persons, age from 15 to 64).Eurostat (2022)
Table A2. Output variables.
NameDefinitionSource
patentTotal patent applications (direct and PCT national phase entries) by applicant’s origin (per million inhabitants).World Intellectual Property Organization (WIPO) (2022)
trademarkTotal trademark applications (direct and via the Madrid system), by applicant’s origin (per million inhabitants).World Intellectual Property Organization (WIPO) (2022)
designTotal design applications (direct and via the Hague system), by applicant’s origin (per million inhabitants).World Intellectual Property Organization (WIPO) (2022)

Appendix B

Figure A1. Full results of the correlation analysis (* Significance level 10%. ** Significance level 5%. *** Significance level 1%).
Economies 11 00163 g0a1

Appendix C

Figure A2. Average innovation efficiency levels by year.
Economies 11 00163 g0a2

References

  1. Anderson, Henry Junior, and Jan Stejskal. 2019. Diffusion efficiency of innovation among EU member states: A data envelopment analysis. Economies 7: 34. [Google Scholar] [CrossRef] [Green Version]
  2. Andrijauskiene, Meda, Daiva Dumciuviene, and Jovita Vasauskaite. 2021. Redeveloping the national innovative capacity framework: European Union perspective. Economies 9: 201. [Google Scholar] [CrossRef]
  3. Apostolos, Vetsikas, Stamboulis Yeoryios, and Markatou Maria. 2017. Innovation and Economic Growth: An empirical investigation of European countries. Applied Economics Letter 23: 1241–44. [Google Scholar]
  4. Aytekin, Ahmet, Fatih Ecer, Selçuk Korucuk, and Çağlar Karamaşa. 2022. Global innovation efficiency assessment of EU member and candidate countries via DEA-EATWIOS multi-criteria methodology. Technology in Society 68: 101896. [Google Scholar] [CrossRef]
  5. Bacon, David, Dominik Forner, and Sercan Ozcan. 2019. Machine learning approach for national innovation performance data analysis. In 8th International Conference on Data Science, Technology and Applications. Setúbal: SciTePress, pp. 325–31. [Google Scholar] [CrossRef]
  6. Carayannis, Elias G., Evangelos Grigoroudis, and Yorgos Goletsis. 2016. A multilevel and multistage efficiency evaluation of innovation systems: A multiobjective DEA approach. Expert Systems with Applications 62: 63–80. [Google Scholar] [CrossRef]
  7. Castaldi, Carolina. 2018. To trademark or not to trademark: The case of the creative and cultural industries. Research Policy 47: 606–16. [Google Scholar] [CrossRef] [Green Version]
  8. Cooper, W. W., L. M. Seiford, K. Tone, and J. Zhu. 2007. Some models and measures for evaluating performances with DEA: Past accomplishments and future prospects. Journal of Productivity Analysis 28: 151–63. [Google Scholar] [CrossRef]
  9. Dincer, Oguzhan. 2019. Does corruption slow down innovation? Evidence from a cointegrated panel of US states. European Journal of Political Economy 56: 1–10. [Google Scholar] [CrossRef]
  10. Dzemydaitė, Giedrė, Ignas Dzemyda, and Birutė Galinienė. 2016. The efficiency of regional innovation systems in new member states of the European Union: A nonparametric DEA approach. Economics and Business 28: 83–89. [Google Scholar] [CrossRef] [Green Version]
  11. Egilmez, Gokhan, and Deborah McAvoy. 2013. Benchmarking road safety of US states: A DEA-based Malmquist productivity index approach. Accident Analysis & Prevention 53: 55–64. [Google Scholar] [CrossRef]
  12. Erdin, Ceren, and Mehmet Çağlar. 2022. National innovation efficiency: A DEA-based measurement of OECD countries. International Journal of Innovation Science 15: 427–56. [Google Scholar] [CrossRef]
  13. European Commission. 2017. Assessment of the Union Added Value and the Economic Impact of the EU Framework Programmes. Available online: http://ec.europa.eu/research/evaluations/pdf/archive/other_reports_studies_and_documents/assessment_of_the_union_added_value_and_the_economic_impact_of_the_eu_framework_programmes.pdf (accessed on 18 November 2022).
  14. European Commission. 2018. Mutual Learning Exercise on Evaluation of Business R&D Grant Schemes Behavioural Change, Mixed-Method Approaches and Big Data. Available online: https://rio.jrc.ec.europa.eu/policy-support-facility/mleevaluation-business-rd-grant-schemes (accessed on 18 November 2022).
  15. European Commission. 2021. Better Regulation Toolbox. Available online: https://ec.europa.eu/info/sites/default/files/br_toolbox-nov_2021_en_0.pdf (accessed on 21 November 2022).
  16. European Commission. 2022a. EIS 2022 Executive Summary. Available online: https://research-and-innovation.ec.europa.eu/system/files/2022-09/ec_rtd_eis-2022-executive-summary_en.pdf (accessed on 7 December 2022).
  17. European Commission. 2022b. EU Expenditure and Revenue. Available online: https://ec.europa.eu/budget/graphs/revenue_expediture.html (accessed on 15 December 2022).
  18. European Commission. 2022c. Science, Research and Innovation Performance of the EU 2022—Building a Sustainable Future in Uncertain Times. Available online: https://ec.europa.eu/commission/presscorner/detail/en/IP_22_4255 (accessed on 21 November 2022).
  19. European Parliament. 2018. Overcoming Innovation Gaps in the EU-13 Member States. Available online: https://www.europarl.europa.eu/RegData/etudes/STUD/2018/614537/EPRS_STU(2018)614537_EN.pdf (accessed on 18 November 2022).
  20. Eurostat. 2022. Official Eurostat Database. Available online: https://ec.europa.eu/eurostat/data/database (accessed on 15 December 2022).
  21. Fancello, Gianfranco, Michele Carta, and Patrizia Serra. 2020. Data Envelopment Analysis for the assessment of road safety in urban road networks: A comparative study using CCR and BCC models. Case Studies on Transport Policy 8: 736–44. [Google Scholar] [CrossRef]
  22. Faria, Ana Paula, Natália Barbosa, and Joana Bastos. 2020. Portuguese regional innovation systems efficiency in the European Union context. European Planning Studies 28: 1599–618. [Google Scholar] [CrossRef]
  23. Feng, Yongqi, Haolin Zhang, Yung-Ho Chiu, and Tzu-Han Chang Feng. 2021. Innovation efficiency and the impact of the institutional quality: A cross-country analysis using the two-stage meta-frontier dynamic network DEA model. Scientometrics 126: 3091–129. [Google Scholar] [CrossRef]
  24. Fernández-Uclés, Domingo, Saida Elfkih, Adoración Mozas-Moral, Enrique Bernal-Jurado, Miguel Jesús Medina-Viruel, and Saker Ben Abdallah. 2020. Economic efficiency in the tunisian olive oil sector. Agriculture 10: 391. [Google Scholar] [CrossRef]
  25. Foray, Dominique, and Hugo Hollanders. 2015. An assessment of the Innovation Union Scoreboard as a tool to analyse national innovation capacities: The case of Switzerland. Research Evaluation 24: 213–28. [Google Scholar] [CrossRef]
  26. Furman, Jeffrey L., Michael E. Porter, and Scott Stern. 2002. The determinants of national innovative capacity. Research Policy 31: 899–933. [Google Scholar] [CrossRef] [Green Version]
  27. Gavurová, Beáta, Martina Halásková, and Samuel Koróny. 2019. Research and development indicators of EU28 countries from viewpoint of super-efficiency DEA analysis. Acta Universitatis Agriculturae et Silviculturae Mendelianae Brunensis 67: 225–42. [Google Scholar] [CrossRef] [Green Version]
  28. Gil, Dario, Stacy Hobson, Aleksandra Mojsilović, Ruchir Puri, and John R. Smith. 2020. AI for Management: An Overview. In The Future of Management in an AI World. Edited by Jordi Canals and Franz Heukamp. IESE Business Collection. Cham: Palgrave Macmillan. [Google Scholar] [CrossRef]
  29. Haefner, Naomi, Jaokim Wincent, Vinit Parida, and Oliver Gassmann. 2021. Artificial intelligence and innovation management: A review, framework, and research agenda. Technological Forecasting and Social Change 162: 120392. [Google Scholar] [CrossRef]
  30. Juřičková, Eva, Michal Pilik, and Michael Adu Kwarteng. 2019. Efficiency measurement of national innovation systems of the European Union countries: DEA model application. Journal of International Studies 12: 286–99. [Google Scholar] [CrossRef]
  31. Kalapouti, Kleoniki, Konstantinos Petridis, Chrisovalantis Malesios, and Prasanta Kumar Dey. 2020. Measuring efficiency of innovation using combined Data Envelopment Analysis and Structural Equation Modeling: Empirical study in EU regions. Annals of Operations Research 294: 297–320. [Google Scholar] [CrossRef] [Green Version]
  32. Kanellopoulos, Vassilis, and Kostas Tsekouras. 2023. Innovation efficiency and firm performance in a benchmarking context. Managerial and Decision Economics 44: 137–51. [Google Scholar] [CrossRef]
  33. Kontolaimou, Alexandra, Ioannis Giotopoulos, and Aggelos Tsakanikas. 2016. A typology of European countries based on innovation efficiency and technology gaps: The role of early-stage entrepreneurship. Economic Modelling 52: 477–84. [Google Scholar] [CrossRef]
  34. Law, Siong Hook, Weng Chang Lee, and Nirvikar Singh. 2018. Revisiting the finance-innovation nexus: Evidence from a non-linear approach. Journal of Innovation & Knowledge 3: 143–53. [Google Scholar] [CrossRef]
  35. Lee, Jiyoung, Chulyeon Kim, and Gyunghyun Choi. 2019. Exploring data envelopment analysis for measuring collaborated innovation efficiency of small and medium-sized enterprises in Korea. European Journal of Operational Research 278: 533–45. [Google Scholar] [CrossRef]
  36. Li, Qinyang. 2019. Regional technological innovation and green economic efficiency based on DEA model and fuzzy evaluation. Journal of Intelligent & Fuzzy Systems 37: 6415–25. [Google Scholar]
  37. Liu, Shuguang, Han Zhang, Chunyu Liu, and Lu Wang. 2019. Spatial Evolutionary Pattern and Regional Innovation Effi-ciency of European Union. IOP Conference Series: Earth and Environmental Science 234: 012030. [Google Scholar] [CrossRef]
  38. Long, Renyan, Hangyuan Guo, Danting Zheng, Ronghua Chang, and Sanggyun Na Long. 2020. Research on the Measurement, Evolution, and Driving Factors of Green Innovation Efficiency in Yangtze River Economic Belt: A Super-SBM and Spatial Durbin Model. Complexity 2020: 8094247. [Google Scholar] [CrossRef]
  39. Malik, Sakshi. 2023. Macroeconomic determinants of innovation: Evidence from Asian countries. Global Business Review 24: 137–51. [Google Scholar] [CrossRef]
  40. Martin, Ben R. 2016. Twenty challenges for innovation studies. Science and Public Policy 43: 432–50. [Google Scholar] [CrossRef] [Green Version]
  41. Narayanan, Elangovan, Wan Rosmanira Ismail, and Zainol Mustafa. 2022. A data-envelopment analysis-based systematic review of the literature on innovation performance. Heliyon 8: e11925. [Google Scholar] [CrossRef] [PubMed]
  42. Proksch, Dorian, Marcus Max Haberstroh, and Andreas Pinkwart. 2017. Increasing the national innovative capacity: Identifying the pathways to success using a comparative method. Technological Forecasting and Social Change 116: 256–70. [Google Scholar] [CrossRef]
  43. Property Rights Alliance. 2022. International Property Rights Index. Available online: https://www.internationalpropertyrightsindex.org/ (accessed on 22 December 2022).
  44. Rodríguez-Pose, Andrés, and Callum Wilkie. 2019. Innovating in less developed regions: What drives patenting in the lagging regions of Europe and North America. Growth and Change 50: 4–37. [Google Scholar] [CrossRef] [Green Version]
  45. Ryan, Thomas K., and J. W. Schneider. 2016. Examining to what extent the source of competitive funding influences scientific impact. A case study of Danish EU FP7 funded projects. 21st International Conference on Science and Technology Indicators-STI 2016. Book of Proceedings, 581–89. [Google Scholar] [CrossRef] [Green Version]
  46. Schneider, Patricia Higino. 2005. International trade, economic growth and intellectual property rights: A panel data study of developed and developing countries. Journal of Development Economics 78: 529–47. [Google Scholar] [CrossRef]
  47. Sotos, Ana Elisa Castro, Stijn Vanhoof, Wim Van Den Noortgate, and Patrick Onghena. 2009. The transitivity misconception of Pearson’s correlation coefficient. Statistics Education Research Journal 8: 33–55. [Google Scholar] [CrossRef]
  48. Sunley, Peter, Steven Pinch, Suzanne Reimer, and James Macmillen. 2008. Innovation in a creative production system: The case of design. Journal of Economic Geography 8: 675–98. [Google Scholar] [CrossRef]
  49. Toloo, Mehdi, Esmaeil Keshavarz, and Adel Hatami-Marbini Toloo. 2021. Selecting data envelopment analysis models: A data-driven application to EU countries. Omega 101: 102248. [Google Scholar] [CrossRef]
  50. Transparency International. 2022. Corruption Perception Index. Available online: https://www.transparency.org/en/cpi/2022 (accessed on 26 May 2023).
  51. van den Besselaar, Peter A. A., Ramon Flecha, and Alfred Radauer. 2018. Monitoring the Impact of EU Framework Programmes. Available online: https://op.europa.eu/en/publication-detail/-/publication/cbb7ce39-d66d-11e8-9424-01aa75ed71a1 (accessed on 22 May 2023).
  52. Varga, Attila, and Tamás Sebestyén. 2017. Does EU Framework Program participation affect regional innovation? The differentiating role of economic development. International Regional Science Review 40: 405–39. [Google Scholar] [CrossRef]
  53. Wawrosz, Petr. 2019. Productive of the service sector: Theory and practice of corruption declining. In Marketing and Management of Innovations. Ukraine: Sumy State University, vol. 9, pp. 269–79. [Google Scholar] [CrossRef] [Green Version]
  54. Web of Science. 2022. Database. Available online: https://clarivate.com/webofsciencegroup/ (accessed on 23 December 2022).
  55. World Bank. 2022. World Development Indicators. Available online: https://databank.worldbank.org/source/world-development-indicators (accessed on 12 November 2022).
  56. World Intellectual Property Organization (WIPO). 2022. Available online: https://www.wipo.int/publications/en/details.jsp?id=4571 (accessed on 17 November 2022).
  57. Xu, Kai, Ran Mei, Li Liang, and Wei Sun. 2023. Regional convergence analysis of sustainable innovation efficiency in European Union countries. Journal of Environmental Management 325: 116636. [Google Scholar] [CrossRef]
  58. Zang, Leizhen, Feng Xiong, Xin Lao, and Yanyan Gao. 2019. Does governance efficiency matter for national innovative capacity? One tale from different countries. Technology Analysis & Strategic Management 31: 239–52. [Google Scholar] [CrossRef]
  59. Zhu, Lin, Jian Luo, Qingli Dong, Yang Zhao, Yunyue Wang, and Yong Wang. 2021. Green technology innovation efficiency of energy-intensive industries in China from the perspective of shared resources: Dynamic change and improvement path. Technological Forecasting and Social Change 170: 120890. [Google Scholar] [CrossRef]
Figure 1. Statistically significant correlations between the input variables and the output variable “patents”.
Economies 11 00163 g001
Figure 2. Statistically significant correlations between the input variables and the output variable “trademarks”.
Economies 11 00163 g002
Figure 3. Statistically significant correlations between the input variables and the output variable “designs”.
Economies 11 00163 g003
Figure 4. Inputs/outputs for DEA.
Economies 11 00163 g004
Figure 5. Average innovation efficiency levels by member state.
Economies 11 00163 g005
Figure 6. Average innovation efficiency levels by programming period.
Economies 11 00163 g006
Table 1. Average innovation efficiency levels by member state using different DEA methods.
RegionDesignTrademarkPatent
CCRBCCSBMCCRBCCSBMCCRBCCSBM
Austria0.680.680.670.550.540.540.550.540.54
Belgium0.560.550.550.530.520.520.530.520.52
Bulgaria0.690.680.680.590.580.570.590.580.57
Cyprus0.610.610.610.740.740.730.740.740.73
Czechia0.650.650.640.410.390.390.410.390.39
Germany0.770.750.750.560.550.550.560.550.55
Denmark0.790.770.780.550.530.540.550.530.54
Estonia0.510.510.510.440.440.430.440.440.43
Greece0.200.200.180.260.250.240.260.250.24
Spain0.410.400.400.440.440.430.440.440.43
Finland0.860.850.850.580.570.580.580.570.58
France0.520.510.500.410.400.400.410.400.40
Croatia0.490.470.480.390.380.400.390.380.40
Hungary0.460.460.460.460.450.440.460.450.44
Ireland0.500.490.490.570.560.560.570.560.56
Italy0.790.780.780.710.700.700.710.700.70
Lithuania0.470.450.450.510.490.500.510.490.50
Luxembourg0.920.910.920.950.930.950.950.930.95
Latvia0.440.440.420.380.360.360.380.360.36
Malta0.630.620.620.880.880.880.880.880.88
Netherlands0.800.800.780.680.670.670.680.670.67
Poland0.840.820.830.900.890.890.900.890.89
Portugal0.390.390.390.340.330.330.340.330.33
Romania0.390.390.380.500.500.490.500.500.49
Sweden0.830.830.810.590.590.590.590.590.59
Slovenia0.570.550.550.520.510.520.520.510.52
Slovakia0.430.420.430.350.340.340.350.340.34
Disclaimer/Publisher’s Note: The statements, opinions and data contained in all publications are solely those of the individual author(s) and contributor(s) and not of MDPI and/or the editor(s). MDPI and/or the editor(s) disclaim responsibility for any injury to people or property resulting from any ideas, methods, instructions or products referred to in the content.

