
Empirical Analysis of Inclusive Growth, Information and Communication Technology Adoption, and Institutional Quality


Abstract
:1. Introduction
2. Brief Literature Review
2.1. Institutional Quality and Inclusive Growth
2.2. ICT Adoption and Inclusive Growth
2.3. ICT Adoption and Institutional Quality
3. Data and Model
3.1. The Variables
3.2. Theoretical Background and Empirical Model
3.3. Estimation Techniques
4. Empirical Results and Discussions
4.1. Descriptive Analysis
4.2. Full Sample Results
4.3. Sub-Sample Results
5. Conclusions and Policy Recommendations
Author Contributions
Funding
Informed Consent Statement
Data Availability Statement
Conflicts of Interest
Appendix A

Appendix B

| S/No. | Country | Group | S/No. | Country | Group | S/No. | Country | Group |
|---|---|---|---|---|---|---|---|---|
| 1 | Afghanistan | LI | 66 | Georgia | LMI | 131 | Norway | HI |
| 2 | Albania | UMI | 67 | Germany | HI | 132 | Oman | HI |
| 3 | Algeria | UMI | 68 | Ghana | LMI | 133 | Pakistan | LMI |
| 4 | Angola | LMI | 69 | Greece | HI | 134 | Palau | HI |
| 5 | Antigua and Barbuda | HI | 70 | Grenada | UMI | 135 | Panama | HI |
| 6 | Argentina | HI | 71 | Guam | HI | 136 | Papua New Guinea | LMI |
| 7 | Armenia | UMI | 72 | Guatemala | UMI | 137 | Paraguay | UMI |
| 8 | Aruba | HI | 73 | Guinea | LI | 138 | Peru | UMI |
| 9 | Australia | HI | 74 | Guinea-Bissau | LI | 139 | Philippines | LMI |
| 10 | Austria | HI | 75 | Guyana | UMI | 140 | Poland | HI |
| 11 | Azerbaijan | UMI | 76 | Haiti | LI | 141 | Portugal | HI |
| 12 | Bahamas, The | HI | 77 | Honduras | LMI | 142 | Puerto Rico | HI |
| 13 | Bahrain | HI | 78 | Hong Kong SAR, China | HI | 143 | Qatar | HI |
| 14 | Bangladesh | LMI | 79 | Hungary | HI | 144 | Romania | UMI |
| 15 | Barbados | HI | 80 | Iceland | HI | 145 | Russian Federation | UMI |
| 16 | Belarus | UMI | 81 | India | LMI | 146 | Rwanda | LI |
| 17 | Belgium | HI | 82 | Indonesia | LMI | 147 | Samoa | UMI |
| 18 | Belize | UMI | 83 | Iran, Islamic Rep. | UMI | 148 | San Marino | HI |
| 19 | Benin | LI | 84 | Iraq | UMI | 149 | Sao Tome and Principe | LMI |
| 20 | Bhutan | LMI | 85 | Ireland | HI | 150 | Saudi Arabia | HI |
| 21 | Bolivia | LMI | 86 | Israel | HI | 151 | Senegal | LI |
| 22 | Bosnia and Herzegovina | UMI | 87 | Italy | HI | 152 | Serbia | UMI |
| 23 | Botswana | UMI | 88 | Jamaica | UMI | 153 | Seychelles | HI |
| 24 | Brazil | UMI | 89 | Japan | HI | 154 | Sierra Leone | LI |
| 25 | Brunei Darussalam | HI | 90 | Jordan | UMI | 155 | Singapore | HI |
| 26 | Bulgaria | UMI | 91 | Kazakhstan | UMI | 156 | Slovak Republic | HI |
| 27 | Burkina Faso | LI | 92 | Kenya | LMI | 157 | Slovenia | HI |
| 28 | Burundi | LI | 93 | Kiribati | LMI | 158 | Solomon Islands | LMI |
| 29 | Cabo Verde | LMI | 94 | Kosovo | LMI | 159 | South Africa | UMI |
| 30 | Cambodia | LMI | 95 | Kuwait | HI | 160 | South Korea | HI |
| 31 | Cameroon | LMI | 96 | Kyrgyz Republic | LMI | 161 | Spain | HI |
| 32 | Cayman Islands | HI | 97 | Lao PDR | LMI | 162 | Sri Lanka | LMI |
| 33 | Central African Republic | LI | 98 | Latvia | HI | 163 | St. Kitts and Nevis | HI |
| 34 | Chad | LI | 99 | Lebanon | UMI | 164 | St. Lucia | UMI |
| 35 | Chile | HI | 100 | Lesotho | LMI | 165 | St. Vincent and the Grenadines | UMI |
| 36 | China | UMI | 101 | Liberia | LI | 166 | Sudan | LMI |
| 37 | Colombia | UMI | 102 | Libya | UMI | 167 | Suriname | UMI |
| 38 | Comoros | LI | 103 | Lithuania | HI | 168 | Sweden | HI |
| 39 | Congo, Dem, Rep. | LI | 104 | Luxembourg | HI | 169 | Switzerland | HI |
| 40 | Congo, Dem. Rep. | LI | 105 | Macao SAR, China | HI | 170 | Tajikistan | LI |
| 41 | Congo, Rep. | LMI | 106 | Madagascar | LI | 171 | Tanzania | LI |
| 42 | Costa Rica | UMI | 107 | Malawi | LI | 172 | Thailand | UMI |
| 43 | Cote d’Ivoire | LMI | 108 | Malaysia | UMI | 173 | Timor-Leste | LMI |
| 44 | Croatia | HI | 109 | Maldives | UMI | 174 | Togo | LI |
| 45 | Cuba | HI | 110 | Mali | LI | 175 | Tonga | UMI |
| 46 | Curacao | HI | 111 | Malta | HI | 176 | Trinidad and Tobago | HI |
| 47 | Cyprus | HI | 112 | Marshall Islands | UMI | 177 | Tunisia | LMI |
| 48 | Czech Republic | HI | 113 | Mauritania | LMI | 178 | Turkey | UMI |
| 49 | Denmark | HI | 114 | Mauritius | UMI | 179 | Turkmenistan | UMI |
| 50 | Djibouti | LMI | 115 | Mexico | UMI | 180 | Tuvalu | UMI |
| 51 | Dominica | UMI | 116 | Moldova | LMI | 181 | Uganda | LI |
| 52 | Dominican Republic | UMI | 117 | Mongolia | LMI | 182 | Ukraine | LMI |
| 53 | Ecuador | UMI | 118 | Montenegro | UMI | 183 | United Arab Emirates | HI |
| 54 | Egypt, Arab Rep. | LMI | 119 | Morocco | LMI | 184 | United Kingdom | HI |
| 55 | El Salvador | LMI | 120 | Mozambique | LI | 185 | Uruguay | HI |
| 56 | Equatorial Guinea | UMI | 121 | Myanmar | LMI | 186 | Uzbekistan | LMI |
| 57 | Estonia | HI | 122 | Namibia | UMI | 187 | Vanuatu | LMI |
| 58 | Eswatini | LMI | 123 | Nauru | UMI | 188 | Venezuela, RB | UMI |
| 59 | Ethiopia | LI | 124 | Nepal | LI | 189 | Vietnam | LMI |
| 60 | Fiji | UMI | 125 | Netherlands | HI | 190 | West Bank and Gaza | LMI |
| 61 | Finland | HI | 126 | New Zealand | HI | 191 | Yemen, Rep. | LI |
| 62 | France | HI | 127 | Nicaragua | LMI | 192 | Zambia | LMI |
| 63 | French Polynesia | HI | 128 | Niger | LI | 193 | Zimbabwe | LI |
| 64 | Gabon | UMI | 129 | Nigeria | LMI | |||
| 65 | Gambia, The | LI | 130 | North Macedonia | UMI |
| 1 | Measured by human development Index. |
| 2 | Measured by the average of the six dimensions of institutional quality. |
| 3 | See Appendix B Table A1 for the list of countries and their respective classifications. |
| 4 | Voice and accountability, rule of law, control of corruption, regulatory quality, government effectiveness and political stability. |
| 5 | This stepwise regression approach is taken to observe the marginal effect of each ICT indicator on inclusive growth and to avoid biased inferences due to high collinearity between MOB/FTEL (See Table 3). |
| 6 | Mean, minimum or maximum values can be used. |
References
- Acemoglu, Daren, and Simon Johnson. 2005. Unbundling Institutions. The Journal of Political Economy 113: 949–95. [Google Scholar] [CrossRef]
- Acemoglu, Daren, and James Robinson. 2001. A theory of political transitions. American Economic Review 91: 938–63. [Google Scholar] [CrossRef]
- Acemoglu, Daren, and James Robinson. 2010. The role of institutions in growth and development. Review of Economics and Institutions 1: 1–33. [Google Scholar] [CrossRef]
- Acemoglu, Daren, and James Robinson. 2013. Why Nations Fail. London: Profile Books Ltd., vol. 2. [Google Scholar]
- Acemoglu, Daren, Simon Johnson, and James Robinson. 2005. Institutions as a fundamental cause of long-run growth. Handbook of Economic Growth 1: 385–472. [Google Scholar]
- Acemoglu, Daren, Simon Johnson, James Robinson, and Pierre Yared. 2009. Re-evaluating the Modernization Hypothesis. Journal of Monetary Economics 56: 1043–58. [Google Scholar] [CrossRef]
- Adam, Ibrahim Osman. 2020. Examining E-Government development effects on corruption in Africa: The mediating effects of ICT development and institutional quality. Technology in Society 61: 101245. [Google Scholar] [CrossRef]
- Adeleye, Bosede Ngozi. 2021. Unbundling Interest Rate and Bank Credit Nexus on Income Inequality: Structural Break Analysis from Nigeria. Journal of Financial Regulation and Compliance 29: 63–78. [Google Scholar] [CrossRef]
- Adeleye, Ngozi, and Chiamaka Eboagu. 2019. Evaluation of ICT development and economic growth in Africa. NETNOMICS: Economic Research and Electronic Networking 20: 31–53. [Google Scholar] [CrossRef]
- Adeleye, Ngozi, Evans Osabuohien, and Ebenezer Bowale. 2017. The role of institutions in the finance-inequality nexus in Sub-Saharan Africa. Journal of Contextual Economics 137: 173–92. [Google Scholar] [CrossRef]
- Adeleye, Bosede Ngozi, Festus Adedoyin, and Solomon Nathaniel. 2021a. The Criticality of ICT-Trade Nexus on Economic and Inclusive growth. Information Technology for Development 27: 293–313. [Google Scholar] [CrossRef]
- Adeleye, Bosede Ngozi, Arumugam Sankaran, Abdul Jamal, and Arjun K. 2021b. Internationalization–Industrial output nexus: Evidence from 15 late-industrialized economies. Journal of Public Affairs 22: e2658. [Google Scholar] [CrossRef]
- Adusei, Michael, and Ngozi Adeleye. 2021. Corporate Disclosure and Credit Market Development. Journal of Applied Economics 24: 205–30. [Google Scholar] [CrossRef]
- Aghaei, Majid, and Mahdieh Rezagholizadeh. 2017. The impact of information and communication technology (ICT) on economic growth in the OIC Countries. Economic and Environmental Studies 17: 257–78. [Google Scholar] [CrossRef]
- Ajide, Folorunsho, Tolulope Osinubi, and James Temitope Dada. 2021. Economic Globalization, Entrepreneurship, and Inclusive Growth in Africa. Journal of Economic Integration 36: 689–717. [Google Scholar] [CrossRef]
- Albiman, Masoud Mohammed, and Zunaidah Sulong. 2016. The role of ICT use to the economic growth in Sub Saharan African region (SSA). Journal of Science and Technology Policy Management 7: 306–29. [Google Scholar] [CrossRef]
- Alshubiri, Faris, Syed Ahsen Jamil, and Mohamed Elheddad. 2019. The impact of ICT on financial development: Empirical evidence from the Gulf Cooperation Council countries. International Journal of Engineering Business Management 11: 184797901987067. [Google Scholar] [CrossRef]
- Anand, Rahul, Saurabh Mishra, and Shanaka Peiris. 2013. Inclusive Growth: Measurement and Determinants. IMF Woking Paper, WP/13/135. Washington, DC: IMF, pp. 1–27. [Google Scholar]
- Appiah, Michael, Fanglin Li, and Doreen Idan Frowne. 2020. Financial Development, Institutional Quality and Economic Growth: Evidence from ECOWAS Countries. Organizations and Markets in Emerging Economies 11: 6–17. [Google Scholar] [CrossRef]
- Arogundade, Sodiq, Mduduzi Biyase, and Joel Eita. 2021. Foreign Direct Investment and Inclusive Human Development in Sub-Saharan African Countries: Domestic Conditions Matter. Economia Internazionale/International Economics 74: 463–98. [Google Scholar]
- Arogundade, Sodiq, Mduduzi Biyase, and Joel Eita. 2022a. Foreign direct investment and poverty in sub-Saharan African countries: The role of host absorptive capacity. Cogent Economics & Finance 10: 2078459. [Google Scholar]
- Arogundade, Sodiq, Mduduzi Biyase, and Santos Bila. 2022b. Be nice to thy neighbors: Spatial impact of foreign direct investment on poverty in Africa. Economies 10: 128. [Google Scholar] [CrossRef]
- Aslam, Aribah, Amjad Naveed, and Ghulam Shabbir. 2021. Is it an institution, digital or social inclusion that matters for inclusive growth? A panel data analysis. Quality & Quantity 55: 333–55. [Google Scholar]
- Asongu, Simplice, and Agyenim Boateng. 2018. Introduction to Special Issue: Mobile Technologies and Inclusive Development in Africa. Journal of African Business 19: 297–301. [Google Scholar] [CrossRef]
- Asongu, Simplice, and Sara Le Roux. 2017. Enhancing ICT for inclusive human development in Sub-Saharan Africa. Technological Forecasting and Social Change 118: 44–54. [Google Scholar] [CrossRef]
- Asongu, Simplice, and Jacinta Nwachukwu. 2017. Foreign Aid and Inclusive Development: Updated Evidence from Africa, 2005–2012. Social Science Quarterly 98: 282–98. [Google Scholar] [CrossRef]
- Asongu, Simplice A., and Jacinta Nwachukwu. 2018. Openness, ICT and Entrepreneurship in Sub-Saharan Africa. Information Technology & People 31: 278–303. [Google Scholar]
- Azu, Nnanna, and Philip Nwauko. 2021. Evaluating the Effect of Digital Transformation on Improvement of Service Trade in West Africa. Foreign Trade Review 56: 430–53. [Google Scholar] [CrossRef]
- Batuo, Michael Enowbi. 2015. The role of telecommunications infrastructure in the regional economic growth of Africa. The Journal of Developing Areas 49: 313–30. [Google Scholar] [CrossRef]
- Baum, Christopher, Mark Schaffer, and Steven Stillman. 2003. Instrumental Variables and GMM: Estimation and Testing. Stata Journal 3: 1–31. [Google Scholar] [CrossRef]
- Baum, Christopher, Mark Schaffer, and Steven Stillman. 2007a. Enhanced Routines for Instrumental Variables/Generalized Method of Moments Estimation and Testing. Stata Journal 7: 465–506. [Google Scholar] [CrossRef]
- Baum, Christopher, Mark Schaffer, and Steven Stillman. 2007b. ivreg2: Stata Module for Extended Instrumental Variables/2SLS, GMM and AC/HAC, LIML, and k-Class Regression. Boston: Boston College Department of Economics, Statistical Software Components, Stata, USA. [Google Scholar]
- Belanger, France, and Lemuria Carter. 2012. Digitizing Government Interactions with Constituents: An Historical Review of E-Government Research in Information Systems. Journal of the Association for Information Systems 13: 1–32. [Google Scholar] [CrossRef]
- Boschma, Ron, and Gianluca Capone. 2016. Relatedness and diversification in the European Union (EU-27) and European Neighbourhood Policy countries. Sage 34: 617–37. [Google Scholar] [CrossRef]
- Brahim, Mariem, and Houssem Rachdi. 2014. Foreign direct investment, institutions and economic growth: Evidence from the MENA region. Journal of Reviews on Global Economics 3: 328–39. [Google Scholar]
- Brynjolfsson, Erik, and Lorin Hitt. 2000. Beyond computation: Information technology, organizational transformation and business performance. Journal of Economic Perspectives 14: 23–48. [Google Scholar] [CrossRef]
- Butkiewicz, James, and Halit Yanikkaya. 2006. Institutional quality and economic growth: Maintenance of the rule of law or democratic institutions, or both? Economic Modelling 23: 648–61. [Google Scholar] [CrossRef]
- Cameron, Colin, and Pravin Trivedi. 2005. Microeconometrics. Cambridge: Cambridge University Press. [Google Scholar]
- Castells, Manuel. 1989. The Informational City: Information Technology, Economic Restructuring, and the Urban-Regional Process. Oxford: Blackwell, pp. 234–35. [Google Scholar]
- Chavula, Hopestone. 2013. Telecommunications development and economic growth in Africa. Information Technology for Development 19: 5–23. [Google Scholar] [CrossRef]
- Compton, Ryan, and Bryan Paterson. 2016. Military spending and growth: The role of institutions. Defence and Peace Economics 27: 301–22. [Google Scholar] [CrossRef]
- Darusalam, Normah Omar, Marijj Janssen, Jamaliah Said, and Kazi Sohag. 2021. The influence of ICT diffusion and globalization on the quality of governance: A study using panel data from ASEAN countries. Information Development 39: 46–59. [Google Scholar] [CrossRef]
- Dedrick, Jason, Kenneth Kraemer, and Eric Chuan-Fong Shih. 2013. Information technology and productivity in developed and developing countries. Journal of Management Information Systems 30: 97–122. [Google Scholar] [CrossRef]
- Dholakia, Ruby Roy, and Bari Harlam. 1994. Telecommunications and economic development: Econometric analysis of the US experience. Telecommunications Policy 18: 470–77. [Google Scholar] [CrossRef]
- Driscoll, John, and Aart C. Kraay. 1998. Consistent Covariance Matrix Estimation with Spatially Dependent Panel Data. Review of Economics and Statistics 80: 549–60. [Google Scholar] [CrossRef]
- Ebire, Kolawole, Saif Ullah, Bosede Ngozi Adeleye, and Muhammad Ibrahim Shah. 2021. Effect of Capital Flows on Financial Stability in Middle-Income Countries. Journal of Financial Regulation and Compliance 29: 491–513. [Google Scholar] [CrossRef]
- Ejemeyovwi, Jeremiah Ogaga, and Evans Osabuohien. 2020. Investigating the Relevance of Mobile Technology Adoption on Inclusive Growth in West Africa. Contemporary Social Science 15: 48–61. [Google Scholar] [CrossRef]
- Farole, Thomas, Andrés Rodríguez-Pose, and Michael Storper. 2011. Cohesion policy in the European Union: Growth, geography, institutions. JCMS: Journal of Common Market Studies 49: 1089–111. [Google Scholar] [CrossRef]
- George, Tayo, Anthony Onwumah, Mercy Ozoya, and Olawale Olonade. 2021. Good governance, social order, and development in Nigeria: The critical role of gender inclusion. African Journal of Reproductive Health 25: 201–8. [Google Scholar]
- Ghosh, Saibal. 2016. Does mobile telephony spur growth? Evidence from Indian states. Telecommunications Policy 40: 1020–31. [Google Scholar] [CrossRef]
- Gillman, Mark, Max Harris, and László Mátyás. 2004. Inflation and growth: Explaining a negative effect. Empirical Economics 29: 149–67. [Google Scholar] [CrossRef]
- Hall, Robert, and Charles Jones. 1999. Why do some countries produce so much more output per worker than others? Quarterly Journal of Economics 114: 83–116. [Google Scholar] [CrossRef]
- Hdom, Hélde, and José Alberto Fuinhas. 2020. Energy Production and Trade Openness: Assessing Economic Growth, CO2 Emissions and the Applicability of the Cointegration Analysis. Energy Strategy Reviews 30: 100488. [Google Scholar] [CrossRef]
- Hoechle, Daniel. 2006. Robust Standard Errors for Panel Regressions with Cross-Sectional Dependence. The Stata Journal 7: 281–312. [Google Scholar] [CrossRef]
- Iqbal, Nasir, and Vince Daly. 2014. Rent seeking opportunities and economic growth in transitional economies. Economic Modelling 37: 16–22. [Google Scholar] [CrossRef]
- Isola, Wakeel Atanda, Bosede Ngozi Adeleye, and Aminat Olayinka Olohunlana. 2020. Boardroom female participation, intellectual capital efficiency and firm performance in developing countries. Journal of Economics, Finance and Administrative Science 25: 413–24. [Google Scholar] [CrossRef]
- Jawaid, Tehsen, and Abdul Waheed. 2017. Contribution of international trade in human development of Pakistan. Global Business Review 18: 1155–77. [Google Scholar] [CrossRef]
- Johnson, Olawale. 2016. Information and Communication Technologies Adoption and Inclusive Growth: The ICT-Inclusive Growth Pyramid Approach. Master’s thesis, Economics and Development Studies, Covenant University, Ota, Nigeria. [Google Scholar]
- Jones, Eric. 1987. The European Miracle, Environments, Economies, and Geopolitics in the History of Europe and Asia. Cambridge: Cambridge University Press. [Google Scholar]
- Jorgenson, Dale, and Kevin J. Stiroh. 2000. Raising the speed limit: US economic growth in the information age. Brookings Papers on Economic Activity 2: 125–2011. [Google Scholar] [CrossRef]
- Kim, Jinho, Jong Chool Park, and Timothy Komarek. 2021. The impact of Mobile ICT on national productivity in developed and developing countries. Information & Management 58: 103442. [Google Scholar] [CrossRef]
- Klasen, Stephan. 2010. Measuring and Monitoring Inclusive Growth: Multiple Definitions, Open Questions, and Some Constructive Proposals. ADB Sustainable Development Working Paper Series, No. 12; Mandaluyong City: Asian Development Bank. [Google Scholar]
- Koenker, Roger. 2005. Quantile Regression. New York: Cambridge University Press. [Google Scholar]
- Koenker, Roger, and Gilbert Bassett. 1978. Regression Quantiles. Econometrica 46: 33–50. [Google Scholar] [CrossRef]
- Koenker, Roger, and Kevin F. Hallock. 2001. Quantile Regression. Journal of Econometrics Perspectives 15: 143–56. [Google Scholar] [CrossRef]
- Kong, Qunxi, Dan Peng, Yehui Ni, Xinyue Jiang, and Ziqi Wang. 2020. Trade Openness and Economic Growth Quality of China: Empirical Analysis Using ARDL Model. Finance Research Letters 38: 101488. [Google Scholar] [CrossRef]
- Kpomblekou, Elom, and Kwami O. Wonyra. 2020. Spatial Diffusion of International Trade in West African Economic and Monetary Union (WAEMU). Scientific African 7: e00295. [Google Scholar] [CrossRef]
- Lucas, Robert E. 1988. On the mechanics of economic development. Journal of Monetary Economics 22: 3–42. [Google Scholar] [CrossRef]
- Mansell, Robin. 1999. Information and communication technologies for development: Assessing the potential and the risks. Telecommunications Policy 23: 35–50. [Google Scholar] [CrossRef]
- Mansell, Robin, and Uta Wehn. 1998. Knowledge Societies: Information Technology for Sustainable Development. Oxford: Oxford University Press. [Google Scholar]
- Marakbi, Réda, and Camélia Turcu. 2016. Corruption, institutional quality, and growth: A panel smooth transition regression approach. JEL Classification C 34: D73. [Google Scholar]
- Mbulawa, Strike. 2015. Determinants of economic growth in Southern Africa development community: The role of institutions. Applied Economics and Finance 2: 91–102. [Google Scholar] [CrossRef]
- Mohammed, Fathey, Othman Ibrahim, and Norafida Ithnin. 2016. Factors influencing cloud computing adoption for e-government implementation in developing countries: Instrument development. Journal of Systems and Information Technology 18: 297–327. [Google Scholar] [CrossRef]
- Musila, Jacob, and Zelealem Yiheyis. 2015. The impact of trade openness on growth: The case of Kenya. Journal of Policy Modeling 37: 342–54. [Google Scholar] [CrossRef]
- Nawaz, Saima, Nasir Iqbal, and Muhammad Arshad Khan. 2014. The impact of institutional quality on economic growth: Panel evidence. The Pakistan Development Review 53: 15–31. [Google Scholar] [CrossRef]
- Niebel, Thomas. 2018. ICT and Economic Growth—Comparing Developing, Emerging and Developed Countries. World Development 104: 197–211. [Google Scholar] [CrossRef]
- North, Douglass. 1990. Institutions, Institutional Change and Economic Performance. Cambridge: Cambridge University Press. [Google Scholar]
- Ofori, Isaac Kwesi, and Simplice Asongu. 2021. ICT Diffusion, Foreign Direct Investment and Inclusive Growth in Sub-Saharan Africa. Telematics Informatic 65: 101718. [Google Scholar] [CrossRef]
- Oliner, Stephen, and Daniel E. Sichel. 2000. The resurgence of growth in the late 1990s: Is information technology the story? Journal of Economic Perspectives 14: 3–22. [Google Scholar] [CrossRef]
- Olson, Mancur. 1982. The Rise and Decline of Nations: Economic Growth, Stagflation, and Social Rigidities. New Haven: Yale University Press. [Google Scholar]
- Ongo, Emmanuel Nkoa, and Andrew Wujung Vukenkeng. 2014. Does gross capital formation matter for economic growth in the CEMAC Subregion? EuroEconomica 2: 79–88. [Google Scholar]
- Osabuohien, Evans. 2008. ICT and Nigerian Banks’ reforms: Analysis of anticipated impacts in Selected Banks. Global Journal of Business Research 2: 67–76. [Google Scholar]
- Oyinlola, Mutiu, Abdulfatai Adedeji, Modupe Bolarinwa, and Nafisat Olabisi. 2020. Governance, Domestic Resource Mobilization, and Inclusive Growth in Sub-Saharan Africa. Economic Analysis and Policy 65: 68–88. [Google Scholar] [CrossRef]
- Papaioannou, Sotiris, and Sophia Dimelis. 2007. Information technology as a factor of economic development: Evidence from developed and developing countries. Economics of Innovation and New Technology 16: 179–94. [Google Scholar] [CrossRef]
- Popelyshyn, Olha, Valentyna Tsap, Ingrid Pappel, and Dirk Draheim. 2019. On Leveraging the Potential of Open Data to Enhance Transparency and Accountability—A Case Study from Ukraine. Paper presented at the 2019 Sixth International Conference on eDemocracy & eGovernment (ICEDEG), Quito, Ecuador, April 24–26. [Google Scholar]
- Rana, N. P., Y. K. Dwivedi, and Dwivedi Williams. 2013. Analysing challenges, barriers and CSF of egov adoption. Transforming Government: People, Process and Policy 7: 177–98. [Google Scholar] [CrossRef]
- Rauniyar, Ganesh P., and Ravi Kanbur. 2010. Inclusive Development: Two Papers on Conceptualization, Application, and the ADB Perspective. Ithaca: Cornell University. [Google Scholar]
- Rodrik, Dani. 2005. Growth Strategies. In Handbook of Economic Growth. Edited by Philippe Aghion and Steven N. Durlauf. Amsterdam: Elsevier B.V., vol. 1A, pp. 967–1014. [Google Scholar]
- Rodrik, Dani. 2006. Goodbye Washington consensus, hello Washington confusion? A review of the World Bank’s economic growth in the 1990s: Learning from a decade of reform. Journal of Economic Literature 44: 973–87. [Google Scholar] [CrossRef]
- Rodrik, Dani, Arvind Subramanian, and Francesco Trebbi. 2004. Institutions rule: The primacy of institutions over geography and integration in economic development. Journal of Economic Growth 9: 131–65. [Google Scholar] [CrossRef]
- Roller, Lars-Hendrik, and Leonard Waverman. 2001. Telecommunications infrastructure and economic development: A simultaneous approach. American Economic Review 91: 909–23. [Google Scholar] [CrossRef]
- Romer, Paul. 1986. Increasing returns and long-run growth. Journal of Political Economy 94: 1002–37. [Google Scholar] [CrossRef]
- Ross, Michael. 2001. Does oil hinder democracy? World Politics 53: 325–61. [Google Scholar] [CrossRef]
- Roztocki, Narcyz, Piotr Soja, and Heinz Roland Weistroffer. 2019. The role of information and communication Technologies in Socioeconomic development: Towards a multi-dimensional framework. Information Technology for Development 25: 171–83. [Google Scholar] [CrossRef]
- Saba, Charles Shaaba, and Nicholas Ngepah. 2021. ICT Diffusion, Industrialisation and Economic Growth Nexus: An International Cross-country Analysis. Journal of the Knowledge Economy 13: 2030–69. [Google Scholar] [CrossRef]
- Sala-i-Martin, Xavier, and Arvind Subramanian. 2013. Addressing the natural resource curse: An illustration from Nigeria. Journal of African Economies 22: 570–615. [Google Scholar] [CrossRef]
- Sassi, Seifallah, and Mohamed Sami Ali. 2017. Corruption in Africa: What role does ICT diffusion play? Telecommunications Policy 41: 662–69. [Google Scholar] [CrossRef]
- Sein, Maung, Devinder Thapa, Matthias Hatakka, and Øystein Sæbø. 2018. A Holistic Perspective on the Theoretical Foundations for ICT4D Research. Information Technology for Development 25: 7–25. [Google Scholar] [CrossRef]
- Solow, Robert. 1956. A contribution to the theory of economic growth. The Quarterly Journal of Economics 70: 65–94. [Google Scholar] [CrossRef]
- Sondermann, David. 2018. Towards More Resilient Economies: The Role of Well-Functioning Economic Structures. Journal of Policy Modeling 40: 97–117. [Google Scholar] [CrossRef]
- Steinmueller, Edward. 2001. ICTs and possibilities for leapfrogging by developing countries. International Labour Review 140: 193–210. [Google Scholar] [CrossRef]
- Swan, T. W. 1956. Economic growth and capital accumulation. Economic Record 32: 334–61. [Google Scholar] [CrossRef]
- Tallon, Paul, and Kenneth L. Kraemer. 2000. Information technology and economic development: Ireland’s coming of age with lessons for developing countries. Journal of Global Information Technology Management 3: 4–23. [Google Scholar] [CrossRef]
- Tella, Sherriffdeen, and Olorunfemi Alimi. 2016. Determinants of Inclusive Growth in Africa: Role of Health and Demographic Changes. African Journal of Economic Review IV: 138–46. [Google Scholar]
- Toader, Elena, Bogdan Narcis Firtescu, Angela Roman, and Sorin Gabriel Anton. 2018. Impact of information and communication technology infrastructure on economic growth: An empirical assessment for the EU countries. Sustainability 10: 3750. [Google Scholar] [CrossRef]
- UNDP. 2019. Human Development Index. Available online: http://hdr.undp.org/sites/default/files/hdr2019_technical_notes.pdf (accessed on 16 February 2021).
- Van Ark, Bart, and Marcin Piatkowski. 2004. Productivity, innovation and ICT in Old and New Europe. International Economics and Economic Policy 1: 215–46. [Google Scholar] [CrossRef]
- Van Dijk, Jan, and Kenneth Hacker. 2003. The digital divide as a complex and dynamic phenomenon. The Information Society 19: 315–26. [Google Scholar] [CrossRef]
- Williamson, Claudia. 2009. Informal institutions rule: Institutional arrangements and economic performance. Public Choice 139: 371–87. [Google Scholar] [CrossRef]
- World Bank. 2020a. Worldwide Governance Indicators. Available online: http://databank.worldbank.org/data/reports.aspx?source=worldwide-governance-indicators (accessed on 16 February 2021).
- World Bank. 2020b. World Development Indicators. Available online: http://databank.worldbank.org/data/reports.aspx?source=world-development-indicators (accessed on 16 February 2021).
- Xing, Zhongwei. 2018. The impacts of Information and Communications Technology (ICT) and E-commerce on bilateral trade flows. International Economics and Economic Policy 15: 565–86. [Google Scholar] [CrossRef]
- Zheng, Zhijie, Tapas Mishra, and Yibai Yang. 2020. Inflation and income inequality in a variety-expansion growth model with menu costs. Economics Letters 194: 109373. [Google Scholar] [CrossRef]
- Ziemba, Ewa, Tomasz Papaj, Rafal Żelazny, and Maria Jadamus-Hacura. 2016. Factors Influencing The Success Of E-Government. Journal of Computer Information Systems 56: 156–67. [Google Scholar] [CrossRef]
- Zuiderwijk, Anneke, and Marijin Janssen. 2014. Open data policies, their implementation and impact: A framework for comparison. Government Information Quarterly 31: 17–29. [Google Scholar] [CrossRef]

| Variables | IQI | POLS | RQ | ROL | VAC | GEFF | CCORR |
|---|---|---|---|---|---|---|---|
| IQI | 1.000 | ||||||
| POLS | 0.800 | 1.000 | |||||
| RQ | 0.921 | 0.599 | 1.000 | ||||
| ROL | 0.975 | 0.744 | 0.898 | 1.000 | |||
| VAC | 0.835 | 0.662 | 0.707 | 0.775 | 1.000 | ||
| GEFF | 0.945 | 0.667 | 0.923 | 0.927 | 0.682 | 1.000 | |
| CCORR | 0.956 | 0.728 | 0.854 | 0.943 | 0.744 | 0.91 | 1.000 |
| Variables | Sample |
|---|---|
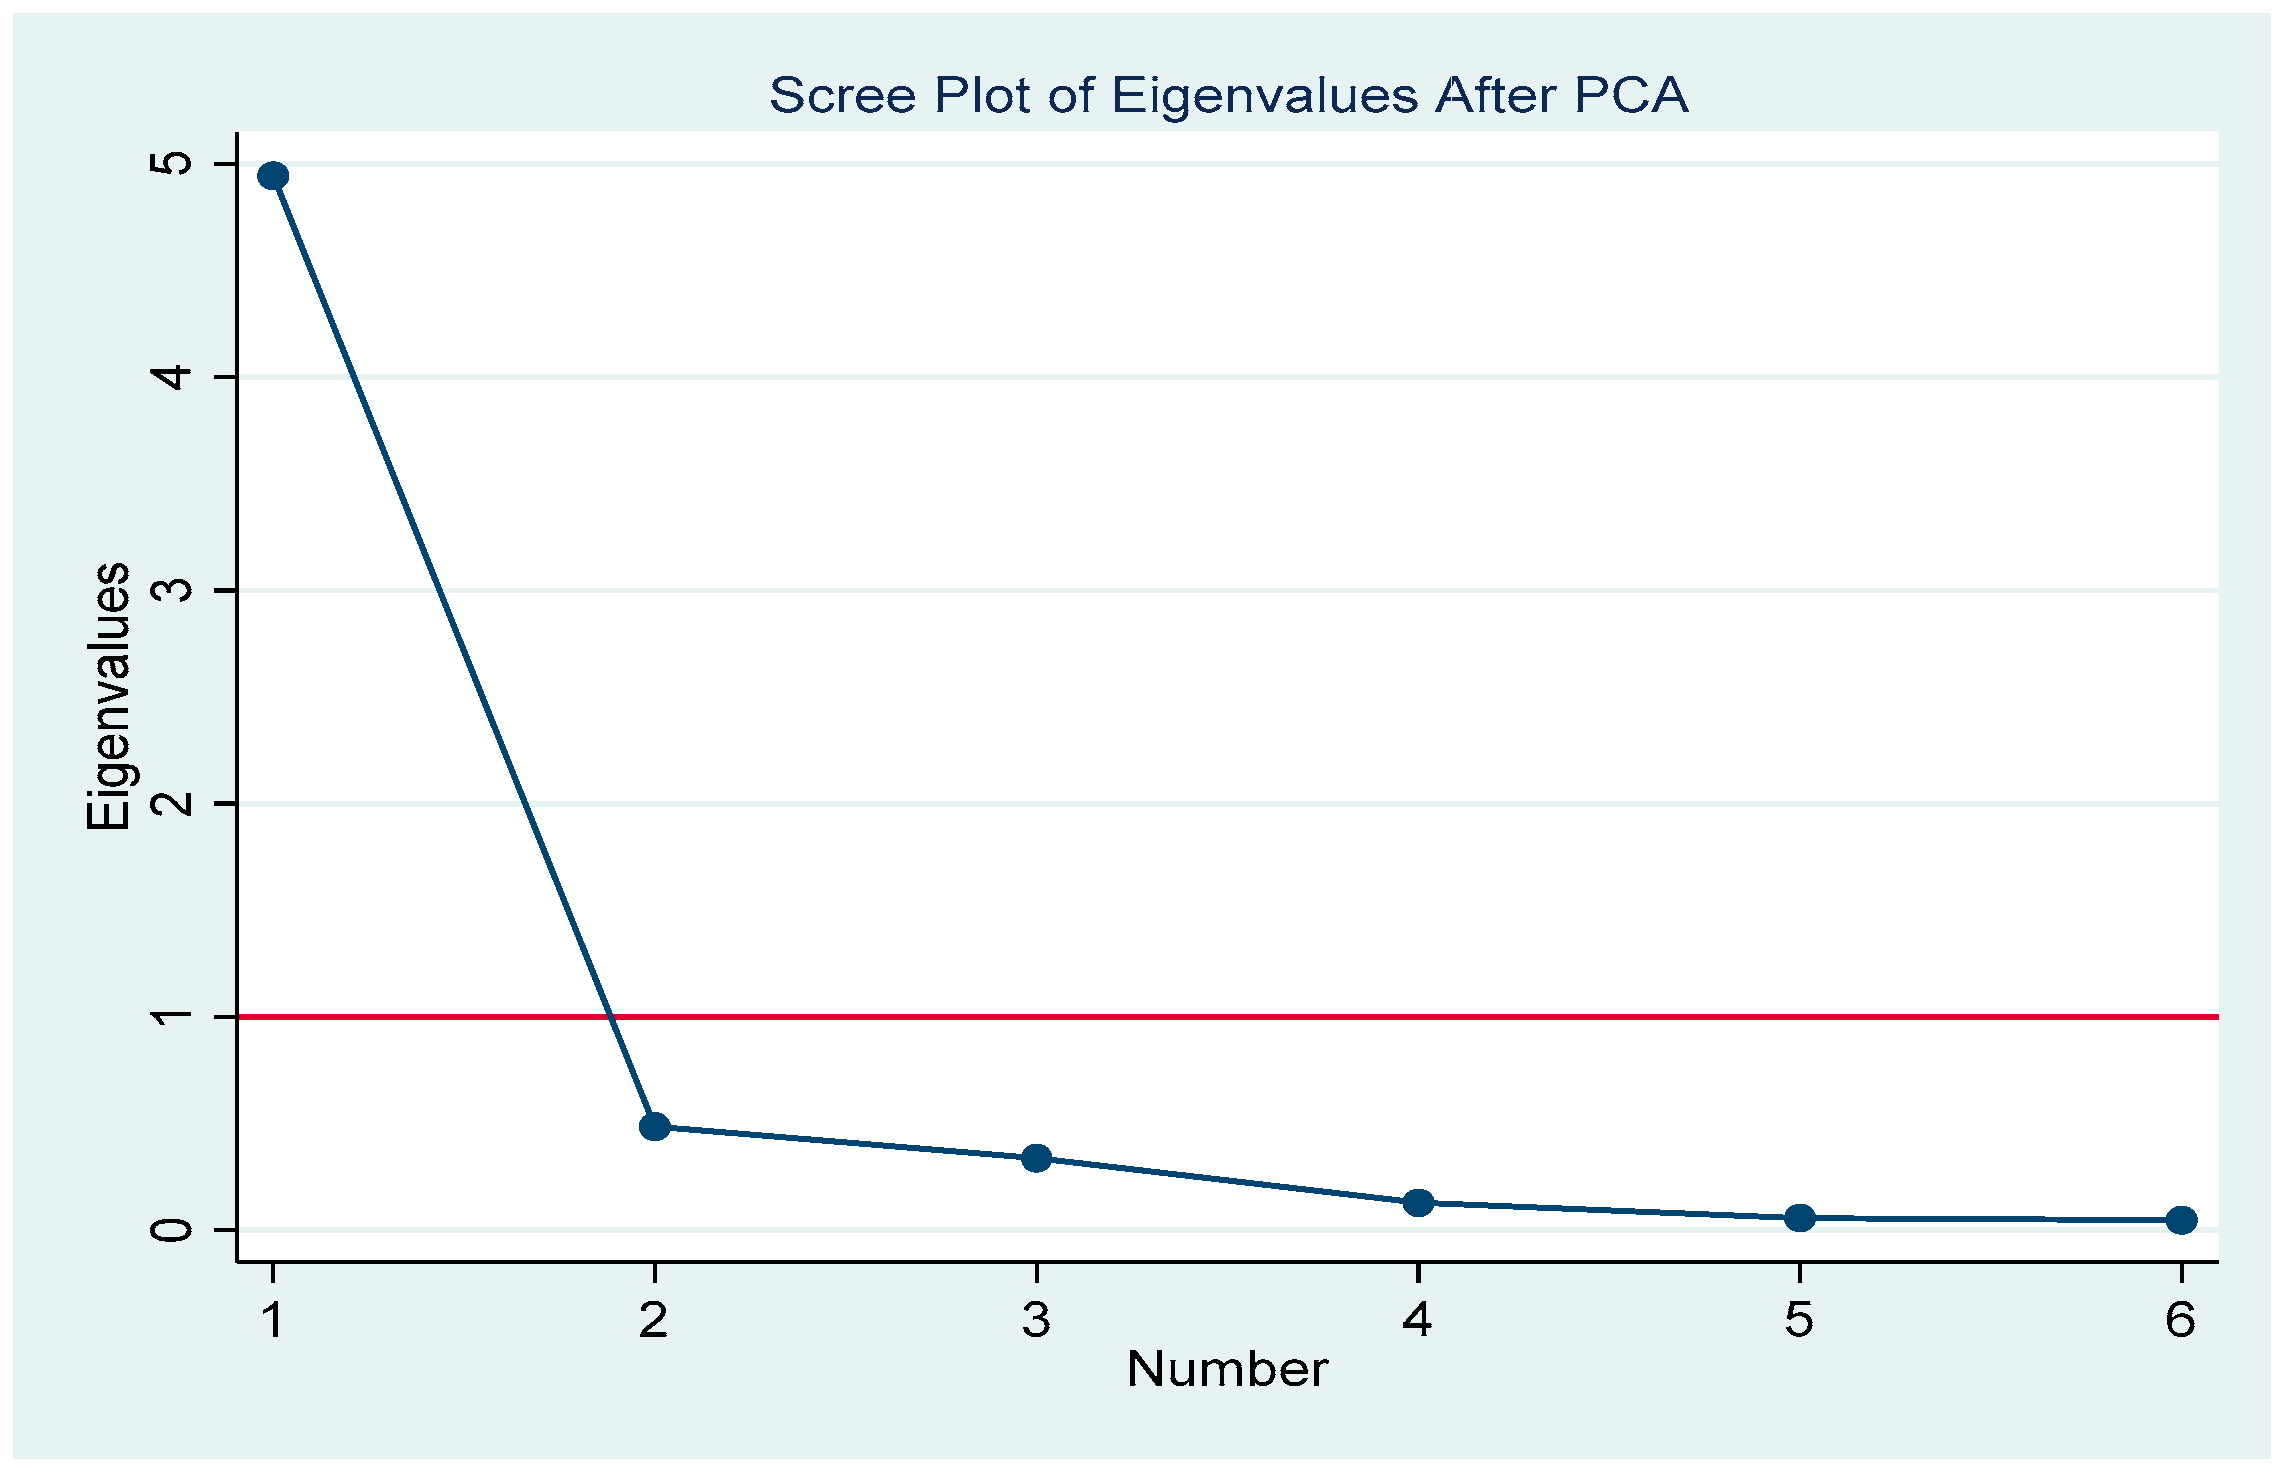
| PCA eigenvectors (highest) | 4.9444 |
| Proportion explained | 0.8241 |
| Kaiser-Meyer-Olkin | 0.8848 |
| Variables | Description | Sign | Source |
|---|---|---|---|
| lnHDI | Human Development Index | N/A | UNDP (2019) |
| IQI * | Institutional Quality Index | + | Authors’ Computation |
| lnMOB | Mobile cellular subscriptions | + | World Bank (2020b) WDI |
| lnFTEL | Fixed telephone subscriptions | + | World Bank (2020b) WDI |
| lnLAB | Labour force participation rate, total (% of total population ages 15+) | + | World Bank (2020b) WDI |
| lnGCF | Gross capital formation (% of GDP) | + | World Bank (2020b) WDI |
| INFL | Inflation, consumer prices (annual %) | + | World Bank (2020b) WDI |
| lnTR | Trade (% of GDP) | + | World Bank (2020b) WDI |
| lnNET | Individuals using the Internet (% of population) | + | World Bank (2020b) WDI |
| Variables | lnHDI | IQI | lnMOB | lnFTEL | lnLAB | lnGCF | INFL | lnTR | lnNET |
|---|---|---|---|---|---|---|---|---|---|
| lnHDI | 1.000 | ||||||||
| IQI | 0.729 *** | 1.000 | |||||||
| lnMOB | 0.071 *** | −0.140 *** | 1.000 | ||||||
| lnFTEL | 0.553 *** | 0.228 *** | 0.795 *** | 1.000 | |||||
| lnLAB | −0.182 *** | 0.060 ** | −0.037 | −0.185 *** | 1.000 | ||||
| lnGCF | 0.034 | −0.019 | 0.043 * | −0.02 | 0.095 *** | 1.000 | |||
| INFL | −0.148 *** | −0.281 *** | 0.137 *** | 0.036 | −0.015 | 0.002 | 1.000 | ||
| lnTR | 0.342 *** | 0.398 *** | −0.416 *** | −0.176 *** | −0.007 | 0.127 *** | −0.246 *** | 1.000 | |
| lnNET | 0.883 *** | 0.663 *** | 0.055 ** | 0.443 *** | −0.182 *** | −0.014 | −0.141 | 0.304 | 1.000 |
| Summary Statistics | |||||||||
| Obs | 1773 | 1884 | 1834 | 1836 | 1770 | 1648 | 1731 | 1736 | 1652 |
| Mean | 0.706 | 0 | 35,446,936 | 4,963,517 | 62.076 | 24.706 | 4.444 | 93.453 | 46.109 |
| Std. Dev. | 0.151 | 2.224 | 1.28 × 10⁸ | 19,765,275 | 10.463 | 8.731 | 8.852 | 57.294 | 29.158 |
| Minimum | 0.331 | −5 | 1600 | 0 | 36.83 | −0.098 | −4.298 | 0.2 | 0.25 |
| Maximum | 0.957 | 4.997 | 1.75 × 10⁹ | 2.94 × 10⁸ | 89.05 | 77.89 | 254.949 | 442.62 | 99.702 |
| Variables | Mobile Phones | Fixed Telephones | |||||
|---|---|---|---|---|---|---|---|
| [1] | [2] | [3] | [4] | [5] | [6] | [7] | |
| lnLAB | −0.0769 *** | −0.0680 *** | −0.0623 *** | −0.0615 *** | −0.0742 *** | −0.0672 *** | −0.0682 *** |
| (−8.652) | (−7.647) | (−6.878) | (−6.397) | (−7.341) | (−6.767) | (−7.167) | |
| lnGCF | 0.00453 * | 0.00488 ** | 0.00444 * | 0.00428 | 0.00583 ** | 0.00540 ** | 0.00578 ** |
| (1.808) | (1.986) | (1.730) | (1.628) | (2.385) | (2.126) | (2.142) | |
| INFL | 0.000422 ** | 0.000326 ** | 0.000406 *** | 0.000410 ** | 0.000324 ** | 0.000411 ** | 0.000421 ** |
| (2.539) | (2.215) | (2.630) | (2.572) | (2.092) | (2.513) | (2.578) | |
| lnTR | −0.00522 *** | −0.00722 *** | −0.00730 *** | −0.00698 *** | −0.00519 *** | −0.00545 *** | −0.00519 *** |
| (−4.134) | (−5.161) | (−5.655) | (−5.637) | (−3.379) | (−4.115) | (−4.254) | |
| lnNET | 0.0171 *** | 0.0138 *** | 0.0134 *** | 0.0137 *** | 0.0173 *** | 0.0167 *** | 0.0164 *** |
| (7.489) | (6.977) | (6.947) | (6.344) | (7.128) | (7.393) | (7.581) | |
| IQI | 0.00660 *** | 0.00614 *** | −0.00280 | 0.00666 *** | −0.0136 | ||
| (5.865) | (4.850) | (−0.226) | (5.278) | (−1.450) | |||
| lnICT | 0.0111 *** | 0.0103 *** | 0.0112 *** | −0.00480 *** | −0.00468 *** | −0.00257 *** | |
| (4.922) | (4.288) | (3.646) | (−4.122) | (−4.197) | (−2.991) | ||
| IQI*lnICT | 0.000561 | 0.00150 ** | |||||
| (0.726) | (2.213) | ||||||
| Constant | −0.116 *** | −0.309 *** | −0.318 *** | −0.338 *** | −0.0598 * | −0.0874 *** | −0.116 *** |
| (−3.149) | (−6.206) | (−5.861) | (−4.561) | (−1.697) | (−2.640) | (−2.984) | |
| Year Dummies | Yes | Yes | Yes | Yes | Yes | Yes | Yes |
| Observations | 1322 | 1320 | 1320 | 1320 | 1302 | 1302 | 1302 |
| Number of groups | 152 | 152 | 152 | 152 | 151 | 151 | 151 |
| F-Statistic | 4.9 × 10⁶ | 1.383 × 10⁶ | 4.53 × 10⁶ | 2.774 × 10⁶ | 3.85 × 10⁶ | 1.972 × 10⁶ | 36,948 |
| Variables | Mobile Phones | Fixed Telephones | |||||
|---|---|---|---|---|---|---|---|
| [1] | [2] | [3] | [4] | [5] | [6] | [7] | |
| lnLAB | −0.0630 *** | −0.262 | −0.0626 *** | −0.0610 *** | 0.0507 ** | −0.0450 *** | −0.0453 *** |
| (−3.605) | (−0.746) | (−3.605) | (−3.463) | (2.265) | (−2.802) | (−2.828) | |
| lnGCF | 0.0203 ** | 0.259 | 0.0187 * | 0.0191 ** | 0.000850 | 0.0240 ** | 0.0221 ** |
| (2.126) | (0.939) | (1.917) | (1.967) | (0.0634) | (2.570) | (2.340) | |
| INFL | 0.000880 | 0.0283 | 0.000660 | 0.000805 | −0.00240 *** | 0.000541 | 0.000441 |
| (1.453) | (1.014) | (1.080) | (1.312) | (−3.528) | (1.050) | (0.835) | |
| lnTR | 0.00274 | −1.089 | 0.0118 | 0.0121 | 0.118 *** | 0.0304 *** | 0.0292 ** |
| (0.288) | (−0.979) | (0.953) | (0.994) | (8.435) | (2.604) | (2.493) | |
| lnNET | 0.176 *** | 0.548 * | 0.172 *** | 0.173 *** | 0.114 *** | 0.149 *** | 0.146 *** |
| (39.44) | (1.734) | (38.78) | (38.17) | (7.308) | (30.73) | (27.19) | |
| IQI | 0.0288 *** | 0.0294 *** | 0.00864 | 0.0269 *** | 0.0412 *** | ||
| (18.71) | (19.42) | (0.767) | (17.05) | (4.928) | |||
| lnICT | −0.860 | 0.00708 *** | 0.00673 *** | 0.0659 *** | 0.0194 *** | 0.0193 *** | |
| (−1.059) | (3.256) | (2.973) | (6.686) | (12.23) | (12.28) | ||
| IQI*lnICT | 0.00128 * | −0.000983 * | |||||
| (1.846) | (−1.885) | ||||||
| Constant | −0.804 *** | 16.79 | −0.942 *** | −0.950 *** | −2.377 *** | −1.178 *** | −1.153 *** |
| (−8.893) | (0.966) | (−8.498) | (−8.658) | (−13.72) | (−12.27) | (−11.54) | |
| Year Dummies | Yes | Yes | Yes | Yes | Yes | Yes | Yes |
| Observations | 1173 | 1167 | 1171 | 1171 | 1148 | 1154 | 1154 |
| R-squared | 0.870 | 0.873 | 0.871 | 0.872 | 0.761 | 0.885 | 0.885 |
| F-Statistic | 494.6 | 123.671 | 470.4 | 445.5 | 249.2 | 521.8 | 522.6 |
| Hansen p-value | 0.259 | 0.998 | 0.319 | 0.299 | 0.118 | 0.340 | 0.374 |
| Variables | Mobile Cellular Subscription Model | ||||||||
|---|---|---|---|---|---|---|---|---|---|
| Q = 0.25 | Q = 0.50 | Q = 0.75 | Q = 0.25 | Q = 0.50 | Q = 0.75 | Q = 0.25 | Q = 0.50 | Q = 0.75 | |
| lnLAB | −0.0361 ** | −0.0777 *** | −0.0879 *** | 0.0198 | −0.0161 | −0.0287 | −0.0362 ** | −0.0807 *** | −0.0975 *** |
| (−2.148) | (−4.992) | (−4.934) | (0.810) | (−0.717) | (−1.366) | (−2.241) | (−4.262) | (−5.589) | |
| lnGCF | 0.00542 | 0.0268 *** | 0.0360 *** | −0.00491 | 0.00314 | −0.000862 | 0.00814 | 0.0289 *** | 0.0382 *** |
| (0.500) | (3.211) | (4.195) | (−0.323) | (0.267) | (−0.116) | (0.731) | (3.072) | (4.056) | |
| INFL | −0.00103 | 0.00172 ** | 0.00169 *** | −0.00293 * | −0.00102 | −0.00125 ** | −0.00132 | 0.00152 | 0.00113 *** |
| (−0.688) | (2.081) | (3.849) | (−1.693) | (−1.183) | (−2.367) | (−0.911) | (1.531) | (2.855) | |
| lnTR | 0.00553 | 0.00756 ** | 0.00402 | 0.0383 *** | 0.0439 *** | 0.0311 *** | 0.0173 *** | 0.0170 *** | 0.0154 *** |
| (1.136) | (2.326) | (0.819) | (4.187) | (6.996) | (5.558) | (4.125) | (4.031) | (3.104) | |
| lnNET | 0.192 *** | 0.171 *** | 0.153 *** | 0.233 *** | 0.210 *** | 0.194 *** | 0.186 *** | 0.168 *** | 0.146 *** |
| (31.15) | (30.04) | (29.68) | (38.07) | (54.04) | (50.73) | (32.35) | (28.28) | (26.30) | |
| IQI | 0.0279 *** | 0.0267 *** | 0.0249 *** | 0.0117 | 0.00409 | 0.0393 *** | |||
| (17.40) | (22.56) | (15.15) | (0.956) | (0.417) | (3.229) | ||||
| lnMOB | 0.00763 *** | 0.00665 *** | 0.00624 *** | 0.00713 *** | 0.00540 *** | 0.00933 *** | |||
| (2.848) | (3.048) | (3.598) | (3.451) | (3.103) | (4.913) | ||||
| IQI*lnMOB | 0.00105 | 0.00137 ** | −0.000862 | ||||||
| (1.421) | (2.275) | (−1.186) | |||||||
| Constant | −0.929 *** | −0.719 *** | −0.584 *** | −1.500 *** | −1.262 *** | −1.044 *** | −1.085 *** | −0.835 *** | −0.729 *** |
| (−11.24) | (−9.501) | (−8.321) | (−11.42) | (−10.20) | (−10.76) | (−14.01) | (−8.257) | (−9.349) | |
| Year Dummies | Yes | Yes | Yes | Yes | Yes | Yes | Yes | Yes | Yes |
| Replications | 100 | 100 | 100 | 100 | 100 | 100 | 100 | 100 | 100 |
| Observations | 1322 | 1322 | 1322 | 1320 | 1320 | 1320 | 1320 | 1320 | 1320 |
| Fixed Telephone Subscription Model | |||||||||
| lnLAB | −0.0361 ** | −0.0777 *** | −0.0879 *** | 0.0255 | 0.0161 | −0.00836 | −0.0139 | −0.0505 *** | −0.0775 *** |
| (−1.965) | (−4.336) | (−4.207) | (1.274) | (0.693) | (−0.409) | (−0.767) | (−3.375) | (−5.803) | |
| lnGCF | 0.00542 | 0.0268 *** | 0.0360 *** | 0.000803 | 0.00898 | 0.00306 | 0.000747 | 0.0333 *** | 0.0481 *** |
| (0.469) | (2.914) | (3.472) | (0.0518) | (0.819) | (0.257) | (0.0960) | (4.104) | (5.640) | |
| INFL | −0.00103 | 0.00172 ** | 0.00169 *** | −0.00231 ** | −0.00137 | −0.00158 ** | −0.00205 * | 0.000727 | 0.000574 ** |
| (−0.654) | (2.577) | (4.388) | (−2.274) | (−1.430) | (−2.248) | (−1.702) | (0.878) | (2.075) | |
| lnTR | 0.00553 | 0.00756 ** | 0.00402 | 0.0720 *** | 0.0588 *** | 0.0476 *** | 0.0263 *** | 0.0245 *** | 0.0193 *** |
| (1.217) | (2.494) | (0.866) | (9.647) | (11.39) | (8.594) | (5.527) | (5.912) | (4.279) | |
| lnNET | 0.192 *** | 0.171 *** | 0.153 *** | 0.193 *** | 0.186 *** | 0.165 *** | 0.165 *** | 0.146 *** | 0.122 *** |
| (33.92) | (26.79) | (25.83) | (26.75) | (37.96) | (23.95) | (35.37) | (21.91) | (22.20) | |
| IQI | 0.0279 *** | 0.0267 *** | 0.0249 *** | 0.0502 *** | 0.0507 *** | 0.0535 *** | |||
| (18.01) | (19.79) | (13.85) | (5.264) | (5.544) | (7.853) | ||||
| lnFTEL | 0.0236 *** | 0.0188 *** | 0.0183 *** | 0.0177 *** | 0.0161 *** | 0.0156 *** | |||
| (12.23) | (10.17) | (10.99) | (9.669) | (9.772) | (13.31) | ||||
| IQI*lnFTEL | −0.00167 *** | −0.00176 *** | −0.00200 *** | ||||||
| (−2.663) | (−3.044) | (−4.558) | |||||||
| Constant | −0.929 *** | −0.719 *** | −0.584 *** | −1.764 *** | −1.560 *** | −1.267 *** | −1.248 *** | −1.058 *** | −0.840 *** |
| (−10.66) | (−7.894) | (−6.476) | (−20.36) | (−15.00) | (−12.89) | (−12.84) | (−13.52) | (−13.29) | |
| Year Dummies | Yes | Yes | Yes | Yes | Yes | Yes | Yes | Yes | Yes |
| Replications | 100 | 100 | 100 | 100 | 100 | 100 | 100 | 100 | 100 |
| Observations | 1322 | 1322 | 1322 | 1302 | 1302 | 1302 | 1302 | 1302 | 1302 |
| Variables | Mobile Phones Model | Fixed Telephones Model | ||||||
|---|---|---|---|---|---|---|---|---|
| High | Low | Lower-Mid | Upper-Mid | High | Low | Lower-Mid | Upper-Mid | |
| lnLAB | 0.0831 *** | −0.492 *** | −0.146 *** | 0.0664 * | 0.0793 *** | −0.487 *** | −0.147 *** | 0.0664 * |
| (5.305) | (−10.22) | (−7.179) | (1.797) | (5.458) | (−13.32) | (−5.405) | (1.748) | |
| lnGCF | 0.00346 | −0.00522 ** | 0.0106 * | 0.00434 *** | 0.00384 | −0.00441 * | 0.0105 ** | 0.00529 *** |
| (1.206) | (−2.158) | (2.016) | (2.835) | (1.410) | (−2.016) | (2.033) | (2.993) | |
| INFL | 0.000284 | 0.000197 * | 0.000345 | 0.000346 *** | 0.000476 ** | 0.000199 | 0.000370 * | 0.000352 *** |
| (1.495) | (1.711) | (1.396) | (3.552) | (2.110) | (1.228) | (2.011) | (3.747) | |
| lnTR | −0.00254 | −0.000790 | −0.00106 | −0.000684 | −0.00163 | −0.0100 * | −0.00210 | −0.00652 ** |
| (−0.988) | (−0.225) | (−0.418) | (−0.237) | (−0.503) | (−2.041) | (−1.290) | (−2.042) | |
| lnNET | 0.0169 *** | 0.00587 * | 0.00332 ** | 0.00554 * | 0.0142 * | 0.00725 ** | 0.00504 *** | 0.00650 *** |
| (2.700) | (1.942) | (2.088) | (1.984) | (1.877) | (2.077) | (3.270) | (2.786) | |
| IQI | 0.0605 *** | 0.0589 ** | −0.0608 ** | −0.0525 *** | 0.0244 * | 0.0497 ** | −0.0795 *** | −0.0151 |
| (5.343) | (2.368) | (−2.286) | (−2.771) | (1.803) | (2.731) | (−3.880) | (−1.519) | |
| lnICT | 0.0137 *** | 0.00147 | 0.0143 * | 0.00534 | 0.00758 ** | −0.0108 *** | 0.0116 *** | −0.00638 |
| (3.837) | (0.181) | (1.875) | (0.871) | (2.026) | (−4.542) | (3.513) | (−1.350) | |
| IQI*lnICT | −0.00331 *** | −0.00271 * | 0.00401 ** | 0.00312 *** | −0.00116 | −0.00310 * | 0.00641 *** | 0.000979 |
| (−5.109) | (−1.743) | (2.471) | (2.758) | (−1.448) | (−1.784) | (4.262) | (1.599) | |
| Constant | −0.801 *** | 1.302 *** | −0.187 | −0.708 *** | −0.671 *** | 1.454 *** | −0.105 | −0.512 *** |
| (−9.304) | (4.592) | (−1.547) | (−3.093) | (−6.489) | (9.555) | (−0.930) | (−5.193) | |
| Year Dummies | Yes | Yes | Yes | Yes | Yes | Yes | Yes | Yes |
| Observations | 449 | 195 | 327 | 349 | 447 | 179 | 327 | 349 |
| Groups | 47 | 25 | 39 | 41 | 47 | 24 | 39 | 41 |
| F-Statistic | 35983 | 5171 | 46822 | 753923 | 21685 | 542.2 | 81923 | 58437 |
| Variables | Mobile Phones Model | Fixed Telephones Model | ||||||
|---|---|---|---|---|---|---|---|---|
| High | Low | Lower-Mid | Upper-Mid | High | Low | Lower-Mid | Upper-Mid | |
| lnLAB | −0.0410 *** | −0.114 * | −0.0243 | −0.0384 ** | −0.0172 | −0.0901 | −0.00853 | −0.0419 *** |
| (−3.524) | (−1.809) | (−0.901) | (−2.399) | (−1.322) | (−0.621) | (−0.326) | (−2.827) | |
| lnGCF | 0.00384 | −0.0350 * | 0.0291 ** | 0.0218 * | 0.00920 * | −0.467 *** | 0.0445 *** | 0.0217 * |
| (0.745) | (−1.757) | (2.217) | (1.726) | (1.800) | (−3.310) | (3.796) | (1.792) | |
| INFL | −0.00495 *** | 0.00229 ** | 0.000742 | 0.00154 *** | −0.00428 *** | 0.0175 *** | 0.000388 | 0.00115 *** |
| (−7.253) | (2.109) | (0.633) | (4.274) | (−6.102) | (2.812) | (0.376) | (3.476) | |
| lnTR | 0.00727 *** | −0.00850 | −0.00503 | 0.0186 *** | 0.0107 *** | 0.717 *** | 0.00920 | 0.0253 *** |
| (3.205) | (−0.382) | (−0.336) | (3.118) | (4.773) | (3.275) | (0.524) | (4.936) | |
| lnNET | 0.0825 *** | 0.108 *** | 0.104 *** | 0.129 *** | 0.0807 *** | 0.0818 *** | 0.0755 *** | 0.116 *** |
| (7.491) | (8.998) | (9.120) | (14.67) | (7.528) | (3.334) | (6.348) | (12.61) | |
| IQI | 0.0828 *** | 0.133 | −0.132 *** | 0.125 *** | 0.0743 *** | −3.315 *** | −0.0595 * | 0.0664 *** |
| (6.561) | (0.816) | (−3.315) | (6.289) | (7.190) | (−3.135) | (−1.889) | (5.548) | |
| lnICT | 0.0200 *** | −0.00211 | 0.0174 *** | 0.00343 * | 0.0209 *** | 0.886 *** | 0.0327 *** | 0.00736 *** |
| (8.971) | (−0.0774) | (4.933) | (1.953) | (9.490) | (3.264) | (6.918) | (4.620) | |
| IQI*lnICT | −0.00373 *** | −0.00939 | 0.0106 *** | −0.00692 *** | −0.00372 *** | 0.289 *** | 0.00767 *** | −0.00381 *** |
| (−4.824) | (−0.917) | (4.061) | (−5.073) | (−5.224) | (3.125) | (2.960) | (−3.936) | |
| Constant | −0.731 *** | −0.495 | −1.006 *** | −0.838 *** | −0.831 *** | −12.37 *** | −1.234 *** | −0.843 *** |
| (−10.39) | (−0.978) | (−7.768) | (−8.897) | (−11.56) | (−3.354) | (−10.38) | (−8.990) | |
| Year Dummies | Yes | Yes | Yes | Yes | Yes | No | Yes | Yes |
| Observations | 402 | 171 | 289 | 309 | 400 | 132 | 289 | 309 |
| R-squared | 0.814 | 0.446 | 0.526 | 0.730 | 0.822 | −7.735 | 0.598 | 0.743 |
| F-Statistic | 156.9 | 12.86 | 31.46 | 99.99 | 140.6 | 5.436 | 34.44 | 132.0 |
| Hansen p-value | 0.304 | 0.0566 | 0.945 | 0.0891 | 0.374 | 0.105 | 0.755 | 0.116 |
Disclaimer/Publisher’s Note: The statements, opinions and data contained in all publications are solely those of the individual author(s) and contributor(s) and not of MDPI and/or the editor(s). MDPI and/or the editor(s) disclaim responsibility for any injury to people or property resulting from any ideas, methods, instructions or products referred to in the content. |
© 2023 by the authors. Licensee MDPI, Basel, Switzerland. This article is an open access article distributed under the terms and conditions of the Creative Commons Attribution (CC BY) license (https://creativecommons.org/licenses/by/4.0/).
Share and Cite
Adeleye, B.N.; Arogundade, S.; Mduduzi, B. Empirical Analysis of Inclusive Growth, Information and Communication Technology Adoption, and Institutional Quality. Economies 2023, 11, 124. https://doi.org/10.3390/economies11040124
Adeleye BN, Arogundade S, Mduduzi B. Empirical Analysis of Inclusive Growth, Information and Communication Technology Adoption, and Institutional Quality. Economies. 2023; 11(4):124. https://doi.org/10.3390/economies11040124
Chicago/Turabian StyleAdeleye, Bosede Ngozi, Sodiq Arogundade, and Biyase Mduduzi. 2023. "Empirical Analysis of Inclusive Growth, Information and Communication Technology Adoption, and Institutional Quality" Economies 11, no. 4: 124. https://doi.org/10.3390/economies11040124