Article

The Economic Nexus between Energy, Water Consumption, and Food Production in the Kingdom of Saudi Arabia

1
Unit of Food Security, Agricultural Economics Department, College of Food and Agricultural Sciences, King Saud University, Riyadh 11451, Saudi Arabia
2
Egypt Ministry of Agriculture and Land Reclamation, Agricultural Economics Research Institute, Giza 3751310, Egypt
3
Department of Agricultural Extension and Rural Society, King Saud University, Riyadh 11451, Saudi Arabia
*
Author to whom correspondence should be addressed.
Economies 2023, 11(4), 113; https://doi.org/10.3390/economies11040113
Submission received: 19 January 2023 / Revised: 29 March 2023 / Accepted: 31 March 2023 / Published: 9 April 2023

Abstract

:
The goal of this study was to look at the economic relationship between energy, water use, and plant and animal food production in Saudi Arabia from 1995 to 2020. The results showed that about 55.5%, 82.4%, and 2.5% of changes in the index of plant and animal food production were related to changes in the consumption of water, electricity, and diesel, respectively, using an econometric analysis and the partial correlation coefficient of the second order. The proposed model demonstrated that a 10% change in predicted water, power, or fuel consumption resulted in a 1.97%, 2.78%, and 0.73% change in the index of plant and animal food production, respectively. In light of the Green Middle East Initiative, which intended to minimize carbon emissions, and Saudi agriculture’s goal of rationalizing water use, the country’s total consumption does not exceed 8 billion m3 of renewable groundwater. This is intended to reduce the use of fuel and increase the use of electricity in the agricultural sector. This rationalizing water consumption, reducing diesel consumption, and expanding electricity consumption affects the production of plant and animal food. In light of the strong interdependence between water, energy, and food production, the agricultural policy has become necessary to increase the amount supplied or available for water to be used in food production, in addition to expanding the production of clean energy and its use in the agricultural sector.

1. Introduction

The agricultural sector contributes to food security and self-sufficiency by playing a vital role in food production. Water resources are some of the most important factors of agricultural productivity, according to one study (Ghanem and Al-Nashwan 2021b), which found that they contributed roughly 23.6% of the entire value of agricultural output from 1990 to 2019. The increasing demand for water for domestic, industrial, and agricultural needs is putting a strain on renewable surface and groundwater resources. The study by Alrwis et al. (2021) was concerned with measuring the impact of the scarcity of water resources on agricultural economic development in the Kingdom of Saudi Arabia. This research found that if there is a scarcity of water resources accessible to the agricultural sector, the overall cultivated area will decrease, lowering the value of agricultural output and GDP. According to the National Water Strategy, if current water consumption trends continue, the water reserve in some regions of the sedimentary shelf may be depleted within the next 12 years (Ministry of Environment, Water and Agriculture 2018).
In addition, energy is needed in agriculture. According to a report by the National Center for Energy Research (2015), Jordan’s agricultural sector utilizes roughly 3.2% of the country’s energy. Diesel accounted for 5.1% of total consumption in the agricultural sector, gasoline accounted for 0.18%, liquefied gas accounted for 2.4%, and electric power accounted for 1.6%. In the Kingdom of Saudi Arabia, public power is utilized for irrigation in roughly 44.7% of the land. The overall volume of petroleum products utilized in agricultural holdings was around 1.862 million liters, where diesel accounted for approximately 98.0%, gasoline for 0.9%, and oil for 1.0% (General Authority for Statistics 2015). Some farmers have resorted to contracting with the Saudi Electricity Company to light farms and operate wells because of the rise in diesel prices and the implementation of the environmental protection program against pollution. Agricultural subscribers climbed from 54.55 thousand in 2005, accounting for 1.1% of total electricity subscribers (4.96 million), to 97.08 thousand in 2019, accounting for 0.99% of total electricity subscribers (9.76 million) (Saudi Central Bank 2021).
Water and energy usage are inextricably tied to achieving food sovereignty. According to a study by Ghanem and Al-Nashwan (2021b), increasing the area planted with palm trees by 10% results in a 9.5% increase in the amount of water utilized to attain food sovereignty for dates. According to a study by Ghanem and Al-Nashwan (2021a), the total amount of water used in grain production was 136.32 billion m3, accounting for 27.0% of total water utilized in the agricultural sector from 1990 to 2020. The study by El-Gafy (2017) examined the relationship between water, food, and energy by using several indicators that consider water and energy consumption, total productivity, and economic productivity. This study showed that the water-food-energy nexus index (WFENI) for summer crops in Egypt ranged from a minimum of 0.21 for rice to a maximum of 0.79 for onions.
A review of the findings of past studies discovered that research and economic studies on the link between water and energy usage on one hand and food production on the other are sparse and inaccessible. As a result, the focus of this research was on determining the economic interdependence of water and energy in the production of plant and animal food in Saudi Arabia.
The Food and Agriculture Organization (2014) indicated that water, energy, and food are essential elements for human well-being, poverty reduction, and sustainable development. In light of ongoing population growth, the demand for water, energy, and food will increase over the coming decades. Global energy consumption is expected to increase by 50% by 2035, and water consumption for agricultural purposes is expected to increase by 10% by 2050.
Claudia Ringler et al. (2016) addressed the General Assembly of the United Nations on the water-energy-food (WEF) nexus. Their suggested goals and related targets for 2030 included (1) end hunger, achieve food security and improved nutrition, and promote sustainable agriculture (SDG2); (2) ensure the availability and sustainable management of water and sanitation for all (SDG6); and (3) ensure access to affordable, reliable, sustainable, and modern energy for all (SDG7). There will be tradeoffs between achieving these goals particularly in the wake of changing consumption patterns and rising demands from a growing population expected to reach more than nine billion by 2050. This paper uses global economic analysis tools to assess the impacts of long-term changes in fossil fuel prices, for example, as a result of a carbon tax under the UNFCCC or in response to new, large findings of fossil energy sources, on water and food outcomes. We find that a fossil fuel tax would not adversely affect food security and could be a boon to global food security if it reduces adverse climate change impacts.
A study by Mahlknecht et al. (2020) showed that achieving sustainable development in Latin America and the Caribbean depends on improving the prices of food commodities, in addition to paying attention to energy, water, and food security. This study also showed an increase in the need to develop infrastructure to reduce energy consumption and to produce clean energy. Water scarcity is expected to increase in light of the instability of rainfall, which requires improved water management and availability and the promotion of good agricultural practices and sustainable food systems.
Saul Ngarava (2021) studied the relationship between water-energy-food (WEF) nexus and margins for the lateral transmission of price volatilities within several sectors. The problem was that any inflationary price tendencies in one of the WEF sectors will have direct and indirect effects on the others. The objective of the study was to determine the relationships between inflation in food, energy, and water and determine whether there were spillovers in South Africa. Monthly consumer price indices for food, energy, and water for the period from January 2002 to December 2020 were used. The parsimonious vector autoregressive (VAR) model was used in the data analysis. The study found that prior to 2013, the inflation rate was higher for food relative to water and to energy, separately. After 2017, water had a higher inflation rate relative to energy and to food, separately. Furthermore, energy inflation had a positive impact on both water inflation and food inflation, while water inflation also had positive impact on food inflation. The study concludes that there is a nexus in the lateral inflation between food, energy, and water. Its recommendations included building resilience within the nexus by decoupling food and other sectors from fossil-fuel-derived energy.
Ziyu Pan et al. (2021) studied the shortage of water resources that restrict the economic development in Northwest China. Guiding the decoupling between regional economic development and water consumption is a critical way to achieve sustainable development. Based on the analysis of the food and energy production value and their water consumption in Northwest China from 2009 to 2019, this paper used the Tapio model to analyze the decoupling relationship between food, energy production, and water consumption and used factors derived from the logarithmic mean divisional index (LMDI) model that affect decoupling. The results showed that most water consumption for food and energy production in Northwest China was out of the ideal strong decoupling, the decoupling status was unstable, and recoupling occurred frequently. The increase in water intensity and the change in industrial structure were the promoting factors of decoupling between production value and water consumption in food and energy in Northwest China, while the increase in production value and the increase in population size were the main restraining factors. Therefore, in search of strong decoupling, the government should guide the food and energy industry to move toward implementing water-saving measures in policies and promote the enthusiasm and efficiency of the labor force through financial support and other ways. Moreover, ecological protective measures, such as water source protection and sewage treatment, need to be strengthened.
By reviewing the methods and results of previous studies, it was found that some studies relied on the calculation of simple correlation coefficients, while others used the one-equation model. This study can be distinguished from all previous studies in that it used partial correlation coefficients of the first and second order, and it also used a proposed model consisting of four behavioral equations, which include internal and external variables, in order to be more comprehensive in studying the interdependence between water, energy, and food production. It also shows the scarcity and lack of economic studies in the field of the interdependence between water and energy consumption on one hand and food production on the other in the Kingdom of Saudi Arabia. Therefore, this study focused on measuring this economic interdependence.
Research Objectives:
The goal of this study was to look at the economic nexus between agricultural production, water usage, and energy (diesel and electricity) consumption in the Kingdom of Saudi Arabia from 1995 to 2020.
1
The current state of water and energy use and that of plant and animal food production.
2
Calculation of the amount and value of water and energy productivity in Saudi agriculture.
3
Calculation of the first- and second-order simple and partial correlation coefficients between the value of agricultural output and the index for plant and animal food production, as well as water and energy consumption in Saudi agriculture.
4
Estimation of the proposed model for assessing Saudi agriculture’s economic connection between food production on one hand and water and energy use on the other.

2. Methodology

This research relied on data published in (1) the Saudi Ministry of Environment, Water and Agriculture’s statistical book, (2) the Saudi Central Bank’s yearly reports, (3) the website of the Food and Agriculture Organization (FAO), and (4) the Saudi Electricity Company’s reports. Econometric analysis was also used in this study. The first- and second-order simple and partial correlation coefficients between water, energy, and plant and animal food production were employed as follows (Gujarati and Porter 2009):
After removing the effect of the variable X2, the partial correlation coefficient of the first order between YX1 was determined as follows:
r Y X 1 l X 2 = r Y X 1 r Y X 2 r X 1 X 2 ( 1 r Y X 2 2 ) ( 1 r X 1 X 2 2 )
The partial correlation coefficient of the first order between YX2, after excluding the effect of the variable X1, was calculated as follows:
r Y X 2 l X 1 = r Y X 2 r Y X 1 r X 1 X 2 ( 1 r Y X 1 2 ) ( 1 r X 1 X 2 2 )
The partial correlation coefficient of the second order between YX1, after excluding the effect of the two variables X2 X3, was calculated as follows (Ismail 2001):
r Y X 1 / X 2 X 3 = r Y X 1 / X 2 r Y X 3 l X 2 r X 1 X 3 / X 2 ( 1 r Y X 3 / X 2 2 ) ( 1 r X 1 X 3 / X 2 2 )
The second-order partial correlation coefficient between YX2, after excluding the effect of the two variables X1 X3, was calculated as follows:
r Y X 2 / X 1 X 3 = r Y X 2 / X 1 r Y X 3 l X 1 r X 2 X 3 / X 1 ( 1 r Y X 3 / X 1 2 ) ( 1 r X 2 X 3 / X 1 2 )
The partial correlation coefficient of the second order between YX3, after excluding the effect of the two variables X1 X2, was calculated as follows:
r Y X 3 / X 1 X 2 = r Y X 3 / X 1 r Y X 2 l X 1 r X 2 X 3 / X 1 ( 1 r Y X 2 / X 1 2 ) ( 1 r X 2 X 3 / X 1 2 )
The proposed model for studying the economic nexus between energy and water consumption on one hand and food production on the other in the Kingdom of Saudi Arabia during the period 1995–2020 was also estimated. The proposed model consists of the following behavioral equations:
Y 1 = a 0 + a 1 X 1 + e 1 Y 2 = b 0 + b 1 X 2 + e 2 Y 3 = c 0 + c 1 X 3 + e 3 Y 4 = d 0 + d 1 Y ^ 1 + d 2 Y ^ 2 + d 3 Y ^ 3 + e 4
The proposed model includes the following variables:
  • Four endogenous variables—the amount of water used for agricultural purposes in billion m3 (Y1), electricity consumption in the agricultural sector in gigawatt-hours (Y2), diesel consumption in the agricultural sector in million barrels (Y3), and the index for the production of plant and animal food (Y4).
  • Three exogenous variables—the cropped area (X1), the total number of projects financed by the Agricultural Development Fund (X2), and the number of agricultural machines and equipment (X3). Because the number of machines and engines was unavailable, the value of the fixed capital of machines and engines in billion riyals was utilized as a substitute.
The equations of the proposed model were estimated by using the ordinary least squares (OLS) method, where the diameter of the matrix of internal variables of the proposed model was 1 and all numbers above the diameter were 0 (Gujarati and Porter 2009):
EquationEndogenous Variables
Y 1 Y 2 Y 3 Y 4
First1000
Second0100
Third0010
Fourth d 1 d 2 d 3 1

3. Results and Discussion

3.1. The Current Situation of Energy and Water Consumption and the Production of Plant and Animal Food

3.1.1. The Current Status of Energy Consumption in the Agricultural Sector

When looking at the evolution of energy consumption in the agricultural sector, the data in Table 1 show that electricity consumption in the agricultural sector increased from 1602.8 gigawatts-hours in 1995, representing 1.87% of total electricity consumption, to 5150.0 gigawatt-hours in 2020, representing 1.78% of total electricity consumption. The number of machines and combine harvesters used in Saudi agriculture decreased as a result of rising diesel prices and the state’s adoption of a strategy to preserve the environment by reducing the area planted with wheat, barley, and green fodder, and thus, diesel consumption decreased from 14.59 thousand barrels in 1995 to 8.65 thousand barrels in 2020.

3.1.2. The Current Status of Water Consumption for Agricultural Purposes

By studying the development of water consumption in the agricultural sector, it is clear from the data in Table 2 and Figure 1 that despite the decrease in the cropped area from 1302.4 thousand hectares in 1995 to 694.6 thousand hectares in 2013, the water consumption in the agricultural sector increased from 14.82 billion m3 in 1995 to 18.64 billion m3 in 2013, and thus, the average share per hectare increased from 11.38 thousand m3 in 1995 to 26.84 thousand m3 in 2013. This was due to the decrease in the area planted with wheat, in accordance with Resolution 335, and farmers’ tendency to expand the cultivation of green fodder, depleting the water. Because of the increase in the cropped area to 1038.12 thousand hectares, the amount of water used amounted to 20.83 billion m3 in 2015, then the cropped area decreased to 771.92 thousand hectares, and then the amount of water used decreased to 8.5 billion m3, at a rate of 11.01 thousand m3/hectare in 2020.

3.1.3. The Current Status of Plant and Animal Food Production

By studying the development of plant food production (cereals, fruits, and vegetables) and animal production (red meat, poultry meat, fish, milk, and eggs) during the period 1995–2020, it is clear from the data in Table 3 and Table 4 and Figure 2 that the production of vegetable food decreased from 6416.4 thousand tons in 1995 to 4102.7 thousand tons in 2019 and then increased to 6289.9 thousand tons in 2020. Calculating the index of vegetable food production, it is clear that vegetable food production decreased in 2019 from its estimated counterpart in 1995, at a rate of 36.1%. The total production of meat (red meat, poultry, and fish) increased from 592 thousand tons in 1995 to 1354 thousand tons in 2020. By calculating the index of the total meat production, it is clear that the total meat production increased in 2020 over its estimated counterpart in 1995, at a rate of 128.7%. Milk production also increased from 698 thousand tons in 1995 to 2911 thousand tons in 2020. According to a calculation of the milk production index, it is clear that milk production in 2020 increased from its estimated counterpart in 1995, at a rate of 317.0%. Egg production also increased from 132 thousand tons in 1995 to 350 thousand tons in 2020. According to a calculation of the egg production index, it is clear that egg production in 2020 increased from its estimated counterpart in 1995, at a rate of 165.2%. Finally, the geometric mean of the index of vegetable food production and the overall output of meat, milk, and eggs was used to determine the general index of food production. Table 4 shows that overall food production (plant and animal) rose by 123.1% in 2020 compared to 1995, implying an annual growth rate of 4.92% from 1995 to 2020.

3.2. Estimating the Productivity of Water and Energy Used in the Agricultural Sector during the Period 1995–2020

The value of productivity per unit of water and energy at the level of the agricultural sector is estimated by dividing the value of agricultural output by the used quantities of water and energy during the period 1995–2020. It is clear from the data in Table 5 that the value of water productivity increased from 2568.3 riyals/thousand m3 in 1995 to 7080.8 riyals/thousand m3 in 2020; i.e., it increased at an annual growth rate of 7.03% during the study period. The value of diesel productivity also increased from 2608.8 thousand riyals/barrel in 1995 to 6958.0 thousand riyals/barrel in 2020; i.e., it increased at an annual growth rate of 6.67% during the study period. As for the value of electricity production, it decreased from 23.7 million riyals/gigawatt-hour in 1995 to 11.7 million riyals/gigawatt-hour in 2020; i.e., it decreased at an annual rate of 2.02% during the study period.
The productivity of the water and energy unit at the level of plant production was estimated by dividing the amount of plant food production by the quantities used of water and energy during the period 1995–2020. It is clear from the data in Table 6 that water productivity increased from 433.0 kg/thousand m3 in 1995 to 740.0 kg/thousand m3 in 2020; i.e., it increased at an annual growth rate of 2.84% during the study period. Diesel productivity also increased, from 439.8 tons/barrel in 1995 to 727.2 tons/barrel in 2020, i.e., an annual growth rate of 2.61% during the study period, while electricity productivity decreased, from 4.0 tons/megawatt-hour in 1995 to 1.22 tons/megawatt-hour in 2020; i.e., it decreased at an annual rate of 2.78% during the study period.
The productivity of the water and energy unit at the level of red meat production was calculated by dividing the amount of produced red meat by the amount of consumed water and energy between 1995 and 2020. The same data in Table 6 show that water productivity grew from 10.39 kg/thousand m3 in 1995 to 33.88 kg/thousand m3 in 2020, representing a 9.04% annual growth rate during the research period. Diesel productivity increased from 10.56 tons/barrel in 1995 to 33.29 tons/barrel in 2020, representing an annual growth rate of 8.61% over the study period, whereas electricity productivity decreased from 0.1 tons/megawatt-hour in 1995 to 0.06 tons/megawatt-hour in 2020, representing an annual growth rate of 0.06% over the study period.

3.3. Measuring the Correlation Coefficients between Food Production and Water and Energy Consumption in the Agricultural Sector

A simple correlation coefficient was calculated between the value of agricultural output and the food production index (plant and animal) and water and energy consumption in Saudi agriculture from 1995 to 2020 to determine the extent of economic interdependence between food production on one hand and water and energy consumption on the other. Table 7 shows that there is a negative correlation between the value of agricultural output and the index of food production and water and diesel consumption, while a positive correlation was discovered between the value of agricultural output and the index of food production and electricity consumption. The simple correlation coefficient assesses the degree and direction of a relationship between two variables in a given set of circumstances.
It is clear from the data in Table 8 that the partial correlation coefficient between the value of agricultural output and the amount of water used was 0.047, excluding the effects of both electricity and diesel. The partial correlation coefficient between the value of agricultural output and electricity consumption was 0.818, excluding the effect of water and diesel. The partial correlation coefficient between the value of agricultural output and diesel consumption was −0.228, excluding the effect of both water and electricity. It is also clear from the data in Table 8 that the partial correlation coefficient between the index of food production and the amount of water used was 0.555, excluding the effect of both electricity and diesel. The partial correlation coefficient between the index of food production and electricity consumption was 0.824, excluding the effect of water and diesel. The partial correlation coefficient between the index of food production and diesel consumption was 0.025, excluding the effect of water and electricity. From the above, it is clear that about 55.5%, 82.4%, and 2.5% of the changes that occurred in the food production index in Saudi agriculture are attributed to changes in the consumption of water, electricity, and diesel, respectively.

3.4. Estimating the Proposed Model for the Economic Nexus between Food Production and Energy and Water Consumption

The suggested model was calculated by using the ordinary least squares (OLS) method from 1995 to 2020 to investigate the relationship between water and energy consumption on one hand and plant and animal food production on the other. The equations of the proposed model in Table 9 show the following: (1) a change of 10% in the cropped area (X1) results in a change of 3.23% in the amount of water used; (2) a change of 10% in the cumulative number of projects funded by the Agricultural Development Fund (X2) results in a change of 3.14% in the amount of electricity consumed; (3) a change of 10% in the value of fixed capital for machines and engines as an alternative variable for the number of machines and engines (X3) results in a change of 1.57% in diesel consumption; and (4) a change of 10% in the estimated consumption of water, electricity, and diesel results in a change of 1.97%, 2.78%, and 0.73% in the index of plant and animal food production, respectively. The equations of the proposed model are free from the problem of autocorrelation to the residuals, and they also have good efficiency in representing the data used in the estimation, according to the indicators of measuring the efficiency of the model, the most important of which is the inequality coefficient of Theil’s U, whose value is close to zero (see Table 10).

4. Conclusions

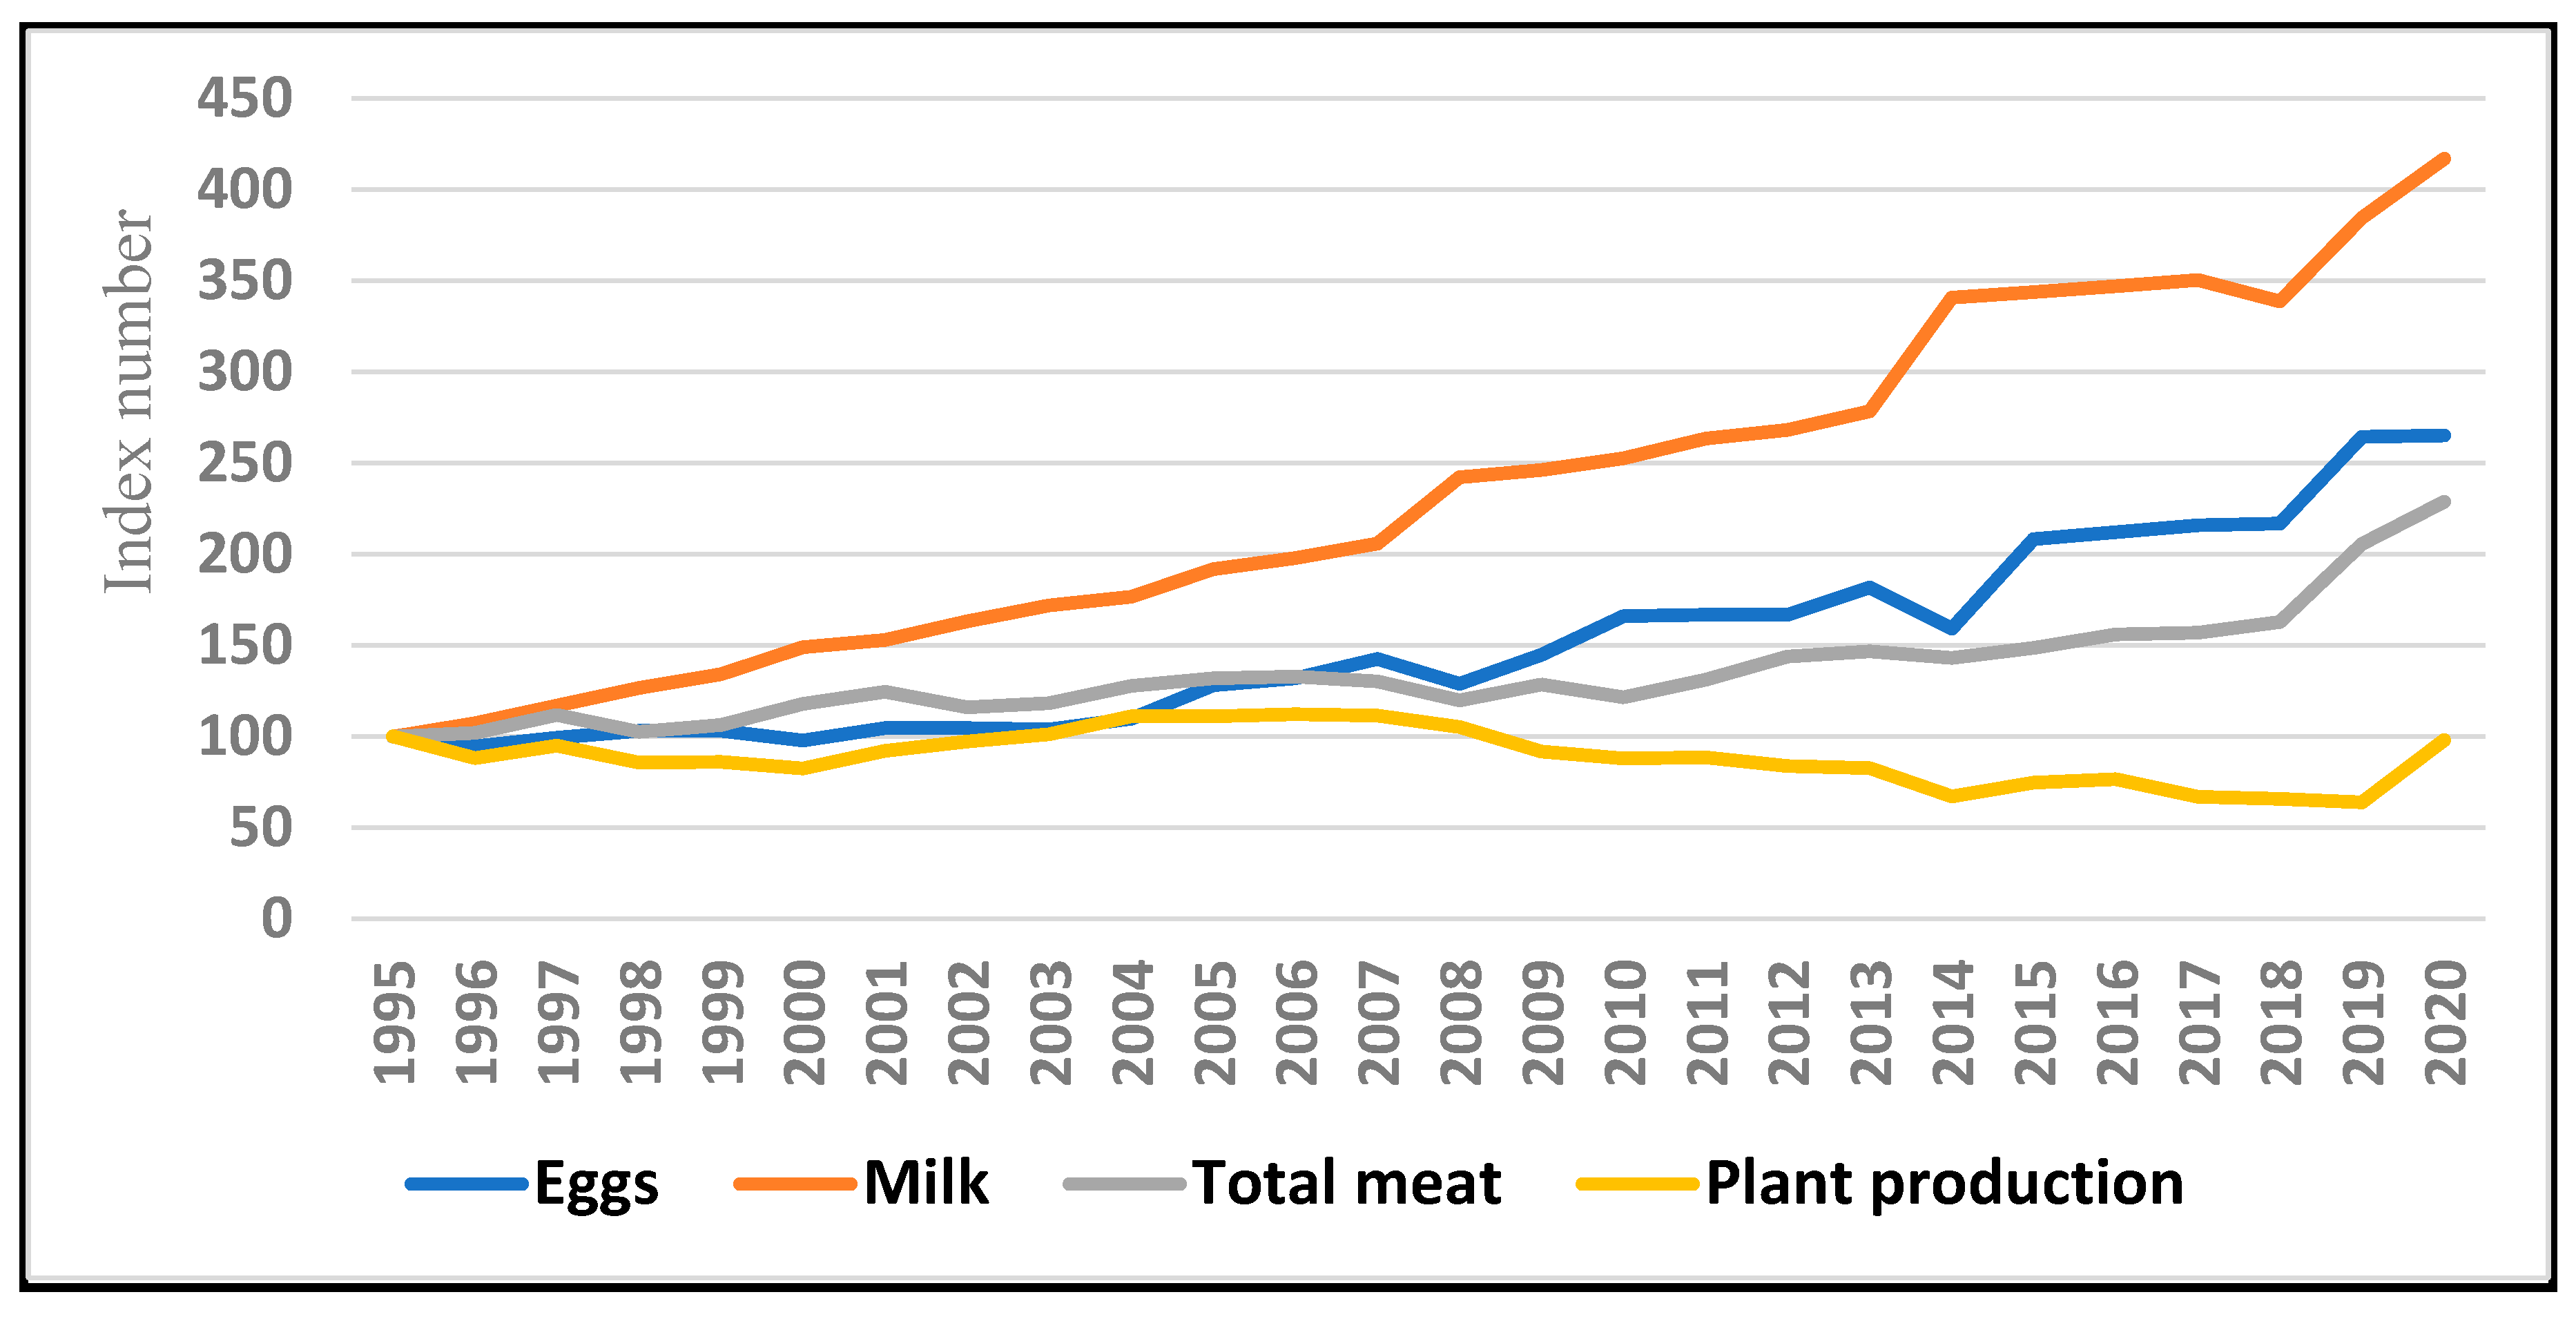
By studying the current situation, it was found that the index of plant food production declined from 100% in 1995 to 63.9% in 2019. This was due to the decisions issued on the rationalization of water consumption in Saudi agriculture and the restructuring of the crop structure at the level of regions and governorates within each administrative region. As for animal production, the results showed an increase in the index of red meat, poultry meat, milk, and eggs. In general, food production (vegetable and animal) increased in 2020 compared with its counterpart in 1995, at a rate of 123.1%, i.e., an annual growth rate of 4.92% during the period 1995–2020.
By calculating the partial correlation coefficient of the second order between food production and water and energy consumption during the period 1995–2020, it was found that about 55.5%, 82.4%, and 2.5% of the changes that occurred in the index of plant and animal food production were attributed to changes in the consumption of water, electricity, and diesel, respectively. By estimating the proposed model to study the correlation between water and energy consumption on one hand and the index of plant and animal food production on the other during the period 1995–2020, it was found that an expansion in the consumption of water, electricity, and diesel by 10% led to an increase in the index of food production by 1.97%, 2.78%, and 0.73%, respectively.
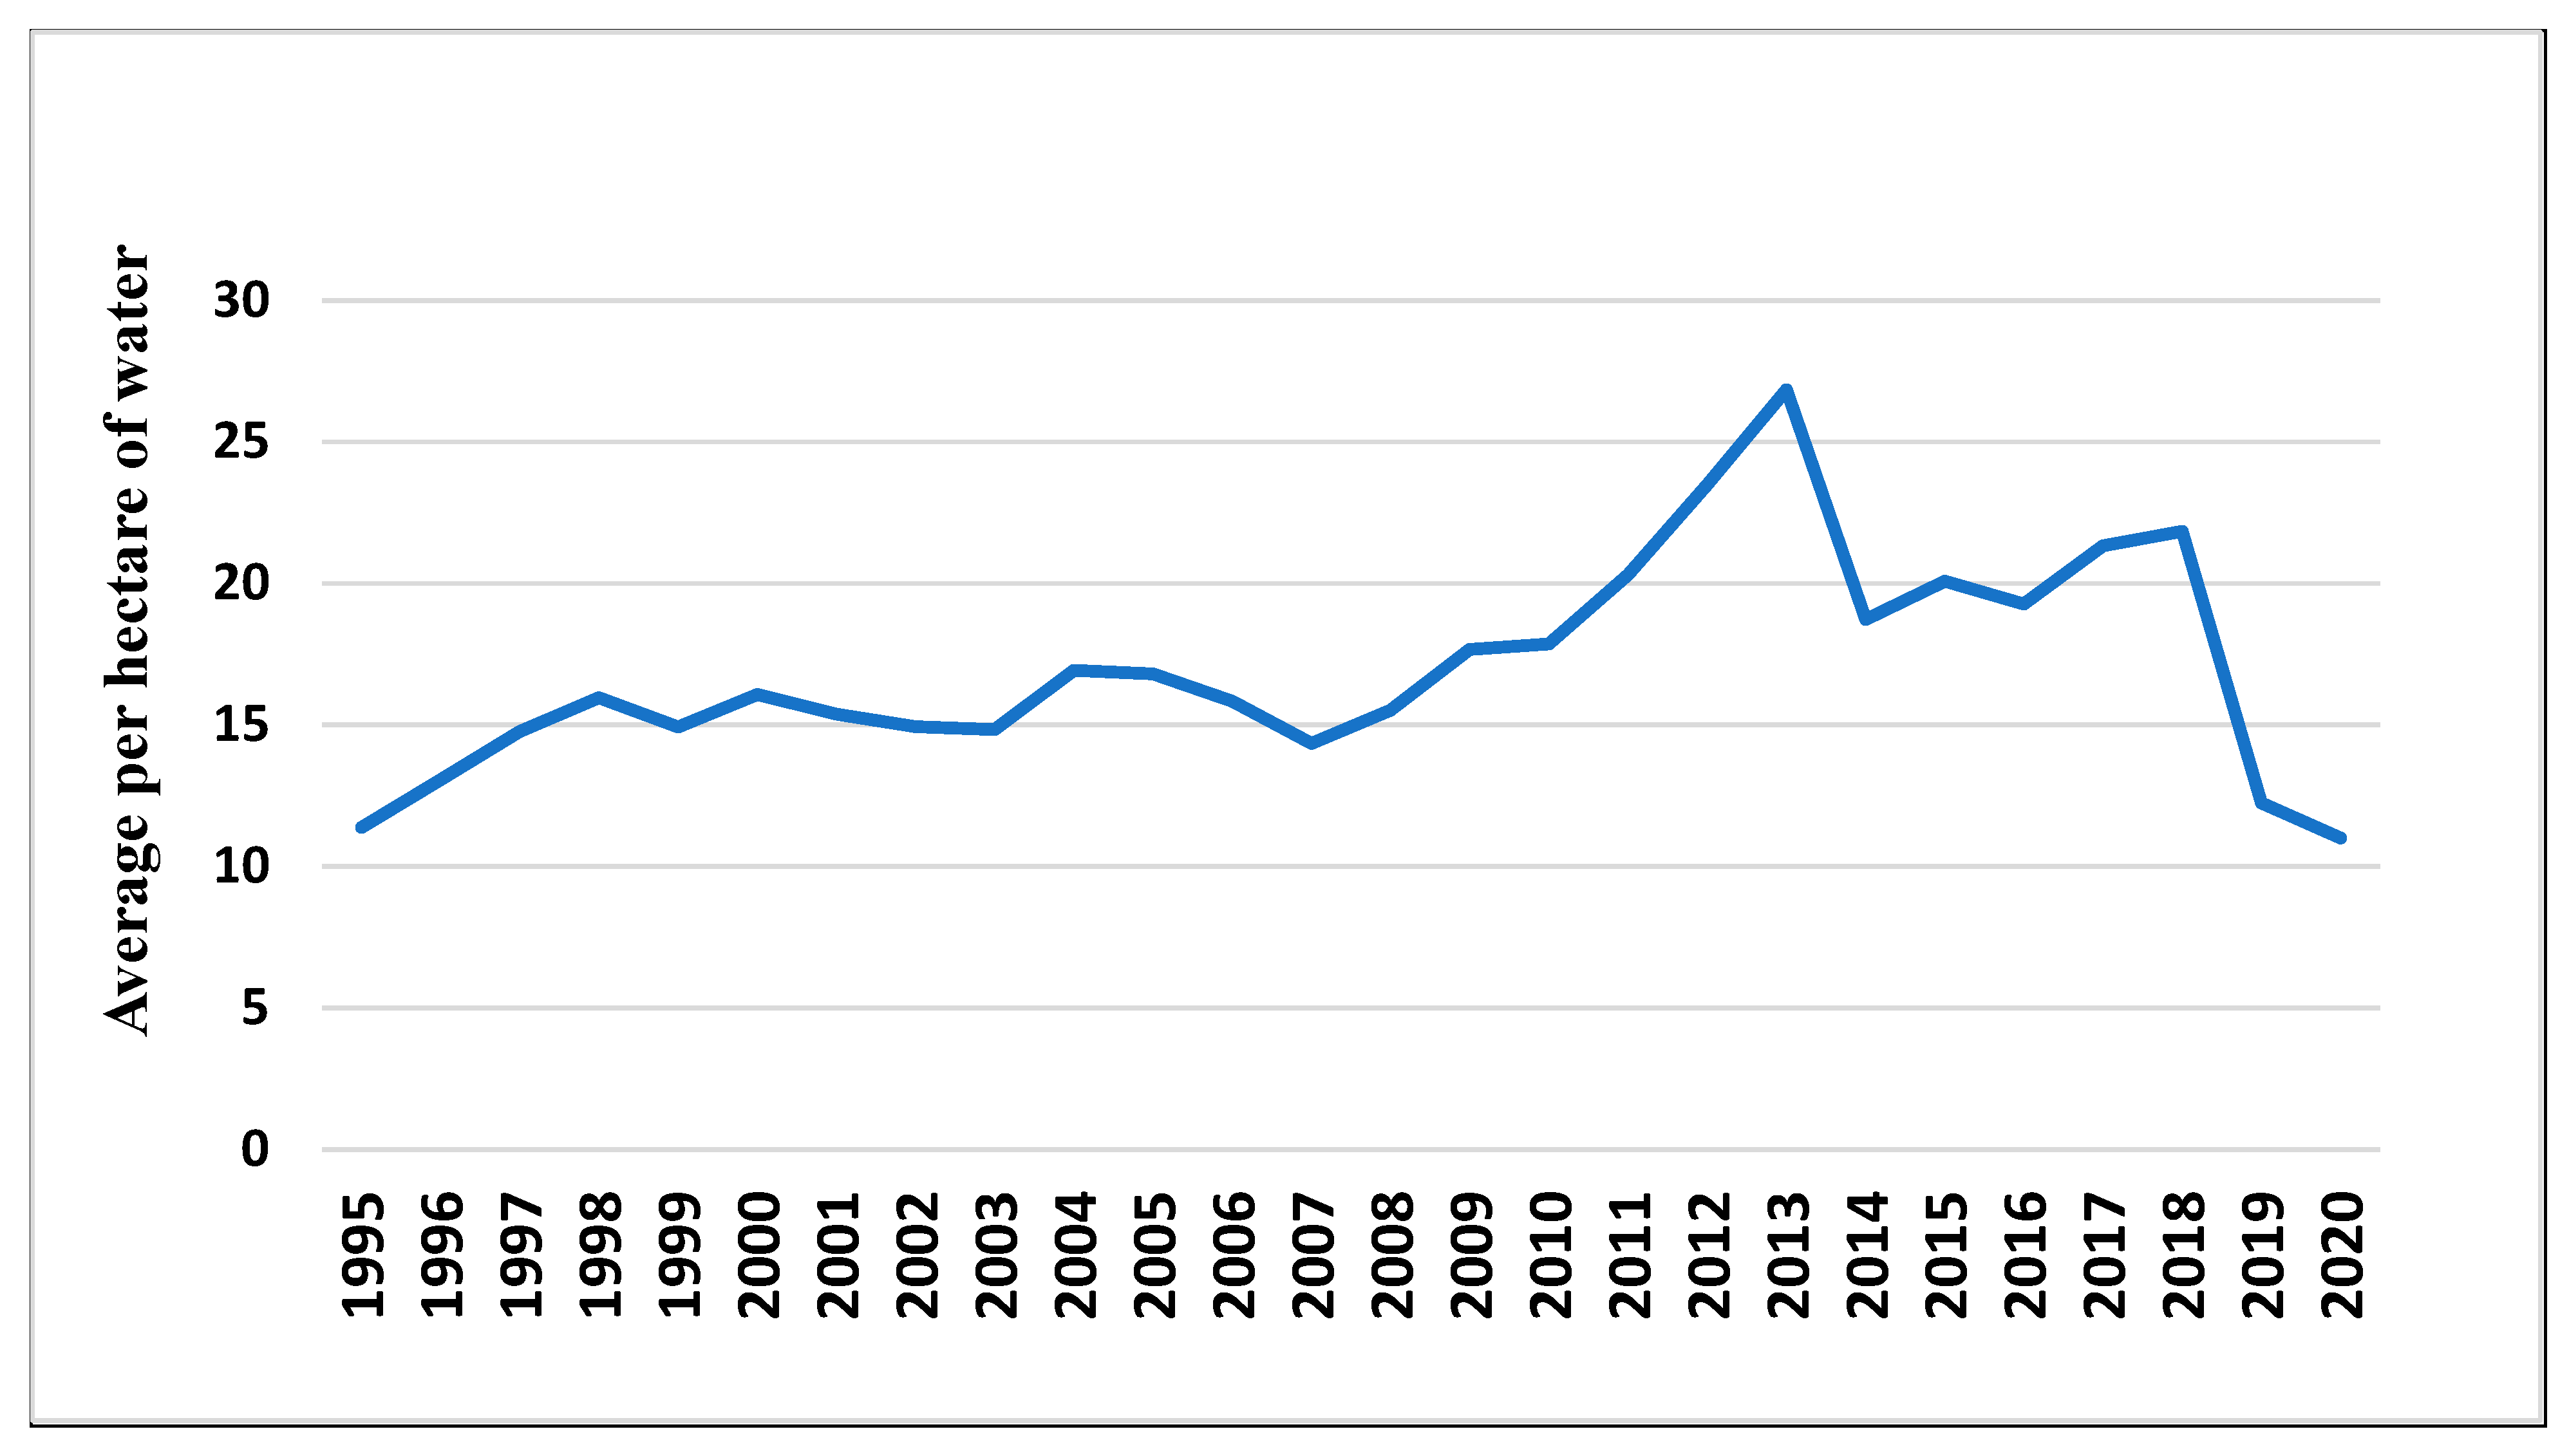
In view of the scarcity of water resources and the issuance of decisions to rationalize the use of water in Saudi agriculture, the rationalization of water consumption is expected to continue, so that its consumption does not exceed the amount of renewable groundwater of 8 billion m3. On 27 March 2021, His Royal Highness Crown Prince Mohammed bin Salman announced the Green Middle East Initiative. The initiative included reducing carbon emissions by 278 million tons by 2030 and increasing the use of renewable energy in various economic sectors. In light of the Green Middle East Initiative, the quantities of diesel used are expected to reduce and the consumption of electricity in the agricultural sector is expected to expand. There is no doubt that rationalizing water consumption and reducing diesel consumption affects electricity consumption and the production of plant and animal food.
Thanks to the results of this study, it can be said that the interdependence between water, energy, and food has become relevant to the environmental problems that the Kingdom of Saudi Arabia suffers from, in particular the problem of water scarcity and the trend toward reducing carbon emissions through the implementation of the Middle East Green Initiative. In light of the strong interdependence between water, energy, and food production, the agricultural policy has become necessary to increase the amount supplied or available to be used in food production, in addition to expanding the production of clean energy and its use in the agricultural sector.

Author Contributions

Conceptualization, K.A. and Y.A.; methodology, A.G.; software, S.K.; validation, S.A. and N.A.; formal analysis, Y.A.; investigation, A.G.; data curation, S.A.; writing—original draft preparation, S.A. and N.A.; writing—review and editing, K.A. and Y.A.; supervision, A.G.; software, S.K. All authors have read and agreed to the published version of the manuscript.

Funding

This research received no external funding.

Data Availability Statement

No new data were created or analyzed in this study. Data sharing is not applicable to this article.

Acknowledgments

This research was supported by the King Saud University Deanship of Scientific Research, College of Food and Agricultural Sciences Research Centre. The authors thank the Deanship of Scientific Research and RSSU at King Saud University for their technical support.

Conflicts of Interest

The authors declare no conflict of interest.

References

  1. Alrwis, Khalid Nahar, Adel Mohamed Ghanem, Othman Saad Alnashwan, Abdul Aziz M. Al Duwais, Sharaf Aldin Bakri Alaagib, and Nageeb Mohammed Aldawdahi. 2021. Measuring the Impact of Water Scarcity on Agricultural Economic Development in Saudi Arabia. Saudi Journal of Biological Sciences 28: 191–95. [Google Scholar] [CrossRef] [PubMed]
  2. El-Gafy, Inas. 2017. Water–food–energy nexus index: Analysis of water–energy–food nexus of crop’s production system applying the indicators approach. Applied Water Science 7: 2857–68. [Google Scholar] [CrossRef] [Green Version]
  3. Food and Agriculture Organization. 1995–2020. Website (FAOSTAT), 1995–2020. [Google Scholar]
  4. Food and Agriculture Organization. 2014. The Water-Energy-Food Nexus. A New Approach in Support of Food Security and Sustainable Agriculture. Rome: The Food and Agricultural Organisation of the United Nations. [Google Scholar]
  5. General Authority for Statistics. 2015. Detailed Results of the Agricultural Census. [Google Scholar]
  6. Ghanem, Adel Muhammad Khalifa, and Ibrahim bin Othman Al-Nashwan. 2021a. The cost of using economic resources and their contribution to total agricultural output. The Egyptian Journal of Agricultural Economics 30: 124–35. [Google Scholar]
  7. Ghanem, Adel Muhammad Khalifa, and Ibrahim bin Othman Al-Nashwan. 2021b. The food sovereignty of dates and its impact on water consumption in the Kingdom of Saudi Arabia. The Egyptian Journal of Agricultural Economics 31: 491–504. [Google Scholar]
  8. Gujarati, Damodar N., and Dawn C. Porter. 2009. Basic Econometrics, 5th ed. London: MC Grow-Hill International Book Company. [Google Scholar]
  9. Ismail, Mohamed Abdel Rahman. 2001. Linear Regression Analysis. Riyadh: Research Center, Institute of Public Administration, Saudi Arabia. [Google Scholar]
  10. Mahlknecht, Jürgen, Ramón González-Bravo, and Frank J. Loge. 2020. Water-energy-food security: A Nexus perspective of the current situation in Latin America and the Caribbean. Energy 194: 116824. [Google Scholar] [CrossRef]
  11. Ministry of Environment, Water and Agriculture. 2018. National Water Strategy 2030, Kingdom of Saudi Arabia. Riyadh: Ministry of Environment, Water and Agriculture. [Google Scholar]
  12. Ministry of Environment, Water and Agriculture. 2020. Statistical Book. Riyadh: Ministry of Environment, Water and Agriculture. [Google Scholar]
  13. National Center for Energy Research, Royal Scientific Society. 2015. Energy study in the agricultural sector. Al-Rai Newspaper, December 30. [Google Scholar]
  14. Ngarava, Saul. 2021. Long term relationship between food, energy and water inflation in South Africa. Water-Energy Nexus 4: 123–33. [Google Scholar] [CrossRef]
  15. Pan, Ziyu, Zhou Fang, Junyu Chen, Jun Hong, Yisong Xu, and Shiliang Yang. 2021. Driving Factors of Decoupling between Economic Development and Water Consumption in Food and Energy in North-West China—Based on the Tapio-LMDI Method. Journal of Water 13: 917. [Google Scholar] [CrossRef]
  16. Ringler, Claudia, Dirk Willenbockel, Nicostrato Perez, Mark Rosegrant, Tingju Zhu, and Nathanial Matthews. 2016. Global linkages among energy, food and water: An economic assessment. Journal of Environmental Studies and Sciences 6: 161–71. [Google Scholar] [CrossRef] [Green Version]
  17. Saudi Central Bank. 2021. Annual Statistics 2020, 1/6/2021. Jeddah: Saudi Central Bank. [Google Scholar]
  18. Saudi Electricity Company. 1995–2020. Annual Reports, Period 1995–2020. Riyadh: Saudi Electricity Company. [Google Scholar]
Figure 1. The average share of water per hectare per thousand m3 during the period 1995–2020. Source: The data in Table 2.
Economies 11 00113 g001
Figure 2. The index of vegetable and animal food production during the period 1995–2020. Source: The data in Table 4.
Economies 11 00113 g002
Table 1. The relative importance of energy consumption in the agricultural sector during the period 1995–2020.
YearElectricity in Gigawatt-HoursDiesel in Thousand Barrels
AgriculturalTotal%
19951602.885,9081.8714.59
19961714.789,6411.9113.14
19971708.592,2281.8514.15
19981909.1 97,0501.9712.66
19992147.9105,6122.0313.74
20002265.4114,1611.9812.54
20012379.5122,9441.9413.57
20022640.0128,6292.0513.71
20032666.0142,1941.8713.62
20042920.0144,3852.0213.13
20053136.3153,283.62.0512.40
20063380.3163,151.12.0712.03
20073373.6169,302.81.9912.04
20083689.3179,272.22.0610.88
20095329.0193,471.32.759.35
20103760.9212,262.61.779.04
20113941.9219,661.61.798.81
20124361.9240,288.11.828.35
20134290.3256,687.61.677.78
20144577.4274,502.21.6711.73
20155167.5286,036.81.8111.63
20165380.6287,692.31.8711.50
20175653.3288,656.81.9610.08
20184905.4289,822.21.699.74
20194984.8279,677.51.789.61
20205150.0289,328.01.788.65
Average3578.3188,686.51.9211.48
Source: (1) Saudi Central Bank (2021) annual statistics for 2020, as of 1 June 2021; (2) Saudi Electricity Company (1995–2020) annual reports.
Table 2. Crop area, water quantity, and total value of agricultural production in the Kingdom of Saudi Arabia during the period 1995–2020.
YearWater Used for Agricultural Purposes in Billion m3Crop Area in Thousand HectaresThe Average Share of a Hectare of Water per Thousand m3/HectareThe Value of Agricultural Production at Constant Prices in Millions of Riyals
199514.821302.411.3838,062
199615.321173.313.0637,939
199718.661263.314.7739,091
199818.051130.715.9639,468
199918.301226.514.9240,367
200018.001119.916.0741,945
200118.641211.615.3842,182
200218.281224.514.9342,724
200318.031216.014.8343,072
200419.851172.716.9344,616
200518.591106.816.8045,088
200617.001074.215.8345,544
200715.421075.014.3446,431
200815.08971.615.5247,048
200914.75835.017.6647,533
201014.41806.717.8652,098
201115.97786.820.3054,565
201217.51745.523.4956,096
201318.64694.626.8457,936
201419.611047.418.7259,382
201520.831038.1220.0759,744
201619.791026.9119.2760,122
201719.20900.0621.3360,422
201819.00869.9121.8460,501
201910.50857.7612.2461,202
20208.50771.9211.0160,187
Average17.031024.9716.9849,360.19
Source: (1) Ministry of Environment, Water and Agriculture (2020), statistical book, 1995–2020; (2) Saudi Central Bank, annual statistics 2020, as of 6 January 2021. Constant prices (2010 = 100).
Table 3. Production of plant and animal food for the Kingdom of Saudi Arabia in thousand tons during the period 1995–2020.
YearCerealsFruitsVegetablesVegetarian FoodRed MeatPoultry MeatFishTotal MeatMilkEggs
1995 2671105326936416.4 154 390 48 592 698 132
1996 1934109226315656.6 155 397 51 603 749 125
1997 2341115126006091 157 451 54 662 816 131
1998 2205115021375491 157 395 55 607 883 136
1999 2488113318965516.8 159 418 52 629 937 136
2000 2172118819275287.1 160 483 55 698 1039 129
2001 2594121021075910.6 160 521 61 737 1067 138
2002 2856124121376234.4 162 467 64 686 1139 138
2003 2951133122146496.6 165 468 67 700 1200 137
2004 3194145424797127 167 522 67 756 1232 145
2005 3004155425717129 169 537 75 781 1338 169
2006 3042154926177208 170 535 81 786 1381 174
2007 2967158225967145 171 508 91 770 1436 188
2008 2438161626966750 170 446 93 709 1690 170
2009 1592161926765889 171 494 96 761 1718 191
2010 1571154925215641 172 447 100 719 1763 219
2011 1418160926485675 171 529 76 776 1838 220
2012 1085163926505374 173 588 90 851 1872 220
2013 883168827295300 174 604 90 868 1943 240
2014 925108922824296 248 507 92 847 2378 210
2015 1630131918474795.9 258 518 104 880 2399 275
2016 1525146219254911.3 262 554 107 923 2422 280
2017 1171164314804292.9 267 540 121 928 2446 285
2018 1063171514404217.9 270 554 140 964 2363 286
2019 967173813984102.7 275 800 142 1217 2683 349
2020 1255234226956289.9 288 900 166 1354 2911 350
Average1997.81450.622925740.2192.552286.1800.21628.5199
Table 4. The index of plant and animal production for the Kingdom of Saudi Arabia during the period 1995–2020.
YearCerealsFruitsVegetablesPlant ProductionAnimal ProductionFood Production Index
Total MeatMilkEggs
1995 100100100100100100100100
1996 72.4103.797.788.2101.9107.394.797.7
1997 87.6109.396.594.9111.8116.999.2105.3
1998 82.6109.279.485.6102.5126.5103103.4
1999 93.1107.670.486106.3134.2103106
2000 81.3112.871.682.4117.9148.997.7109
2001 97.1114.978.292.1124.5152.9104.5116.4
2002 106.9117.979.497.2115.9163.2104.5117.7
2003 110.5126.482.2101.2118.2171.9103.8120.9
2004 119.6138.192.1111.1127.7176.5109.8128.8
2005 112.5147.695.5111.1131.9191.7128137.7
2006 113.9147.197.2112.3132.8197.9131.8140.4
2007 111.1150.296.4111.4130.1205.7142.4143.5
2008 91.3153.5100.1105.2119.8242.1128.8140.8
2009 59.6153.899.491.8128.5246.1144.7143.2
2010 58.8147.193.687.9121.5252.6165.9145.4
2011 53.1152.898.388.4131.1263.3166.7150.2
2012 40.6155.798.483.8143.8268.2166.7152.3
2013 33.1160.3101.382.6146.6278.4181.8157.3
2014 34.6103.484.767143.1340.7159.1151
2015 61125.368.674.7148.6343.7208.3167.9
2016 57.1138.871.576.5155.9347212.1172.2
2017 43.81565566.9156.8350.4215.9167.8
2018 39.8162.953.565.7162.8338.5216.7167.4
2019 36.2165.151.963.9205.6384.4264.4191.2
2020 47222.4100.198228.7417265.2223.1
Average74.8137.885.189.5135.2233.3150.7140.6
Source: The data in Table 3.
Table 5. Value of water and energy productivity used in the agricultural sector during the period 1995–2020.
YearWater (Riyals/Thousand m3)Electricity (Million Riyals/GWh)Diesel (Thousand Riyals/Barrel)
19952568.323.72608.8
19962476.422.12887.3
19972094.922.92762.6
19982186.620.73117.5
19992205.818.82937.9
20002330.318.53344.9
20012263.017.73108.5
20022337.216.23116.3
20032388.916.23162.4
20042247.715.33398.0
20052425.414.43636.1
20062679.113.53785.9
20073011.113.83856.4
20083119.912.84324.3
20093222.68.95083.7
20103615.413.95763.1
20113416.713.86193.5
20123203.712.96718.1
20133108.213.57446.8
20143028.113.05062.4
20152868.211.65137.1
20163038.011.25228.0
20173147.010.75994.2
20183184.312.36211.6
20195828.812.36368.6
20207080.811.76958.0
Source: The data in Table 1 and Table 2.
Table 6. Productivity of water and energy used in food production during the period 1995–2020.
YearVegetarian FoodRed Meat
Water (kg/thousand m3)Electricity (tons/MWh)Diesel (tons/barrel)Water (kg/thousand m3)Electricity (tons/MWh)Diesel (tons/barrel)
1995433.04.00439.810.390.1010.56
1996369.23.30430.510.120.0911.80
1997326.43.57430.58.410.0911.10
1998304.22.88433.78.700.0812.40
1999301.52.57401.58.690.0711.57
2000293.72.33421.68.890.0712.76
2001317.12.48435.68.580.0711.79
2002341.12.36454.78.860.0611.82
2003360.32.44477.09.150.0612.11
2004359.02.44542.88.410.0612.72
2005383.52.27574.99.090.0513.63
2006424.02.13599.210.000.0514.13
2007463.42.12593.411.090.0514.20
2008447.61.83620.411.270.0515.63
2009399.31.11629.811.590.0318.29
2010391.51.50624.011.940.0519.03
2011355.41.44644.210.710.0419.41
2012306.91.23643.69.880.0420.72
2013284.31.24681.29.330.0422.37
2014219.10.94366.212.650.0521.14
2015230.20.93412.412.390.0522.18
2016248.20.91427.113.240.0522.78
2017223.60.76425.913.910.0526.49
2018222.00.86433.014.210.0627.72
2019390.70.82426.926.190.0628.62
2020740.01.22727.233.880.0633.29
Source: The data in Table 1, Table 2 and Table 3.
Table 7. Matrix of simple correlation coefficients between the value of agricultural output, the food production index, and the consumption of water, electricity, and diesel in Saudi agriculture during the period 1995–2020.
VariableAgricultural Production Value
Y 1
Diesel
X 3
Electricity
X 2
Water
X 1
Agricultural Production Value
Y 1
1−0.140.93−0.77
Water
X 1
−0.141−0.130.36
Electricity
X 2
0.93−0.131−0.77
Diesel
X 3
−0.770.36−0.771
VariableFood Production Index
Y 2
Water
X 1
Electricity
X 2
Diesel
X 3
Food Production Index
Y 2
1−0.380.89−0.75
Water
X 1
−0.381−0.130.36
Electricity
X 2
0.89−0.131−0.77
Diesel
X 3
−0.750.36−0.771
Source: The data in Table 1, Table 2 and Table 4.
Table 8. The partial correlation coefficient between the value of agricultural output, the food production index, and the consumption of water and energy in Saudi agriculture during the period 1995–2020.
Food Production IndexAgricultural Production ValueFirst-Order Partial Correlation Coefficient
−0.585−0.052 r Y X 1 / X 2
−0.222−0.230 r Y X 3 l X 2
0.4110.411 r X 1 X 3 / X 2
0.9170.929 r Y X 2 / X 1
−0.711−0.779 r Y X 3 l X 1
−0.782−0.782 r X 2 X 3 / X 1
−0.711−0.779 r Y X 3 / X 1
0.9170.929 r Y X 2 l X 1
−0.782−0.782 r X 2 X 3 / X 1
Food Production IndexAgricultural Production ValueSecond-Order Partial Correlation Coefficient
0.5550.047 r Y X 1 / X 2 X 3
0.8240.818 r Y X 2 / X 1 X 3
−0.025−0.228 r Y X 3 / X 1 X 2
Source: The data in Table 7.
Table 9. Statistical estimation of the equations of the proposed model to study the correlation between food production and water and energy consumption during the period 1995–2020.
Endogenous VariablesEquation
Water Ln Y ^ 1 = 0.486 + 0.323 Ln X 1 + 0.814   A R ( 1 )
(0.14) ns (2.79) ** (4.51) **
R 2 = 0.53   F = 8.15   D . W = 1.26  
Electricity Ln Y ^ 2 = 4.849 + 0.314 Ln X 2 + 0.749   A R ( 1 )
(2.56) ** (2.76) ** (3.72) **
R 2 = 0.92   F = 80.80   D . W = 2.17
Deiseal Ln Y ^ 3 = 3.108 + 0.157 Ln X 3 + 0.498   A R ( 1 )
(9.25) ** (2.19) * (2.36) *
R 2 = 0.72   F = 18.71   D . W = 1.78
Food Production Index Ln Y ^ 4 = 6.978 + 0.197 Ln Y ^ 1 + 0.278 Ln Y ^ 2 + 0.073 Ln Y ^ 3 + 0.729   A R ( 1 )
(−1.98) * (2.03) * (2.71) ** (2.12) * (3.30) **
R 2 = 0.94   F = 50.45   D . W = 1.71
** = significant at 1% probability level, * = significant at 5% probability level, ns = not significant. Source: Statistical analysis of the data in this study.
Table 10. Efficiency indicators of the proposed model to study the correlation between food production and water and energy consumption.
IndexFirstSecondThirdFourth
Root-Mean-Square Error (RMSE)0.2210.1860.1140.065
Mean Absolute Error (MAE)0.1910.1650.0930.050
Mean Absolute Percentage Error (MAPE)6.8842.0443.9880.998
Coefficient of Uncertainty (Theil’s U)0.0400.0110.0230.006
Source: It was collected and calculated from the equations of the proposed model in Table 9.
Disclaimer/Publisher’s Note: The statements, opinions and data contained in all publications are solely those of the individual author(s) and contributor(s) and not of MDPI and/or the editor(s). MDPI and/or the editor(s) disclaim responsibility for any injury to people or property resulting from any ideas, methods, instructions or products referred to in the content.

