Article

Capturing the Effect of the COVID-19 Pandemic Outbreak on the Financial Performance Disparities in the Energy Sector: A Hybrid MCDM-Based Evaluation Approach

by
Anas A. Makki
1,* and
Ammar Y. Alqahtani
2
1
Department of Industrial Engineering, Faculty of Engineering—Rabigh, King Abdulaziz University, Jeddah 21589, Saudi Arabia
2
Department of Industrial Engineering, Faculty of Engineering, King Abdulaziz University, Jeddah 21589, Saudi Arabia
*
Author to whom correspondence should be addressed.
Economies 2023, 11(2), 61; https://doi.org/10.3390/economies11020061
Submission received: 16 December 2022 / Revised: 28 January 2023 / Accepted: 8 February 2023 / Published: 13 February 2023
(This article belongs to the Special Issue Commodity Markets’ Reaction to COVID-19 Outbreak)

Abstract

:
The COVID-19 pandemic has impacted the financial performance of companies in different sectors. One of the most important sectors affected is the energy sector. Therefore, this research study aims to conduct a financial performance evaluation of companies in the Saudi energy sector in 2019, 2020, and 2021. This is to capture and analyze the effect on companies before, during, and post the COVID-19 pandemic, respectively. A hybrid multicriteria decision-making (MCDM) approach is followed to achieve the objective. The financial performance evaluation of energy companies is based on four financial dimensions and 11 performance indicators. Results revealed that energy companies’ efficiency and profitability were relatively the most important dimensions, followed by leverage and liquidity. Furthermore, results revealed the relative importance of the indicators from the most to the least important. Results also revealed the effect of COVID-19 on energy companies’ financial performance, demonstrating the change over the three years. Implications include providing insights for energy companies on the financial dimensions and indicators to be maintained and monitored in the case of pandemics. Furthermore, to assist decision-makers in the energy sector in developing strategies to mitigate financial performance disparities during and post-pandemics.

1. Introduction

The COVID-19 pandemic has emerged in countries all over the world as a huge challenge for governments and businesses to deal with, as it not only threatens human lives but also has a spillover effect on the economy and other aspects of life (Bashir et al. 2021). It has worsened due to the proper equipment shortage, lack of preventive measures, and Standard Operating procedures (SOPs). This has made it difficult for medical practitioners to handle the escalating number of patients and made it difficult for governments to stop the sudden virus outbreaks (Ajami 2020). The world was unprepared for the emergent situation caused by the COVID-19 outbreak, as such a pandemic has not been seen in decades. The COVID-19 pandemic has negatively impacted the financial performance of companies worldwide in all sectors of the economy due to the closing down of businesses, lockdowns, and a lower rate of business due to the imposed preventive measures such as social distancing protocols. Despite that we are now in the post-pandemic period, countries worldwide are still reeling from the economic consequences of the COVID-19 epidemic, which may exacerbate the financial situation by causing commodity prices and supply chain chokeholds to climb even more. Previous studies have focused on the consequences of catastrophic events on firm performance, for example, the studies that have focused on the impact of the COVID-19 pandemic (Makni 2023; Xu and Jin 2022; Perwitasari et al. 2022; Anis 2022).
Saudi Arabia, a major global oil producer, was no exception to this scenario. The Saudi government also enforced preventive measures during the pandemic, including strict curfews and quarantines with heavy fines for violations (Bildirici et al. 2020), along with vaccinations which have successfully reduced the risk of COVID-19 outbreaks. However, despite its success in containing the pandemic, the lockdowns and social distancing protocols have negatively impacted businesses in all countries’ economic sectors (Havrlant et al. 2021). One of the most important sectors is the energy sector, which has also been negatively affected financially by the pandemic, as companies in the industry have reported lower revenues and financial performance in the year after COVID-19 (Anil and Alagha 2021).
Investment in renewable energy has received much focus in recent years worldwide as a means to achieve sustainable economic, social, and environmental development strategies (Wüstenhagen and Menichetti 2012; Al Garni et al. 2016; Hashemizadeh et al. 2021). More importantly, energy use is strongly linked to progress. This was especially apparent during the industrial revolution when manufacturing methods shifted significantly from human labor to machines, and more coal was used to generate steam (Henri 2017). Several studies show a strong positive relationship between economic development and energy consumption (AlKhars et al. 2020). Thus, population and economic growth are rising, and the anticipation of future energy consumption is relatively high. Therefore, it is important to be able to rein in the rising demand for its own domestic energy supply. Saudi Arabia has already started its renewable energy plans to alleviate the strain on its fossil fuel reserves.
Thus, conducting financial assessments in such times is essential to estimate the extent of the damage due to the COVID-19 pandemic. Given that financial assessment is regarded as evaluating and analyzing the business’s financial performance through its financial statements compared to the industry average. Typically, the financial evaluation is utilized to determine whether the company is solvent, stable, liquid, or profitable enough to warrant the monetary investment. In today’s business environment, analyzing a company’s financial performance is crucial not only for the management and shareholders of the company but also for all competitors in the same industry. Financial ratios like profitability, liquidity, leverage, and efficiency are appropriate metrics that can be used to evaluate the financial performance of related enterprises and sectors. This is because of the numerous implications that financial performance has on success, productivity, and economic growth. Therefore, most companies want to know where they stand compared to others in their field to develop successful strategies. Because of this, companies need to be financially evaluated (Abdel-Basset et al. 2020).
As Bhunia et al. (2011) described, managing current assets and liabilities ensures a healthy equilibrium between a company’s potential to generate profits and its ability to make payments. Two researchers, Alagathurai (2013) and Aminu (2012), reported that Saudi Arabian trading enterprises have positive liquidity and profit variance. While Priya and Nimalathasan (2013) proposed an ideal equilibrium between liquidity and profitability, this finding highlights the diversity and cohesion between the two. Since excessive liquidity is detrimental to profits, Ben-Caleb et al. (2013) argued for keeping liquidity optimal. This is indicative of a lack of positivity, coherence, profitability, and liquidity. According to Ehiedu (2014), a healthy equilibrium between profitability and liquidity is necessary for the efficient running of a corporation.
A company’s success depends on several factors outside only its pricing strategy. According to Khan et al. (2014), operational effectiveness is another primary determinant of firms’ profitability in Saudi Arabia. Return on assets and return on equity were analyzed by Rehman et al. (2015) to determine the profit potential of Saudi Arabian enterprises trading on the stock market. There was no correlation or cohesion between a company’s profitability and liquidity, whether examined by using the current ratio, liquidity ratio, or absolute liquidity ratio. It was proposed by Kumar et al. (2016) that efficient management of working capital increases profits. This is a veiled reference to the positive and cohesive relationship between liquidity and profitability discovered by Al-Shuaibi et al. (2016), who looked into the topic and found that external variables like competition and innovation boost a company’s bottom line. The positive variability and cohesion of profits and liquidity were investigated by Sinha et al. (2016). They resulted from careful cash management and a strong ability to turn a profit. A study by Akhtar and Asif (2017) found that “operational efficiency and exploitation of the resources increase the performance of the company organization,” and they recommended expanding existing operations to boost profits. Ali and Abu Theeb (2018) investigated how cost impacts a company’s profitability. In their investigation of the varying links between profitability and liquidity across Indian enterprises. Panigrahi et al. (2018) discovered the negative co-variability or cohesiveness between these two key performance metrics. Pushparaj Kulkarni and Pimplapure (2019) found positive cohesion between pharmaceutical firms in India and their potential to generate short- and long-term cash flow and profits. According to Farhan et al. (2019), good corporate governance is critical for Indian pharmaceutical firms to keep their cash flow positive and their bottom lines healthy. This negative relationship between companies’ liquidity and profits was uncovered by Sodha (2020). Most importantly, research explains the connection between profits and cash flow and recommends keeping enough cash on hand to ensure the company runs smoothly.
In the literature, financial ratios were used to accurately measure companies’ or individuals’ levels of financial success. Moreover, firms’ financial success could also be assessed using larger numbers of factors, making it difficult to make decisions based on several criteria simultaneously. Therefore, several Multicriteria Decision-Making (MCDM) approaches have been quite successful in many industry contexts. This is because such approaches allow for establishing the relative relevance of criteria (e.g., financial ratios in this context) by constructing a weight vector to compare criteria sets on a pairwise basis.
For example, Yalcin et al. (2012) organized many financial measurements to evaluate Turkey’s manufacturing industry using eight major indicators. Financial performance indicators based on conventional accounting and value creation were also used to express the organization’s value. Another example, Rezaie et al. (2014) analyzed the effectiveness of Iranian cement businesses over two years (2008–2009) based on four key financial indicators, using the Analytic Hierarchy Process (AHP) and the VIseKriterijumska Optimizacija I Kompromisno Resenje (VIKOR) in Serbian, standing for Multicriteria Optimization and Compromise Solution. Additionally, financial characteristics were utilized to categorize companies into categories according to the degree to which their economic structures were comparable across different industries (Linares-Mustarós et al. 2018). Furthermore, profitability, operational capability, and solvency were evaluated by analyzing 31 financial measures across 46 Indian banks (Bawa et al. 2019). VIKOR was also used to assess the financial performance of airline companies (Pineda et al. 2018). In addition, a hybrid approach, including fuzzy-AHP, was used to assess seven Iranian petrochemical companies (Shaverdi et al. 2014).
The technological sector in Turkey was analyzed concerning its financial performance using the Technique for Order Preference by Similarity to Ideal Solution (TOPSIS) (Bulgurcu 2012). TOPSIS aids in ranking these businesses throughout the years from 2009 to 2011. Specifically, this research determined whether there is congruence between TOPSIS’s rankings and the market value rankings of the companies in the issue. In another study, a range of financial metrics was also used to rate the performance of companies in the cement sector that are listed on the Borsa Istanbul exchange (Ertuğrul and Karakaşoğlu 2009). The authors of that study proposed merging a fuzzy TOPSIS-based model with a fuzzy AHP to provide a more accurate assessment of financial performance.
Users of financial information might find that comparing the MCDM evaluations of financial success with an external assessment, such as the share of return, is beneficial to their needs. Özden et al. (2012) analyzed cement industry businesses’ financial performance using the VIKOR methodology. With the use of Spearman’s rank correlation coefficient, it was determined whether or not the stock return performance of firms is correlated with the rankings of their financial performance. Furthermore, the Preference Ranking Organization Method for Enrichment of Evaluations (PROMETHEE) to calculate performance ratings using the enterprises included in the Borsa Istanbul, abbreviated as the (BIST)-50 index, to investigate if there was a connection between the annual performance ratings and the stock prices (Öztürk 2017). Bognár and Benedek (2021) described a possible methodological process for monitoring group-level agreement on ranking compliance risks. Çaliş and Sakarya (2020) examined the relationship between the financial performance of banks that were included in the BIST Banking Index and the stock returns of such institutions using the PROMETHEE methodology using quarterly financial data provided by the selected Turkish banks (Ali and Haque 2014).
Over the last decade, several AHP—TOPSIS implementations have been reported in many peer-reviewed scientific journals. Based on the AHP—TOPSIS framework, Bognár et al. (2022) created a technique for evaluating potential dangers. To provide standardized decision-making trial and evaluation laboratory (DEMATEL) methods for assessing success factors of e-service quality in the banking sector, Agrawal et al. (2022) introduced a combined AHP—TOPSIS technique. BigBank is an AHP+TOPSIS model suggested by Solaiman and Sharmin (2019) to address the issue of where to place new bank branches. To aid in selecting international investments, Çalık et al. (2019) created a three-stage AHP—TOPSIS decision-making model. Aziz and Çalık (2022) compared three TOPSIS development techniques (AHP—TOPSIS, PFAHP—TOPSIS, and BWM—TOPSIS) for healthcare supplier selection, while Barrios et al. (2016) used an integrated AHP—TOPSIS model to choose the best tomography equipment for a radiology department.
In the realm of supplier selection, the AHP—TOPSIS framework is often used as a viable option. The sustainable supplier selection challenge in the electronics supply chain was addressed by Menon and Ravi (2022). Using AHP—TOPSIS and AHP—VIKOR, Zaman (2020) determined the best mill supplier in Bangladesh. The textile industry’s (Sasi and Digalwar 2015) and the manufacturing sector’s (Sasi and Digalwar 2015) issues with selecting suppliers have also been resolved (Bhutia and Phipon 2012; Vimal et al. 2012). In addition, Berdie et al. (2017) employed a combination of AHP and TOPSIS for integrated software assessment; Yang et al. (2010) proposed a practical evaluation index for supplier selection in an NPP based on the AHP—TOPSIS technique; and so on. The effectiveness of health management information systems was evaluated by Rađenović and Veselinović (2017); an exact, transform, and load (ETL) software-selection problem was addressed by Hanine et al. (2016); and a security-requirements engineering approach to software selection was presented by Abushark et al. (2021).
Hsueh and Lin (2017) presented an integrated AHP—TOPSIS decision process to assess collecting techniques in reverse logistics in the solar sector. Bafail and Abdulaal (2022) used an AHP—TOPSIS and BWM—TOPSIS methodology to evaluate recycling techniques for solid-waste management. Ligus and Peternek (2018) presented a decision-support procedure for prioritizing low-emission energy solutions in Poland based on an integrated fuzzy AHP—TOPSIS technique. In addition, a fuzzy AHP—TOPSIS strategy for selecting solutions for reverse logistics bottlenecks in Thailand was developed by Sirisawat and Kiatcharoenpol (2018).
The nuclear sector often uses AHP—TOPSIS-based techniques for conducting detailed evaluations. Yoon et al. (2015) used a combination of AHP and TOPSIS to examine nuclear fuel cycles across five key evaluation variables. To simplify the difficult task of assessing organizational safety culture, Situmorang et al. (2018) created a multicriteria decision analysis approach using AHP—TOPSIS. Based on a case study evaluating a CNC machine, Anand Babu and Venkataramaiah (2015) used an AHP—TOPSIS method to optimize the process parameters for electrical wire discharge machining. Using a combination of AHP and TOPSIS, Chakladar and Chakraborty (2008) ranked alternative machining techniques in the metal sector. Bakioglu and Atahan (2021) created an efficient procedure for risk assessment of self-driving cars based on the integration of AHP with TOPSIS and VIKOR, while Salehi et al. (2018) used an AHP—TOPSIS strategy for resolving the purchase of technology from abroad for automobiles. For example, the AHP—TOPSIS method was used to choose the best industries to work in (Rahmayanti et al. 2021). Moreover, it was also used to select the best items for inventory management (Kokoç and Ersöz 2019). Furthermore, other applications were to determine the best recipients of excellence awards (Supraja and Kousalya 2016) and among human resource managers candidates (Kusumawardani and Agintiara 2015).
However, there is a perceived lack of studies in the literature exploring the effect of the COVID-19 pandemic outbreak on the Saudi energy sector and studying the disparity of its companies’ financial performances. Therefore, this research paper’s main aim is to conduct a financial evaluation of companies in the Saudi energy sector over three years (i.e., 2019, 2020, and 2021). This is to capture and analyze how the companies have financially performed before, during, and post the pandemic. This is to find the most affected financial performance indicators. As a result, it assists decision-makers in the energy sector in developing strategies to mitigate financial performance disparities during and post-pandemics.
The subsequent section describes the materials and methods used to achieve the study’s objective, including the overall methodology flowchart, collected data, and the hybrid application of the AHP and TOPSIS techniques. The following sections provide the obtained results, a discussion, and the conclusions reached.

2. Materials and Methods

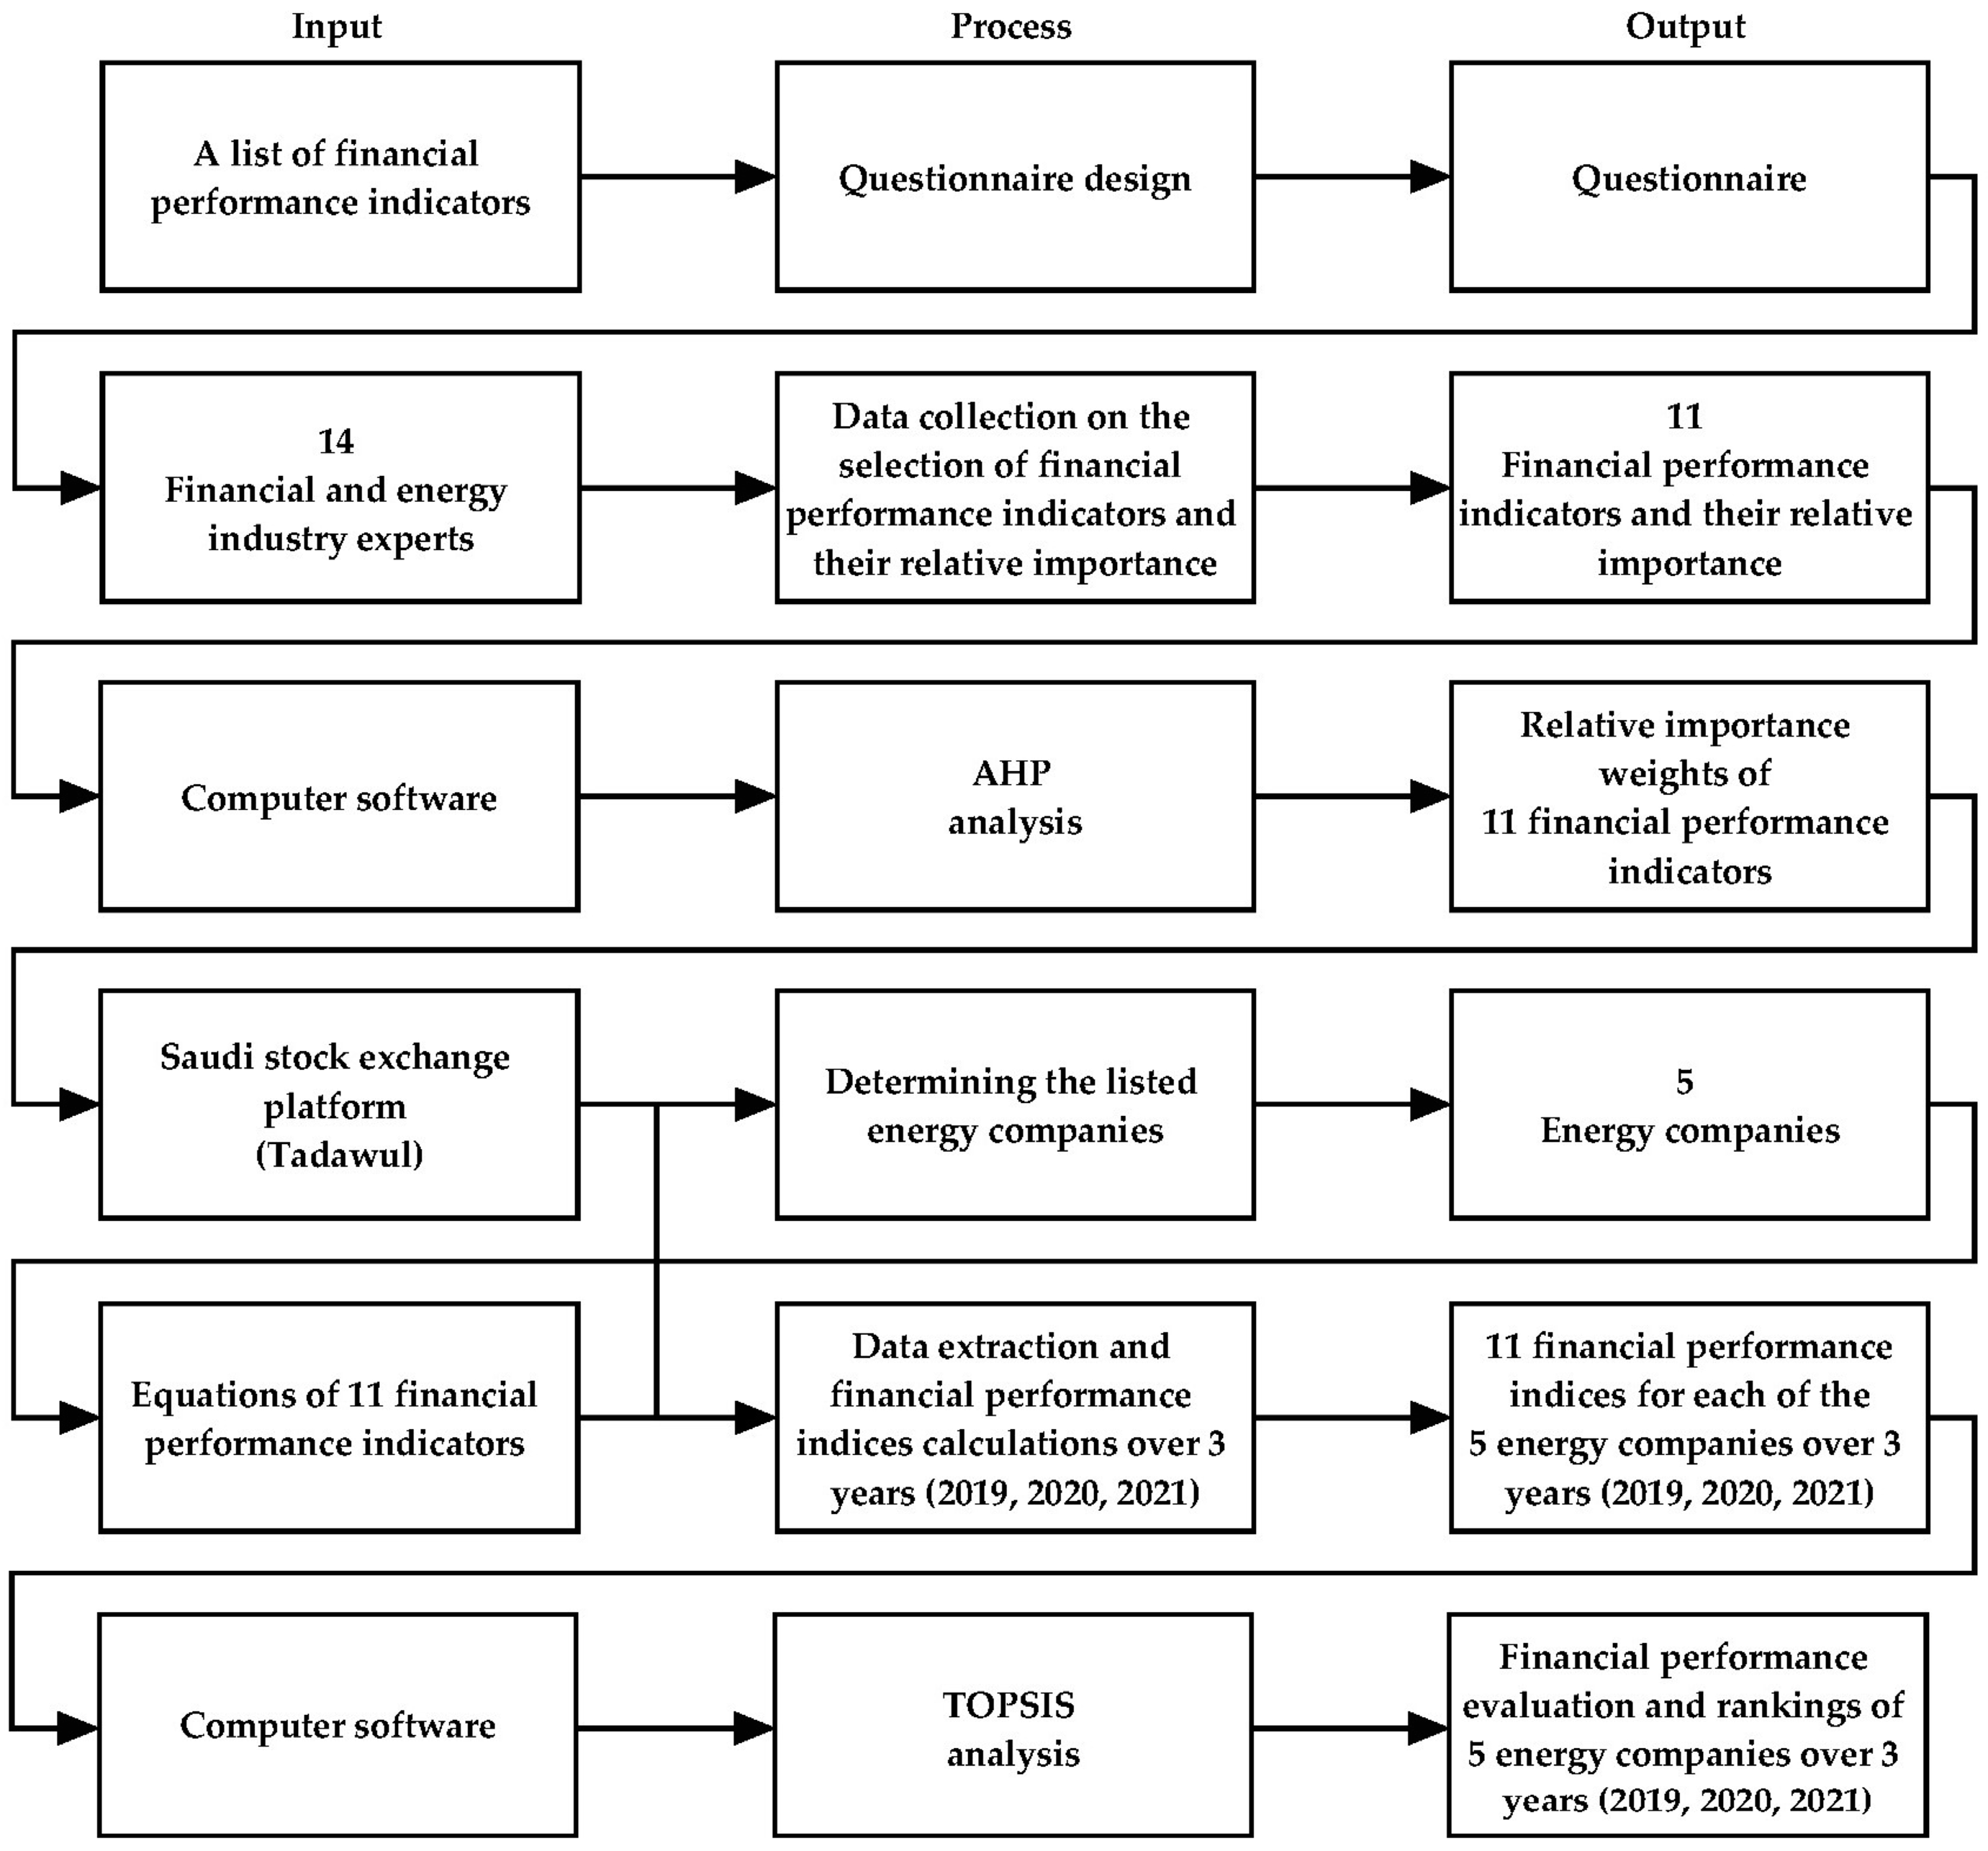
This research study aims to conduct a financial evaluation of companies in the Saudi energy sector over three years (2019, 2020, and 2021). This is to capture and analyze how the companies have financially performed before, during, and post the COVID-19 pandemic, respectively. A hybrid MCDM approach is followed using the AHP and TOPSIS methods to achieve the objective of this research study. Figure 1 presents the methodology flowchart followed to achieve the objective.
A list of 28 financial performance indicators (Shim and Siegel 2022) was used to design a questionnaire as a data collection tool. The questionnaire asks the respondents to select the most appropriate financial performance indicators to evaluate energy companies before, during, and post the COVID-19 pandemic. In addition, it asks the respondents to determine the relative importance of the selected indicators to each other using a pairwise comparison format. Fourteen financial and energy industry specialists from the Saudi exchange market, capital market authority, and ministry of energy were engaged in responding to the questionnaire as experts in the field (Table A1 in Appendix A). The financial performance evaluation of companies in the Saudi energy industry is based on four dimensions and 11 financial performance indicators, which were elected by the engaged experts in this study as listed in Table 1.
The collected relative importance data of the 11 financial performance indicators for measuring the financial performance of companies in the energy sector was determined based on experts’ opinions. Then, AHP was used to find their relative importance weights. Five energy companies were considered for the financial evaluation in this study as they are the only ones listed under the energy sector in the Saudi stock exchange platform (Tadawul 2022). Subsequently, the financial performance data required for calculating the 11 financial performance indices listed in Table 1 were extracted from Tadawul as a secondary data source. The extracted data were then used to calculate the 11 indices for each of the five companies for 2019, 2020, and 2021 using Equations (1)–(11), respectively.
R O A = N e t   I n c o m e T o t a l   A s s e t s
R O E = N e t   I n c o m e S h a r e h o l d e r s   E q u i t y
R O I = N e t   I n c o m e T o t a l   I n v e s t m e n t s
N P M = N e t   I n c o m e T o t a l   r e v e n u e
C R = C u r r e n t   A s s e t s C u r r e n t   L i a b i l i t i e s
C A R = C a s h C u r r e n t   L i a b i l i t i e s
D R = T o t a l   D e b t T o t a l   A s s e t s
D / E = T o t a l   D e b t T o t a l   E q u i t y
A T R = N e t   R e v e n u e T o t a l   A s s e t s
A R T = N e t   R e v e n u e A c c o u n t   R e c e i v a b l e s
F A T = N e t   S a l e s F i x e d   A s s e t s
The found relative importance weights by the AHP analysis and the collected and calculated financial performance data are then used in the TOPSIS analysis. This is to capture the financial performance rankings of the studied companies in the three years (2019, 2020, and 2021) before, during, and post the COVID-19 pandemic, respectively. Details of the used AHP and TOPSIS techniques are provided in the following subsections.

2.1. Analytic Hierarchy Process (AHP)

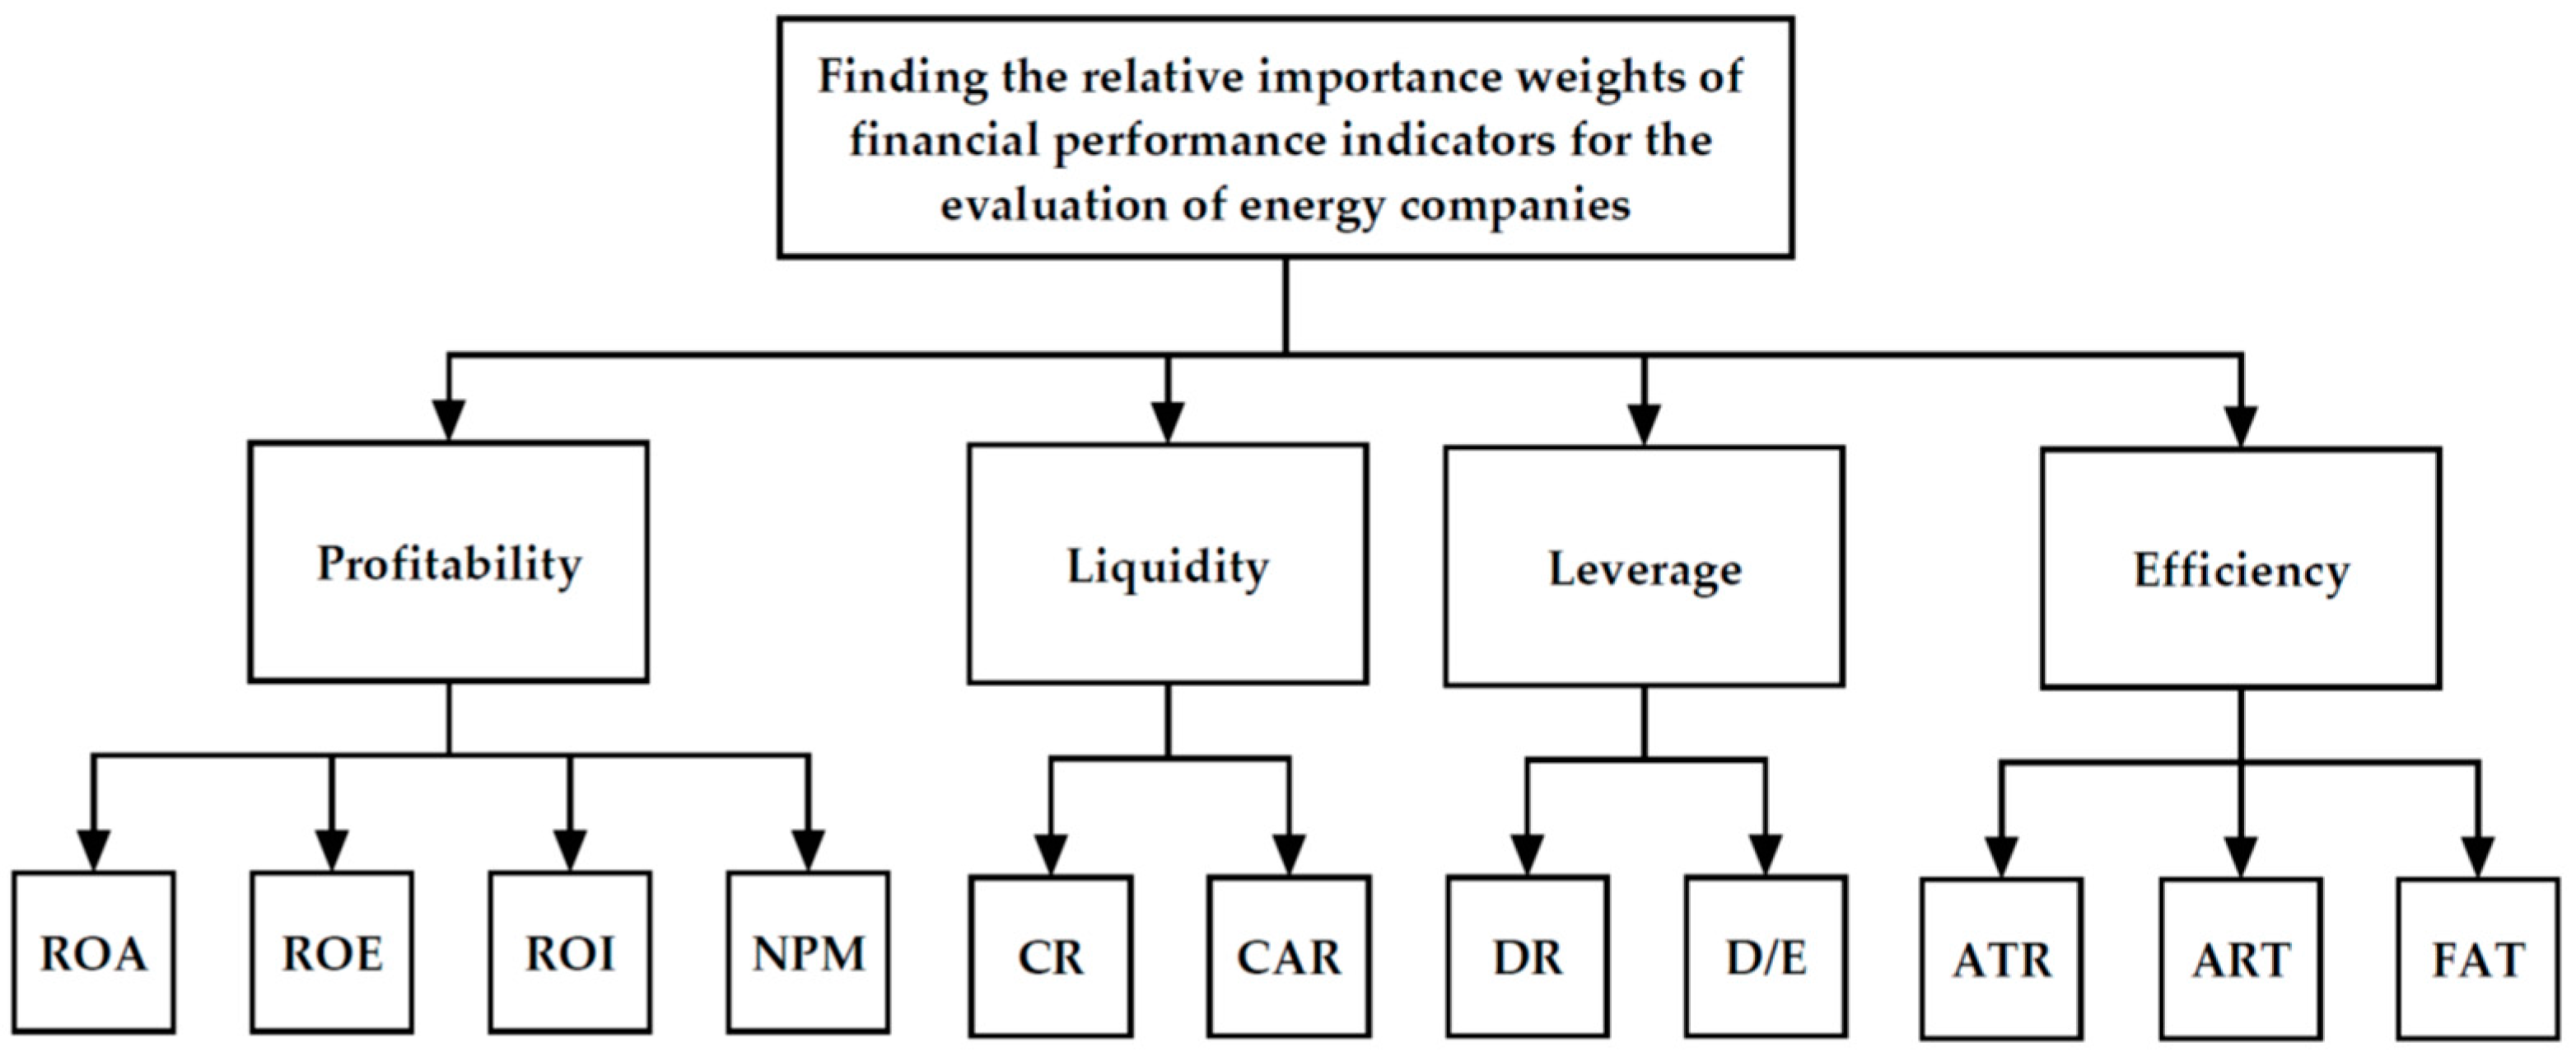
The AHP is used to find the relative importance weights of the four dimensions and 11 financial performance indicators listed in Table 1. The AHP procedure (Saaty 1988; Tzeng and Huang 2011; Thakkar 2021) was implemented based on the schematic hierarchical structure presented in Figure 2. The four financial dimensions were used as the main criteria, and the 11 financial performance indicators were used as alternatives in the AHP analysis, as demonstrated in Figure 2.
The relative importance data were collected using the questionnaire in a pairwise comparison format. Thus, for each unique pair of indicators, they were asked: “in the context of measuring the financial performance of companies in the Saudi energy sector before, during, and post the COVID-19 pandemic, compare the relative importance between each pair of indicators”. The linguistic terms and their corresponding numerical rating scale listed in Table 2 were used by experts to compare and rate the relative importance of each unique combination pair of financial performance indicators. Accordingly, the expert assigned a value between 2 and 9 if they thought the first indicator in a pair was more important than the second indicator of the same pair. They assigned a value of 1 in case both indicators were equally important. Or a reciprocal importance rating value ranging between 1/2 and 1/9 if they thought the second indicator was more important than the first indicator in that pair.
The gathered expert comparison score evaluations of the financial indicators as attributes are then used to create a pairwise comparison matrix A using Equation (12).
A = a 11 a 1 j a 1 n a i 1 a i j a i n a n 1 a n j a n n
where
  • a: represents the attributes,
  • i: represents the row number,
  • j: represents the column number, noting that aij = 1/aji and aij = aik/ajk, and
  • n: the numbers of the attributes (i.e., financial indicators).
The weight matrix W is also generated using Equation (13). The gathered score ratings are then divided by the total score ratings of their related column to create a normalized version of the pairwise comparison matrix and then multiplied by w in (14). The average priority vector is then determined using the normalized matrix
W = w 1         w j         w n w 1 w i w n w 1 w 1 w 1 w j w 1 w n w i w 1 w i w j w i w n w n w 1 w n w j w n w n
W × w = w 1         w j         w n w 1 w i w n w 1 w 1 w 1 w j w 1 w n w i w 1 w i w j w i w n w n w 1 w n w j w n w n w 1 w j w n = n w 1 w j w n
Furthermore, the consistency index (C.I.) is computed using Equation (15) to calculate the consistency ratio (C.R.) using Equation (16) to determine the consistency level of the experts’ subjective inputs.
C . I . = ( λ m a x n ) ( n 1 )
where λmax: represents the largest eigenvalue of the matrix A.
C . R . = C . I . R . I .
where R.I.: represents a random consistency index.
For matrices of size 11 (i.e., 11 elements), R.I. equals a value of 1.51 (Tzeng and Huang 2011). According to Saaty (1980), an appropriate degree of consistency across evaluations is indicated by a consistency ratio value of less than 0.1, but a ratio greater than 0.1 suggests the need for reevaluation.
The last step is to obtain the 11 financial performance indicators’ overall priority rankings and their relative importance rates. Subsequently, the five energy companies will be evaluated using TOPSIS, utilizing the obtained priority rankings as criterion weights. Details of the use of TOPSIS are provided in the following subsection.

2.2. Technique for Order of Preference by Similarity to Ideal Solution (TOPSIS)

The purpose of conducting the TOPSIS analysis is to capture the financial performance ranking differences of the five energy companies under study in the three years (2019, 2020, and 2021) before, during, and post the COVID-19 pandemic, respectively. The rankings will be based on the found relative importance weights of the 11 financial indicators by the AHP analysis and the companies’ collected and calculated financial performance data.
The application process of the TOPSIS is implemented in accordance with (Tzeng and Huang 2011; Saaty 1980) and (Behzadian et al. 2012; Bhutia and Phipon 2012; Hwang and Yoon 1981; Opricovic and Tzeng 2004). Given a set of alternatives, which are the energy companies under study, C = {Ci | i = 1, …, n} and a set of comparison criteria (i.e., attributes), A = {Aj | j = 1, …, m}, which are the 11 the financial performance indicators in Table 1, where X = {xij | i = 1, …, n; j = 1, …, 
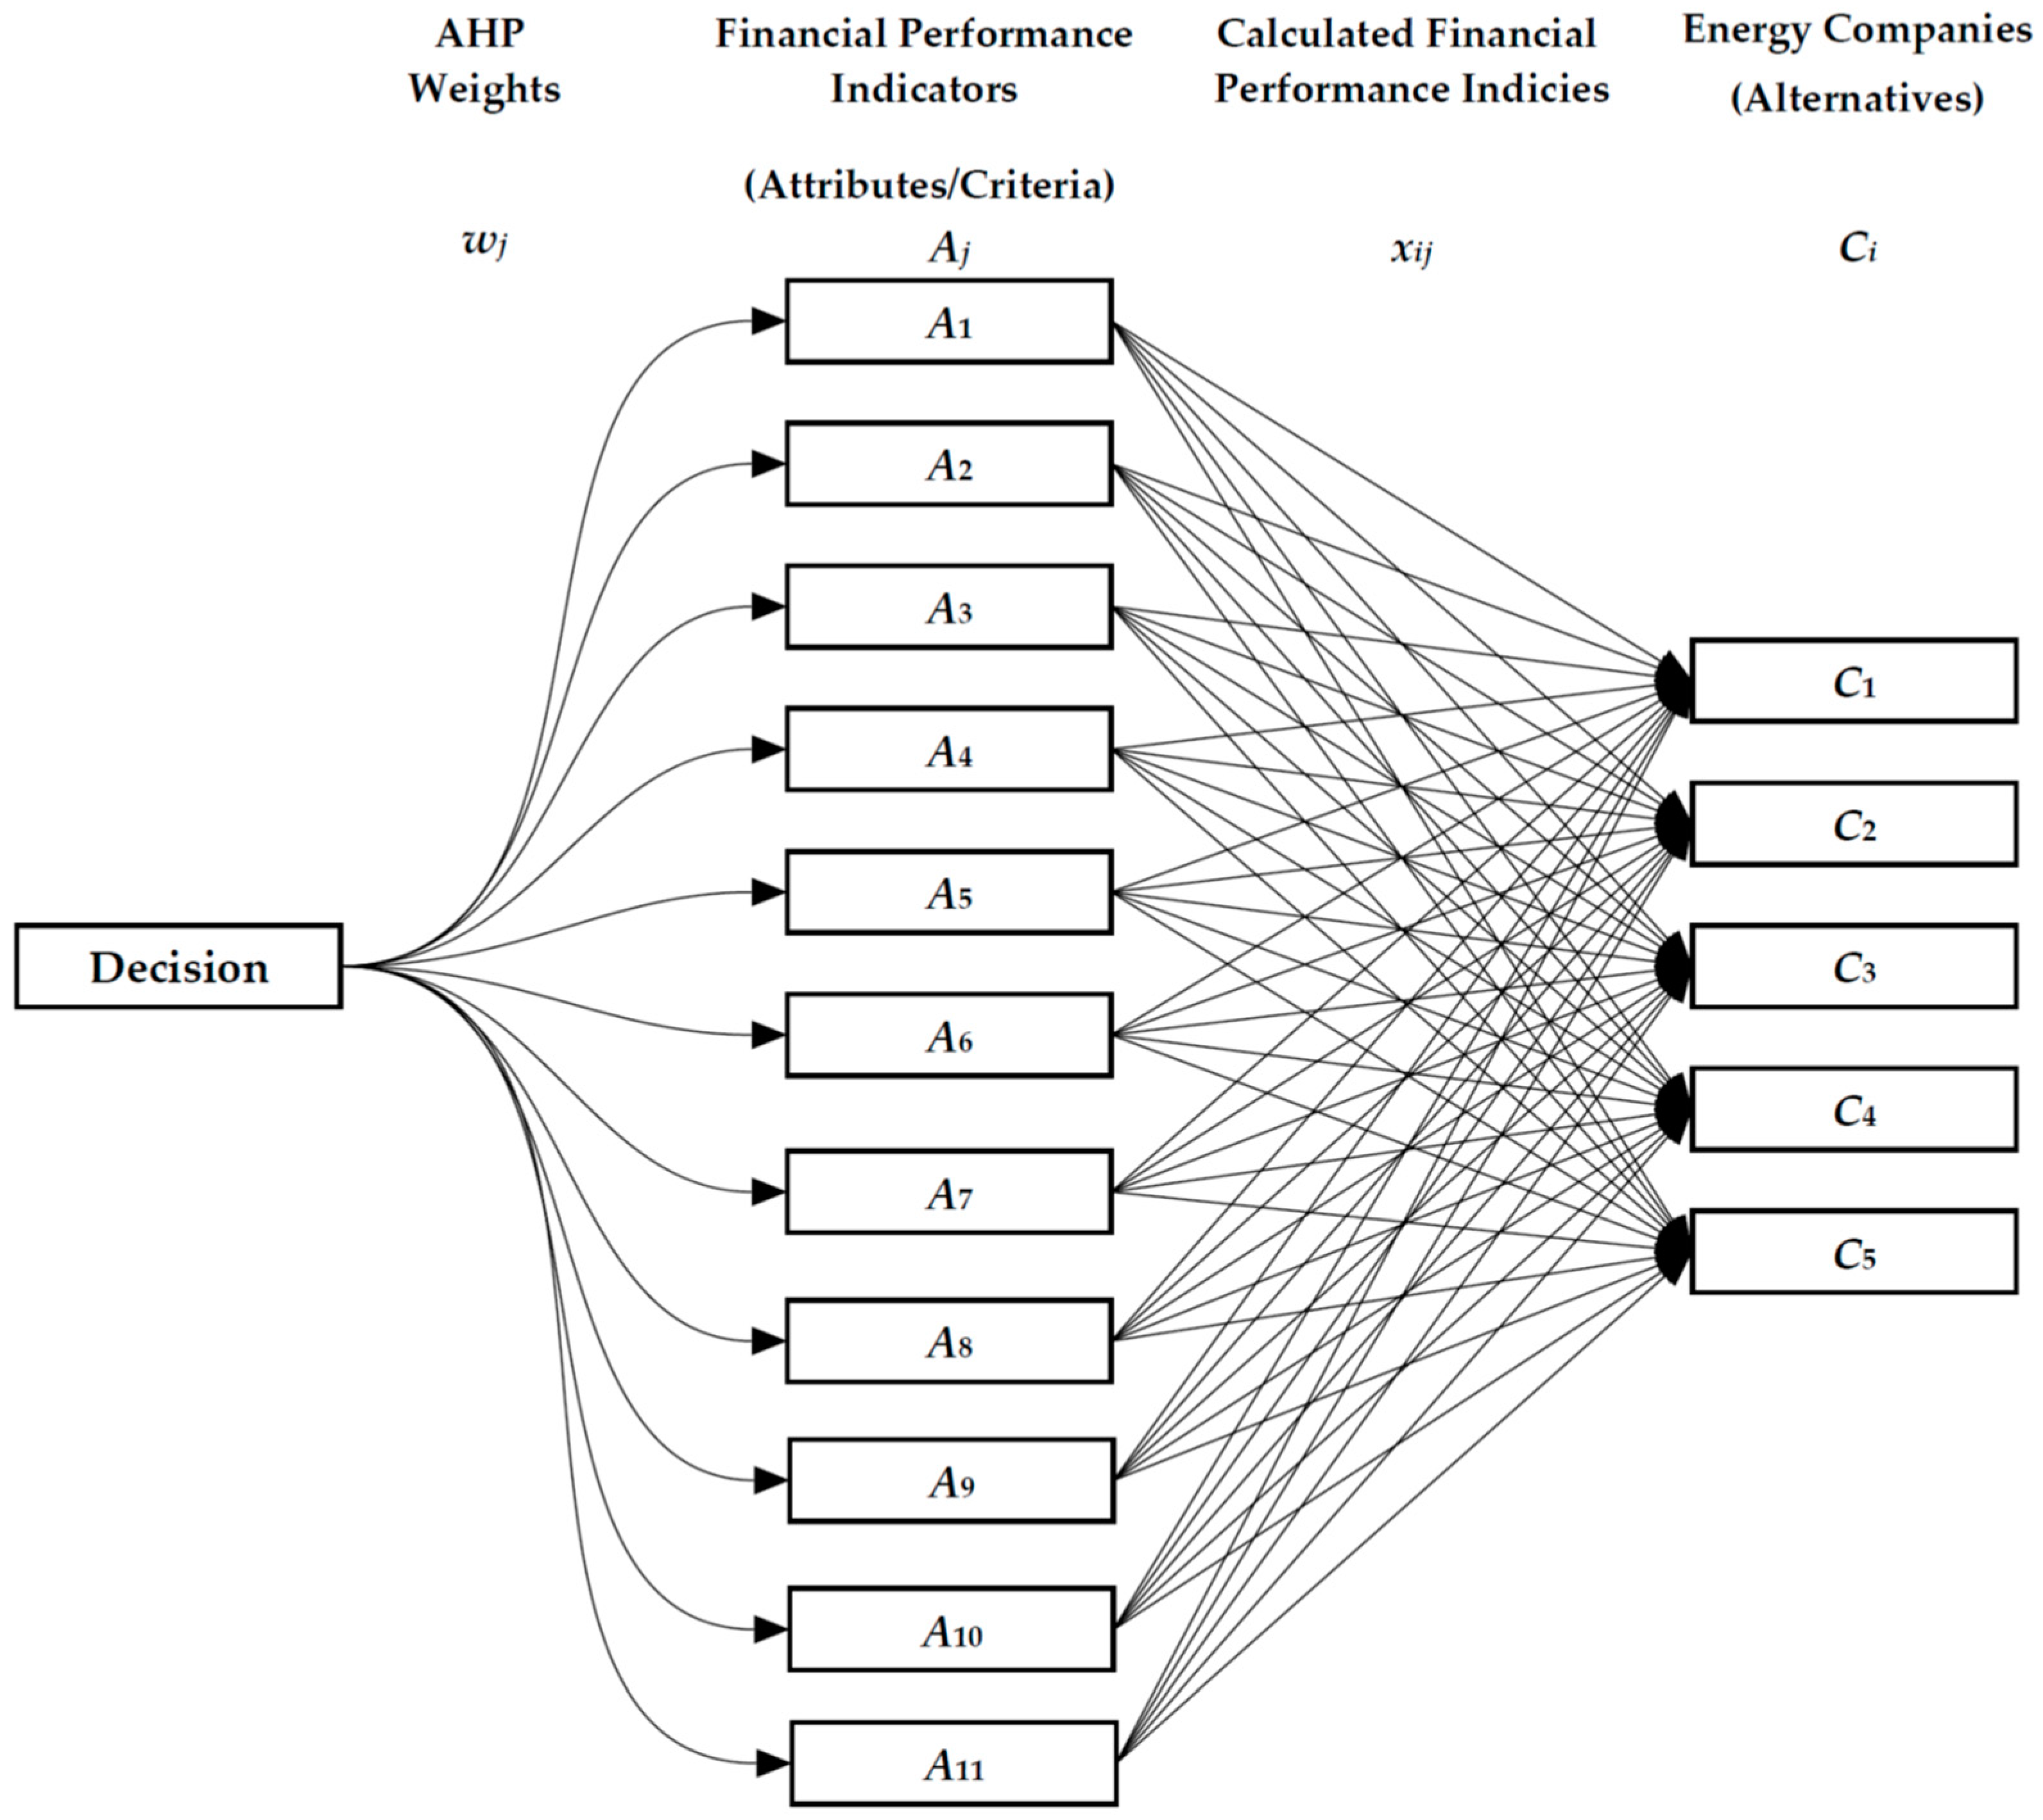
m} denotes the set of calculated financial performance indices of a company, and W = {wj | j = 1, …, m} is the set of criteria importance weights assigned by the experts and resulted from AHP. The conceptual schematic of the TOPSIS application, for this case, is also shown in Figure 3.
Thus, the information matrix for the current problem I = (C, A, X, W) is presented in Equation (17).
I = A 1 A m C 1 C n x 11 x 1 m x n 1 x n m w 1 w m
After developing I in Equation (17) format, a normalized version of performance score ratings in the matrix is calculated using Equation (18).
r i j x = x i j i = 1 n x i j 2
where i = 1, …, n; and j = 1, …, m.
Subsequently, the benefit (i.e., larger is better) and cost (i.e., smaller is better) criteria are calculated using Equations (19) and (20), respectively.
r i j x + = x i j x j x j + x j
r i j x = x j x i j x j x j +
where x j + = maxi  x i j and x j = mini  x i j .
Then, a weighted version of the normalized rating matrix is calculated using Equation (21).
v i j x = w j r i j x ,
where, i = 1, …, n; and j = 1, …, m.
Next, both the ideal positive point (PIS) (i.e., optimal point) and the ideal negative point (NIS) (i.e., inferior point) are obtained using Equations (22) and (23), respectively.
P I S = A + = v 1 + x , v 2 + x , , v j + x , , v m + x = max i v i j x | j J + , min i v i j x | j J | i = 1 , , n
N I S = A = v 1 x , v 2 x , , v j x , , v m x = min i v i j x | j J + , max i v i j x | j J | i = 1 , , n ,
where J + : is the benefit attribute and J : is the cost attribute.
Subsequently, based on the resulting PIS and the NIS between alternatives, the separation values are measured using the Euclidean distance using Equations (24) and (25), and the similarities to the PIS are found using Equation (26).
D i + = j = 1 m v i j x v j + x 2
D i = j = 1 m v i j x v j x 2
where i = 1, …, n.
C i + = D i D i + + D i ,
where i = 1, …, n; and C i +   [0, 1] ∀i = 1, …, n.
Finally, according to the similarities to the PIS ( C i + ), the rank of alternatives is obtained in descending order. The described TOPSIS procedure is repeated for each of the years 2019, 2020, and 2021. Accordingly, three ranked sets of the energy companies under study are obtained based on experts’ weighted financial performance indicators and found using AHP to show how they performed before, during, and post the COVID-19 pandemic. Results of the analysis and a discussion of the findings are provided in the following sections.

3. Results

3.1. Results of the Analytic Hierarchy Process (AHP)

The collected expert opinions data on the relative importance of the studied 11 financial performance indicators (Table 1) are determined using the linguistic terms and their corresponding numerical rating scale (Table 2). The data are used to construct the pairwise comparison matrix shown in Table 3, and a normalized version of the matrix is developed in Table 4 to find the priority vector of the indicators in Table 5, using Equations (12), (13), and (14), respectively.
The λmax is calculated by finding the largest eigenvalue of the pairwise comparison matrix (Table 3) and found to be 12.496. Accordingly, λmax is substituted in Equation (15) to find C.I., which equals a value of 0.150. As mentioned earlier, for a matrix of size 11, the R.I. value used is 1.51. Therefore, using Equation (16), the C.R. equals a value of 0.099, which indicates an acceptable level of consistency being under the recommended threshold (i.e., <0.1). Thus, the found relative importance weights of the studied financial performance indicators (Table 5) were deemed suitable as criteria weights in the TOPSIS analysis.

3.2. Results of the Technique for Order of Preference by Similarity to Ideal Solution (TOPSIS)

The found relative importance weights of the 11 financial performance indicators (Table 5) are used as criteria weights in the TOPSIS analysis to rank the five energy companies (C1C5) under study as alternatives. Following the conceptual schematic of the TOPSIS application demonstrated in Figure 2, a normalized version of the formed information matrix I (17) using the calculated financial performance indices using Equations (1)–(11) for each of the five companies is developed using Equation (18). This was performed for each of the three years (i.e., 2019, 2020, and 2021), as presented in Table 6.
A weighted version of the normalized matrix of each year is calculated using Equation (21); after finding the benefit and cost criteria using Equations (19) and (20) to determine the positive and negative ideal points are obtained using Equations (22) and (23), respectively, as presented in Table 7.
Subsequently, the separation values are measured based on the Euclidean distance using Equations (24) and (25), and the similarities to the PIS are found using Equation (26). This is to find the financial performance rankings (in descending order) of the studied companies in each of the three years (i.e., 2019, 2020, and 2021), as presented in Table 8.

4. Discussion

Results of the AHP analysis showed the relative importance weights of the experts’ elected 11 financial performance indicators and their four dimensions. Results revealed that efficiency and profitability were relatively the most important financial dimensions, with weight scores of 0.367 and 0.366, respectively, for evaluating the performance of energy companies before, during, and post-COVID-19. Leverage and liquidity financial dimensions came next with weight scores of 0.139 and 0.127, respectively. Furthermore, results revealed the relative importance weight scores of the 11 financial indicators (Table 5), showing that ATR is the most important and CR is the least important, with weight scores of 0.172 and 0.015, respectively. These results provide insights for energy companies on the financial dimensions and indicators to maintain and monitor in the case of pandemics.
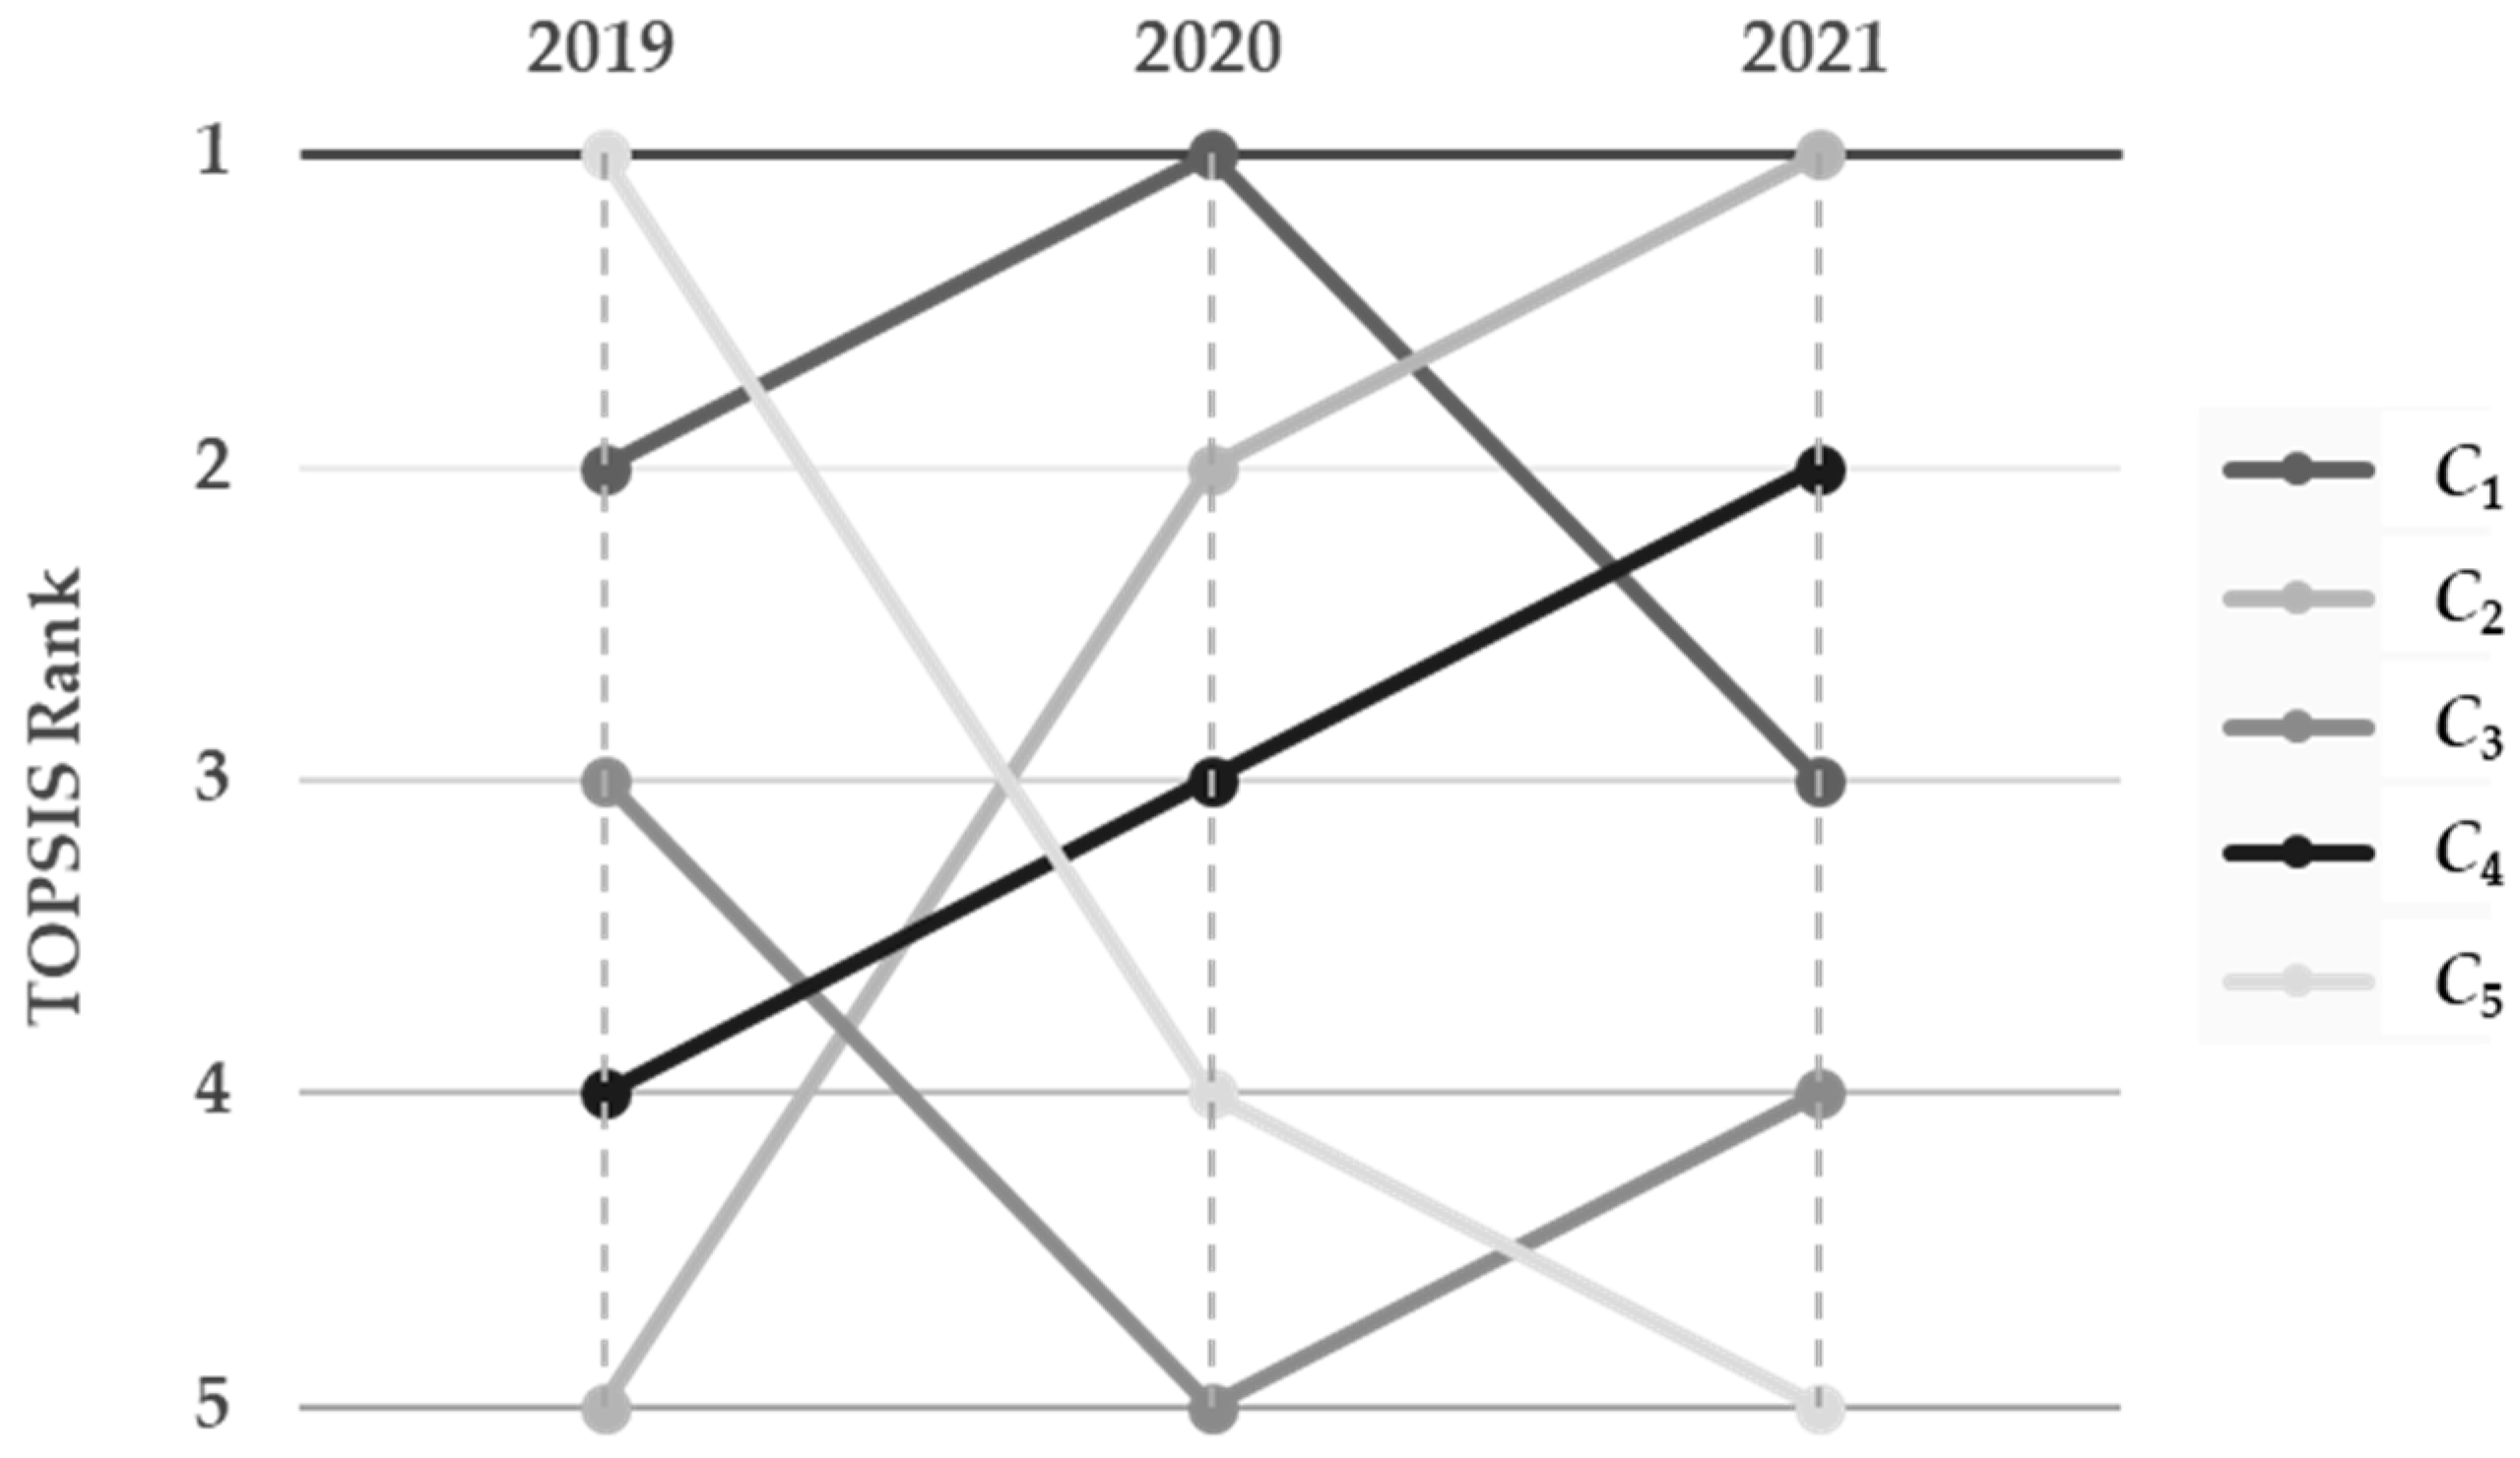
The revealed weights of the 11 financial performance indicators were then used in the TOPSIS analysis to evaluate the financial performance of the five energy companies before, during, and post-COVID-19 over three years (i.e., 2019, 2020, and 2021). After calculating their financial performance indices, the TOPSIS results revealed the effect of COVID-19 on their financial performance in terms of changes in their rankings. Figure 4 demonstrates the change in their financial performance over the three years.
Furthermore, the nonparametric Kendall’s tau-b and Spearman’s rho correlation tests were conducted to measure the strength of change and direction between the resulted rankings of the energy companies based on their financial performance before, during, and after the COVID-19 outbreak as presented in Table 9. Results of both tests show a statistically significant negative change between the rankings of the five energy companies before (i.e., 2019) and post-COVID-19 (i.e., 2021) at −80% and −90%, respectively. Moreover, the results of both tests also show a nonsignificant negative effect at −40% and −50%, respectively, on the financial performance rankings of energy companies before (i.e., 2019) and during the pandemic (i.e., 2020). These results indicate that the energy industry has been negatively affected by the COVID-19 outbreak. Furthermore, the results of both tests also show a nonsignificant positive change at 20% and 30%, respectively, in the financial performance rankings of energy companies post-COVID-19 (i.e., 2021) compared to their performance rankings during the pandemic (i.e., 2020). This indicates a slight improvement and recovery in the energy sector after relaxing the preventive measures and the return of life to normal. This scenario is expected to be common in the energy sector of other countries. Those changes also explain the volatility of oil prices.
The data analysis and interpretations show that total sales, costs, and profits increased after the COVID-19 pandemic. There was an insignificant difference between the pre-and post-COVID-19 pandemic periods in the mutual absolute total revenues, total costs, and profits relationship performances of the Saudi energy businesses. After COVID-19, energy businesses in Saudi saw an increase in their overall income, expenses, and profits, which meant improving Saudi energy companies’ production levels, costs, and management effectiveness. In the years after the epidemic, smaller-scale Saudi energy producers have outperformed their larger-scale counterparts in terms of income, expenses, and profits. After the COVID-19 outbreak, the smaller Saudi energy businesses improved their output, cost-effectiveness, and management. There was a decline in Saudi Arabia’s energy industry’s ability to profit, particularly at the most prominent energy firms. After COVID-19, Saudi energy firms could generate about as much money as they did before the pandemic. During the post-pandemic era, the Saudi energy industry’s liquidity deteriorated. However, the mutual relational liquidity of Saudi Arabia’s energy corporations did not vary much before and during the epidemic. In the wake of the epidemic, smaller Saudi energy businesses are in a stronger position financially than their bigger counterparts. After the outbreak in Saudi Arabia, the energy sector has a firmer financial footing. Since COVID-19, there has been a slight shift in the financial stability of Saudi energy firms’ interdependent relationships with one another. After the epidemic in Saudi Arabia, there were improvements in the financial stability of major manufacturing businesses. As a positive effect of the COVID-19 outbreak, smaller Saudi energy production businesses have benefited from including foreign money in their capital composition. Energy businesses may increase their profits from high-volume production by reducing costs and boosting management efficiency. Large energy producers must reduce expenses to remain competitive with their smaller industry rivals. The giant energy corporations may increase the external funds in their capital composition to realize the advantages of a greater rate of return than the cost of contractual or external capital. Larger energy businesses are encouraged to increase their output in light of the data of energy markets.
The extreme lockdown measures in many countries have resulted in a major decrease in energy use for aircraft, transportation, commercial operations, and industry, but home energy consumption has increased dramatically. About 200 lives per month were saved from carbon emissions in the United States due to reductions in jet fuel consumption by 50%, gasoline by 30%, power demand by 10%, and a corresponding decrease in carbon emissions by 15% (Gillingham et al. 2020). Consequently, the price of oil plummeted from about $60 in early January 2020 to $20 in April 2020 for the Brent grade and from negative values of $30 for the West Texas Intermediate (WTI) grade (Trading Economics 2022).
Jiang et al. (2021) declared the difficulties encountered, the lessons gained, and the new possibilities due to the COVID-19 pandemic’s effect on energy demand and consumption. Limited constraints led to a 9% decline, a partial lockdown led to a 17% drop, and a complete lockdown led to a 24% drop in weekly energy demand in 2020. This equates to a total decline in demand of 626.6 million tons of oil equivalent. Some have argued that the pandemic would also provide possibilities, such as more digitalization, a shift of lifestyle in which people can do their jobs remotely, and the chance to build up locally sourced renewable energy sources (Priya et al. 2021). Similar research has been conducted by Shanmuga Eswari et al. (2021), who examined the global impact of the COVID-19 pandemic on oil prices and energy and its association with the global economy, discussing the challenges and potential of the energy sector and recommending preventative and remedial measures through policy recommendations. They pointed out that the COVID-19 epidemic has enormous potential to restructure the global supply chain of raw materials and manufactured components, new economic structures to speed up economic recovery, green stimulus packages for green growth, and information technology-based solutions. In light of the COVID-19 epidemic, the International Energy Association (IEA) released a detailed report analyzing the global energy sector’s performance and the situation in 2020 (Shanmuga Eswari et al. 2021).
Most nations shut down during the lockdown, which resulted in a considerable decrease in power consumption, with just a slight rise in domestic energy demand. As lockdown restrictions were relaxed in Italy and Germany in May 2020, signs of the recovering energy demand emerged. Many other nations, like India, France, Spain, and the United Kingdom, also experienced this occurrence. The power consumption in June and July of 2020 was much lower than the demand in the corresponding months of 2019 (International Energy Agency 2022).

5. Conclusions

The COVID-19 pandemic has unleashed unprecedented economic wrath over the world. Increased uncertainty, falling securities prices, and dwindling trust caused the financial markets to fall to their lowest point since the 2008–2009 global financial crisis. As a result of the pandemic’s devastating effects on manufacturing, aviation, and transportation fuel, commodity prices worldwide fell in response to decreasing demand. Due to the pandemic’s effect on oil consumption, both energy costs and output have plummeted. Because energy powers so many other industries, it profoundly affects a country’s overall standard of living; financial damages may have far-reaching effects on the economy. Therefore, monitoring the financial performance of such affected enterprises is essential.
In a highly competitive business climate, where investors, creditors, and competitors all have a vested interest in the success of individual companies, the appraisal of energy organizations’ performance is crucial. Furthermore, when a company is compared to its competitors and to itself over time, its performance strengths and weaknesses in the market become apparent, especially during events that affect its performance, such as the pandemic. From this viewpoint, the study’s findings might help businesses reevaluate their objectives and methods. The financial performances of five companies were analyzed using AHP and TOPSIS, with the primary objective being profitability and the secondary criteria being quality of life and environmental sustainability. Metrics were used to evaluate the companies’ bottom lines. The relative importance of each financial dimension and pertaining indicator was then established using the AHP technique. The results revealed that efficiency and profitability were relatively the most important financial dimensions, followed by leverage and liquidity. Furthermore, the results revealed the relative importance of the 11 financial indicators showing that ATR is the most important and CR is the least important for evaluating the performance of energy companies. Next, the TOPSIS approach was used to capture the change in the financial performance of the five companies under consideration before, during, and post-COVID-19.
The findings provide insights for energy companies on the financial dimensions and indicators to maintain and monitor in the case of pandemics. Furthermore, they assist decision-makers in the energy sector in developing strategies to mitigate financial performance disparities during and post-pandemics.
Despite the revealed financial performances of energy companies in this study, the rankings of the companies might change if another set of criteria is used or their weights are modified, which is a future research direction. Moreover, despite the collected data being deemed reliable and representative of the views of the engaged specialists in the field, it is impossible to evaluate their consensus. Therefore, expanding the data collection by involving more specialists might overcome this limitation and assert the results’ validity. Finally, this research study’s results are limited to capturing the effect of COVID-19 on Saudi energy companies’ financial performance. Therefore, reconducting a similar study following a hybrid MCDM approach in other sectors and countries is a research venue in the future.

Author Contributions

Conceptualization, A.A.M. and A.Y.A.; methodology, A.A.M. and A.Y.A.; software, A.A.M. and A.Y.A.; validation, A.A.M. and A.Y.A.; formal analysis, A.A.M. and A.Y.A.; investigation, A.A.M. and A.Y.A.; resources, A.A.M. and A.Y.A.; data curation, A.Y.A.; writing—original draft preparation, A.A.M. and A.Y.A.; writing—review and editing, A.A.M. and A.Y.A.; visualization, A.A.M. and A.Y.A.; supervision, A.A.M. and A.Y.A.; project administration, A.A.M. and A.Y.A. All authors have read and agreed to the published version of the manuscript.

Funding

This research received no external funding.

Institutional Review Board Statement

Not applicable.

Informed Consent Statement

Informed consent was obtained from experts engaged in the study.

Data Availability Statement

Not applicable.

Acknowledgments

The authors acknowledge and thank all the engaged experts in this research study.

Conflicts of Interest

The authors declare no conflict of interest.

Appendix A

Table A1. Experts’ profile.
Expert NumberQualificationSectorYears of Experience
1Ph.D.Saudi Exchange Market12
2Ph.D.Capital Market Authority11
3Ph.D.Capital Market Authority10
4M.Sc.Ministry of Energy10
5Ph.D.Saudi Exchange Market9
6Ph.D.Saudi Exchange Market9
7M.Sc.Saudi Exchange Market9
8M.Sc.Capital Market Authority8
9Ph.D.Capital Market Authority8
10M.Sc.Saudi Exchange Market7
11Ph.D.Capital Market Authority7
12M.Sc.Capital Market Authority6
13B.Sc.Saudi Exchange Market5
14B.Sc.Capital Market Authority4

References

  1. Abdel-Basset, Mohamed, Weiping Ding, Rehab Mohamed, and Noura Metawa. 2020. An integrated plithogenic MCDM approach for financial performance evaluation of manufacturing industries. Risk Management 22: 192–218. [Google Scholar] [CrossRef]
  2. Abushark, Yoosef B., Asif Irshad Khan, Fawaz Jaber Alsolami, Abdulmohsen Almalawi, Md Mottahir Alam, Alka Agrawal, Rajeev Kumar, and Raees Ahmad Khan. 2021. Usability Evaluation through Fuzzy AHP-TOPSIS Approach: Security Requirement Perspective. Computers Materials & Continua 68: 1203–18. [Google Scholar]
  3. Agrawal, Vivek, Nitin Seth, and Jitendra Kumar Dixit. 2022. A combined AHP–TOPSIS–DEMATEL approach for evaluating success factors of e-service quality: An experience from Indian banking industry. Electronic Commerce Research 22: 715–47. [Google Scholar] [CrossRef]
  4. Ajami, Riad. 2020. Globalization, the challenge of COVID-19 and oil price uncertainty. Journal of Asia-Pacific Business 21: 77–79. [Google Scholar] [CrossRef]
  5. Akhtar, Mohammad Hanif, and Muhammad Asif. 2017. Evaluating managerial efficiency of petrochemical firms in Saudi Arabia. Benchmarking: An International Journal 24: 244–56. [Google Scholar] [CrossRef]
  6. Al Garni, Hassan, Abdulrahman Kassem, Anjali Awasthi, Dragan Komljenovic, and Kamal Al-Haddad. 2016. A multicriteria decision making approach for evaluating renewable power generation sources in Saudi Arabia. Sustainable Energy Technologies and Assessments 16: 137–50. [Google Scholar] [CrossRef]
  7. Alagathurai, Alagathurai. 2013. A nexus between liquidity & profitability: A study of trading companies in Sri Lanka. European Journal of Business and Management 5: 221–37. Available online: https://ssrn.com/abstract=2381160 (accessed on 15 December 2022).
  8. Ali, Anis, and Eyad Abu Theeb. 2018. Financial Performance of Petrochemicals Industry in Saudi Arabia: Pre and Post Global Economic Recession. International Journal of Management Studies 4: 21–29. [Google Scholar] [CrossRef]
  9. Ali, Anis, and Mohammad Imdad Haque. 2014. Ratio Analysis: A Comparative Study of National Petrochemicals Co. and Sahara Petrochemicals Co. of Saudi Arabia. International Journal of Management Academy 2: 53–61. Available online: https://www.researchgate.net/profile/Anis-Ali/publication/314507152_Ratio_Analysis_A_Comparative_Study_of_National_Petrochemicals_Co_and_Sahara_Petrochemicals_Co_of_Saudi_Arabia/links/58c2d559a6fdcce648de559a/Ratio-Analysis-A-Comparative-Study-of-National-Petrochemicals-Co-and-Sahara-Petrochemicals-Co-of-Saudi-Arabia.pdf (accessed on 15 December 2022).
  10. AlKhars, Mohammed, Fazlul Miah, Hassan Qudrat-Ullah, and Aymen Kayal. 2020. A systematic review of the relationship between energy consumption and economic growth in GCC countries. Sustainability 12: 3845. [Google Scholar] [CrossRef]
  11. Al-Shuaibi, Khalid, Mohamed Zain, and Norizan Kassim. 2016. Performance indicators for quality, innovation, and competitiveness: A survey on the Saudi manufacturing sector. International Business Research 9: 99–113. [Google Scholar] [CrossRef]
  12. Aminu, Yusuf. 2012. A nexus between liquidity/profitability trade-offs for working capital management in Nigerias manufacturing sector. International Journal of Arts and Commerce 1: 55–58. Available online: https://ijac.org.uk/images/frontImages/gallery/Vol._1_No._6_/7.pdf (accessed on 15 December 2022).
  13. Anand Babu, Kumba, and P. Venkataramaiah. 2015. Multi-response Optimization in Wire Electrical Discharge Machining (WEDM) of Al6061/SiCp Composite Using Hybrid Approach. Journal for Manufacturing Science and Production 15: 327–38. [Google Scholar] [CrossRef]
  14. Anil, Ismail, and Omar Alagha. 2021. The impact of COVID-19 lockdown on the air quality of Eastern Province, Saudi Arabia. Air Quality, Atmosphere & Health 14: 117–28. [Google Scholar] [CrossRef]
  15. Anis, Ali. 2022. Pre and Post COVID-19 Disparity of Financial Performance of Oil and Gas Firms: An Absolute and Relational Study. International Journal of Energy Economics and Policy 12: 396. [Google Scholar]
  16. Aziz, Iayla, and Ahmed Çalık. 2022. Healthcare Supplier Selection using Hybrid Multicriteria Decision Making Methods: A Case Study from Morocco. Preprint. [Google Scholar]
  17. Bafail, Omer A., and Reda M. S. Abdulaal. 2022. A Combined BWM-TOPSIS Approach versus AHP-TOPSIS Approach: An Application to Solid Waste Management. Paper presented at 3rd International Conference on Industrial Engineering and Industrial Management (IEIM), Barcelona, Spain, January 12–14; pp. 27–33. [Google Scholar]
  18. Bakioglu, Gozde, and Ali Osman Atahan. 2021. AHP integrated TOPSIS and VIKOR methods with Pythagorean fuzzy sets to prioritize risks in self-driving vehicles. Applied Soft Computing 99: 106948. [Google Scholar] [CrossRef]
  19. Barrios, Miguel Angel Ortiz, Fabio De Felice, Kevin Parra Negrete, Brandon Aleman Romero, Adriana Yaruro Arenas, and Antonella Petrillo. 2016. An AHP-Topsis Integrated Model for Selecting the Most Appropriate Tomography Equipment. International Journal of Information Technology & Decision Making 15: 861–85. [Google Scholar]
  20. Bashir, Shahid, Nouf Alabdulkarim, Nouf Altwaijri, Nojood Alhaidri, Refan Hashim, Eman Nasim, Ali Mir, Raidah Albaradie, Syed Shahid Habib, and Turki Abualait. 2021. The battle against the COVID-19 pandemic-a perspective from Saudi Arabia. One Health 12: 100229. [Google Scholar] [CrossRef]
  21. Bawa, Jaslene Kaur, Vinay Goyal, S. K. Mitra, and Sankarshan Basu. 2019. An analysis of NPAs of Indian banks: Using a comprehensive framework of 31 financial ratios. IIMB Management Review 31: 51–62. [Google Scholar] [CrossRef]
  22. Behzadian, Majid, S. Khanmohammadi Otaghsara, Morteza Yazdani, and Joshua Ignatius. 2012. A state-of the-art survey of TOPSIS applications. Expert Systems with Applications 39: 13051–69. [Google Scholar] [CrossRef]
  23. Ben-Caleb, Egbide, Uwuigbe Olubukunola, and Uwalomwa Uwuigbe. 2013. Liquidity management and profitability of manufacturing companies in Nigeria. IOSR Journal of Business and Management 9: 13–21. Available online: https://d1wqtxts1xzle7.cloudfront.net/54415160/Manajemen_Likuiditas_dan_Profitabilitas_Manufaktur-libre.pdf?1505232259=&response-content-disposition=inline%3B+filename%3DLiquidity_Management_and_Profitability_o.pdf&Expires=1671105576&Signature=An-Xz1WhodgFJsiKSCe0x4xk0kPLoS-lLOJNOU1rkudKtFLfJXt6Msc9Tz9syfwgqF8YdmMIu32YagLWd327HmLBf5gBJoOsVWD39THU7ve8AS99OI6k3zvE8ygWH~yehYnDMSF1CQfEVX6gCRulpgVcIqmSGNMD-I0sIDT7qFzfU0rdetSmikRUOxZtF2gQ7ujjR25SXUHghX3R2wSX6SLsZMaZSaiuxYhlIfFSzEI52e-pM-z61DBb2GDG0PZdNiqr4Rgb6~j6MsxDn10sQOtFfMNl1kddgFG9V3TSK7Y4BEIXMqzbWyvAX3yI9ifOLc~yTUEKEFycrLBZDCOrsQ__&Key-Pair-Id=APKAJLOHF5GGSLRBV4ZA (accessed on 15 December 2022). [CrossRef]
  24. Berdie, Adela Diana, Mihaela Osaci, Ionel Muscalagiu, and Cristian Barz. 2017. A combined approach of AHP and TOPSIS methods applied in the field of integrated software system. Paper presented at IOP Conference Series: Materials Science and Engineering, Volume 200, Innovative Ideas in Science 2016, Baia Mare, Romania, November 10–11; p. 012041. [Google Scholar]
  25. Bhunia, Amalendu, Islamuddin Khan, and Somnath MuKhuti. 2011. A study of managing liquidity. Journal of Management Research 3: 1. [Google Scholar] [CrossRef]
  26. Bhutia, Pema Wangchen, and Ruben Phipon. 2012. Application of AHP and TOPSIS method for supplier selection problem. IOSR Journal of Engineering 2: 43–50. Available online: http://kgk.uni-obuda.hu/sites/default/files/Appication%20of%20ahp%20and%20topsis%20method%20for%20supplier%20selection.pdf (accessed on 15 December 2022). [CrossRef]
  27. Bildirici, Melike, Nilgun Guler Bayazit, and Yasemen Ucan. 2020. Analyzing crude oil prices under the impact of covid-19 by using lstargarchlstm. Energies 13: 2980. [Google Scholar] [CrossRef]
  28. Bognár, Ferenc, and Petra Benedek. 2021. Case study on a potential application of failure mode and effects analysis in assessing compliance risks. Risks 9: 164. [Google Scholar] [CrossRef]
  29. Bognár, Ferenc, Balázs Szentes, and Petra Benedek. 2022. Development of the PRISM Risk Assessment Method Based on a Multiple AHP-TOPSIS Approach. Risks 10: 213. [Google Scholar] [CrossRef]
  30. Bulgurcu, Berna Kiran. 2012. Application of TOPSIS technique for financial performance evaluation of technology firms in Istanbul stock exchange market. Procedia-Social and Behavioral Sciences 62: 1033–40. [Google Scholar] [CrossRef]
  31. Çalık, Ahmet, Sinan Çizmecioğlu, and Ayhan Akpınar. 2019. An integrated AHP-TOPSIS framework for determination of leading industrial sectors. Journal of Multicriteria Decision Analysis 26: 296–307. [Google Scholar] [CrossRef]
  32. Çaliş, Nevzat, and Şakir Sakarya. 2020. Finansal performans ve hisse senedi getirisi ilişkisi: BIST bankacılık endeksi üzerine bir inceleme. MANAS Sosyal Araştırmalar Dergisi 9: 1046–58. [Google Scholar] [CrossRef]
  33. Chakladar, N. Das, and Samik Chakraborty. 2008. A combined TOPSIS-AHP-method-based approach for non-traditional machining processes selection. Proceedings of the Institution of Mechanical Engineers Part B: Journal of Engineering Manufacture 222: 1613–23. [Google Scholar] [CrossRef]
  34. Ehiedu, Victor Chukwunweike. 2014. The impact of liquidity on profitability of some selected companies: The financial statement analysis (FSA) approach. Research Journal of Finance and Accounting 5: 81–90. Available online: https://core.ac.uk/download/pdf/234629826.pdf (accessed on 15 December 2022).
  35. Ertuğrul, İrfan, and Nilsen Karakaşoğlu. 2009. Performance evaluation of Turkish cement firms with fuzzy analytic hierarchy process and TOPSIS methods. Expert Systems with Applications 36: 702–15. [Google Scholar] [CrossRef]
  36. Farhan, Najib H. S., Eissa Alhomidi, Faozi A. Almaqtari, and Mosab I. Tabash. 2019. Does corporate governance moderate the relationship between liquidity ratios and financial performance? Evidence from Indian pharmaceutical companies. Academic Journal of Interdisciplinary Studies 8: 144–44. [Google Scholar] [CrossRef]
  37. Gillingham, Kenneth T., Christopher R. Knittel, Jing Li, Marten Ovaere, and Mar Reguant. 2020. The short-run and long-run effects of Covid-19 on energy and the environment. Joule 4: 1337–41. [Google Scholar] [CrossRef]
  38. Hanine, Mohamed, Omar Boutkhoum, Abdessadek Tikniouine, and Tarek Agouti. 2016. Application of an integrated multicriteria decision making AHP-TOPSIS methodology for ETL software selection. SpringerPlus 5: 263. [Google Scholar] [CrossRef]
  39. Hashemizadeh, Ali, Yanbing Ju, Seyed Mojtaba Hosseini Bamakan, and Hoang Phong Le. 2021. Renewable energy investment risk assessment in belt and road initiative countries under uncertainty conditions. Energy 214: 118923. [Google Scholar] [CrossRef]
  40. Havrlant, David, Abdulelah Darandary, and Abdelrahman Muhsen. 2021. Early estimates of the impact of the COVID-19 pandemic on GDP: A case study of Saudi Arabia. Applied Economics 53: 1317–25. [Google Scholar] [CrossRef]
  41. Henri, Safa. 2017. The impact of energy on global economy. International Journal of Energy Economics and Policy 7: 287–95. Available online: https://dergipark.org.tr/en/download/article-file/361746 (accessed on 15 December 2022).
  42. Hsueh, Jung-Tang, and Chun-Yueh Lin. 2017. Integrating the AHP and TOPSIS decision processes for evaluating the optimal collection strategy in reverse logistic for the TPI. International Journal of Green Energy 14: 1209–20. [Google Scholar] [CrossRef]
  43. Hwang, Ching-Lai, and Kwangsun Yoon. 1981. Methods for multiple attribute decision making. In Multiple Attribute Decision Making. Berlin and Heidelberg: Springer, pp. 58–191. [Google Scholar] [CrossRef]
  44. International Energy Agency. 2022. COVID-19 Impact on Electricity. Available online: www.iea.org/reports/covid-19-impact-on-electricity (accessed on 15 December 2022).
  45. Jiang, Peng, Yee Van Fan, and Jiří Jaromír Klemeš. 2021. Impacts of COVID-19 on energy demand and consumption: Challenges, lessons and emerging opportunities. Applied Energy 285: 116441. [Google Scholar] [CrossRef] [PubMed]
  46. Khan, Muhammad Nauman, Mohammed Ziaur Rehman, and Imran Khokhar. 2014. Select financial ratios as a determinant of profitability evidence from petrochemical industry in Saudi Arabia. European Journal of Business and Management 6: 187–96. Available online: https://faculty.ksu.edu.sa/sites/default/files/select_financial_ratios_as_a_determinant_of_profitability_evidence_from_petrochemical_industry_in_saudi_arabia.pdf (accessed on 15 December 2022).
  47. Kokoç, Melda, and Süleyman Ersöz. 2019. Comparison of AHP-TOPSIS and AHP-VIKOR Methods in Product Selection in terms of Inventory Management. International Journal of Engineering Research and Development 11: 163–72. [Google Scholar] [CrossRef]
  48. Kumar, Sunil, P. Srivastava, S. K. Sinha, and R. Goyal. 2016. A study of financial efficiency and liquidity position of Indian pharmaceutical industry special reference to Cipla Ltd. International Journal of Innovations in Engineering and Technology 7: 702–11. Available online: https://ijiet.com/wp-content/uploads/2016/07/101.pdf (accessed on 15 December 2022).
  49. Kusumawardani, Renny Pradina, and Mayangsekar Agintiara. 2015. Application of Fuzzy AHP-TOPSIS Method for Decision Making in Human Resource Manager Selection Process. Procedia Computer Science 72: 638–46. [Google Scholar] [CrossRef]
  50. Ligus, Magdalena, and Piotr Peternek. 2018. Determination of most suitable low-emission energy technologies development in Poland using integrated fuzzy AHP-TOPSIS method. Energy Procedia 153: 101–06. [Google Scholar] [CrossRef]
  51. Linares-Mustarós, Salvador, Germà Coenders, and Marina Vives-Mestres. 2018. Financial performance and distress profiles. From classification according to financial ratios to compositional classification. Advances in Accounting 40: 1–10. [Google Scholar] [CrossRef]
  52. Makni, Mohammed S. 2023. Analyzing the impact of COVID-19 on the performance of listed firms in Saudi market. Technological Forecasting and Social Change 187: 122171. [Google Scholar] [CrossRef]
  53. Menon, Rakesh R., and V. Ravi. 2022. Using AHP-TOPSIS methodologies in the selection of sustainable suppliers in an electronics supply chain. Cleaner Materials 5: 100130. [Google Scholar] [CrossRef]
  54. Opricovic, Serafim, and Gwo-Hshiung Tzeng. 2004. Compromise solution by MCDM methods: A comparative analysis of VIKOR and TOPSIS. European Journal of Operational Research 156: 445–55. [Google Scholar] [CrossRef]
  55. Özden, Ünal H., Özlem Deniz Başar, and Seda Bağdatli Kalkan. 2012. Imkb’de Işlem Gören Çimento Sektöründeki Şirketlerin Finansal Performanslarinin Vikor Yöntemi Ile Siralanmasi. Istanbul University Econometrics and Statistics e-Journal 17: 23–44. Available online: https://dergipark.org.tr/en/download/article-file/95000 (accessed on 15 December 2022).
  56. Öztürk, Erkan. 2017. Farklı finansal raporlardan elde edilen performans ölçütleri ile cari piyasa değerleri arasındaki ilişkinin belirlenmesi: BIST 50 şirketleri üzerine bir araştırma. Mali Çözüm Dergisi. Available online: http://acikerisim.kirklareli.edu.tr/xmlui/bitstream/handle/20.500.11857/1070/MAKALE.pdf?sequence=1&isAllowed=y (accessed on 15 December 2022).
  57. Panigrahi, C. M. A., Namita Raul, and Chaitrali Gijare. 2018. Liquidity and profitability trade-off: A study of Indian pharmaceutical companies. NMIMS Journal of Economics and Public Policy 3. Available online: https://ssrn.com/abstract=3202098 (accessed on 15 December 2022).
  58. Perwitasari, Dian, Doddy Setiawan, An Nurrahmawati, and Isna Putri Rahmawati. 2022. Firm Performance during COVID-19 Pandemic: Does Ownership Identity Matter? Evidence from Indonesia. Journal of Risk and Financial Management 15: 444. [Google Scholar] [CrossRef]
  59. Pineda, Pedro Jose Gudiel, James J. H. Liou, Chao-Che Hsu, and Yen-Ching Chuang. 2018. An integrated MCDM model for improving airline operational and financial performance. Journal of Air Transport Management 68: 103–17. [Google Scholar] [CrossRef]
  60. Priya, K., and B. Nimalathasan. 2013. Liquidity management and profitability: A case study of listed manufacturing companies in Sri Lanka. International Journal of Technological Exploration and Learning 2: 161–65. Available online: https://www.researchgate.net/profile/Nimalathasan-Balasundaram/publication/255910992_Liquidity_Management_and_Profitability_A_Case_Study_of_Listed_Manufacturing_Companies_in_Sri_Lanka/links/00b7d520de21434bd9000000/Liquidity-Management-and-Profitability-A-Case-Study-of-Listed-Manufacturing-Companies-in-Sri-Lanka.pdf (accessed on 15 December 2022).
  61. Priya, S. Shanmuga, Erdem Cuce, and K. Sudhakar. 2021. A perspective of COVID 19 impact on global economy, energy and environment. International Journal of Sustainable Engineering 14: 1290–305. [Google Scholar] [CrossRef]
  62. Pushparaj Kulkarni, D., and V. Pimplapure. 2019. An analytical study of profitability of pharmaceutical companies in India. Journal of the Gujarat Research Society 21: 50–57. Available online: http://gujaratresearchsociety.in/index.php/JGRS/article/view/1792 (accessed on 15 December 2022).
  63. Rađenović, Žarko, and Ivana Veselinović. 2017. Integrated AHP-TOPSIS Method for the Assessment of Health Management Information Systems Efficiency. Economic Themes 55: 121–42. [Google Scholar] [CrossRef]
  64. Rahmayanti, Dina, Yumi Meuthia, Justin Albin, and Ahmad Hafizh. 2021. An integrated AHP-TOPSIS framework for determination of leading industrial sectors. Jurnal Sistem dan Manajemen Industri 5: 115–24. [Google Scholar] [CrossRef]
  65. Rehman, Mohammed Ziaur, Muhammad Nauman Khan, and Imran Khokhar. 2015. Investigating liquidity-profitability relationship: Evidence from companies listed in Saudi stock exchange (Tadawul). Journal of Applied Finance and Banking 5: 159. Available online: https://faculty.ksu.edu.sa/sites/default/files/investigating_liquidity-profitability_relationship_evidence_from_companies_listed_in_saudi_stock_exchange_tadawul.pdf (accessed on 15 December 2022).
  66. Rezaie, Kamran, Sara Saeidi Ramiyani, Salman Nazari-Shirkouhi, and Ali Badizadeh. 2014. Evaluating performance of Iranian cement firms using an integrated fuzzy AHP–VIKOR method. Applied Mathematical Modelling 38: 5033–46. [Google Scholar] [CrossRef]
  67. Saaty, Thomas. 1980. The analytic hierarchy process (AHP) for decision making. Kobe, Japan 1: 69. [Google Scholar]
  68. Saaty, Thomas L. 1988. What is the analytic hierarchy process? In Mathematical Models for Decision Support. Berlin and Heidelberg: Springer, pp. 109–21. Available online: https://link.springer.com/content/pdf/10.1007/978-3-642-83555-1_5.pdf (accessed on 15 December 2022).
  69. Salehi, Seyedmohammad, Maghsoud Amiri, Pezhman Ghahremani, and Mohammadali Abedini. 2018. A Novel Integrated AHP-TOPSIS Model to Deal with Big Data in Group Decision Making. Paper presented at International Conference on Industrial Engineering and Operations Management, Washington, DC, USA, September 27–29; pp. 1043–53. [Google Scholar]
  70. Sasi, Jayaram C., and Abhijeet K. Digalwar. 2015. Application of AHP and TOPSIS Method for Supplier Selection Between India & China in Textile Industry. International Research Journal of Engineering and Technology 2: 1730–38. [Google Scholar]
  71. Shanmuga Eswari, M., N. Indumathi, and R. Ramalakshmi. 2021. COVID-19 Epidemic Analysis and Prediction in Virudhunagar District Using Machine Learning. In Artificial Intelligence for COVID-19. Cham: Springer, pp. 311–27. [Google Scholar] [CrossRef]
  72. Shaverdi, Meysam, Mohammad Rasoul Heshmati, and Iman Ramezani. 2014. Application of fuzzy AHP approach for financial performance evaluation of Iranian petrochemical sector. Procedia Computer Science 31: 995–1004. [Google Scholar] [CrossRef]
  73. Shim, Jae K., and Joel G. Siegel. 2022. Financial Management, 3rd ed. SCHAUM’S OUTLINE SERIES. New York: McGraw-Hill. [Google Scholar] [CrossRef]
  74. Sinha, S. K., R. Goyal, S. Kumar, and V. A. Gupta. 2016. Study on Engineering of Cash Management and its impact on Profitability of Indian Pharmaceutical Industry with Special Reference to Cipla Ltd. International Journal of Innovations in Engineering and Technology (IJIET) 6: 469–78. Available online: https://www.semanticscholar.org/paper/A-Study-on-Engineering-of-Cash-Management-and-its-Sinha/dc6bd14c5cdc5b3b57d9b13153e972955dfa65ee (accessed on 15 December 2022).
  75. Sirisawat, Pornwasin, and Tossapol Kiatcharoenpol. 2018. Fuzzy AHP-TOPSIS approaches to prioritizing solutions for reverse logistics barriers. Computers & Industrial Engineering 117: 303–18. [Google Scholar]
  76. Situmorang, Johnny, Iman Kuntoro, Sigit Santoso, M. Subekti, and Geni Rina Sunaryo. 2018. Analysis respons to the implementation of nuclear installations safety culture using AHP-TOPSIS. Journal of Physics: Conference Series 962: 012051. [Google Scholar] [CrossRef]
  77. Sodha, S. 2020. A Comparison of Pharma Companies Based on Profitability and Liquidity. Tathapi 7: 2711–2720. [Google Scholar]
  78. Solaiman, K., and Sadia Sharmin. 2019. BigBank: A GIS Integrated AHP-TOPSIS Based Expansion Model for Banks. Paper presented at 15th International Conference on Signal-Image Technology & Internet-Based Systems (SITIS), Sorrento, Italy, November 26–29; pp. 311–18. [Google Scholar]
  79. Supraja, S., and Pappu Kousalya. 2016. A comparative study by AHP and TOPSIS for the selection of all round excellence award. Paper presented at the International Conference on Electrical, Electronics, and Optimization Techniques (ICEEOT), Chennai, India, March 3–5; pp. 314–19. [Google Scholar]
  80. Tadawul. 2022. Saudi Stock Exchange Platform. Available online: https://www.saudiexchange.sa/wps/portal/tadawul/markets?locale=en (accessed on 15 December 2022).
  81. Thakkar, Jitesh J. 2021. Multicriteria Decision Making. Berlin and Heidelberg: Springer, vol. 336. [Google Scholar]
  82. Trading Economics. 2022. Crude Oil. Available online: https://tradingeconomics.com/commodity/crude-oil (accessed on 15 December 2022).
  83. Tzeng, Gwo-Hshiung, and Jih-Jeng Huang. 2011. Multiple Attribute Decision Making: Methods and Applications. Boca Raton: CRC Press. [Google Scholar]
  84. Vimal, Jyoti, Vedansh Chaturvedi, and Ashutosh Kumar Dubey. 2012. Application of Topsis Method for Supplier Selection in Manufacturing Industry. International Journal of Research in Engineering & Applied Sciences 2: 25–35. [Google Scholar]
  85. Wüstenhagen, Rolf, and Emanuela Menichetti. 2012. Strategic choices for renewable energy investment: Conceptual framework and opportunities for further research. Energy Policy 40: 1–10. [Google Scholar] [CrossRef]
  86. Xu, Jian, and Zhenji Jin. 2022. Exploring the Impact of the COVID-19 Pandemic on Firms’ Financial Performance and Cash Holding: New Evidence from China’s Agri-food Sector. Agronomy 12: 1951. [Google Scholar] [CrossRef]
  87. Yalcin, Nese, Ali Bayrakdaroglu, and Cengiz Kahraman. 2012. Application of fuzzy multicriteria decision making methods for financial performance evaluation of Turkish manufacturing industries. Expert Systems with Applications 39: 350–64. [Google Scholar] [CrossRef]
  88. Yang, Guang, Wen Jie Huang, and Lin Li Lei. 2010. Using AHP and TOPSIS Approaches in Nuclear Power Plant Equipment Supplier Selection. Key Engineering Materials 419–420: 761–64. [Google Scholar] [CrossRef]
  89. Yoon, S. R., S. Y. Choi, and W. I. Koc. 2015. Nuclear Fuel Cycle Analysis by Integrated AHP and TOPSIS Method Using an Equilibrium Model. Paper presented at the Korean Nuclear Society Spring Meeting, Jeju, Korea, May 7–8; p. 1CD-ROM. Available online: https://inis.iaea.org/search/search.aspx?orig_q=RN:47023547 (accessed on 26 January 2022).
  90. Zaman, Mobasshira. 2020. Supplier Selection Using AHP-VIKOR and AHP-TOPSIS Method: A Case Study for Bangladeshi Jute Mill of Khulna Region. SSRG International Journal of Industrial Engineering 7: 1–11. [Google Scholar] [CrossRef]
Figure 1. Methodology flowchart.
Economies 11 00061 g001
Figure 2. The schematic hierarchical structure of AHP.
Economies 11 00061 g002
Figure 3. Conceptual schematic of TOPSIS application.
Economies 11 00061 g003
Figure 4. TOPSIS rankings of energy companies based on their financial performance before, during, and post-COVID-19.
Economies 11 00061 g004
Table 1. Financial performance indicators as evaluation criteria.
DimensionIndicatorAcronymDescription *
ProfitabilityReturn on AssetsROAA financial ratio measures a company’s profitability concerning its total assets.
Return on EquityROEA financial ratio measures a company’s profitability and efficiency in converting its equity financings to profits reflecting the shareholder equity net income or return rate on the money invested in the company by equity investors.
Return on InvestmentROIA financial ratio evaluates or compares an investment’s efficiency or profitability to quantify the return on a given investment directly concerning the cost of the investment.
Net Profit MarginNPMA financial ratio measures and contrasts gross profit with sales income to demonstrate how much a company earns, considering the costs needed to create its goods and services.
LiquidityCurrent RatioCRA liquidity ratio measures a company’s ability to pay short-term obligations or those due within one year.
Cash Asset RatioCARA financial ratio determines a company’s liquidity by assessing its ability to pay off its short-term obligations with cash and cash equivalents.
LeverageDebt RatioDRA debt ratio measures a company’s leverage in terms of total debt to total assets.
Debt-to-Equity RatioD/EA financial leverage ratio compares a company’s total liabilities to its shareholder equity.
EfficiencyAssets Turnover RatioATRA financial ratio measures the value of a company’s sales or revenues relative to the value of its assets.
Account Receivable TurnoverARTAn accounting measure used to quantify how efficiently a company collects receivables from its clients.
Fixed Assets TurnoverFATA ratio measures a company’s efficiency in generating net sales from its fixed-asset investments.
* Reference (Shim and Siegel 2022).
Table 2. Linguistic terms and their corresponding numerical rating scale for AHP.
ScaleLinguistic Terms
9Extremely more important
7Very strongly more important
5Strongly more important
3Moderately more important
1Equally important
2, 4, 6, and 8In-between judgmental comparison ratings
1/2, 1/3, 1/4, 1/5, 1/6, 1/7, 1/8, 1/9Ratings for inverse comparisons
Table 3. Pairwise comparison matrix of financial performance indicators using the Analytic Hierarchy Process (AHP).
ROAROEROINPMCRCARDRD/EATRARTFAT
ROA11155135511
ROE111/3131/3111/51/31
ROI131171131/513
NPM1/511131/31/311/51/31/3
CR1/51/31/71/311/91/71/31/91/71/5
CAR131391151/311
DR1/31137113113
D/E1/511/3131/51/311/51/31/3
ATR1/55559315111
ART13137113111
FAT111/33511/33111
Sum7.13320.33312.14326.33359.0009.97810.14330.33310.2448.14312.867
Table 4. Normalized pairwise comparison matrix of financial performance indicators using the Analytic Hierarchy Process (AHP).
ROAROEROINPMCRCARDRD/EATRARTFAT
ROA0.1400.0490.0820.1900.0850.1000.2960.1650.4880.1230.078
ROE0.1400.0490.0270.0380.0510.0330.0990.0330.0200.0410.078
ROI0.1400.1480.0820.0380.1190.1000.0990.0990.0200.1230.233
NPM0.0280.0490.0820.0380.0510.0330.0330.0330.0200.0410.026
CR0.0280.0160.0120.0130.0170.0110.0140.0110.0110.0180.016
CAR0.1400.1480.0820.1140.1530.1000.0990.1650.0330.1230.078
DR0.0470.0490.0820.1140.1190.1000.0990.0990.0980.1230.233
D/E0.0280.0490.0270.0380.0510.0200.0330.0330.0200.0410.026
ATR0.0280.2460.4120.1900.1530.3010.0990.1650.0980.1230.078
ART0.1400.1480.0820.1140.1190.1000.0990.0990.0980.1230.078
FAT0.1400.0490.0270.1140.0850.1000.0330.0990.0980.1230.078
Sum1.0001.0001.0001.0001.0001.0001.0001.0001.0001.0001.000
Table 5. Priority vector of financial performance indicators based on the Analytic Hierarchy Process (AHP) analysis.
ROAROEROINPMCRCARDRD/EATRARTFAT
Weight 10.1630.0550.1090.0390.0150.1120.1060.0330.1720.1090.086
1 Sum of weights equals 1.
Table 6. Normalized matrix of the Technique for Order of Preference by Similarity to Ideal Solution (TOPSIS).
YearCompaniesROAROEROINPMCRCARDRD/EATRARTFAT
0.1630.0550.1090.0390.0150.1120.1060.0330.1720.1090.086
2019C10.9710.9090.6380.4200.6950.6150.3920.2150.2830.4240.233
C20.0040.0190.3420.1130.0270.0050.0400.0020.0010.0010.001
C30.1390.1980.0550.6470.4290.0950.5460.4620.0700.1660.051
C40.0300.0220.0010.6260.5230.7820.0190.0080.0040.0230.003
C50.1920.3650.6870.0210.2440.0330.7390.8610.9570.8900.971
2020C10.9490.9510.4130.0360.6780.1460.9290.9740.9990.9971.000
C20.0850.1960.8280.7580.2970.0910.2020.0070.0030.0060.003
C30.2970.2230.0140.4670.5170.1810.2970.2260.0320.0800.023
C40.0420.0160.0000.2920.4070.9680.0070.0030.0010.0070.001
C50.0390.0900.3780.3460.1360.0410.0920.0030.0020.0030.001
2021C10.9310.8960.1890.1950.4260.3000.4070.3090.9010.8350.911
C20.0400.1790.9800.5050.1570.0240.4010.0210.0250.0270.023
C30.1900.2780.0230.4280.3750.0660.8090.9450.3190.4650.285
C40.0730.0530.0010.7210.7960.9460.0500.0290.0340.1140.028
C50.3020.2910.0610.0630.1380.0970.1320.1000.2920.2710.296
Table 7. Weighted normalized matrix of the Technique for Order of Preference by Similarity to Ideal Solution (TOPSIS).
YearCompaniesROAROEROINPMCRCARDRD/EATRARTFAT
2019C10.1590.0500.0700.0170.0100.0690.0410.0070.0490.0460.020
C20.0010.0010.0370.0040.0000.0010.0040.0000.0000.0000.000
C30.0230.0110.0060.0260.0060.0110.0580.0150.0120.0180.004
C40.0050.0010.0000.0250.0080.0880.0020.0000.0010.0030.000
C50.0310.0200.0750.0010.0040.0040.0780.0290.1640.0970.083
A+0.0010.0500.0750.0260.0100.0880.0780.0290.1640.0970.083
A0.1590.0010.0000.0010.0000.0010.0020.0000.0000.0000.000
2020C10.1550.0530.0450.0010.0100.0160.0980.0320.1720.1090.086
C20.0140.0110.0900.0300.0040.0100.0210.0000.0010.0010.000
C30.0480.0120.0020.0180.0080.0200.0310.0080.0050.0090.002
C40.0070.0010.0000.0120.0060.1080.0010.0000.0000.0010.000
C50.0060.0050.0410.0140.0020.0050.0100.0000.0000.0000.000
A+0.0060.0530.0900.0300.0100.1080.0980.0320.1720.1090.086
A0.1550.0010.0000.0010.0020.0050.0010.0000.0000.0000.000
2021C10.1520.0500.0210.0080.0060.0340.0430.0100.1550.0910.078
C20.0070.0100.1070.0200.0020.0030.0420.0010.0040.0030.002
C30.0310.0150.0030.0170.0060.0070.0850.0310.0550.0510.025
C40.0120.0030.0000.0280.0120.1060.0050.0010.0060.0120.002
C50.0490.0160.0070.0020.0020.0110.0140.0030.0500.0300.025
A+0.0070.0500.1070.0280.0120.1060.0850.0310.1550.0910.078
A0.1520.0030.0000.0020.0020.0030.0050.0010.0040.0030.002
Table 8. Priority vectors of the Technique for Order of Preference by Similarity to Ideal Solution (TOPSIS).
YearCompaniesDi+DiCi+Rank
2019C10.2170.1370.3872
C20.2480.1620.3955
C30.2210.1520.4073
C40.2390.1780.4274
C50.0980.2680.7331
2020C10.1830.2530.5801
C20.2580.1720.3992
C30.2630.1150.3045
C40.2650.1810.4063
C50.2700.1550.3644
2021C10.1910.2030.5153
C20.2270.1850.4491
C30.1930.1670.4644
C40.2350.1770.4292
C50.2150.1190.3575
Table 9. Kendall’s tau-b and Spearman’s rho correlation tests of energy companies’ rankings based on their financial performance before, during, and post-COVID-19.
Kendall’s tau-bSpearman’s rho
Year201920202021201920202021
20191.000−0.400−0.800 *1.000−0.500−0.900 *
2020 1.0000.200 1.0000.300
2021 1.000 1.000
* Statistically significant at p < 0.05 level.
Disclaimer/Publisher’s Note: The statements, opinions and data contained in all publications are solely those of the individual author(s) and contributor(s) and not of MDPI and/or the editor(s). MDPI and/or the editor(s) disclaim responsibility for any injury to people or property resulting from any ideas, methods, instructions or products referred to in the content.

