Article

Is There a Union Wage Premium in Germany and Which Workers Benefit Most?

by
Marina Bonaccolto-Töpfer
1 and
Claus Schnabel
2,*
1
Department of Economics, University of Genova, 16126 Genoa, Italy
2
School of Economics, Business and Society, University of Erlangen-Nürnberg, 90403 Nuremberg, Germany
*
Author to whom correspondence should be addressed.
Economies 2023, 11(2), 50; https://doi.org/10.3390/economies11020050
Submission received: 14 December 2022 / Revised: 24 January 2023 / Accepted: 29 January 2023 / Published: 3 February 2023
(This article belongs to the Special Issue Focused Issues and Trends in Economic Research from Germany)

Abstract

:
Using representative data from the German Socio-Economic Panel (SOEP), this paper finds a statistically significant union wage premium in Germany of almost three percent, which is not simply a collective bargaining premium. Given that the union membership fee is typically about one percent of workers’ gross wages, this finding suggests that it pays off to be a union member. Our results show that the wage premium differs substantially between various occupations and educational groups, but not between men and women. We do not find that union wage premia are higher for those occupations and workers which constitute the core of union membership. Rather, unions seem to care about disadvantaged workers and pursue a wider social agenda.

1. Introduction

In recent decades, unionization has been on the decline worldwide, and union density has reached a critically low level in many advanced countries (Visser 2019; Schnabel 2020). Increasingly often, unions’ existence depends on their ability to attract and keep a loyal membership and to successfully represent their members’ interests in collective bargaining. In addition to benefits such as worker representation and higher employment protection, unions typically promise to push through higher wages for their members. Union wage premia, meaning higher wages for union members compared with non-members with similar characteristics, are found in many, but not all, countries (for an overview, see Blanchflower and Bryson 2003). Depending on the institutional framework of the countries investigated, the empirical literature mainly uses two approaches for identifying such a premium (Bryson 2014): either estimating the ceteris paribus difference between the earnings of union members and non-members (i.e., a wage premium associated with union membership) or estimating the earnings difference between comparable workers covered or not covered by collective bargaining agreements negotiated by unions (a collective bargaining premium).
No matter which approach is used, the long-standing debate whether unions do have any effect at all on wages, that can be traced back to Adam Smith, seems to have been answered in the affirmative (e.g., Freeman and Medoff 1984; Bryson 2014; OECD 2019). However, it is an open question as to whether these union wage premia typically exist across the board or are specially targeted at the core groups of union membership. Put differently, are union wage premia higher in occupations that are highly unionized and are they higher for those groups of workers (like men and low-skilled workers) who are represented more than proportionally among union members?
This paper investigates this research question using a rich representative data set for Germany. Germany is an interesting case because it is often questioned whether the German institutional framework, where union wage settlements may spill over to non-union workers, can result in a union wage premium at all (Schmidt and Zimmermann 1991; Blanchflower and Bryson 2003). Our objectives are to investigate whether there is a union wage premium in Germany and whether it is higher for core groups of union membership. Thus, we first explain how a union wage differential can exist in Germany. Second, we add to the existing literature by estimating the union membership wage premium conditional on collective bargaining coverage. Using representative data from two waves of the German Socio-Economic Panel (SOEP), we show empirically that there is indeed a statistically significant union wage premium of almost three percent which is not simply a collective bargaining premium. Next, we demonstrate that this wage premium differs substantially between various occupations and educational groups, but not between men and women. Comparing the wage premia across occupations and for various groups of workers with the composition of union membership and the level of union density in these groups, we do not find that union wage premia are higher for those occupations and workers which constitute the core of union membership. There is some indication, however, that union membership particularly benefits some disadvantaged groups in the labour market (such as elementary workers or persons with no degree).

2. Wage Bargaining and the Union Wage Premium in Germany

In Germany, organizations of employers and employees have the right to regulate wages and working conditions without state interference.1 Employers and unions negotiate collective agreements that are legally binding. These bargaining agreements may be set up either as multi-employer agreements at industry level or as single-employer agreements at plant level. Companies can decide to be covered by such an agreement, but they may also abstain from collective bargaining with unions and negotiate wages individually with their workforce.2 If companies are bound by (industry- or plant-level) collective agreements, they cannot undercut, only improve upon the minimum terms and conditions laid down in these collective agreements, for instance by paying higher wages or providing longer holidays.
The wages and working conditions that were agreed in collective bargaining agreements apply only to the companies that are bound by the agreements (either directly or via membership in an employers’ association) and to those of their workers who are members of the unions that signed the agreements. This means that non-union workers in a company are not entitled to be paid the union wage laid down in the collective agreement. However, it lies in the discretion of employers to extend the agreed wages to employees who are not members of the union. Such a practice may reduce these workers’ incentive to join the union to receive the union wage. As many employers adopt such a strategy to keep unionization low, union wage gains regularly spill over to workers who are not union members. Against this background, it is often argued that due to the peculiarities of the institutional arrangements in Germany, a wage premium of individual union membership should not exist here (Schmidt and Zimmermann 1991; Blanchflower and Bryson 2003; Fitzenberger et al. 2013), although a premium from working in a company covered by collective bargaining may be possible.3
However, this argumentation overlooks several issues that may give rise to a genuine union wage premium even in Germany, i.e., a wage differential between union and non-union workers with similar characteristics in comparable workplaces that goes beyond the wage premium of being covered by collective bargaining. First, a union wage premium arises if companies determine to pay the wage laid down in a collective agreement exclusively to union members who are directly entitled to this wage, but do not extend this wage to non-union workers in the company. This increasingly seems to happen in Germany. A study by Fitzenberger et al. (2013) indicates that among those companies in Germany that are bound by collective agreements, the large majority does not pay all their workers according to the wage laid down in the collective agreement. A more recent investigation by Hirsch et al. (2022) finds that about nine percent of workers in plants with collective agreements do not enjoy individual coverage (and thus the union wage) anymore. Second, a union wage premium may arise if union members are more successful in individually negotiating higher wages than are non-members (or more often receive premiums above the contract wage in firms bound by collective agreements). The reason for these higher wages could be that union members, who are better informed than other workers, can draw on union support and enjoy effective legal protection by the union (Berger and Neugart 2012), are more assertive and in the end also more successful in wage negotiations. A third reason for a union wage differential could be that in firms not covered by collective bargaining, union members can credibly threaten to move to other, covered firms that pay union wages.4 To prevent these workers from quitting, the firm may voluntarily pay them the union wage. They are now better paid than similar employees in this firm who are not union members.
In addition to these three mechanisms directly related to union membership that induce union wage premia, there are two other, indirect effects that may explain higher wages of union members. A fourth source of higher wages can be that union members have more stable employment biographies than non-union workers, for instance due to exit-reducing union “voice” (Freeman and Medoff 1984) and higher employment protection in firms with union representation (Goerke and Pannenberg 2011). Consequently, union members have higher tenure and accumulate more firm-specific human capital than other workers, resulting in higher wages (Bryson 2014). Finally, union members, who can draw on information and advice given by the union, may select themselves in larger firms and more profitable industries or occupations, thus obtaining higher wages than non-union workers (a similar relationship would be observed if workers in better-paying firms and occupations are more likely to become union members). Note that these indirect effects of unionism can be extracted from the raw union wage differential by including controls for tenure and labour market experience and dummies for firm size and occupation in the estimation.
Our estimation strategy for identifying a genuine union wage premium, which will be described in more detail below, uses regression analyses where the dependent variable is workers’ log gross hourly wage. In the first step (or base model), the only regressor included is a dummy for union membership whose estimated coefficient reflects the raw wage differential between union and non-union workers. This raw differential is then adjusted by including many control variables into the regression such as educational, socio-demographic and labour market characteristics of workers, workplace characteristics and coverage by a collective bargaining agreement (full model), since union and non-union workers may differ in these characteristics that drive wages. The estimated coefficient of the union membership dummy now reflects the union wage premium, ceteris paribus. By including collective bargaining coverage among the regressors, we can also test whether the union wage premium is more than just a collective bargaining premium.

3. Data and Descriptive Evidence

We used the 2015 and 2019 waves of the German Socio-Economic Panel (SOEP).5 The SOEP is a high-quality, representative dataset of more than 11,000 private households in Germany (see Goebel et al. (2019) for a description of the dataset) and is particularly suited for our analysis as it permits us to distinguish between the impact of collective bargaining coverage and individuals’ union membership. Both waves used include information on union membership as well as on collective bargaining coverage. As we cannot differentiate between industry- and plant-level collective agreements in 2019, we created a dummy variable for collective bargaining coverage and used it in both waves (similar to Goerke and Huang 2022). Furthermore, the SOEP allows for the construction of hourly wages and enables us to control for a variety of individual- and firm-level characteristics such as education, age, family background characteristics, firm size and works council presence that potentially drive wage gaps between unionized and non-unionized employees.
Our dependent variable was the gross hourly wage (calculated using actual working hours) in 2015 prices. We focused the analysis on part- and full-time employees aged 16 to 65 and excluded self-employed individuals. Respondents working more than 30 h per week are defined as full-time employees. For the classification of occupations, we used the ISCO88 (1-digit) and drop armed forces and skilled agricultural and fishery workers as we observe only 129 individuals in this category (i.e., <1 percent). We classified sectors and industries based on NACE (level 1).
Using the 2015 and 2019 waves of the SOEP, Table 1 reports some descriptive statistics comparing union members and non-unionized workers. On average, union members receive hourly wages that are 18 log points higher than the wages of other employees. However, union and non-union workers also differ in many other personal and workplace characteristics that may affect wages. For instance, union members tend to be older and have higher job tenure as well as more labour market experience than other workers. They are more often educated to a lower level (having just basic secondary education, Hauptschule), more often have a permanent contract, and work in large firms. They are also more likely to be covered by a collective agreement and represented by a works council in the establishment. In contrast, union members are less often females, migrants, and part-timers. The occupational structure also differs between both groups, with union members being more often plant and machine operators and assemblers and less often service and sales workers than non-union employees.

4. Estimating the Union Wage Premium

We defined our base model for individual i at time t as follows:
y i t = α 0 b a s e + β 1 b a s e u n i o n i t + ϵ i t b a s e
with i = 1, …, N and t = 2015, 2019 and where y i t is the log hourly wage, α 0 b a s e represents the intercept, u n i o n is a dummy for union membership, β 1 b a s e gives the corresponding raw union wage premium, and ϵ i t b a s e is an error term assumed to follow the standard assumptions.
For estimation of the adjusted or ceteris paribus wage premium, we estimated the following full model:
y i t = α 0 f u l l + β 1 f u l l u n i o n i t + γ x i t + ϵ i t f u l l
where β 1 f u l l gives the union wage premium ceteris paribus and x i t represents a vector of regressors including dummies for highest educational attainment, marital status and migration background, age dummies, quadratic polynomials of labour market experience, job tenure as well as dummies for firm size, the type of contract, bargaining coverage, presence of a works council, occupation and survey year. Moreover, we added federal state fixed effects.
The results of our OLS estimations are presented in Table 2. In the base model that only includes a union membership dummy, being a union member is associated with hourly wages that are on average 19.8 percent (18.1 log points) higher than those of non-union members. This raw union wage differential is reduced to 2.6 percent when controlling for a large number of explanatory variables in the full model. By including controls for tenure and labour market experience and dummies for firm size and occupation in the estimation, we can account for the indirect effects of unionism discussed above.
This approach shows that it is mainly workers’ human capital (education), their occupational composition, their gender and contract status as well as firm size and the presence of a works council that affect wages. Interestingly, the existence of a collective bargaining agreement in the plant, though statistically significant, contributes little to wages and leaves us with a statistically significant ceteris paribus union-member wage differential. Put differently, there is a union wage premium of about 2.6 percent even when controlling for collective bargaining coverage (which is reflected in a bargaining premium of 1.2 percent).
As a robustness check, we ran the models in Table 2 separately for the two sample years 2015 and 2019. The results of these estimations did not change our insights. Although the union wage premium slightly decreased between 2015 and 2019, the estimated coefficients of the union member dummy remain positive and statistically significant, and they do not differ significantly between the two years. In order to address potential problems of unobserved heterogeneity of workers and plants, we also estimated a fixed effects model for the change in wages and union membership status between 2015 and 2019. This resulted in a union wage premium of 2.5 percent, which is very close to our cross-sectional estimate in Table 2. Both robustness checks are not reported in tables but are available on request. This robust finding of a union wage premium that goes beyond a collective bargaining premium stands in contrast to most of the extant literature (such as Schmidt and Zimmermann 1991 or Blanchflower and Bryson 2003) which used to argue that there is no union wage premium in Germany.
As we mainly rely on a cross-sectional design (and our fixed effects model is restricted to only two years), our estimated union parameter should be interpreted cautiously and definitely not causally. It just shows that on average, union membership is associated with hourly wages that are almost three percent higher. Given that the union membership fee in Germany typically is about one percent of workers’ gross wages (Goerke and Pannenberg 2011), it seems to pay off to be a union member, on average. However, this may not be true for all members alike, and therefore we will now investigate whether the union wage premium varies across occupations and between various groups of members.

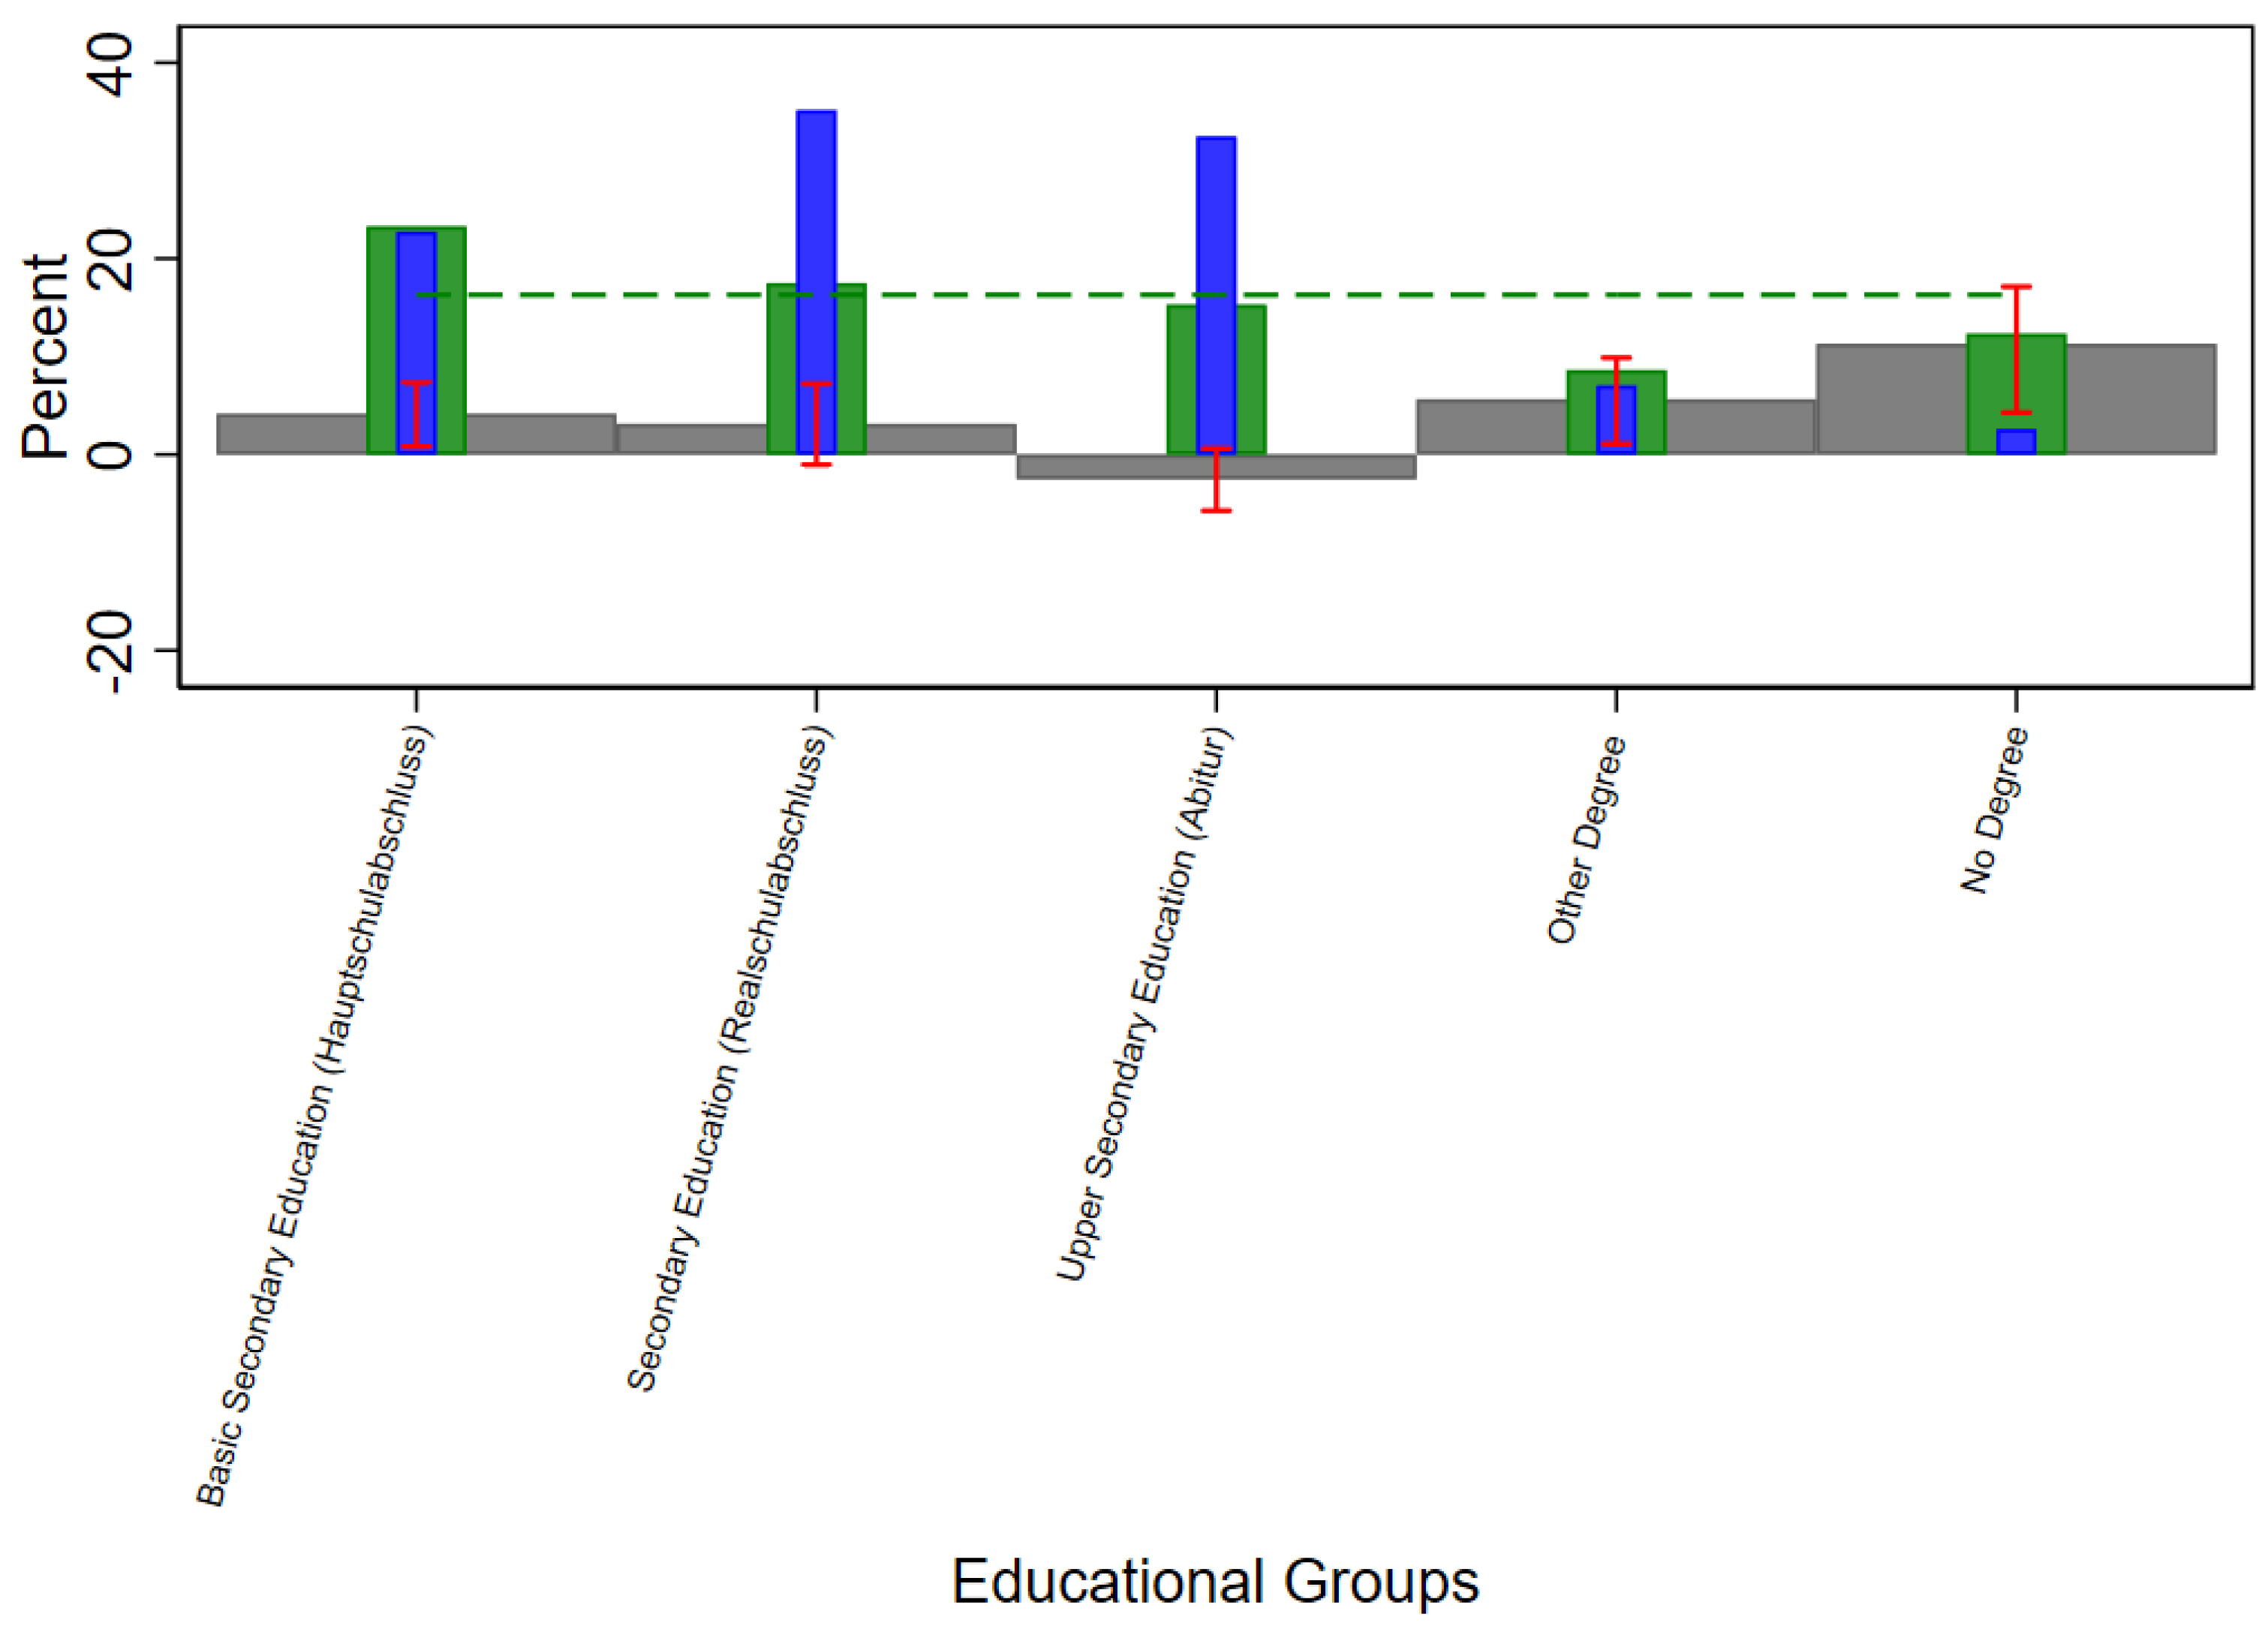
5. Heterogeneities in the Union Wage Premium

In order to analyse potential heterogeneities in the union wage premium, we used the full model from Table 2 and add interaction terms of the union member dummy and various occupational, educational and socio-demographic characteristics. In particular, we looked at eight groups of occupations that can be identified in our data, at five educational categories and at gender—important characteristics where substantial differences exist between union members and non-members (as shown in Table 1).
Table 3 presents the results of an OLS estimation where interaction terms between the union member dummy and the occupation, education and gender dummies are added to the full model. The positive and negative interaction effects between union membership and occupation reported in column (1) indicate that the size of the union wage premium differs substantially across occupations. The same can be said for the interaction effects with education in column (2). In contrast, the interaction effect with gender is very small and not statistically significant (column 3).
The resulting differences in the union wage premium across occupations, educational status and gender are visualized in Figure 1, Figure 2 and Figure 3. The wage premia for the various groups are calculated by adding the corresponding estimated interaction effects and the union membership coefficient in each column. The grey bars in Figure 1 clearly show that the union wage premium varies substantially across occupations. It reaches almost nine percent among elementary occupations and in the group of plant and machine operators and assemblers. These two are occupational groups in which the average wage lies substantially below the average wage in the economy. The union wage premium is small and statistically insignificantly different from zero in several other occupational groups and it is even negative in some groups such as technicians and associate professionals and among legislators, senior officials, and managers.
Concerning educational categories, Figure 2 shows that the union wage premium is positive for workers with relatively little education, that is persons who either have no degree or only basic secondary education.6 In contrast, the premium is not statistically significantly different from zero for workers with higher levels of education. The positive wage premium for low-educated workers corresponds to the positive effect for some low-wage occupations reported above. This suggests that union membership may be particularly beneficial for disadvantaged workers.
As mentioned above, the interaction effect with gender is statistically and economically insignificant. This means that the union wage premium does not differ between men and women (Figure 3).7

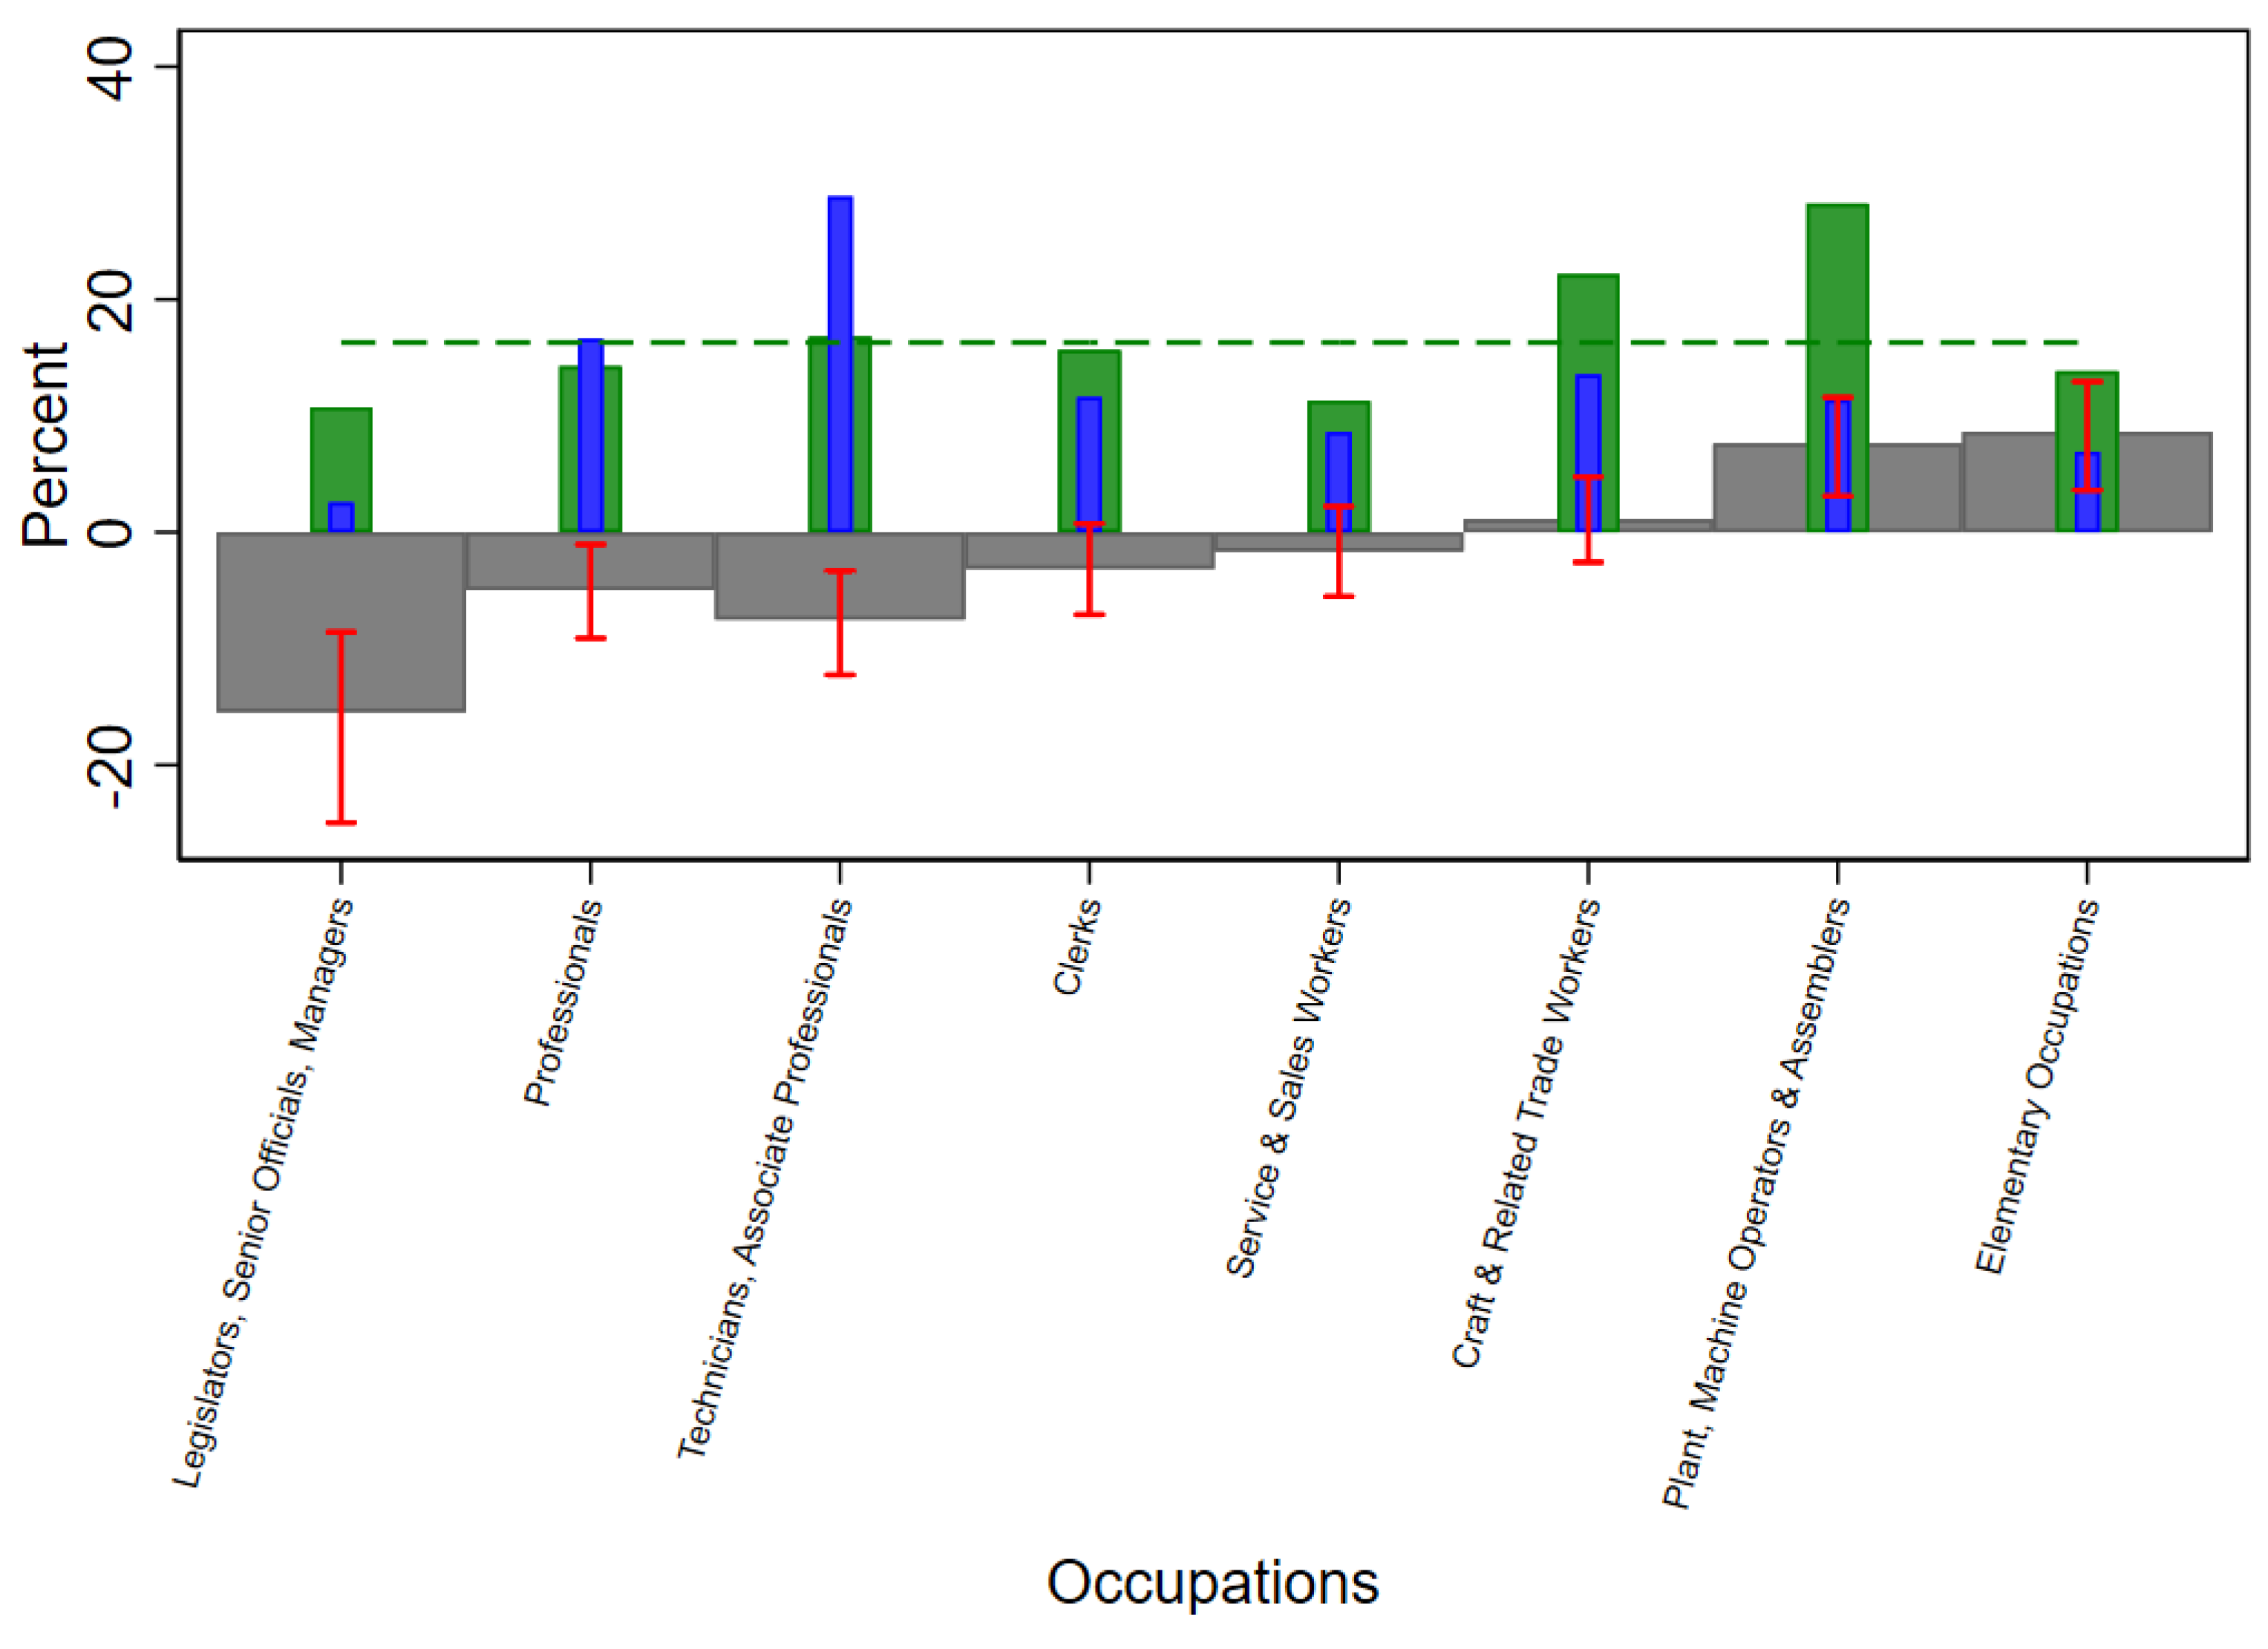
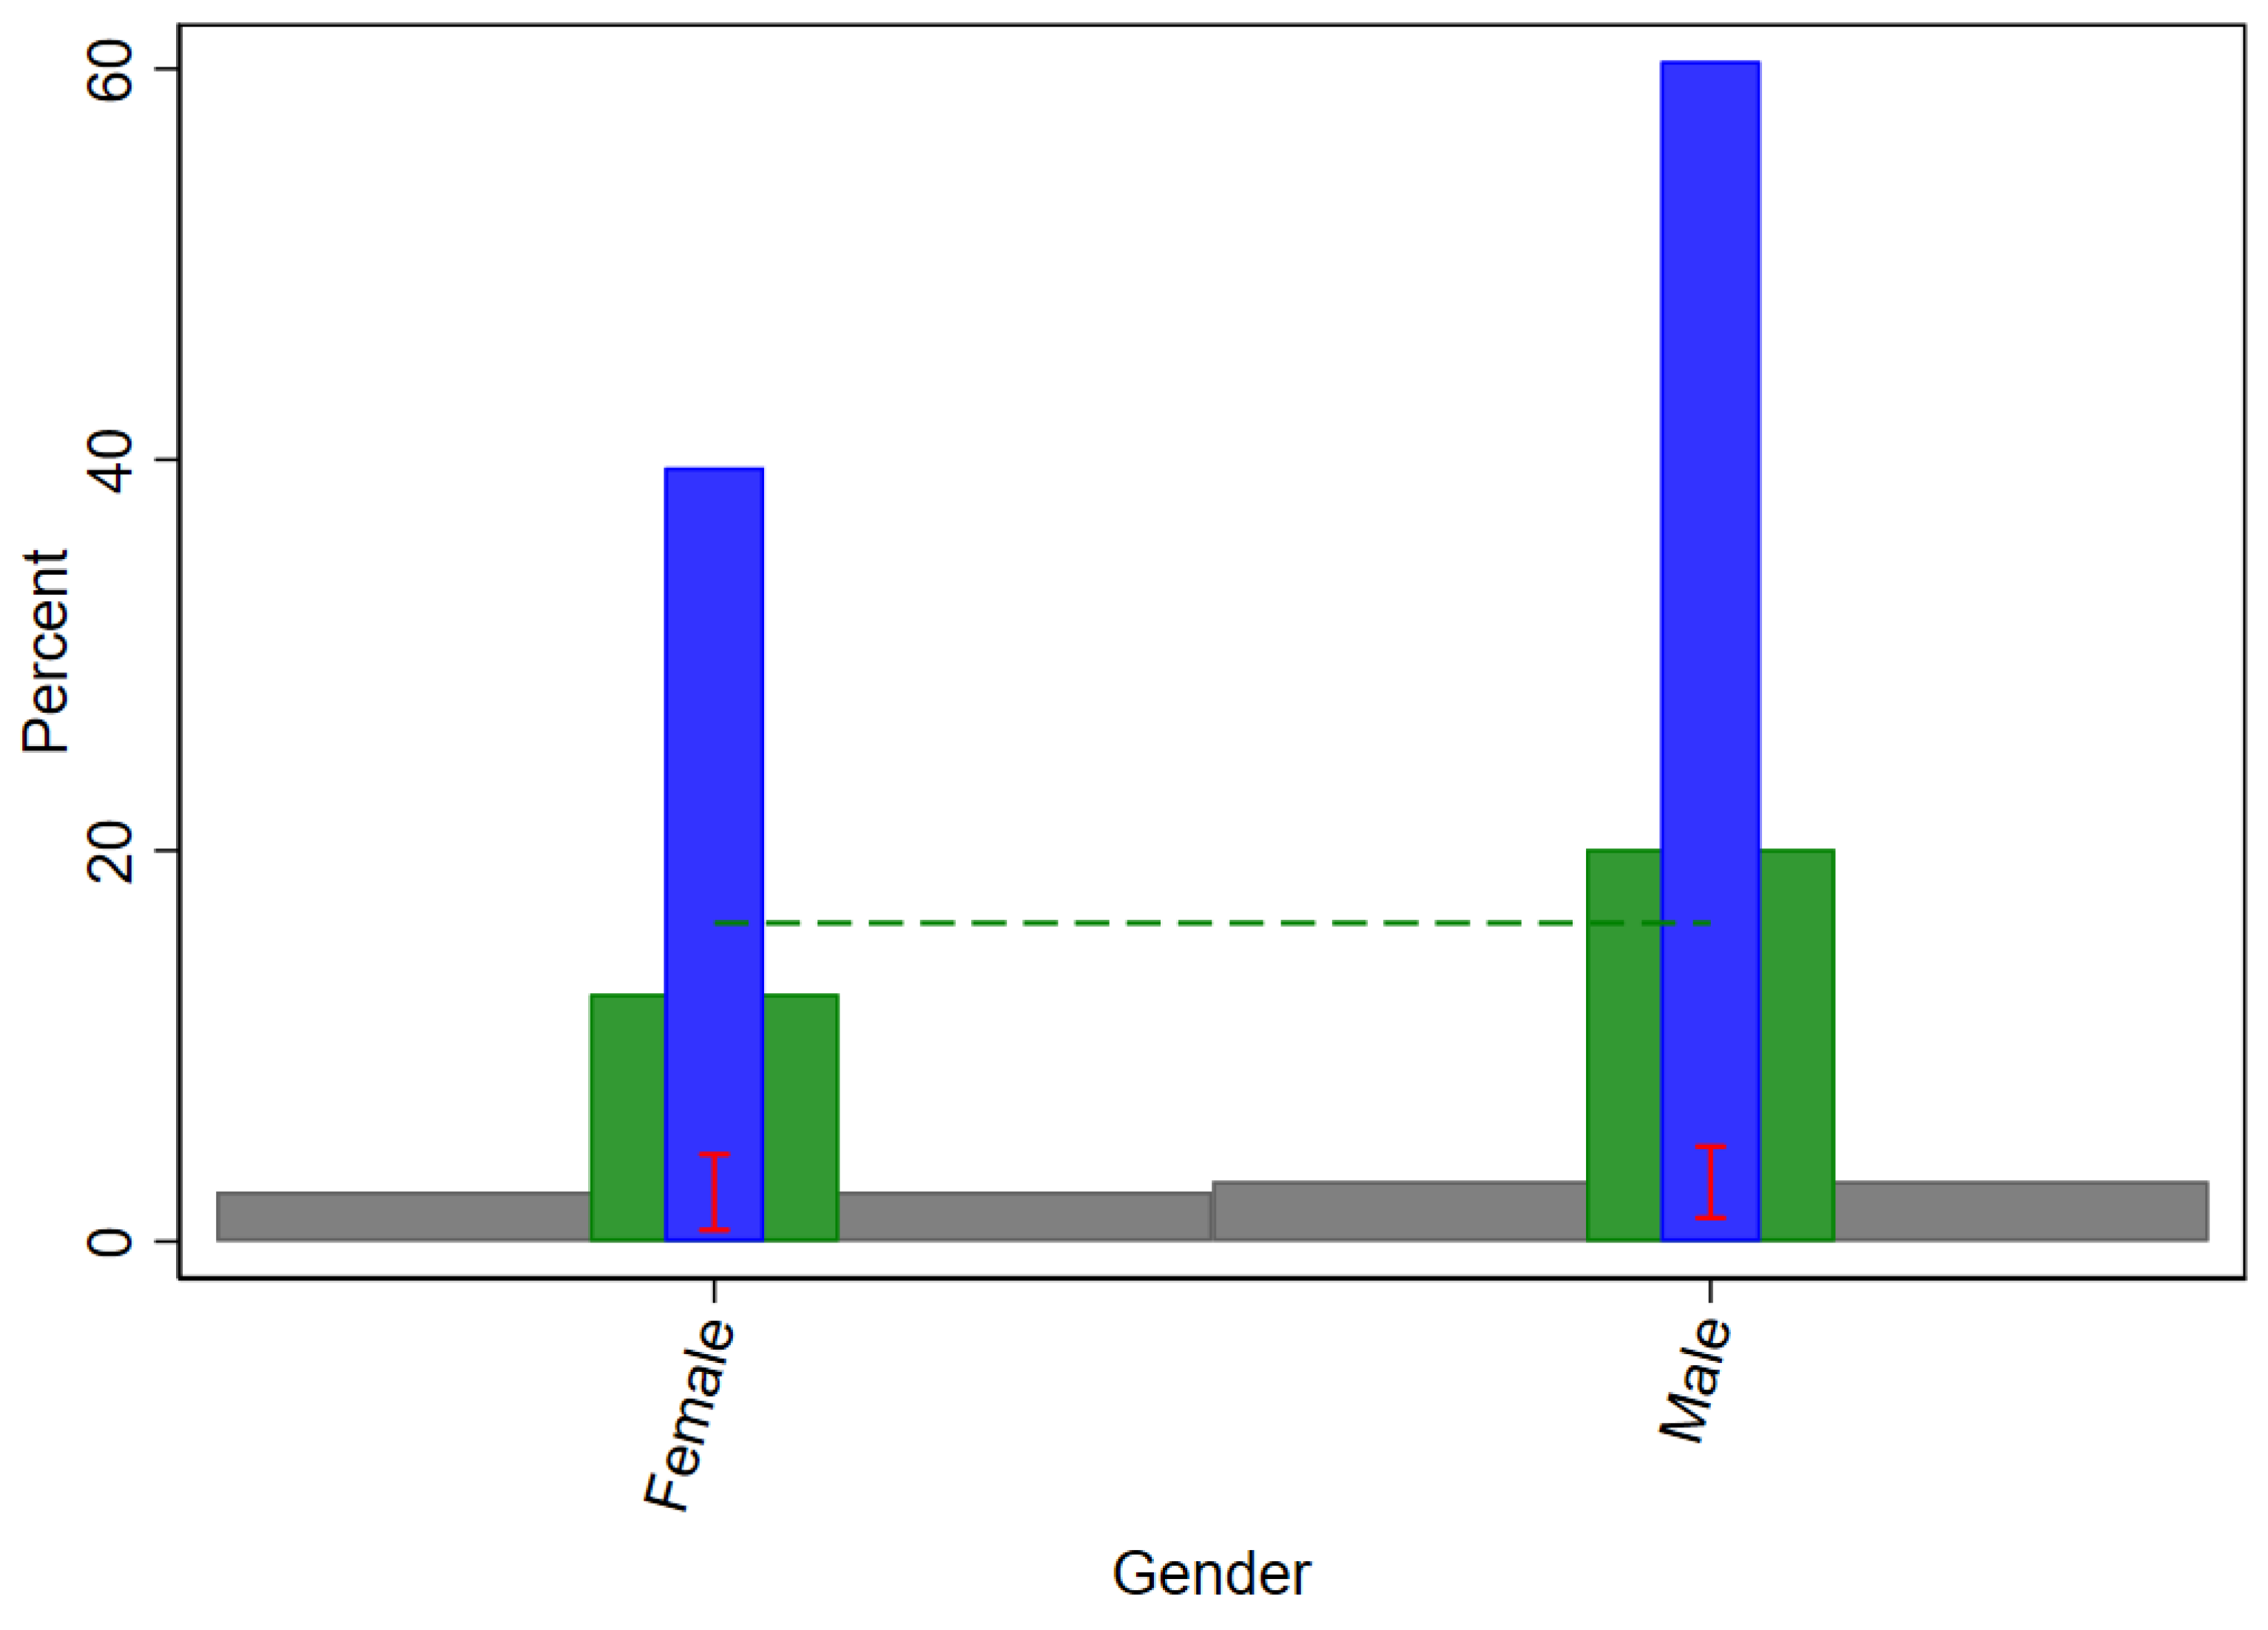
6. Do Union Core Groups Benefit from the Wage Premium?

The substantial heterogeneity in the wage premium raises the question whether it is mainly core groups of union membership that benefit most, which would imply a strategic behaviour of unions that is straight to the point and successful. In order to address this question, we must identify which workers can be regarded as core groups. We can do this using two indicators, namely these groups’ shares among union membership and their union density. Table 1 has shown that it is, in particular, men, low-educated workers, and workers in certain occupations (such as plant and machine operators and assemblers or craft and related trade workers) whose share is substantially higher among union members than among the rest of the workforce. A similar picture emerges if we look at union density, that is, the share of union members among the workforce or among certain groups of workers. Table 4 shows that in our sample, average union density is 16.3 percent, but it is clearly above average among men (20.1 percent), workers with basic secondary education (23.3 percent) and plant and machine operators and assemblers (28.2 percent) as well as craft and related trade workers (22.1 percent).
Looking at these two indicators, we find no clear relationship between the core groups and the size of the union wage premium. Starting with occupations, Figure 1 shows that union density is highest among plant and machine operators and assemblers, followed by the groups of craft and related trade workers and of technicians and associated professionals. The union wage premium is positive in the first group but statistically insignificant in the second and even negative in the third group. The group of technicians and associated professionals has the highest share among union members, but here the union wage premium is negative. In contrast, elementary occupations constitute only small groups among union members, but they record the highest union wage premium.
A similarly diffused picture shows up concerning educational groups (see Figure 2). The union wage premium is small in the group with the highest union density (persons with basic secondary education) but it is largest in the group of workers with no degree, where union density is below average. Looking at membership shares, we see that the two largest groups of union members both have statistically insignificant wage premia whereas these premia are largest in the two smallest groups of union members (with no degree or other degrees).
Only concerning gender, there seems to be a certain connection (Figure 3). The core group of men, which has a higher union density and membership share than women, exhibits a higher union wage premium, but the difference to women is small and statistically insignificant.

7. Concluding Remarks

It is often questioned whether the institutional framework in Germany, where union wage agreements may spill over to non-union workers, can result in a specific union wage premium (other than a collective bargaining premium). Using representative data from the German Socio-Economic Panel (SOEP), this paper is the first which demonstrates empirically that there is indeed a statistically significant union wage premium of almost three percent which is not simply a collective bargaining premium. We further contribute to the literature by showing that this wage premium differs substantially between various occupations and educational groups, but not between men and women. Comparing the wage premia across occupations and for various groups of workers with the composition of union membership and the level of union density in these groups, we do not find that union wage premia are higher for those occupations and workers which constitute the core of union membership.
While our cross-sectional analysis does not allow us to make causal statements, the overall impression is that German unions do not appear to be particularly successful in delivering wage premia for their core groups of members (beyond the collective bargaining premium). Neither do we find higher union wage premia for women, which might be helpful in attracting more female members and thus reducing the substantial gender gap in German unions. Interestingly, however, being a union member seems to particularly benefit some low-wage groups in the labour market (such as elementary workers or persons with no degree). This finding may suggest that unions care about disadvantaged workers and pursue a wider social agenda. However, as long as these workers do not increasingly join unions (and there is no indication that they do so), creating specific union wage premia would not seem to be a promising strategy for stopping the decline in union membership.

Author Contributions

Conceptualization, M.B.-T. and C.S.; methodology, M.B.-T. and C.S.; software, M.B.-T.; validation, M.B.-T. and C.S.; formal analysis, M.B.-T. and C.S.; investigation, M.B.-T. and C.S.; resources, M.B.-T. and C.S.; data curation, M.B.-T. writing—original draft preparation, C.S.; writing—review and editing, M.B.-T. and C.S.; visualization, M.B.-T. and C.S. All authors have read and agreed to the published version of the manuscript.

Funding

This research received no external funding.

Informed Consent Statement

Not applicable.

Data Availability Statement

SOEP data access is constraint to researchers with an institutional affiliation having signed a data distribution contract. Data access for these researchers is free of charge and can be requested at: https://www.diw.de/en/diw_01.c.601584.en/data_access.html (accessed on 9 December 2022).

Conflicts of Interest

The authors declare no conflict of interest.

Notes

1
For details on the German system of industrial relations and wage setting, see Gartner et al. (2013) or Keller and Kirsch (2021).
2
In 2019, 25 percent of establishments in Germany were covered by industry-level agreements and two percent of establishments by plant-level agreements. The remaining establishments relied on individual wage setting, although the majority of these establishments report to voluntarily use the wages set in (industry-level) collective agreements as a point of reference (see Kohaut 2020).
3
Although Wagner (1991) finds a positive wage effect of union membership for blue-collar (but not white-collar) workers, most individual-level studies report the absence of union wage effects in Germany (e.g., Schmidt and Zimmermann 1991; Blanchflower and Bryson 2003). Concerning the existence and size of a collective bargaining premium in Germany, the evidence is mixed (see, e.g., Gürtzgen 2009; Hirsch and Müller 2020; Kölling 2022). The recent analysis by Kölling (2022) estimates a wage premium of 2.5 percent for workers in establishments with collective bargaining agreements.
4
Although set in a different institutional environment, this argument bears some resemblance to the general idea by Rosen (1969) that the threat of unionization may raise wages in non-union firms.
5
Socio-Economic Panel (SOEP), data for years 1984–2019, SOEP-Core v36, EU Edition, 2021, doi:10.5684/soep.core.v36eu, https://www.diw.de/en/diw_01.c.814095.en/edition/soep-core_v36eu__data_1984-2019__eu_edition.html (accessed on 31 October 2022).
6
The same holds for workers with “other degrees” who often have foreign degrees that cannot easily be transformed into the educational classification used in Germany.
7
This finding is consistent with recent empirical evidence that unions do not dampen the gender pay gap in Germany (see Oberfichtner et al. 2020).

References

  1. Berger, Helge, and Michael Neugart. 2012. How German Labour Courts Decide—An Econometric Case Study. German Economic Review 13: 56–70. [Google Scholar] [CrossRef]
  2. Blanchflower, David G., and Alex Bryson. 2003. Changes over time in union relative wage effects in the UK and the US revisited. In International Handbook of Trade Unions. Edited by John T. Addison and Claus Schnabel. Cheltenham: Edward Elgar, pp. 197–245. [Google Scholar]
  3. Bryson, Alex. 2014. Union wage effects. IZA World of Labor 2014: 35. [Google Scholar] [CrossRef]
  4. Fitzenberger, Bernd, Karsten Kohn, and Alexander C. Lembcke. 2013. Union density and varieties of coverage: The anatomy of union wage effects in Germany. ILR Review 66: 169–97. [Google Scholar] [CrossRef]
  5. Freeman, Richard B., and James L. Medoff. 1984. What Do Unions Do? New York: Basic Books. [Google Scholar]
  6. Gartner, Hermann, Thorsten Schank, and Claus Schnabel. 2013. Wage Cyclicality Under Different Regimes of Industrial Relations. Industrial Relations 52: 516–40. [Google Scholar] [CrossRef]
  7. Goebel, Jan, Markus M. Grabka, Stefan Liebig, Martin Kroh, David Richter, Carsten Schröder, and Jürgen Schupp. 2019. The German Socio-Economic Panel (SOEP). Jahrbücher für Nationalökonomie und Statistik 239: 345–60. [Google Scholar] [CrossRef]
  8. Goerke, Laszlo, and Markus Pannenberg. 2011. Trade union membership and dismissals. Labour Economics 18: 810–21. [Google Scholar] [CrossRef]
  9. Goerke, Laszlo, and Yue Huang. 2022. Job satisfaction and trade union membership in Germany. Labour Economics 78: 102238. [Google Scholar] [CrossRef]
  10. Gürtzgen, Nicole. 2009. Rent-sharing and collective bargaining coverage: Evidence from linked employer–employee data. Scandinavian Journal of Economics 111: 323–49. [Google Scholar] [CrossRef]
  11. Hirsch, Boris, and Steffen Müller. 2020. Firm Wage Premia, Industrial Relations, and Rent Sharing in Germany. ILR Review 73: 1119–46. [Google Scholar] [CrossRef]
  12. Hirsch, Boris, Philipp Lentge, and Claus Schnabel. 2022. Uncovered workers in plants covered by collective bargaining: Who are they and how do they fare? British Journal of Industrial Relations 60: 929–45. [Google Scholar] [CrossRef]
  13. Keller, Berndt K., and Anja Kirsch. 2021. Employment Relations in Germany. In International and Comparative Employment Relations, 7th ed. Edited by Greg J. Bamber, Fang Lee Cooke, Virginia Doellgast and Chris F. Wright. London: SAGE Publications Ltd., pp. 183–212. [Google Scholar]
  14. Kohaut, Susanne. 2020. Tarifbindung geht in Westdeutschland weiter zurück. IAB-Forum, May 13. [Google Scholar]
  15. Kölling, Arnd. 2022. Shortage of Skilled Labor, Unions and the Wage Premium: A Regression Analysis with Establishment Panel Data for Germany. Journal of Labor Research 43: 239–59. [Google Scholar]
  16. Oberfichtner, Michael, Claus Schnabel, and Marina Töpfer. 2020. Do unions and works councils really dampen the gender pay gap? Discordant evidence from Germany. Economics Letters 196: 109509. [Google Scholar] [CrossRef]
  17. OECD. 2019. Negotiating Our Way Up: Collective Bargaining in a Changing World of Work. Paris: OECD Publishing. [Google Scholar]
  18. Rosen, Sherwin. 1969. Trade Union Power, Threat Effects and the Extent of Organization. Review of Economic Studies 36: 185–96. [Google Scholar] [CrossRef]
  19. Schmidt, Christoph M., and Klaus F. Zimmermann. 1991. Work characteristics, firm size and wages. Review of Economics and Statistics 73: 705–10. [Google Scholar] [CrossRef]
  20. Schnabel, Claus. 2020. Union membership and collective bargaining: Trends and determinants. In Handbook of Labor, Human Resources and Population Economics. Edited by Klaus F. Zimmermann. Cham: Springer. [Google Scholar]
  21. Visser, Jelle. 2019. Trade Unions in the Balance. Geneva: ILO ACTRAV Working Paper. [Google Scholar]
  22. Wagner, Joachim. 1991. Gewerkschaftsmitgliedschaft und Arbeitseinkommen in der Bundesrepublik Deutschland. ifo-Studien 37: 109–40. [Google Scholar]
Figure 1. Union Wage Premia (Marginal Effects), Union Density and Union Membership Share by Occupation—Full Model with Interaction Terms between Occupations and Union Member Dummy. Notes: 18,035 observations in the survey waves 2015 and 2019. Grey shaded area represents the average union wage premium obtained from the interaction model in Table 3, column (1). 95% confidence intervals presented in red. Robust standard errors clustered at the individual level used. Blue bars represent the union membership share and green bars the union density within each occupation. Dashed line represents the union density in the full sample. Data source: SOEP v36.
Economies 11 00050 g001
Figure 2. Union Wage Premia (Marginal Effects), Union Density and Union-Membership Share by Educational Group—Full Model with Interaction Terms between Educational Groups and Union Member Dummy. Notes: 18,035 observations in the survey waves 2015 and 2019. Grey shaded area represents the average union- wage premium obtained from the interaction model in Table 3, column (2). 95% confidence intervals presented in red. Robust standard errors clustered at the individual level used. Blue bars represent the union membership share and green bars the union density within each educational group. The dashed line represents the union density in the full sample. Data source: SOEP v36.
Economies 11 00050 g002
Figure 3. Union Wage Premia (Marginal Effects), Union Density and Union Membership Share by Gender—Full Model with Interaction Term Between Gender and Union Member Dummy. Notes: 18,035 observations in the survey waves 2015 and 2019. Grey shaded area represents the average union wage premium obtained from the interaction model in Table 3, column (3). 95% confidence intervals presented in red. Robust standard errors clustered at the individual level used. Blue bars represent the union-membership share and green bars the union density. Dashed line represents the union density in the full sample. Data source: SOEP v36.
Economies 11 00050 g003
Table 1. Descriptive Statistics by Union Membership.
(1)(2)(3)(4)(5)
Union MemberNot Union Member
MeanStd.Dev.MeanStd.Dev.Difference
Log Gross Hourly Wage (in EUR)3.0480.3942.8680.5110.181 ***
Young 16–29 Years0.0790.2710.1090.311−0.029 ***
Adult 30–39 Years0.1790.3840.2640.441−0.085 ***
Adult 40–49 Years0.2810.4500.3290.470−0.048 ***
Old 50–65 Years0.4800.5000.3270.4690.153 ***
Basic Secondary Education (Hauptschule)0.2280.4190.1460.3530.082 ***
Secondary Education (Realschule)0.3510.4780.3230.4670.028 **
Upper Secondary Education (Abitur)0.3250.4680.3500.477−0.025 **
Other Degree0.0700.2560.1450.353−0.075 ***
No Degree0.0260.1590.0360.186−0.010 ***
Female0.3960.4890.5320.499−0.136 ***
East Germany0.1790.3830.2070.405−0.028 ***
Migration Background0.1870.3900.2680.443−0.081 ***
Married 0.6500.4770.6170.4860.033 ***
Labor Market Experience (in Years)20.0312.0614.8011.155.230 ***
Job Tenure (in Years)16.8212.0510.079.6626.750 ***
Part-time Contract 0.1330.3400.2220.415−0.089 ***
Permanent Contract0.9240.2650.8720.3340.052 ***
Works Council0.8090.3930.4760.4990.333 ***
Firm Size < 200.0520.2210.2210.415−0.169 ***
Firm Size 19 < X < 2000.1730.3780.2720.445−0.099 ***
Firm Size 199 < X < 20000.2540.4350.2260.4180.028 ***
Firm Size > 19990.5220.5000.2810.4500.241 ***
Legislators, Senior Officials and Managers0.0260.1580.0410.199−0.016 ***
Professionals0.1660.3720.1950.396−0.029 ***
Technicians and Associate Professionals0.2880.4530.2780.4480.010
Clerks0.1160.3200.1220.327−0.006
Service Workers and Shop and Market Sales Workers0.0860.2810.1320.338−0.046 ***
Craft and Related Trade Workers0.1350.3420.0930.2900.042 ***
Plant, Machine Operators and Assemblers0.1140.3170.0560.2310.058 ***
Elementary Occupations0.0690.2540.0840.277−0.015 ***
Collective Bargaining Agreement 0.8180.3860.5350.4990.283 ***
Observations293915,09618,035
Notes: Dummy variables if not indicated differently. Reported differences are based on a regression of the selected variables on a union member dummy. Robust standard errors clustered at the individual level are used. ** and *** denote statistical significance at the 5%- and 1%-level, respectively. Data source: SOEP v36.
Table 2. OLS Regression of Log Hourly Wages (Base and Full Model).
(1)(2)
Raw Union Wage PremiumAdjusted Union Wage Premium
Base ModelFull Model
VARIABLESLog Hourly Wages
Union Member0.181 ***0.026 ***
(0.009)(0.007)
Labor Market Experience (in Years) 0.013 ***
(0.001)
Labor Market Experience Squared −0.000 ***
(0.000)
Job Tenure (in Years) 0.007 ***
(0.000)
Basic Secondary Education (Hauptschule) −0.047 ***
(0.007)
Upper Secondary Education (Abitur) 0.110 ***
(0.006)
Other Degree −0.030 ***
(0.009)
No Degree −0.025 **
(0.012)
Secondary Education (Realschule) −0.009
(0.005)
Young 16–29 −0.044 ***
(0.008)
Adult 30–39 0.015 ***
(0.005)
Old 50–65 0.005
(0.006)
Adult 40–49 0.024 ***
(0.005)
Legislators, Senior Officials and Managers 0.431 ***
(0.015)
Professionals 0.344 ***
(0.008)
Clerks −0.072 ***
(0.008)
Service Workers and Shop and Market Sales Workers −0.162 ***
(0.008)
Craft and Related Trade Workers −0.115 ***
(0.008)
Plant and Machine Operators and Assemblers −0.195 ***
(0.009)
Elementary Occupations −0.315 ***
(0.009)
Technicians and Associate Professionals 0.084 ***
(0.006)
Female −0.100 ***
(0.007)
Migration Background −0.034 ***
(0.009)
Married 0.039 ***
(0.006)
Works Council 0.082 ***
(0.007)
Firm Size <20 −0.191 ***
(0.010)
Firm Size 19 < X < 200 −0.128 ***
(0.008)
Firm Size 199 < X < 2000 −0.072 ***
(0.007)
Part-time Contract 0.004
(0.009)
Permanent Contract 0.108 ***
(0.011)
Collective Bargaining Agreement 0.012**
(0.006)
Constant2.868 ***2.584 ***
(0.004)(0.017)
Observations18,03518,035
R-squared0.0180.575
Notes: Survey years 2015 and 2019 used. Base model uses only the union member dummy as control (column (1)). Dummy variables used if not indicated differently. Full model (column (2)) also includes sector, survey year and federal state dummies. Deviation contrast transformation for categorical variables with more than two categories (i.e., for occupations, interactions of occupation with union membership, federal states, industries) applied. Robust standard errors clustered at the individual level in parentheses. ** and *** denote statistical significance at the 5%- and 1%-level, respectively. Data source: SOEP v36.
Table 3. Regression of Log Gross Hourly Wages, Full Model with Interaction Terms.
(1)(2)(3)
Full Model with Interaction Terms (Between Union Member and OccupationsFull Model with Interaction Terms (Between Union Member and Education)Full Model with Interaction Terms (Between Union Member and Gender)
VARIABLESLog Hourly Wages
Union Member−0.022 *0.042 ***0.030 ***
(0.012)(0.011)(0.009)
Legislators, Senior Officials and Managers0.431 ***0.413 ***0.413 ***
(0.016)(0.015)(0.015)
Professionals0.345 ***0.339 ***0.339 ***
(0.008)(0.008)(0.008)
Clerks−0.066 ***−0.071 ***−0.070 ***
(0.008)(0.008)(0.008)
Service Workers and Shop and Market Sales Workers−0.155 ***−0.156 ***−0.156 ***
(0.009)(0.008)(0.008)
Craft and Related Trade Workers−0.119 ***−0.115 ***−0.115 ***
(0.009)(0.008)(0.008)
Plant and Machine Operators and Assemblers−0.214 ***−0.190 ***−0.189 ***
(0.012)(0.010)(0.010)
Elementary Occupations−0.312 ***−0.299 ***−0.300 ***
(0.010)(0.010)(0.010)
Technicians and Associate Professionals0.090 ***0.079 ***0.079 ***
(0.006)(0.006)(0.006)
Union Member X Legislators, Senior Officials and Managers−0.145 ***
(0.040)
Union Member X Professionals−0.029
(0.018)
Union Member X Clerks−0.009
(0.017)
Union Member X Service Workers and Shop and Market Sales Workers0.006
(0.017)
Union Member X Craft and Related Trade Workers0.033 **
(0.016)
Union Member X Plant and Machine Operators and Assemblers0.096 ***
(0.019)
Union Member X Elementary Occupations0.105 ***
(0.022)
Union Member X Technicians and Associate Professionals−0.056 ***
(0.013)
Labor Market Experience (in Years)0.014 ***0.014 ***0.014 ***
(0.001)(0.001)(0.001)
Labor Market Experience Squared −0.000 ***−0.000 ***−0.000 ***
(0.000)(0.000)(0.000)
Job Tenure (in Years)0.007 ***0.007 ***0.007 ***
(0.000)(0.000)(0.000)
Basic Secondary Education (Hauptschule)−0.051 ***−0.049 ***−0.048 ***
(0.007)(0.008)(0.007)
Upper Secondary Education (Abitur)0.113 ***0.123 ***0.113 ***
(0.006)(0.007)(0.006)
Other Degree−0.021 **−0.024 **−0.023 **
(0.009)(0.010)(0.009)
No Degree−0.031 **−0.041 ***−0.033 **
(0.013)(0.014)(0.013)
Secondary Education (Realschule)−0.011 *−0.009−0.010 *
(0.006)(0.006)(0.006)
Young 16–29−0.036 ***−0.036 ***−0.036 ***
(0.008)(0.008)(0.008)
Adult 30–390.016 ***0.017 ***0.017 ***
(0.005)(0.005)(0.005)
Old 50–65−0.008−0.009−0.008
(0.006)(0.006)(0.006)
Adult 40–490.028 ***0.028 ***0.028 ***
(0.005)(0.005)(0.005)
Female−0.102 ***−0.100 ***−0.100 ***
(0.007)(0.007)(0.008)
Migration Background−0.031 ***−0.031 ***−0.031 ***
(0.009)(0.009)(0.009)
Married0.040 ***0.040 ***0.040 ***
(0.006)(0.006)(0.006)
Works Council0.059 ***0.060 ***0.060 ***
(0.007)(0.007)(0.007)
Firm Size <20−0.186 ***−0.186 ***−0.186 ***
(0.010)(0.010)(0.010)
Firm Size 19 < X < 200−0.124 ***−0.124 ***−0.124 ***
(0.008)(0.008)(0.008)
Firm Size 199 < X < 2000−0.072 ***−0.072 ***−0.071 ***
(0.007)(0.007)(0.007)
Part-time Contract 0.0050.0050.005
(0.009)(0.009)(0.009)
Permanent Contract0.098 ***0.098 ***0.098 ***
(0.011)(0.011)(0.011)
Collective Bargaining Agreement 0.025 ***0.025 ***0.025 ***
(0.006)(0.006)(0.006)
Union Member X Basic Secondary Education (Hauptschule) −0.001
(0.014)
Union Member X Upper Secondary Education (Abitur) −0.067 ***
(0.014)
Union Member X Other Degree 0.013
(0.021)
Union Member X No Degree 0.065 **
(0.032)
Union Member X Secondary Education (Realschule) −0.011
(0.013)
Union Member X Female −0.005
(0.013)
Constant2.582 ***2.535 ***2.528 ***
(0.022)(0.021)(0.018)
Observations18,03518,03518,035
R-squared0.5920.5900.590
Notes: Survey years 2015 and 2019 used. Regression also include sector, survey year and federal state dummies. Deviation contrast transformation for categorical variables with more than two categories (i.e., for occupations, educational categories, federal states, industries and interactions of occupation or educational categories with union membership) applied. Robust standard errors clustered at the individual level in parentheses. *, ** and *** denote statistical significance at the 10%-, 5%- and 1%-level, respectively. Data source: SOEP v36.
Table 4. Union Membership Shares, Densities and Wage Premia for Selected Groups of Workers.
(1)(2)(3)
GroupUnion Membership Share in %Union Density in %Adjusted Union Wage Premium in %
Basic Secondary Education (Hauptschule)22.7323.304.14
Secondary Education (Realschule)35.1517.503.13
Upper Secondary Education (Abitur)32.4615.30−2.52
Other Degree7.048.605.65
No Degree 2.5912.3011.30
Female 39.6112.702.55
Male 60.3920.103.08
Legislators, Senior Officials and Managers2.5510.70−15.44
Professionals16.6014.20−4.95
Technicians and Associate Professionals28.8216.80−7.50
Clerks11.6015.60−3.12
Service Workers and Shop and Market Sales Workers8.6111.30−1.64
Craft and Related Trade Workers13.5422.101.10
Plant, Machine Operators and Assemblers11.3628.207.62
Elementary Occupations6.9113.808.62
Full Sample 16.302.63
Notes: 18,035 observations, survey years 2015 and 2019 used. Dummy variables if not indicated differently. Data source: SOEP v36.
Disclaimer/Publisher’s Note: The statements, opinions and data contained in all publications are solely those of the individual author(s) and contributor(s) and not of MDPI and/or the editor(s). MDPI and/or the editor(s) disclaim responsibility for any injury to people or property resulting from any ideas, methods, instructions or products referred to in the content.

