Article

How Was the Staple Food Supply Chain in Indonesia Affected by COVID-19?

1
Department of Agricultural Socio-Economics, Universitas Padjadjaran, Sumedang 45363, Indonesia
2
School of Agricultural and Resource Economics, University of Western Australia, Perth 6009, Australia
*
Author to whom correspondence should be addressed.
Economies 2023, 11(12), 292; https://doi.org/10.3390/economies11120292
Submission received: 24 August 2023 / Revised: 16 October 2023 / Accepted: 17 October 2023 / Published: 1 December 2023

Abstract

:
During the COVID-19 pandemic, there were significant restrictions on the transportation of food products in Indonesia. The research objective of this study was to investigate the extent to which these restrictions impacted changes in marketing margins at the provincial level in Indonesia. The approach taken was through the examination of trade and freight margin statistical data before the pandemic (2019) and after the pandemic (2020) across a number of different commodity markets: rice, shallots, red chilli pepper, beef, chicken meat and eggs, sugar, and cooking oil. The evidence indicates that the pandemic brought a rapid rise in Indonesian domestic prices as a result of purchasing panic at its start. But after the imposition of transportation restrictions, there were wide variations: some durable food options experienced increased marketing margins, whereas non-durables tended to experience decreased marketing margins in some regions, as fresh products such as red chillies and shallots were discarded as a result of declining consumer purchasing power. The conclusion for policymakers is that any future restrictions should take into account this likely difference in response, in order to minimise economic disruption by calibrating support along the supply chain.

1. Introduction

Global food supply networks were hampered by the COVID-19 pandemic (Béné 2020). The disruptions in the flow of products and services, especially staple foods, have been attributed to lockdowns, border restrictions, labour shortages, and logistical difficulties. For disadvantaged people in particular, these disturbances had a cascading impact on food access, affordability, and nutrition (Debucquet et al. 2020). Understanding the scope of these disruptions is essential for developing successful policies and interventions in Indonesia since the majority of the population depends on readily accessible staples. The importance of ensuring food supplies during a pandemic is obvious, especially in developing countries where supply chains are regularly stressed (Narula 2017, p. 214), and where supply chain stress tests have now been recommended after the pandemic (Sharma et al. 2021), but there is little empirical research into how COVID-19 itself impacted supply chains (Barman et al. 2021). The research question addressed in this paper is in what ways the agribusiness supply chain in a specific region of Indonesia was affected by COVID-19.
Movement restrictions and health protocols that were used to identify the virus disrupted daily activities. Many farmers experience stress when managing jobs, such as migrant work, because of the stress of the journey. It can affect the processes of planting, tending, and harvesting. In addition to that, the deterioration of fertilisers, seeds, and other materials reduces productivity. Employees who are ill or who must perform quarantine procedures may also disrupt the production line’s output. This is related to the prevalence of processed products and their prompt consumption on the street. Supply logistics is harmed by border movements and border closures.
Reducing the movement of people and reducing the capacity of air transportation causes difficulties in sending agricultural products from one region to another, both domestically and internationally. This may prevent price increases and decreases in the availability of certain goods in a number of locations. Additionally, pandemic-long consumer behaviour also worsens food supply chains. Many restaurants and coffee shops offer Tutup Service or accept deliveries through shipping services, which can satisfy requests for specific food items. Some food types may experience a spike in demand, while others may have a drastic decline. Fluctuations in the price of staple food may be caused by disturbances in the supply chain. Decreasing production or availability may prevent the price from rising, especially if demand remains high. This may be detrimental to the economy and the capacity of the population to meet basic needs. This government has acknowledged the significance of having a flexible and adaptable food system for handling crises. Numerous nations feel the need to increase domestic food production and minimise trade costs.
As an archipelagic country with a very wide area, inadequate logistics infrastructure, and high transportation costs, Indonesia poses serious challenges for the supply and distribution of agricultural commodities and basic commodities. It is impossible to overestimate the significance of Indonesia’s supply chains for basic foods. It is the fourth most populated nation in the world, with a population of more than 270 million. This situation requires synchronisation and the alignment of progress between economic sectors and between regions for the realisation of better and more equitable economic growth (Dermoredjo et al. 2021). In addition, in improving the economy of a region, attention to logistics distribution channels has a very strategic role in the midst of the COVID-19 pandemic, especially those related to food. The flow of food trade can be carried out by land, sea, and air, so each of these routes becomes a concern in terms of the distribution of these commodities throughout Indonesia (Hirawan and Verselita 2020). The stability of food supply chains is a crucial national concern given this demographic size. Disruptions in these supply chains can result in both short-term food shortages and long-term socioeconomic effects in a nation that predominantly depends on domestically produced staples to meet the nutritional demands of its inhabitants (Aryani et al. 2015).
The economic sector that was worst hit during this pandemic was transportation and warehousing services, which contracted by −30.84% in the second quarter of 2020 (year on year). Almost all business fields in this sector shared in this contraction, with rail, land, sea, river, air, and warehousing transportation falling by −63.75, −17.65, −17.48, −26.66, −80.23, and −38.69%, respectively (BPS 2023). The slowdown due to the COVID-19 pandemic had a significant impact on the availability of domestic agricultural and food commodities due to the disruption of the national logistics system.
The Central Bureau of Statistics of Indonesia uses eight commodities in conducting its annual survey of distribution patterns. These commodities include medium rice, shallots (red onions), red chillies, beef, purebred chicken, chicken eggs, granulated sugar, and cooking oil. We have been able to analyse the trade and transport margin at the level of individual Indonesian provinces using an innovative-paradigm, providing fresh perspectives by offering in-depth insights that significantly extend beyond what was previously available. By integrating methodology with regional spatial analysis, our research tracks market evolution and provides a solid foundation for articulating strategic goals under current circumstances. This study will focus on the impact shock of the COVID-19 pandemic on the distribution supply chain in each province on the eight main agricultural commodities in domestic trade.

2. Methodology

Eight commodities/foodstuffs were selected for this study, based on their consumption and contribution to inflation, as identified by the National Strategic Food Price Information Center and as employed in previous studies (Laksono and Yuliawati 2021; Laili et al. 2022; Nurdjannah et al. 2014). Table 1 provides information on each. Data analysis was carried out through the use of descriptive statistical methods by calculating the difference between the differences in trade and freight margin data before the pandemic (2019) and after the pandemic (2020). The results of these calculations are spatially illustrated on a provincial scale in Indonesia.
We then used secondary data obtained from the central statistical agency of Indonesia in 2019 and 2020. The data used are trade and transport margin (MPP) data at the provincial level in Indonesia, shown below in Table 2. Trade and freight margin (MPP) is the compensation of traders as distributors of goods, which is the difference between the sales value and the purchase value. The study limitations of this research pertain to trade and transport margin data for the provincial level in Indonesia by using staple data specific to the country of Indonesia. The MPP margin is a measure of the size of the output from trading activities (BPS 2023).
Mathematically, it can be written as follows:
Mji = Psi − Pbi, or
Mji = bti − πi, or
πi = Mji − bti
The total marketing margin (M) can be mathematically written as follows:
M j = i = 1 n M j i ,   or   M j   =   P r P f
Information:
  • Mji = i-level marketing agency margins;
  • Psi = sales price i-level marketing agency;
  • Pbi = purchase price i-level marketing agency;
  • bti = marketing fee i-level marketing agency;
  • πi = advantages of i-level marketing agency;
  • Mj = total marketing margin;
  • Pr = price at the consumer level;
  • Pf = price at the producer level.

3. Results

The COVID-19 pandemic had an impact on the supply of key food commodities. This happened as a whole as a result of the policy of restricting population mobility, which affected the availability of food in the consumer market, so that prices in consumer and producer markets experienced different changes between regions (Poudel et al. 2020; Siche 2020). The results of our data analysis focus on the changes in the pattern of marketing margins for medium rice, shallots, red chillies, beef, purebred chicken, eggs, granulated sugar, and cooking oil in each province due to the emergence of the COVID-19 pandemic.

3.1. The Margin Change Pattern for Medium Rice Market

Rice is a strategic staple commodity supervised by the government and with its distribution intervention also carried out by the government. Price variations in the rice market were relatively lower than price variations in other food commodity markets, either before or during the COVID-19 pandemic (Dermoredjo et al. 2021). The relatively more stable price for the rice market cannot be separated from the relatively more intensive government intervention compared with other food markets (Herawati and Harianto 2021).
Most of the production centres for food commodities are located in Java and South Sulawesi. Based on Figure 1, it can be seen that the COVID-19 pandemic only had an effect on increasing the marketing margin of medium rice commodities in several provinces such as West Java, Central Java, most provinces on Sumatra Island, East Kalimantan, Central Kalimantan, a small number of provinces on Sulawesi Island, North Maluku, Papua, and West Papua. The mobility restriction policy in March–July 2020 also affected the rice distribution chain system, thus triggering an increase in prices originating in several provinces that have high consumption needs.

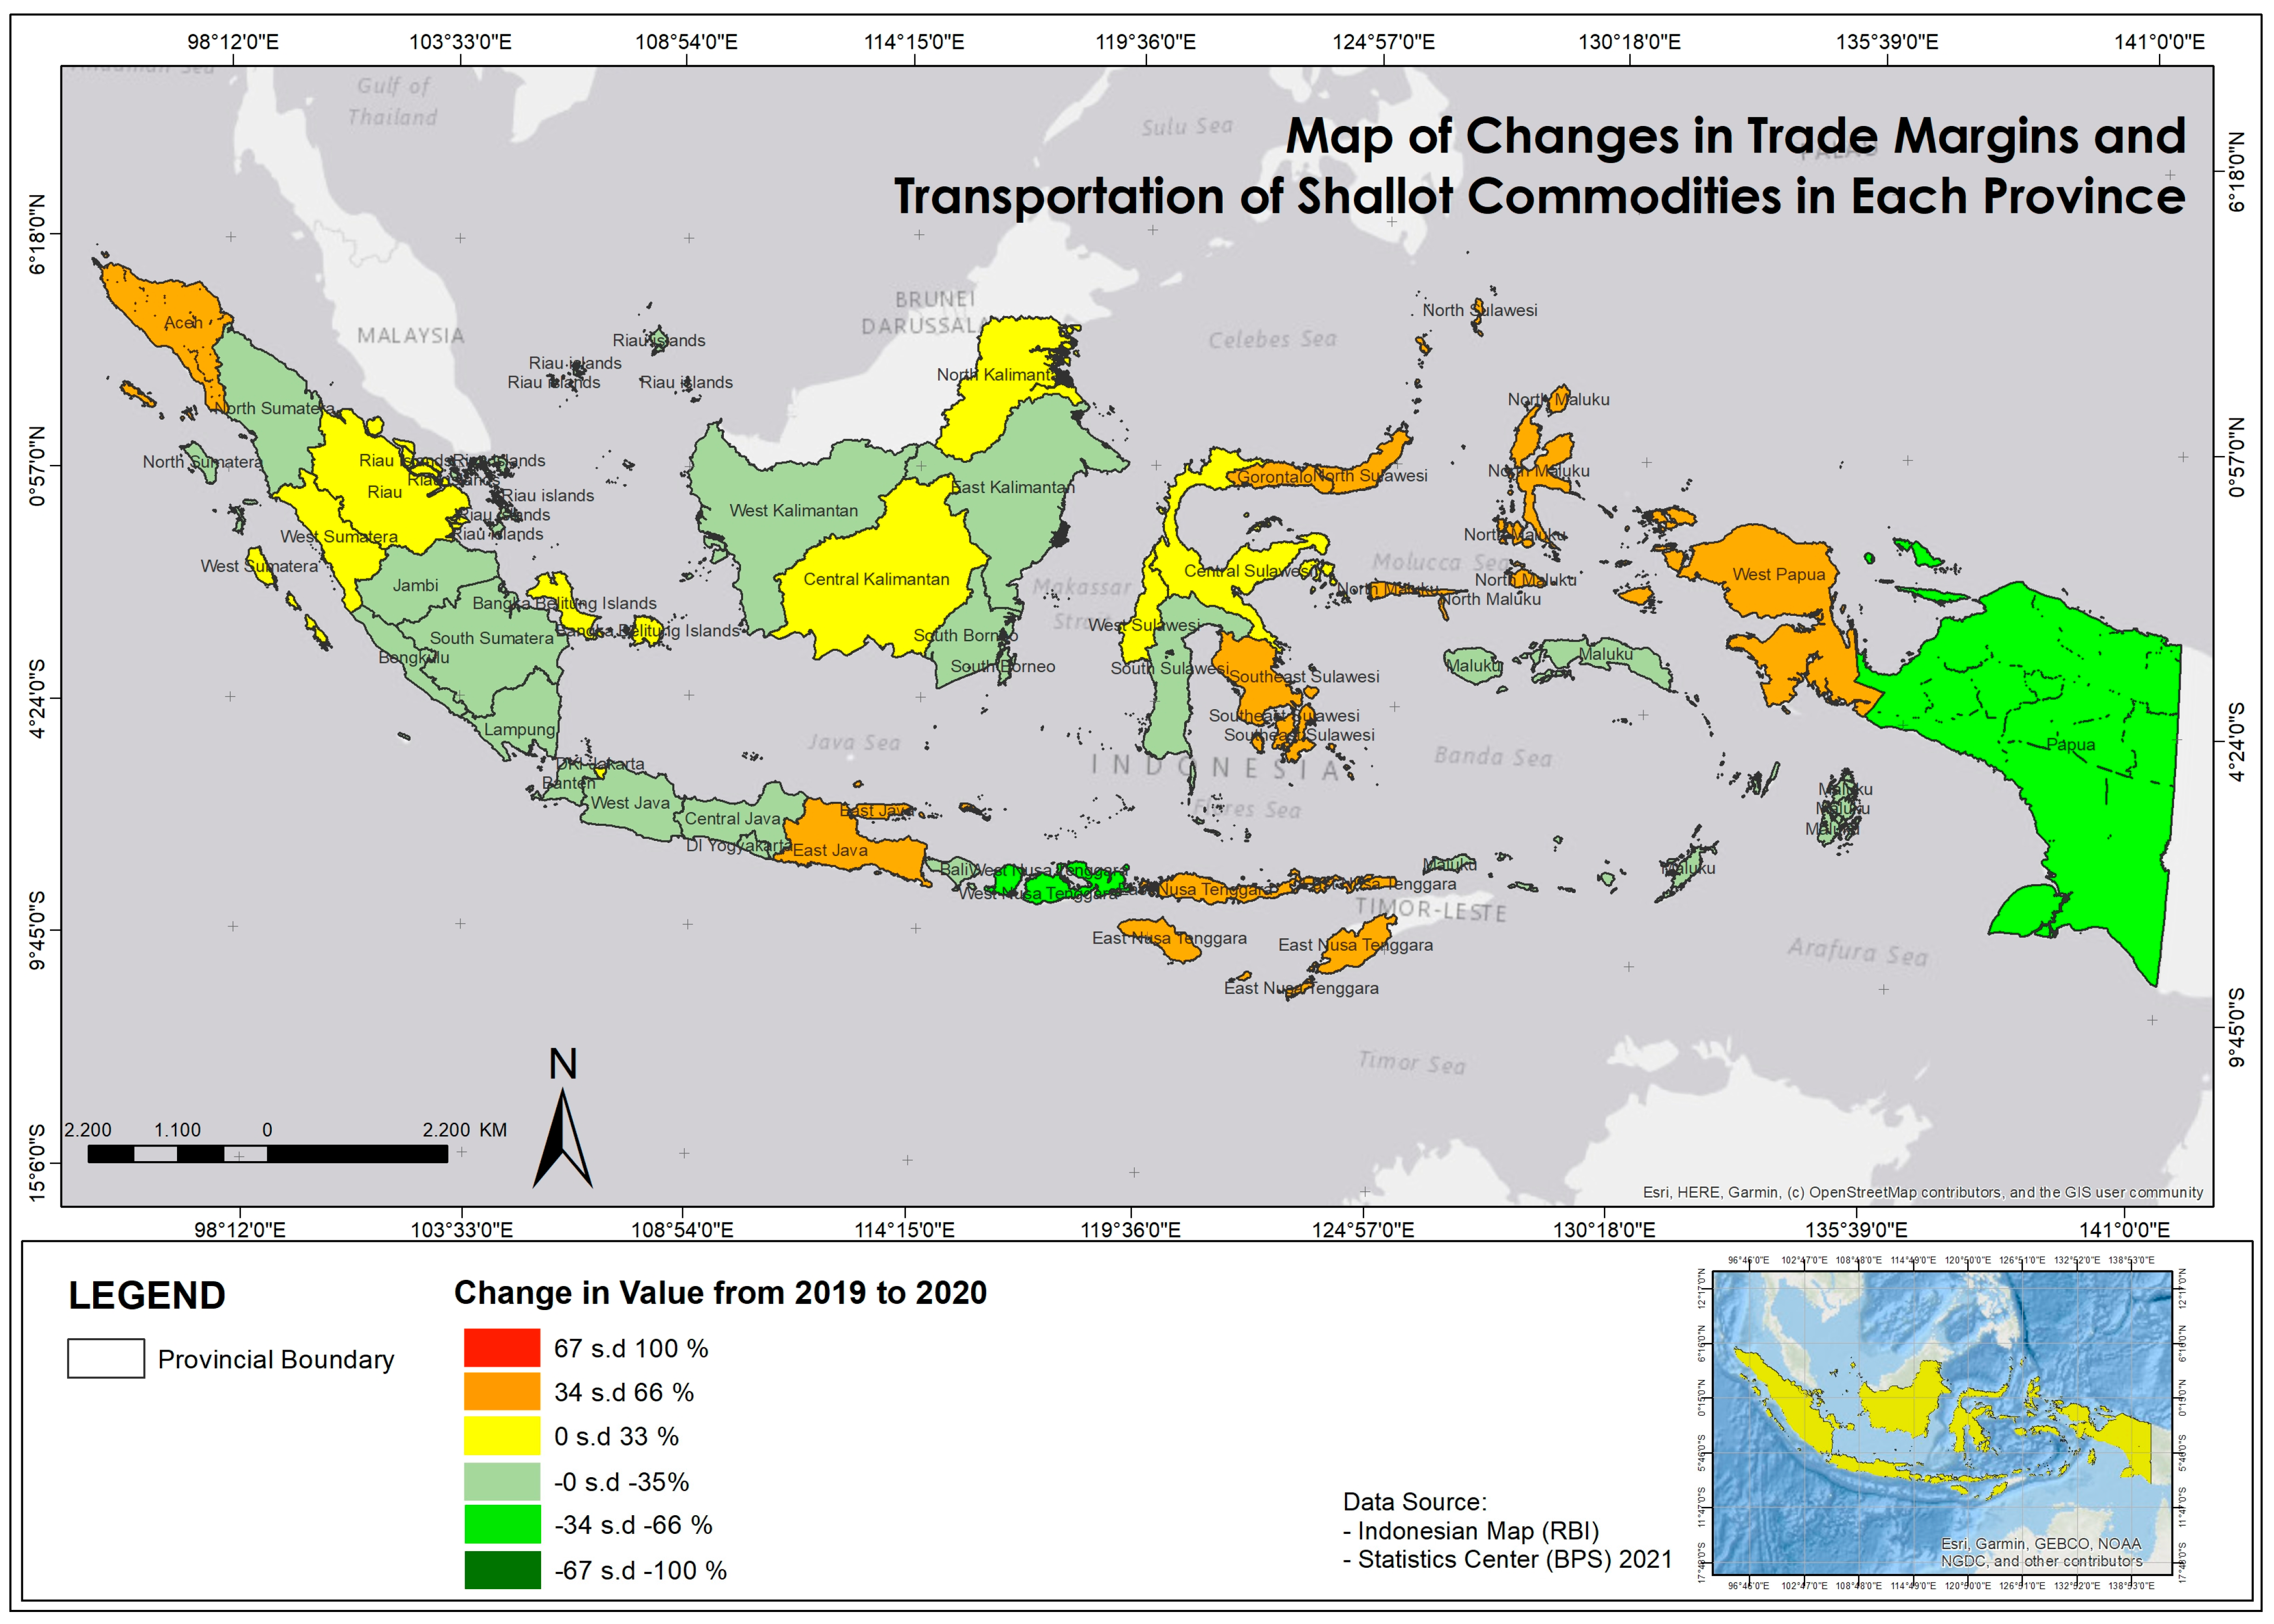
3.2. The Margin Change Pattern for Shallot Market

Shallots are included in the ten staple ingredients that have strategic value both politically and economically (Laksono and Yuliawati 2021; Amanda et al. 2016). Shallots in Indonesia are staple commodities that are difficult to replace, so regardless of the price of shallots, the demand will always be directly proportional to the high level of consumption. The price movement of shallots in each market has high fluctuations with a downward trend, as shown in Figure 2. The provinces of Central Java and West Java are the centres of shallot production in Indonesia. However, some provinces that have access to marketing chains were far from experiencing a fairly high increase in marketing margins during the pandemic. These provinces include Aceh, East Java, Southeast Sulawesi, North Sulawesi, East Nusa Tenggara, North Maluku, and West Papua.

3.3. The Margin Change Pattern for the Red Chilli Market

The marketing margin in the red chilli commodity market, which is perishable, is relatively larger than the marketing margin for non-perishable foodstuffs such as rice, cooking oil, and granulated sugar (Varshney et al. 2020). Marketing margins not only increased in magnitude in the period following the COVID-19 pandemic but also showed increased variability, as shown in Figure 3. However, interesting findings are obtained in the case of Indonesia, where there are variations in marketing margin changes for red chilli commodities at the provincial level. Provinces that have a characteristic consumption pattern in which red chillies are used more in cooking menus experience higher marketing margins. This pattern of increasing marketing margins is widely spread in most provinces on Sumatra Island, East–North Kalimantan Island, North Sulawesi, East Nusa Tenggara, and Maluku.

3.4. The Margin Change Pattern in the Beef Commodity Market

Beef was the commodity with the most affected marketing margin due to the pandemic throughout 2020. A total of 23 provinces experienced an increase in their beef marketing margin, see Figure 4 below. Provinces located on the islands of Java, Bali, and Nusa Tenggara were the areas that experienced a significant increase in marketing margins. However, East Kalimantan and Gorontalo were the provinces that experienced the highest margin increase, namely 36.68 percent and 36.74 percent, respectively.
This increase in margin was influenced by various factors such as policies imposing restrictions on mobility, which caused supply distribution to slow down; panic buying of high protein products among the middle- and upper-class economies for household stock purposes; and decreased production capacity due to a general decline in demand for beef due to increased layoffs in most factories in Indonesia. According to a cattle and beef distributor in Bekasi, national beef sales turnover during the COVID-19 pandemic was only 60% of pre-pandemic levels; there were undoubtedly delays caused by large-scale social restrictions, low implementation of sanitation and hygiene, physical distancing, and a lack of discipline in the use of personal equipment (Zulmaneri et al. 2021). This increase in marketing margins may also indicate that demand for beef is more responsive than staple food commodities in Indonesia.

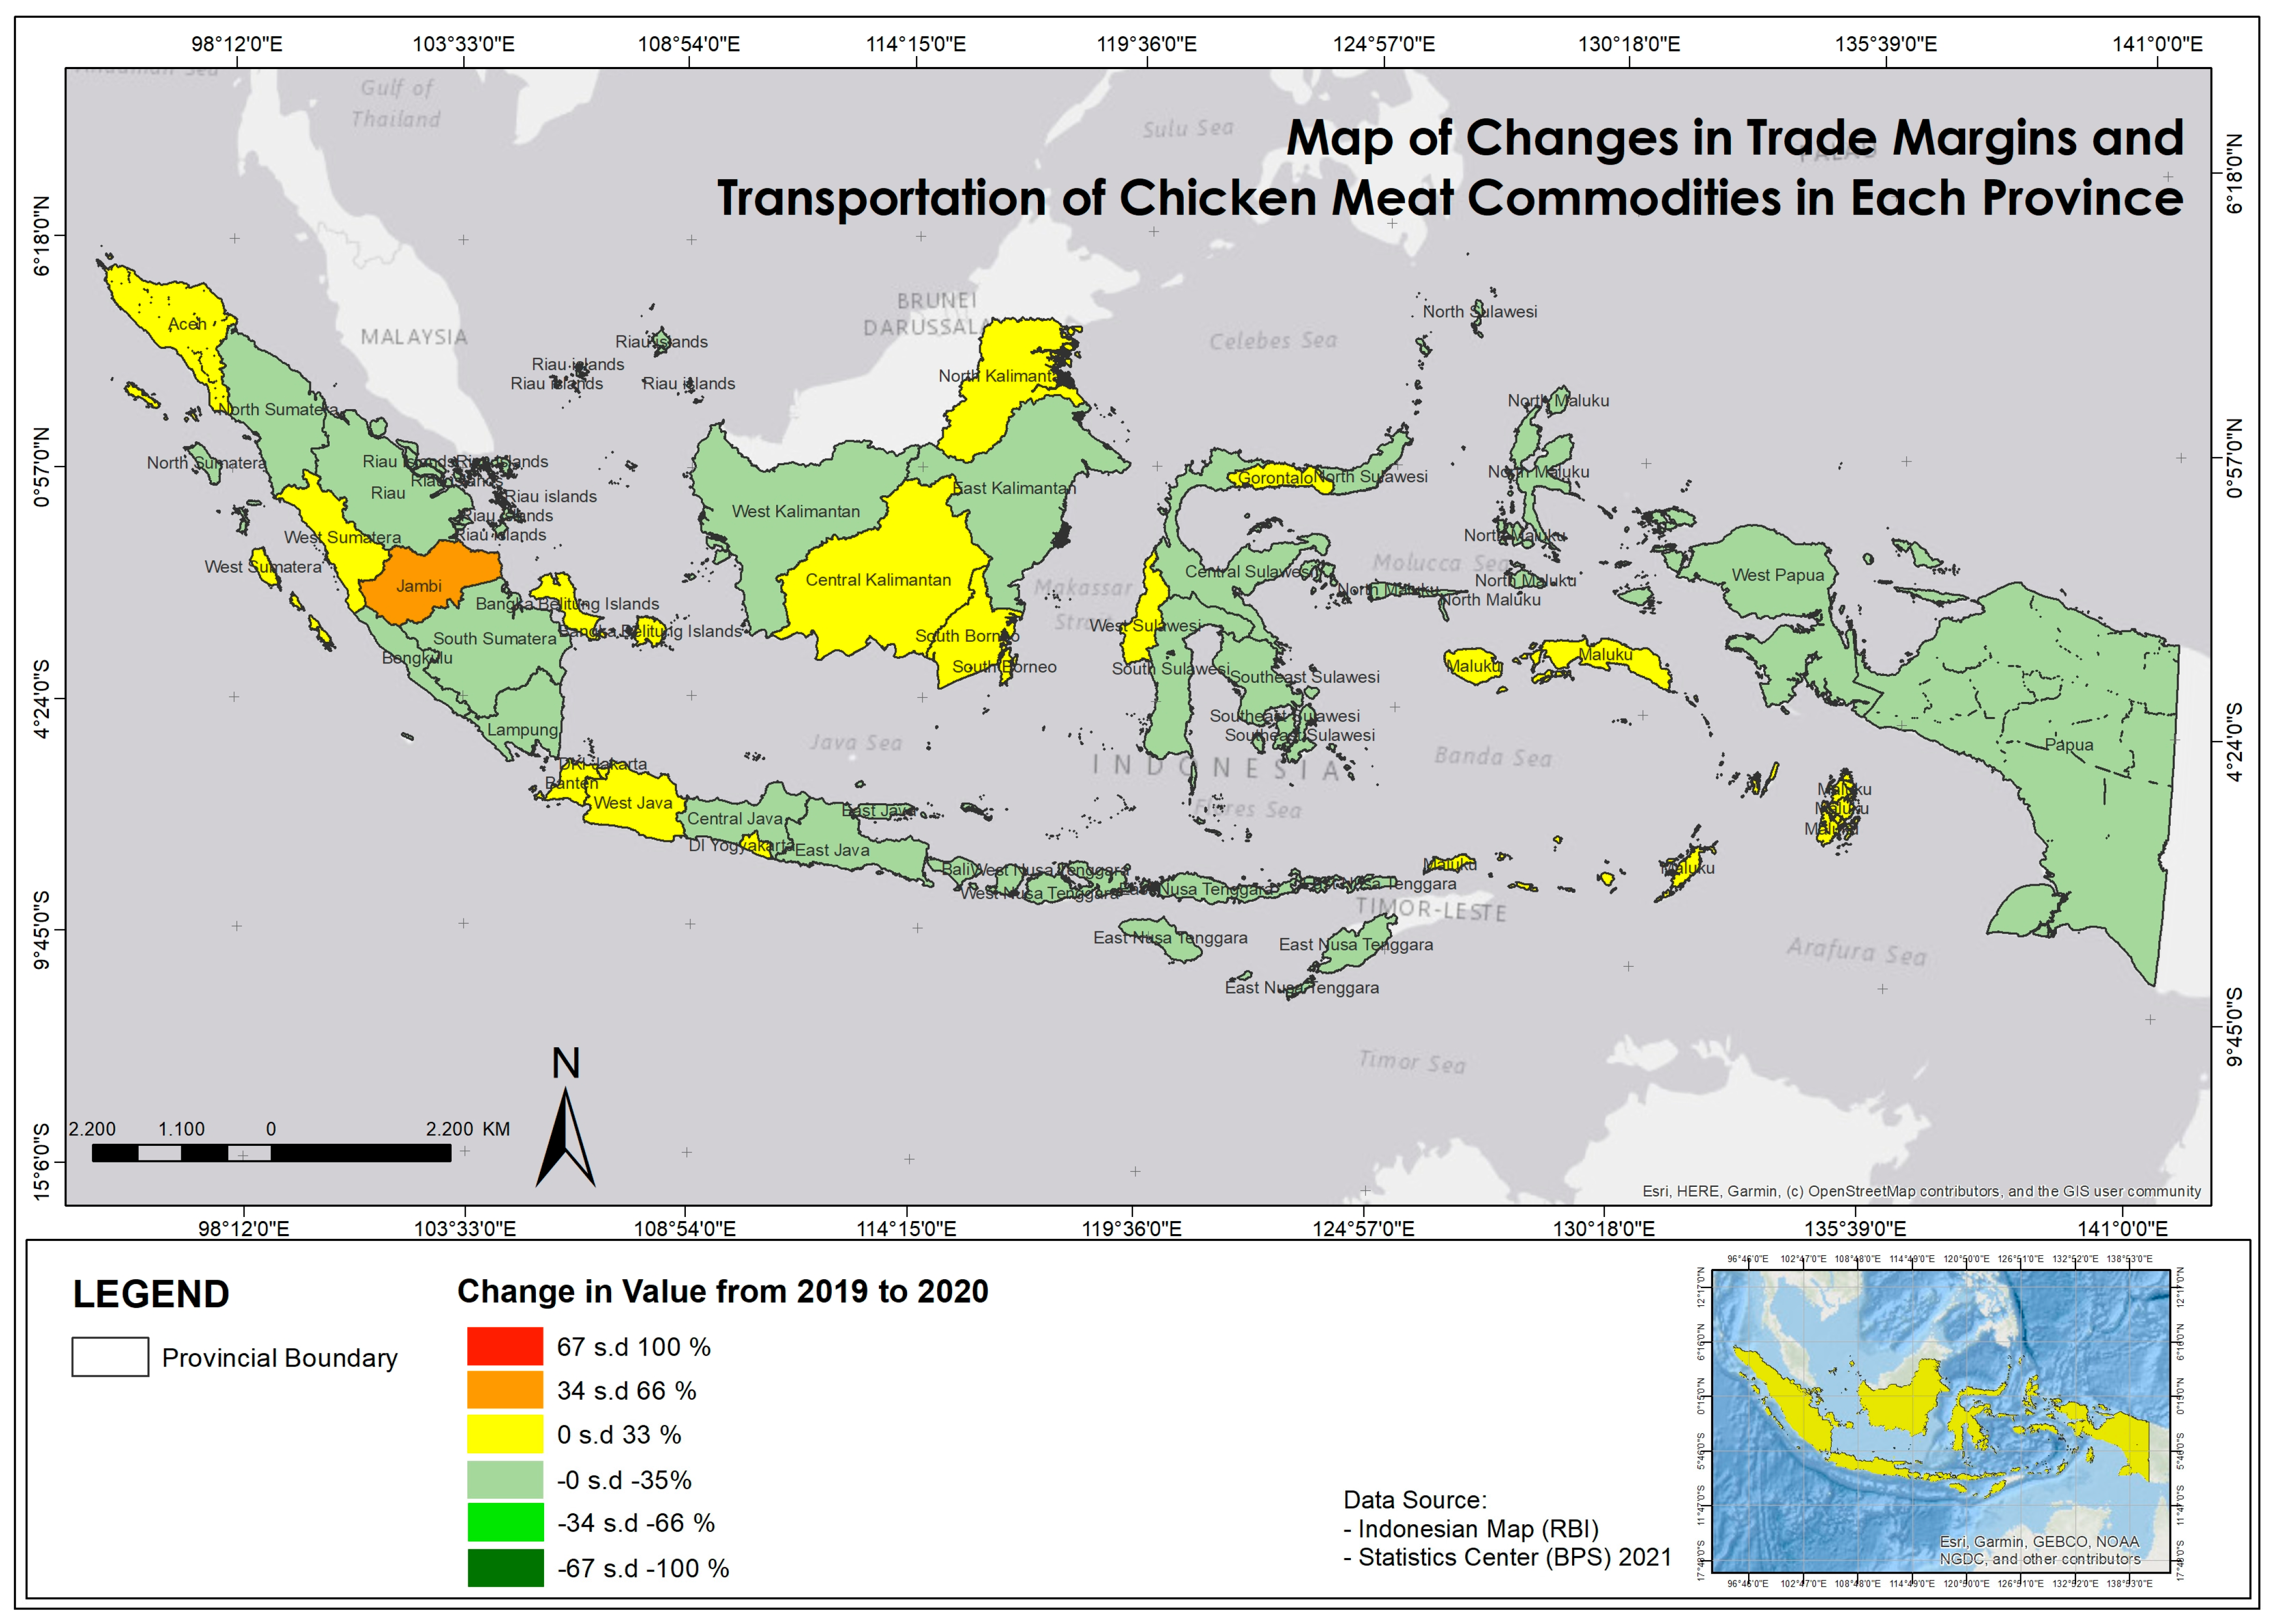
3.5. The Margin Change Pattern for the Chicken Meat Market

The level of consumption of animal food products and their contribution to the market increases with increasing income. In low-income communities, the level of consumption of broiler meat and its contribution to the market is much higher than other animal food products. The marketing chain of purebred chicken was relatively less affected by the COVID-19 pandemic as shown by Figure 5 below. The impact of the pandemic on changes in income, only reduced consumer prices for eggs and chicken meat in Indonesia but not producer prices. Mobility restriction policies on the one hand, and the necessity of food as one of the most basic human needs on the other, triggered the development of e-commerce. Broiler meat products are also relatively easy to obtain with the many itinerant chicken traders in Indonesia. The affected areas only occur in the provinces of West Java, Banten, Central Kalimantan, North Kalimantan, South Kalimantan, West Sumatra, Aceh, and Maluku.

3.6. The Margin Change Pattern for the Chicken Egg Market

Chicken eggs are the most affordable source of protein for people in Indonesia. From the production aspect, the supply of chicken eggs was not much affected by the COVID-19 pandemic compared with normal conditions, as Figure 6 shows. Merchant turnover during the pandemic in general experienced a decline due to a general decline in income. At the beginning of the pandemic, most people tended to curb consumption. Marketing margins were relatively stable for areas in Sumatra Island, Kalimantan, West Java Island, and Central Sulawesi Island. Areas with high per capita consumption of chicken eggs experienced an increase in marketing margins, such as the provinces of South Sulawesi, Central Java, East Java, and Bali-Nusa Tenggara.
In terms of environmental conditions, chicken eggs have advantages over other sources of animal protein. Chicken eggs can be stored at room temperature for about 14 days without using a refrigerator (refrigerator or freezer). This is one of the factors driving the decision of many community members to meet their animal protein needs by increasing egg consumption, in addition to the affordable price of eggs.

3.7. The Margin Change Pattern for the Sugar Market

Sugar is one of the commodities with the most fluctuation in terms of demand compared with other commodities. The price of sugar at the retail level skyrocketed in the midst of the COVID-19 pandemic. This occurred after the government implemented mobility restriction policies in a number of areas, especially the urban areas of Jakarta and its surroundings. The increasing transmission of COVID-19 limited the country’s full reopening after restrictions were imposed in March 2021, and the result was that many customers avoided restaurants and food stalls. Meanwhile, sugar prices remained high in most parts of the archipelago because domestic logistical disruptions caused an uneven supply of sugar. Areas that experienced disruption in sugar distribution are those that exhibited an increase in marketing margins, including West Java and Central Java, the eastern region of Sumatra Island, North and West Kalimantan, most of the islands of Sulawesi, Nusa Tenggara, and Papua. The effects are shown in Figure 7 below.

3.8. The Margin Change Pattern for Cooking Oil

Cooking oil is still one of the commodities with the greatest impact on inflation, at 0.01 percent in January 2022 (BPS 2023). There are many products derived from cooking oil in the processing industry, and many small and medium-sized businesses depend on cooking oil for their production inputs. Based on the data on changes in trading margins, the price of cooking oil has slightly increased when the average price before COVID-19 is compared with the average price after COVID-19. The price of cooking oil during the pandemic in Java was relatively good, except for Central Java. For Sumatra Island, only the provinces of South Sumatra and Jambi experienced an increase in trade margins. For Kalimantan Island, Central Kalimantan and East Kalimantan increased in trade margins. Furthermore, the provinces that experienced an increase were the provinces of South Sulawesi, West Sulawesi, North Sulawesi, North Maluku, West Papua, and Nusa Tenggara.
Distribution channel limitations due to mobility restrictions are believed to be the main factor underlying the increase in trading margins shown in Figure 8 below. The pandemic has disrupted the world’s supply chains, and the demand remains high. Meanwhile, limited supplies have caused an increase in CPO prices since 2020. The anomaly is that this high price is due to high demand as a result of disruption in the world’s oil supply. Meanwhile, not all of the domestically produced CPO is used for the integrity of cooking oil. There are at least 120 derivative products produced from processed palm oil. In addition, the need for exports has increased, leading to high demand and prices.

4. Discussion

The supply chain of an agricultural commodity includes supply chain management, which involves the management of the flow of good, the flow of information, safe transaction methods for the flow of mone and effective and efficient processes for procurement, storage, transportation, distribution, and delivery services in terms of type, quality, quantity, time, and the desired location (Min et al. 2020).
Most of the studies that have been published on the impact of COVID-19 on agribusiness supply chains have focused on developed countries. They have reached a broadly agreed set of conclusions. The first stage of the pandemic was an initial panic: wholesale markets diminished when restaurants, hotels, and schools were closed. With more food consumed at home, grocery retail demand for flour and other baking products increased significantly, which threatened food availability even in agriculturally rich countries such as the USA (Anderson et al. 2021) and New Zealand (Hall et al. 2021). Just-in-time food supply chains, with package sizes and infrastructure intended for wholesale buyers, struggled to adapt to retail sales.
Soon, even in countries such as Australia and Canada with well-managed supply chains, employee shortages as a result of both travel restrictions and illness emerged in the agriculture sector, and consumer confidence was shaken (Jones et al. 2022), with effects extending from large, concentrated meat and dairy processors to transportation networks (Hobbs 2020, 2021). Some products such as milk, vegetables, and even livestock were dumped as a result of slow responses to consumer choices (Yaffe-Bellany and Corkery 2020). In short, the pandemic exposed the ‘brittle’ (Weersink et al. 2021, p. 2) or ‘fragile’ (Marusak et al. 2021) nature of just-in-time supply international agribusiness chains. The result was that the short-term wholesale prices doubled due to supply constraints, although consumers suffered less, with official sources indicating that retail prices also increased on average by only 10% in Canada and 30% in the USA (Weersink et al. 2021, p. 3). Undoubtedly, price volatility for staple commodities increased significantly as a direct result of the pandemic (Laili et al. 2022).
Worldwide, the downstream stages of the supply chain experienced larger disruptions than the production stage (Mogues 2020, p. 3). There were some differences observed both internationally and between sectors. On the whole, in developed countries, the pandemic had a great impact on perishable agricultural products, such as vegetables, fruits, and especially livestock and poultry (Hayes et al. 2021; Weersink et al. 2020). Meat processing firms in particular experienced extreme production risk during the first stages of the pandemic (Virmond et al. 2021, p. 742). By contrast, scholars’ ability to forecast the relatively modest effects of the pandemic on grain and oilseed production, with no real threat to the provision of staple foods in Canada (Brewin 2020, 2021), on international trade for staples beyond initial export restrictions (Barichello 2020), and on the bulk grain transportation (Gray 2020) was both consistent and impressive. Markets concurred: Vercammen (2020) noted that even early on during the pandemic, the prices in the market tended towards eventual abatement due to the short-run surge in flour and longer-term income concerns, combined with the negative impact of WFH on grains used for ethanol.
In the second stage, however, agribusiness moved back to relatively normal conditions very rapidly, with prices and production levels rapidly returning to levels similar to those typically observed in years prior to the pandemic worldwide, including in complex markets like China, where the organisation of online markets by the government played a key role in managing supply and demand (Pu et al. 2021). Absenteeism remained a problem (Weersink et al. 2021, p. 2), and there were sporadic shortages of specific items in supermarkets, but there was no further major panic. Even the effect on beef and sheep farming turned out to be relatively small, short-lived, and largely offset by other global influences, although in middle-income countries such as Brazil and Argentina, there were shifts in consumer demand, which was reduced for beef and sheep meat in favour of lower-priced meat such as pork and poultry (Almadani et al. 2021). It was suggested that the specialisation and fragmentation of developed country ‘just-in-time’ agribusiness supply chains, which had led to the initial disruptions, may have also been responsible for its rapid rebound (Weersink et al. 2021, p. 15).
Any further long-term consequences, such as negative consequences for the labour markets as a result of a spur in the adoption of automation or further consolidation of supply chains, remain just speculation, and they are so far unsupported by data, and depend on changes in post-COVID-19 behaviour (Weersink et al. 2021, p. 13). Even increased online food shopping caused by the pandemic served only to accelerate the decline in high-end street restaurants that were already well underway before the pandemic (Weersink et al. 2021).
Globally, perishable agricultural products, such as horticultural products and vegetables, experienced a decrease in prices at the farm level and an increase in prices at the retail level, i.e., a widening of the marketing margin (Rifin 2022, p. 92), as evidenced, for example, in China (Zhou et al. 2020) and the United States (Nzeyimana et al. 2022, p. 4). To date, as far as developing countries are concerned, research has been more limited. There is widespread agreement that COVID-19 brought economic activity to a temporary virtual standstill and hindered agricultural production across the developing world, compounding existing problems such as climate change and regulations not supporting agriculture (Mukiibi 2020, p. 627) and hampering efforts to improve national logistics systems. Problems arose from disruptions imposed on suppliers, producers, retailers, wholesalers, and all links in the supply chain (Cardoso et al. 2021), with the disruption of the food distribution chain and reduced community food security (Nchanji et al. 2020; Huang 2020; Pan et al. 2020; Istianingsih 2021).
The UN Food and Agriculture Organisation (FAO) quickly reported on the unfolding crisis: In Somalia, Afghanistan, and East Africa, COVID-19 caused an acute food crisis and insecurity, whilst in Bangladesh, it led to the disruption of transportation and falling prices for food products, resulting in trade barriers for food-importing countries and regions such as the Caribbean, Ecuador, and Venezuela (FAO 2020). Academic analysis was also prompt: in Malaysia, the inability of local open markets to operate within social distancing restrictions led to them being closed down. In a parallel process to that occurred in developed countries, this led to farmers giving away or dumping their perishable farm produce (Ng and Wahid 2020). With foreign workers, refugees, and those from lower-income groups facing difficulties in accessing adequate food, both government and volunteers sought to provide emergency supplies (Chin 2020, p. 162). Similarly, in India, for example, the government supported its farmers with compensation for lost crops and by purchasing unsold agricultural produce, although social distancing also proved problematic for Indian farmers (Mukhopadhyay 2020). In China, a survey of Chinese farmers and enterprises conducted in February 2020 found that 60 percent of the farmers encountered a shortage of inputs, with a lack of feed leading some farm animals to starve to death (Zhang et al. 2020). Developing countries were not immune to labour supply problems either, which were associated with workers off sick and border closures (Stephens et al. 2020). However, despite individual contributions of this kind, the impact on agribusiness supply chains in developing countries remains generally under-researched.
Even though Indonesia did not enact strict lockdown measures, some regions did come close to the implementation of Pembatasan Sosial Berskala Besar (PSBB: Large-Scale Social Restrictions) or limited certain activities. In response to the heavy impact on food security, the Indonesian government implemented several strategies, such as controlling food prices, which led to relatively stable and predictable prices (Mardianto et al. 2020); expanding agricultural land areas (Darma and Darma 2020, p. 377); regulating food distribution during PSBB; increasing food-waste awareness; compensating or providing subsidies for farmers through direct cash transfer; using the Village Funds Program and other similar assistance policies (Ulfa et al. 2021) buying unsold agricultural products; minimising unnecessary food imports; optimising the BULOG’s role in releasing food stock; and increasing dietary awareness to increase immunity (Rozaki 2020, p. 254; Rozaki 2021). In terms of prices, significant variations were quickly observed between regions (World Food Programme 2020).
The empirical analysis of individual agribusiness sectoral responses to COVID-19 in the Indonesian context has revealed a perfect storm of problems. On the one hand, a study of farmers in the Tanah Datar District indicated that almost half had difficulty accessing agricultural inputs such as seeds, fertilisers, and pesticides during the pandemic (Triana et al. 2021). Another study indicated an even higher number—over four-fifths (Ulfa et al. 2021). On the other hand, studies such as those by Nurahmi and Zalizar (2021) and Surni et al. (2020) indicated that restrictions imposed as a result of COVID-19 cut demand for broilers in regions such as Jombang: To avoid a vicious spiral of reduced production and increased production costs, breeders sold chicken meat, including online, at a slightly lower than normal price in the middle part of 2020. Chicken farmers suffered losses because hotels, restaurants, and catering businesses that purchased chicken products were not operating (Yunita and Hasibuan 2021). Similar results emerged from a study (Azhari 2021) of reef fishers in the Spelman Strait: They were forced to sell their catch at low prices. Some fish were ultimately distributed to families or were processed or stored as salted fish. The reality for Indonesian agribusinesses during the pandemic was evidently not as satisfactory as for developed economies, although it mirrored the experiences of other developing countries described above.
The COVID-19 pandemic has had a significant impact on global supply chains, leading to disruptions and challenges for businesses across various sectors. The pandemic has created various challenges for supply chains, including demand fluctuations, transportation disruptions, inventory shortages, and workforce issues (Raj et al. 2022). These challenges have highlighted the need for more resilient and flexible supply chain strategies. The supply chain challenges arising from the pandemic are interconnected, with disruptions in one area often leading to ripple effects in other areas. For example, transportation disruptions can lead to inventory shortages, which in turn can affect production and customer satisfaction (Raj et al. 2022). To address supply chain challenges, companies have implemented various mitigation strategies, such as diversifying suppliers, increasing inventory levels, and adopting digital technologies for better visibility and collaboration (Raj et al. 2022). These strategies aim to enhance the resilience and agility of supply chains in the face of future disruptions. The pandemic has had both positive and negative impacts on supply chains, depending on the industry and context (Moosavi et al. 2022).
While some sectors have experienced severe disruptions, others have found new opportunities for growth and innovation (Heidary 2022). Life sciences companies, for example, reported few effects from the pandemic (Heidary 2022). The pandemic has accelerated many pre-existing trends in supply chain management, such as digital transformation and automation. Companies are increasingly investing in technology to reduce employee exposure to COVID-19 and improve operational efficiency. The COVID-19 pandemic has served as a learning experience for supply chain management, highlighting the importance of risk and resilience planning. Companies are now reimagining their supply chain strategies and finding ways to include operational excellence and standard work to enable continual supply chain cost reduction. While there have been numerous studies on the impact of COVID-19 on supply chains, few stand out for providing a roadmap on how to recover from the pandemic consequences (Younis et al. 2023). Future research should focus on understanding the long-term effects of the pandemic on supply chains and developing strategies for building more resilient and sustainable systems (Younis et al. 2023).

5. Conclusions

In general, during the pandemic, food prices throughout Indonesia showed no consistent pattern; within the general framework of relative predictability, there were varying increases and decreases comparing the average price in the previous period and the average price during the COVID-19 pandemic. The explanation lies in the fact that there were two conflicting trends: weakening food demand at the consumer level versus bottlenecks in the main food supply chain. What did however become temporarily clear was that again in general, the pandemic in Indonesia resulted in increased variability of marketing margins. This was influenced by the distance from consumers to producers and the logistical complexity of transportation modes in an area. However, the marketing margin in the market for perishable foodstuffs (shallots and red chillies) was relatively larger than the marketing margin for non-perishable foodstuffs (rice, cooking oil, chicken meat, beef, chicken egg, and granulated sugar).
Although these margins have now broadly returned to pre-pandemic levels (BPS 2023), the policy implication of this analysis is that the control of prices overall may be only one aspect of overall price management during a crisis. If the objective is to ensure the smooth continuation of the supply chain, then it may be preferable to exchange some degree of price stability for a similar marketing margin stability. Alternatively, if prices cannot be allowed to take the strain, more direct methods of support might be considered for those marketing chains that are adversely affected.
The extent to which this policy conclusion can be generalised beyond Indonesia, however, depends on the relatively precise replication of this analysis in other jurisdictions, which is the call to action that this research indicates is now required. To properly maintain logistics and supply systems, the government and stakeholders must work together. This can encourage investment in transportation infrastructure, technology, and other areas to improve efficiency. To diversify the market, business stakeholders in the province should look for new opportunities. The use of digital solutions in trade and distribution can improve crisis preparedness. Developing strategies to improve provinces’ economic performance can benefit from economic sector diversification, investment promotion, and local community-based economic development. Interprovincial cooperation can increase effectiveness and promote products and services that are truly beneficial. Strategies should be developed to prepare for potential future crises by emphasising emergency plans, workplace training, and improving the capacity of safety and security systems.
The final observation, however, must be a salutary one indicating that the trajectories of marketing margins during and after the pandemic are one example of a wider perspective in relation to the effect of the pandemic. Early on, it was believed that COVID-19 might provide an opportunity to rethink a range of existing policies and practices concerning the food supply chain (Chin et al. 2020). It would, even in developing countries, drive the use of technology such as automation and robotics (Galanakis et al. 2021, p. 197), the IoT (Dutta and Mitra 2021), or drones (Kim et al. 2021). It would also help reshape existing food systems in the direction of local and regional food systems (Thilmany et al. 2021) and transition to new kinds of systems that support rural development and healthy, more plant-based diets for all members of society (Aday and Aday 2020, p. 5). It would also increase pressure to protect the environment and better align food production and consumption to the principles of sustainable development (Mollenkopf et al. 2021). With the benefit of even three years of hindsight, it has become evident that these expectations were misguided: the pandemic was transitory rather than transformative and has in fact had relatively little permanent effect.
The COVID-19 pandemic offers unusual resistance to supply chains, and the current study explores the complexity of such dynamics in the context of the pentahelix. Governments must play a key role in adapting national supply chains and ensuring their long-term sustainability. The goal of businesses is to continuously innovate and adapt to reduce risk and improve operational efficiency. Academia has an important role in providing knowledge and resources to support the planning and development of long-term solutions. Society must participate in changing consumer preferences and driving economic growth. The ability to convey accurate information and maintain public opinion is the power of the media. Flexible and tangible supply chains can be created to ensure resilience in the face of future challenges through joint work and active collaboration among the five stakeholders.

Author Contributions

Conceptualisation, E.P.Y. and J.R.; methodology, E.P.Y. and J.R.; software, E.P.Y.; validation, J.R.; formal analysis, E.P.Y. and J.R.; investigation, E.P.Y. and J.R.; resources, E.P.Y.; data curation, E.P.Y.; writing—original draft preparation, E.P.Y.; writing—review and editing, J.R.; visualisation, E.P.Y.; supervision, J.R.; project administration, E.P.Y.; funding acquisition, E.P.Y. All authors have read and agreed to the published version of the manuscript.

Funding

This research was funded by Universitas Padjadjaran, grant number 1427/UN6.3.1/LT/2020 and the APC was also funded by Universitas Padjadjaran.

Institutional Review Board Statement

Not applicable.

Informed Consent Statement

Not applicable.

Data Availability Statement

The datasets used and/or analyzed during the present study are available from the corresponding author upon a reasonable request.

Acknowledgments

We would like to express our gratitude to Universitas Padjadjaran for providing research funding, and also for providing funding for publication.

Conflicts of Interest

The authors declare no conflict of interest.

References

  1. Aday, Serpil, and Mehmet Seckin Aday. 2020. Impact of COVID-19 on the food supply chain. Food Quality and Safety 4: 167–80. [Google Scholar] [CrossRef]
  2. Almadani, Mohamad Isam, Peter Weeks, and Claus Deblitz. 2021. COVID-19 Influence on Developments in the Global Beef and Sheep Sectors. Ruminants 2: 27–53. [Google Scholar] [CrossRef]
  3. Amanda, Dea, Yusman Syaukat, and Muhammad Firdaus. 2016. Estimating the Market Power in the Indonesian Garlic Industry. Journal of the International Society for Southeast Asian Agricultural Sciences 22: 66–79. [Google Scholar]
  4. Anderson, John D., James L. Mitchell, and Joshua G. Maples. 2021. Invited Review: Lessons from the COVID-19 pandemic for food supply chains. Applied Animal Science 37: 738–47. [Google Scholar] [CrossRef]
  5. Aryani, Desi, Ronnie S Natawidjaja, Trisna I. Noor, and Andy Mulyana. 2015. The effectiveness of rice price stabilization policy in Indonesia. International Journal of Science and Research 6: 1060–63. [Google Scholar]
  6. Azhari, Muis. 2021. The reef fish trade chain before and during the COVID-19 pandemic in Central Buton District, Indonesia (case study of the coastal waters of the Spelman Strait). Aquaculture, Aquarium, Conservation & Legislation 14: 478–85. [Google Scholar]
  7. Barichello, Richard. 2020. The COVID-19 pandemic: Anticipating its effects on Canada’s agricultural trade. Canadian Journal of Agricultural Economics/Revue Canadienne d’Agroéconomie 68: 219–24. [Google Scholar] [CrossRef]
  8. Barman, Abhijit, Rubi Das, and Pijus Kanti De. 2021. Impact of COVID-19 in food supply chain: Disruptions and recovery strategy. Current Research in Behavioral Sciences 2: 100017. [Google Scholar] [CrossRef]
  9. Béné, Christophe. 2020. Resilience of local food systems and links to food security—A review of some important concepts in the context of COVID-19 and other shocks. Food Security 12: 805–22. [Google Scholar] [CrossRef]
  10. BPS. 2023. Available online: https://www.bps.go.id/indicator/173/1884/1/margin-perdagangan-dan-pengangkutan-mpp-komoditas-beras-menurut-provinsi.html (accessed on 2 September 2023).
  11. Brewin, Derek Gerald. 2020. The impact of COVID-19 on the grains and oilseeds sector. Canadian Journal of Agricultural Economics/Revue Canadienne d’Agroeconomie 68: 185–88. [Google Scholar] [CrossRef]
  12. Brewin, Derek Gerald. 2021. The impact of COVID-19 on the grains and oilseeds sector: 12 months later. Canadian Journal of Agricultural Economics/Revue Canadienne d’Agroeconomie 69: 197–202. [Google Scholar] [CrossRef]
  13. Cardoso, Brenda, Luiza Cunha, Adriana Leiras, Paulo Gonçalves, Hugo Yoshizaki, Irineu de Brito Junior, and Frederico Pedroso. 2021. Causal impacts of epidemics and pandemics on food supply chains: A systematic review. Sustainability 13: 9799. [Google Scholar] [CrossRef]
  14. Chin, Anne, Gregory L. Simon, Peter Anthamatten, Katharine C. Kelsey, Benjamin R. Crawford, and Amanda J. Weaver. 2020. Pandemics and the future of human-landscape interactions. Anthropocene 31: 100256. [Google Scholar] [CrossRef]
  15. Chin, Chiew Foan. 2020. The impact of food supply chain disruptions amidst COVID-19 in Malaysia. Journal of Agriculture, Food Systems, and Community Development 9: 161–63. [Google Scholar] [CrossRef]
  16. Darma, Surya, and Dio Caisar Darma. 2020. Food Security Management for Indonesia: The Strategy during the COVID-19 Pandemic. Management Dynamics in the Knowledge Economy 8: 371–81. [Google Scholar] [CrossRef]
  17. Debucquet, David Laborde, Will Martin, and Rob Vos. 2020. Impacts of COVID-19 on Global Poverty, Food Security, and Diets: Insights from Global Modeling. IFPRI Discussion Paper 1977. Washington, DC: International Food Policy Research Institute. [Google Scholar]
  18. Dermoredjo, Saktyanu K., Yonas H. Saputra, and Delima H. Azahari. 2021. Dampak Pandemi COVID-19 terhadap Perdagangan dalam Negeri Komoditas Pertanian. In Dampak Pandemi COVID-19: Perspektif Adaptasi dan Resiliensi Sosial Ekonomi Pertanian. Edited by Achmad Suryana, I. Wayan Rusastra, Tahlim Sudaryanto and Sahat M. Pasaribu. Jakarta: IAARD Press, pp. 127–48. [Google Scholar]
  19. Dutta, Pushan Kumar, and Susanta Mitra. 2021. Application of Agricultural Drones and IoT to Understand Food Supply Chain During Post COVID-19. In Agricultural Informatics: Automation Using the IoT and Machine Learning. Edited by Amitava Choudhury, Arindam Biswas, Manish Prateek and Amlan Chakrabarti. London: John Wiley, pp. 67–88. [Google Scholar] [CrossRef]
  20. Food and Agriculture Organisation (FAO). 2020. Q&A: COVID-19 Pandemic—Impact on Food and Agriculture. Available online: http://www.fao.org/2019-ncov/q-and-a/en (accessed on 17 July 2023).
  21. Galanakis, Charis M., Myrto Rizou, Turki M.S. Aldawoud, Ilknur Ucak, and Neil J. Rowan. 2021. Innovations and technology disruptions in the food sector within the COVID-19 pandemic and post-lockdown era. Trends in Food Science & Technology 110: 193–200. [Google Scholar] [CrossRef]
  22. Gray, Richard S. 2020. Agriculture, transportation, and the COVID-19 crisis. Canadian Journal of Agricultural Economics/ Revue Canadienne d’Agroeconomie 68: 239–43. [Google Scholar] [CrossRef]
  23. Hall, C. Michael, Peter Fieger, Girish Prayag, and David Dyason. 2021. Panic buying and consumption displacement during COVID-19: Evidence from New Zealand. Economies 9: 46. [Google Scholar] [CrossRef]
  24. Hayes, Dermot J., Lee L. Schulz, Chad E. Hart, and Keri L. Jacobs. 2021. A descriptive analysis of the COVID-19 impacts on US pork, turkey, and egg markets. Agribusiness 37: 122–41. [Google Scholar] [CrossRef]
  25. Pahulu, Heather, Robert Davidson, Martin Dunn, Lynn Ogden, Frost Steele, and Oscar Pike. 2007. Change in Mutagenicity in White Rice after Accelerated and Long-Term Storage. Journal of Food Science 72: C126–C131. [Google Scholar] [CrossRef]
  26. Heidary, Mojtaba Hajian. 2022. The Effect of COVID-19 Pandemic on the Global Supply Chain Operations: A System Dynamics Approach. Foreign Trade Review 57: 198–220. [Google Scholar] [CrossRef]
  27. Herawati, Herawati, and Harianto Harianto. 2021. Pola Perubahan Harga Dan Marjin Pemasaran Bahan Pangan Di Masa Pandemi COVID-19. Jurnal Agribisnis Indonesia (Journal of Indonesian Agribusiness) 9: 188–99. [Google Scholar] [CrossRef]
  28. Hirawan, Fajar B., and Akita A. Verselita. 2020. Kebijakan Pangan Pada Masa Pandemi COVID-19. CSIS Commentaries DMRU-048-ID. Jakarta: Centre for Strategic and International Studies. Available online: https://s3-csis-web.s3.ap-southeast-1.amazonaws.com/doc/CSIS_Commentaries_DMRU-048-ID_HirawanVerselita.pdf (accessed on 23 June 2022).
  29. Hobbs, Jill E. 2020. Food supply chains during the COVID-19 pandemic. Canadian Journal of Agricultural Economics/ Revue Canadienne d’Agroeconomie 68: 171–76. [Google Scholar] [CrossRef]
  30. Hobbs, Jill E. 2021. Food supply chain resilience and the COVID-19 pandemic: What have we learned? Canadian Journal of Agricultural Economics/Revue Canadienne d’Agroeconomie 69: 189–96. [Google Scholar] [CrossRef]
  31. Huang, Ji-kun. 2020. Impacts of COVID-19 on agriculture and rural poverty in China. Journal of Integrative Agriculture 19: 2849–53. [Google Scholar] [CrossRef]
  32. International Center for Applied Finance and Economics (InterCAFE), and Lembaga Penelitiandan Pengabdian Masyarakat (LPPM) IPB. 2018. Market Study on Food Sector in Indonesia. Available online: https://kppu.go.id/wp-content/uploads/2019/09/Market_Study_Report_JICA.pdf (accessed on 11 July 2023).
  33. Istianingsih, Istianingsih. 2021. Behavior of Using the Food Marketplace System in the New Normal Era of COVID-19 in Indonesia. Preprints, 2021050146. [Google Scholar] [CrossRef]
  34. Jones, Natalie A., Jennifer Bellamy, William Bellotti, Helen Ross, Severine van Bommel, and Yiyu Liu. 2022. A shock to the system: What the COVID-19 pandemic reveals about Australia’s food systems and their resilience. Frontiers in Sustainable Food Systems 5: 790694. [Google Scholar] [CrossRef]
  35. Kim, Jinkyung Jenny, Insin Kim, and Jinsoo Hwang. 2021. A change of perceived innovativeness for contactless food delivery services using drones after the outbreak of COVID-19. International Journal of Hospitality Management 93: 102758. [Google Scholar] [CrossRef]
  36. Laili, Fitrotul, Wiwit Widyawati, and Dian Islami Prasetyaningrum. 2022. Experience Shocks of Strategic Food Consumers in Indonesia during COVID-19 Pandemic. Agricultural Socio-Economics Journal 22: 53–58. [Google Scholar] [CrossRef]
  37. Laksono, Fernando Augusta, and Yuliawati Yuliawati. 2021. Integration of Shallot Market in Johar Market and Central Java Peterongan Market. Jurnal Ekonomi Pertanian dan Agribisnis 5: 510–19. [Google Scholar] [CrossRef]
  38. Mardianto, M. Fariz Fadillah, Idrus Syahzaqi Sediono, Siti Amelia Dewi Safitri, and Nurul Afifah. 2020. Prediction of Indonesia strategic commodity prices during the COVID-19 pandemic based on a simultaneous comparison of Kernel and Fourier series estimator. Journal of Southwest Jiaotong University 55: 1–10. [Google Scholar] [CrossRef]
  39. Marusak, Amy, Narjes Sadeghiamirshahidi, Caroline C. Krejci, Anuj Mittal, Sue Beckwith, Jaime Cantu, Mike Morris, and Jason Grimm. 2021. Resilient regional food supply chains and rethinking the way forward: Key takeaways from the COVID-19 pandemic. Agricultural Systems 190: 103101. [Google Scholar] [CrossRef]
  40. Min, Shi, Cheng Xiang, and Xiao-heng Zhang. 2020. Impacts of the COVID-19 pandemic on consumers’ food safety knowledge and behavior in China. Journal of Integrative Agriculture 19: 2926–36. [Google Scholar] [CrossRef]
  41. Mogues, Tewodaj. 2020. Food Markets During COVID-19. In Fiscal Affairs. Special Series on COVID-19; Washington, DC: International Monetary Fund. Available online: https://www.imf.org/en/Publications/SPROLLs/covid19-special-notes (accessed on 11 July 2023).
  42. Mollenkopf, Diane A., Lucie K. Ozanne, and Hannah J. Stolze. 2021. A transformative supply chain response to COVID-19. Journal of Service Management 32: 190–202. [Google Scholar] [CrossRef]
  43. Moosavi, Javid, Amir M. Fathollahi-Fard, and Maxim A. Dulebenets. 2022. Supply chain disruption during the COVID-19 pandemic: Recognizing potential disruption management strategies. International Journal of Disaster Risk Reduction 75: 102983. [Google Scholar] [CrossRef]
  44. Mukhopadhyay, Boidurjo Rick. 2020. COVID-19 and the Indian farm sector: Ensuring everyone’s seat at the table. Agriculture and Human Values 3: 549–50. [Google Scholar] [CrossRef]
  45. Mukiibi, Edward. 2020. COVID-19 and the state of food security in Africa. Agriculture and Human Values 37: 627–28. [Google Scholar] [CrossRef]
  46. Narula, Sapna A. 2017. Revolutionizing Food Supply Chains of Asia through ICTs. In Sustainability Challenges in the Agrofood Sector. Edited by Rajeev Bhat. Hoboken: John Wiley & Sons, pp. 212–26. [Google Scholar]
  47. Nchanji, Eileen Bogweh, Cosmas Kweyu Lutomia, Rowland Chirwa, Noel Templer, Jean Claude Rubyogo, and Patricia Onyango. 2020. Immediate impacts of COVID-19 pandemic on bean value chain in selected countries in sub-Saharan Africa. Agricultural Systems 188: 103034. [Google Scholar] [CrossRef]
  48. Ng, Xiang Yi, and Ramieza Wahid. 2020. Cameron Highlands Farmers Dump Hundreds of Tonnes of Vegetables. Petaling Jaya: Malaysiakini. Available online: https://www.malaysiakini.com/news/516704 (accessed on 2 June 2022).
  49. Nurahmi, Sutraning, and Lili Zalizar. 2021. The impact of COVID-19 on chicken broiler farm business in Malang Regency. AMCA Journal of Science and Technology 1: 17–19. [Google Scholar] [CrossRef]
  50. Nurdjannah, Rahmawati, Yohannes Aris Purwanto, and Sutrisno Sutrisno. 2014. Pengaruh jenis kemasan dan penyimpanan dingin terhadap mutu fisik cabai merah (The effect of packaging type and low temperature storage on physical quality of red chilli). Jurnal Pascapanen 11: 19–29. [Google Scholar] [CrossRef]
  51. Nzeyimana, Jean Bosco, Joseph Butore, Libère Ndayishimiye, and Melchior Butoyi. 2022. Impact of COVID-19 on Livestock Production Chain and its Consequences on Food Security: A Review. Agricultural Science Digest-A Research Journal 42: 196–202. [Google Scholar] [CrossRef]
  52. Octaviani, Dita, Emelda Raudhati, and Armina Fariani. 2013. Penambahan Metionin dalam Ransum terhadap Kualitas Telur Ayam Arab Silver (Brakel kriel silver) Fase Produksi I. Jurnal Peternakan Sriwijaya 2. [Google Scholar] [CrossRef]
  53. Pan, Dan, Jiaqing Yang, Guzhen Zhou, and Fanbin Kong. 2020. The influence of COVID-19 on agricultural economy and emergency mitigation measures in China: A text mining analysis. PLoS ONE 15: e0241167. [Google Scholar] [CrossRef]
  54. Poudel, Padam Bahadur, Mukti Ram Poudel, Aasish Gautam, Samiksha Phuyal, Chiran Krishna Tiwari, Nisha Bashyal, and Shila Bashyal. 2020. COVID-19 and its Global Impact on Food and Agriculture. Journal of Biology and Today’s World 9: 221–25. [Google Scholar]
  55. Pu, Mingzhe, Xi Chen, and Yu Zhong. 2021. Overstocked Agricultural Produce and Emergency Supply System in the COVID-19 Pandemic: Responses from China. Foods 10: 3027. [Google Scholar] [CrossRef]
  56. Raj, Alok, Abheek Anjan Mukherjee, Ana Beatriz Lopes de Sousa Jabbour, and Samir K. Srivastava. 2022. Supply chain management during and post-COVID-19 pandemic: Mitigation strategies and practical lessons learned. Journal of Business Research 142: 1125–39. [Google Scholar] [CrossRef]
  57. Rifin, Amzul. 2022. Strengthening Supply Chain for Post COVID-19 Food Security: An Exploratory Research Review. Sustainability Science and Resources 3: 85–107. [Google Scholar] [CrossRef]
  58. Rozaki, Zuhud. 2020. COVID-19, agriculture, and food security in Indonesia. Reviews in Agricultural Science 8: 243–60. [Google Scholar] [CrossRef]
  59. Rozaki, Zuhud. 2021. Chapter Five—Food security challenges and opportunities in Indonesia post COVID-19. Advances in Food Security and Sustainability 6: 119–68. [Google Scholar] [CrossRef]
  60. Saptana, Saptana, Mohamad Maulana, and Rahayu Ningsih. 2015. Produksi dan Pemasaran Komoditas Broiler di Jawa Barat. Jurnal Manajemen & Agribisnis 14: 152–64. [Google Scholar] [CrossRef]
  61. Sativa, Mirza, Harianto Harianto, and Achmad Suryana. 2017. Impact of red chilli reference price policy in Indonesia. International Journal of Agriculture System 5: 120–39. [Google Scholar] [CrossRef]
  62. Setiaji, Bambang, Henri D. Wahyudi, and Ihwan Susila. 2017. Supply chain of the beef market in Indonesia. Expert Journal of Business and Management 5: 129–35. [Google Scholar]
  63. Sharma, Anup, Anmol Sharma, Dhanya Andrews, and Rosmin Roby. 2021. FMCG Sector Response to COVID-19: Impact on Supply Chain and Logistics. International Journal of Scientific Research and Management 9: 2372–77. [Google Scholar] [CrossRef]
  64. Siche, Raúl. 2020. What is the impact of COVID19 disease on agriculture? Scientia Agropecuaria 11: 3–6. [Google Scholar] [CrossRef]
  65. Stephens, Emma C., Guillaume Martin, Mark van Wijk, Jagadish Timsina, and Val Snow. 2020. Editorial: Impacts of COVID-19 on agricultural and food systems worldwide and on progress to the sustainable development goals. Agricultural Systems 183: 102873. [Google Scholar] [CrossRef]
  66. Surni, Surni, Doppy Roy Nendissa, Muhaimin Abdul Wahib, Maria Haryulin Astuti, Putu Arimbawa, Miar Miar, Maximilian M. J. Kapa, and Evi Feronika Elbaar. 2020. Socio-economic impact of the COVID-19 pandemic: Empirical study on the supply of chicken meat in Indonesia. AIMS Agriculture and Food 6: 65–81. [Google Scholar] [CrossRef]
  67. Tesfa, Tiru, Kebede Woldetsadik, and Wondimu Bayu. 2015. Shallot yield, quality and shelf-life as affected by Nitrogen fertilizer. International Journal of Vegetable Science 21: 454–66. [Google Scholar] [CrossRef]
  68. Thilmany, Dawn, Elizabeth Canales, Sarah A. Low, and Kathryn Boys. 2021. Local Food Supply Chain Dynamics and Resilience during COVID-19. Applied Economic Perspectives and Policy 43: 86–104. [Google Scholar] [CrossRef]
  69. Triana, Lora, Mahdi Mahdi, and Rafnel Azhari. 2021. Impact of COVID-19 outbreak on horticultural farming in Tanah Datar Regency of West Sumatra Province, Indonesia. IOP Conf. Series: Earth and Environmental Science 741: 012075. [Google Scholar] [CrossRef]
  70. Ulfa, Afilia, Agus Nugroho, Tamara Husna Pospos, Glennice Suherman, and Nadlia Ariyati. 2021. Global pandemic and agriculture in Aceh Province, Indonesia: An initial impact. IOP Conference Series: Earth and Environmental Science 667: 012099. [Google Scholar] [CrossRef]
  71. Varshney, Deepak, Devesh Roy, and J. V. Meenakshi. 2020. Impact of COVID-19 on agricultural markets: Assessing the roles of commodity characteristics, disease caseload and market reforms. Indian Economic Review 55: 83–103. [Google Scholar] [CrossRef]
  72. Vercammen, James. 2020. Information-rich wheat markets in the early days of COVID-19. Canadian Journal of Agricultural Economics/Revue Canadienne d’Agroeconomie 68: 177–84. [Google Scholar] [CrossRef]
  73. Virmond, Elaine, Waldir Albrecht, Christine A. Althoff, Silvia L. F. Andersen, Rennio F. de Sena, Regina F. P. M. Moreira, and Humberto J. José. 2021. Gaseous emissions from co-combustion of biosolids from the meat processing industry with wood. Environmental Progress & Sustainable Energy 40: e13633. [Google Scholar] [CrossRef]
  74. Weersink, Alfons, Mike von Massow, and Brendan McDougall. 2020. Economic thoughts on the potential implications of COVID-19 on the Canadian dairy and poultry sectors. Canadian Journal of Agricultural Economics/Revue Canadienne d’Agroeconomie 68: 195–200. [Google Scholar] [CrossRef]
  75. Weersink, Alfons, Mike Von Massow, Nicholas Bannon, Jennifer Ifft, Josh Maples, Ken McEwan, Melissa G. S. McKendree, Charles Nicholson, Andrew Novakovic, Anusuya Rangarajan, and et al. 2021. COVID-19 and the Agri-Food system in the United States and Canada. Agricultural Systems 188: 103039. [Google Scholar] [CrossRef]
  76. World Food Programme. 2020. Indonesia. Food Price Update—March 2020. Available online: https://docs.wfp.org/api/documents/WFP-0000113732/download/ (accessed on 17 July 2023).
  77. Yaffe-Bellany, David, and Michael Corkery. 2020. Dumped Milk, Smashed Eggs, Plowed Vegetables: Food Waste of the Pandemic. New York Times. April 12. Available online: https://www.nytimes.com/2020/04/11/business/coronavirus-destroying-food.html (accessed on 17 July 2023).
  78. Younis, Hassan, Malek Alsharairi, Hammad Younes, and Balan Sundarakani. 2023. The impact of COVID-19 on supply chains: Systematic review and future research directions. Operational Research 23: 48. [Google Scholar] [CrossRef]
  79. Yunita, Ika, and Sawarni Hasibuan. 2021. The sustainability challenges of the poultry industry during pandemic COVID-19. IOP Conference Series: Earth and Environmental Science 733: 012007. [Google Scholar] [CrossRef]
  80. Zhang, Tao, Qunfu Wu, and Zhigang Zhang. 2020. Probable Pangolin Origin of SARS-CoV-2 Associated with the COVID-19 Outbreak. Current Biology 30: 1346–51. [Google Scholar] [CrossRef]
  81. Zhou, Jie-hong, Fei Han, Kai Li, and Yu Wang. 2020. Vegetable production under COVID-19 pandemic in China: An analysis based on the data of 526 households. Journal of Integrative Agriculture 19: 2854–65. [Google Scholar] [CrossRef]
  82. Zulmaneri, Manir, Afdha Yulistia, and Adiarni Nunuk. 2021. Analisis Risiko Rantai Pasok Daging Sapi di Masa Pandemi COVID-19 Studi Kasus: DKI Jakarta (Risk Analysis of the Beef Supply Chain during the COVID-19 Pandemic Case Study: DKI Jakarta). Sharia Agribusiness Journal 1: 71–98. [Google Scholar] [CrossRef]
Figure 1. Map of margin changes for medium rice commodity marketing at the provincial level (source: Indonesian Map and Statistics Center 2021, analysed).
Economies 11 00292 g001
Figure 2. Map of changes in marketing margin of shallots at the provincial level (source: Indonesian Map and Statistics Center 2021, analysed).
Economies 11 00292 g002
Figure 3. Map of margin changes for the red chilli commodity market at the provincial level (source: Indonesian Map and Statistics Center 2021, analysed).
Economies 11 00292 g003
Figure 4. Map of changes in the beef commodity marketing margin at the provincial level (source: Indonesian Map and Statistics Center 2021, analysed).
Economies 11 00292 g004
Figure 5. Map of changes in marketing margins for broiler chicken at the provincial level (source: Indonesian Map and Statistics Center 2021, analysed).
Economies 11 00292 g005
Figure 6. Map of margin changes in the marketing of chicken eggs at the provincial level (source: Indonesian Map and Statistics Center 2021, analysed).
Economies 11 00292 g006
Figure 7. Map of margin changes in the sugar commodity market at the provincial level (source: Indonesian Map and Statistics Center 2021, analysed).
Economies 11 00292 g007
Figure 8. Map of changes in the marketing margin of cooking oil commodities at the provincial level (source: Indonesian Map and Statistics Center 2021, analysed).
Economies 11 00292 g008
Table 1. Characteristics of agricultural commodities selected in this study.
CommodityProduct CharacteristicsGeneral Pattern of DistributionMarket Characteristics
Medium riceIt can be stored for years (Pahulu et al. 2007).Manufacturers --> distributors (1 … n) --> retailers --> final consumersAt the initial level (farmers to rice mills) the market is oligopsony, and after that, the market is more oligopoly (InterCAFE and LPPM 2018).
ShallotsIt can be stored for about 1 month indoors (Tesfa et al. 2015).Farmers --> collectors (1 … n) --> retailers --> final consumersFrom the market at the farmer level to wholesalers, the market has an oligopsony structure but becomes an oligopoly at the wholesale level to the retail level (InterCAFE and LPPM 2018).
Red chilli pepperProducts are easily damaged from harvest, sorting, and storage until they are in the hands of consumers (Nurdjannah et al. 2014).Farmers --> wholesalers (1 … n) --> retailers --> final consumersFrom farmers to wholesalers, the market is oligopsony, and from wholesalers to retail levels, it has an oligopoly structure (InterCAFE and LPPM 2018; (Sativa et al. 2017).
BeefIt can be stored in the freezer at a temperature below −18 degrees Celsius for 6–12 months.Producer line: producer --> wholesaler --> retailer --> final consumer
Importer line: importer --> distributor (1 … n) -- -> retailer --> final consumer
It is a tight oligopoly market (Setiaji et al. 2017).
Chicken meatWhole raw chicken meat that is frozen, will last up to one year.Producers --> collectors (1 … n) --> retailers --> final consumersAn oligopsonistic market structure where prices are determined more by collectors/brokers (Saptana et al. 2015).
Chicken eggsEggs can last up to 4 to 5 weeks if stored in the refrigerator. On the other hand, when stored indoors, eggs will rot faster and can only last up to 3 weeks.Producers --> collectors (1 … n) --> retailers --> final consumersIt has an oligopoly market and perfect competition due to the homogeneous nature and characteristics of the commodity and it is a mass commodity (Octaviani et al. 2013).
SugarProducts from the sugarcane raw material processing industry, and have a relatively long shelf life.Manufacturer --> distributor --> wholesaler --> retailer --> final consumerThe sale of sugar in the early stages of the marketing chain is carried out using an auction system and is controlled by SOEs. Along the market chain, it was found that seepage of refined crystal sugar (imported sugar) into the local sugar market was found (InterCAFE and LPPM 2018).
Cooking oilPalm oil processing industry products have a relatively long shelf life.Manufacturers --> distributors --> retailers --> end consumersThe market structure is oligopsony in the early stages and is structured as oligopoly in the later stages (InterCAFE and LPPM 2018).
Table 2. Trade and transport margin data (MPP) of the main agricultural commodities for each province in Indonesia (parts 1 and 2).
NOProvinceRiceSugarCooking OilChicken Eggs
20192020Change20192020Change20192020Change20192020Change
1Aceh5.9113.17.1917.6337.4319.822.718−4.712.0315.563.53
2Sumatera Utara20.9715.13−5.8412.3118.356.0421.9812.13−9.8523.9820.32−3.66
3Sumatera Barat12.9915.32.3118.4737.8319.3626.7710.43−16.3438.5119.57−18.94
4Riau18.1420.972.8327.5517.18−10.3729.0122.03−6.9852.8716.45−36.42
5Jambi23.129.53−13.5926.8818.24−8.6416.9717.390.429.629.05−0.57
6Sumatera Selatan11.6820.919.239.719.429.7218.8225.086.2618.4412.34−6.1
7Bengkulu4.9713.498.5227.5218.22−9.328.3621.95−6.4133.935.5−28.43
8Lampung7.1314.457.3220.2912.53−7.7622.8613.06−9.823.4519.34−4.11
9Kep. Bangka Belitung22.7420.04−2.723.1319.16−3.9726.2214.3−11.9224.628.32−16.3
10Kep. Riau29.0327.12−1.9140.6831.06−9.6233.4834.180.723.696.39−17.3
11Dki Jakarta37.6720.01−17.6625.3531.826.4714.7317.622.8921.4118.36−3.05
12Jawa Barat10.6417.867.2222.9930.67.6135.121.64−13.4622.6322.34−0.29
13Jawa Tengah9.3219.29.8810.7915.244.4514.6815.771.0910.9116.15.19
14Di Yogyakarta14.8217.782.9619.3812.02−7.3615.5513.96−1.5937.5510.72−26.83
15Jawa Timur34.1519.22−14.9319.318.09−1.2125.5916.39−9.210.2116.175.96
16Banten12.429.12−3.334.8315.49−19.3437.3419.06−18.2821.0719.92−1.15
17Bali16.0615.74−0.3225.4517.86−7.5935.617.65−17.9536.3320.44−15.89
18Nusa Tenggara Barat4.0115.1411.1315.530.6215.127.9115.27.2925.0525.050
19Nusa Tenggara Timur23.5111.85−11.6625.5145.4519.9418.7126.317.621.8938.9417.05
20Kalimantan Barat14.1711.22−2.9519.0145.7726.7630.0526.3−3.7520.0212.5−7.52
21Kalimantan Tengah14.2117.062.8531.8616.15−15.7112.6923.6710.9828.9215.78−13.14
22Kalimantan Selatan13.6311.99−1.6419.0716.33−2.7430.1318.47−11.6625.9117.59−8.32
23Kalimantan Timur10.7611.120.3620.6117.32−3.2913.923.779.8731.3116.31−15
24Kalimantan Utara24.2619.77−4.4916.2717.341.0727.8520.33−7.5211.5927.7116.12
25Sulawesi Utara14.5218.984.4621.4645.1223.6622.9328.295.367.0719.1512.08
26Sulawesi Tengah8.696.09−2.620.4436.4115.9743.8627.57−16.2923.8718.74−5.13
27Sulawesi Selatan21.6218.62−316.5324.858.3220.524.654.1512.7614.561.8
28Sulawesi Tenggara9.5112.132.6240.2629.49−10.7743.8331.33−12.513.8719.96.03
29Gorontalo18.1718.870.715.0534.319.2533.2425.42−7.8217.0523.276.22
30Sulawesi Barat22.2315.82−6.4111.1225.5214.420.6522.852.228.1614.86−13.3
31Maluku32.7126.47−6.2457.4931.5−25.9942.9518.39−24.5632.3742.9910.62
32Maluku Utara19.0325.46.3743.5823.4−20.1829.9130.860.959.6926.6917
33Papua Barat19.9124.754.8440.4629.62−10.8424.4833.929.4425.3130.014.7
34Papua22.2325.132.931.4436.55.0639.7637.26−2.51518.133.13
35Indonesia22.3421.47−0.8733.1825.86−7.3217.0517.410.3613.0920.197.1
NOProvinceBeefShallotRed Chilli PepperChicken Beef
20192020Change20192020Change20192020Change20192020Change
1Aceh14.18 7.24−6.9431.2969.5938.353.6683.9930.3325.2345.5220.29
2Sumatera Utara18.3721.693.3250.1746.02−4.1526.1947.7521.5623.0420.5−2.54
3Sumatera Barat18.0116.05−1.9617.4641.0623.661.8449.98−11.8633.5934.951.36
4Riau11.976.53−5.4436.4239.773.3549.1157.148.0343.5223.46−20.06
5Jambi8.7220.4811.7646.3316.34−29.9952.2948.28−4.014.8939.1334.24
6Sumatera Selatan24.4435.7511.3138.936.27−2.6356.7461.064.3219.4617.6−1.86
7Bengkulu56.5465.348.841.1637.46−3.781.4445.42−36.0280.263.76−16.44
8Lampung51.524.41−27.0960.9534.53−26.4218.331.112.861.1858.89−2.29
9Kep. Bangka Belitung26.2847.7721.4929.1760.4331.2666.2657.43−8.8326.9936.759.76
10Kep. Riau20.722.982.2835.1726.81−8.3642.2171.4129.273.249.59−23.61
11Dki Jakarta23.441.7118.3126.8241.1414.3225.6977.8452.1519.2343.5524.32
12Jawa Barat15.7823.47.6246.0431.37−14.6782.3180.73−1.5824.5124.770.26
13Jawa Tengah13.7716.863.0944.7923.85−20.9461.0134.25−26.7633.6721.57−12.1
14Di Yogyakarta22.6320.25−2.3860.5327.97−32.5646.7242.48−4.2422.0633.3711.31
15Jawa Timur16.0527.9611.9139.76100.5760.8156.5256.09−0.4356.4242.11−14.31
16Banten15.423.027.6248.9428.35−20.5927.838.5610.7640.7658.9918.23
17Bali14.829.2614.4633.0925.68−7.4141.8216.53−25.2932.3323.02−9.31
18Nusa Tenggara Barat7.9416.38.3680.8322.85−57.9846.4835.31−11.1738.529.16−9.34
19Nusa Tenggara Timur15.325.039.7327.2763.336.0333.8952.7218.8343.7238.63−5.09
20Kalimantan Barat21.3636.0814.7262.4650.4−12.0657.947.9−1057.4429.37−28.07
21Kalimantan Tengah21.9247.0225.148.7857.478.69106.2198.69−7.5217.2221.274.05
22Kalimantan Selatan19.876.8−13.0759.4144.68−14.7356.746.62−10.0817.2817.910.63
23Kalimantan Timur14.2249.935.6841.231.65−9.5550.0477.2127.1757.8740.3−17.57
24Kalimantan Utara2038.3918.3987.8108.4420.6461.9563.111.1664.9882.9617.98
25Sulawesi Utara16.5723.126.5539.8983.4943.611.0169.0258.0173.8860.28−13.6
26Sulawesi Tengah11.5440.2628.726088.928.991.8627.78−64.0837.2729.8−7.47
27Sulawesi Selatan12.049.4−2.6460.6229.44−31.1864.7643.89−20.8735.225.3−9.9
28Sulawesi Tenggara17.3713.72−3.6567.48124.957.4261.9688.2626.337.0536.75−0.3
29Gorontalo13.5550.2936.7455.4998.8243.3338.0947.489.3922.2243.421.18
30Sulawesi Barat21.9931.429.4353.2561.167.9144.4428.77−15.6743.249.876.67
31Maluku16.2117.120.9178.0662.72−15.3426.2729.93.6327.4360.0332.6
32Maluku Utara10.9521.1510.259.63105.9146.2898.5281.31−17.2155.6330.42−25.21
33Papua Barat37.2711−26.2786.44134.7848.34110.9141.09−69.8268.8734.55−34.32
34Papua19.4624.525.0668.1430.09−38.0556.0834.47−21.6155.9236.38−19.54
35Indonesia34.1141.046.9335.7338.012.2843.0961.3118.2224.7225.530.81
Source: 2022 analysis results.
Disclaimer/Publisher’s Note: The statements, opinions and data contained in all publications are solely those of the individual author(s) and contributor(s) and not of MDPI and/or the editor(s). MDPI and/or the editor(s) disclaim responsibility for any injury to people or property resulting from any ideas, methods, instructions or products referred to in the content.

