Article

Border Proximity, Ports, and Railways: Analyzing Their Impact on County-Level Economic Dynamics in Hungary, 2001–2020

1
Heat and Power Department, Samara State Technical University, 443100 Samara, Russia
2
Institute of National and World Economy, Samara State University of Economics, 443090 Samara, Russia
*
Author to whom correspondence should be addressed.
Economies 2023, 11(11), 278; https://doi.org/10.3390/economies11110278
Submission received: 15 September 2023 / Revised: 17 October 2023 / Accepted: 9 November 2023 / Published: 13 November 2023
(This article belongs to the Special Issue Regional Development: Opportunities and Constraints)

Abstract

:
In this research, our primary objective is to dissect the influence of specific locational elements—proximity to international borders, substantial ports, and significant railway junctions—on the economic vitality of Hungary’s counties from 2001 to 2020. The aim is to reveal how these factors individually contribute to economic disparities and to demonstrate their compounded effect on regional prosperity. This analysis is particularly timely and pertinent as regional inequalities are becoming more pronounced globally, making understanding such disparities crucial for effective policy formulation and regional planning. Utilizing GDP per capita as a fundamental indicator of economic health, we meticulously categorized counties, revealing a clear correlation between these locational advantages and economic performance. We innovatively employed Python to script a unique code, creating a matrix that enriches the presentation of our results, thereby facilitating a more nuanced understanding of these correlations. Our findings are significant in the current socio-economic climate, highlighting the need for tailored strategies considering unique regional attributes. This study is instrumental for policymakers and stakeholders in formulating informed, targeted strategies to harness these locational advantages, fostering balanced development, and narrowing the economic divide within the nation. The actuality of our research lies in its immediate relevance, offering insights critical to current discussions and decisions in regional development planning.

1. Introduction

In an era characterized by intricate interconnections and global dynamics, the complexities of regional economic development have taken center stage in both research and policy discourse. Our analysis will focus on Hungarian counties as the geographical unit of interest, corresponding to the Nomenclature of Territorial Units for Statistics—Level 3 (NUTS-3), a sub-national administrative division. By meticulously dissecting the principal factors that exert influence, we embark on a journey to unravel the intricate tapestry that defines economic trajectories within these regions. Through this exploration, we aim to cultivate a deeper comprehension of the intricate forces at play, shedding light on the diverse mechanisms steering the economic destinies of individual subnational entities.
While numerous factors collectively shape the economic development of subnational regions, it is essential to isolate and study individual influences. In this article, the authors focus on examining the impact of specific factors on the economic growth rate of NUTS-3 regions. These factors include the proximity to international borders and the presence of significant ports or railway networks. Although various factors, such as skilled labor availability, natural resources, government policies, investment incentives, and the presence of educational institutions, are pivotal, our study concentrates on disentangling the influence of these particular elements. By doing so, we aim to gain a deeper understanding of how these factors uniquely contribute to the economic development of subnational areas. The complex interplay of these elements ultimately determines the level and pace of economic growth in these regions.
In light of the increasing importance of the chosen factors and their impact, it is vital to consider the evolving logistics landscape in our modern world. The COVID-19 pandemic has accelerated the integration of modern logistics technologies, such as IT, telecommunications, and automatic contactless delivery (Börjesson and Eliasson 2019). Continuous improvement in the efficiency of the logistics chain that combines the production, transportation, and storage of goods, is necessary to maintain a place in the world market (Rymarczyk 2020). The development of logistics infrastructure plays a critical role in facilitating the movement of goods and materials within a region. This can provide numerous benefits for local businesses, including accessing imported resources and exporting their products. Access to foreign markets seriously impacts domestic economic development (Di Berardino et al. 2022). Foreign trade activity develops local markets both due to the emergence of new goods and technologies and by increasing the technological level of local enterprises (Elekes and Lengyel 2020).
In this paper, using the example of Hungary, we will examine such factors as the presence of major railway and water routes and the proximity to international borders. The main object of our research is the Hungarian subnational regions—the counties. The Hungarian economy is significantly oriented towards the markets of more developed partners in the European Union. Various researchers have repeatedly noted that Hungary is significantly increasing its foreign trade potential (Vámos 2022). The successful inclusion of Hungary in the pan-European markets has become a key driver of its economic success in the post-socialist period (Radosevic 2002; Resmini 2010). In their economic development, Hungary’s border regions largely depend on efficiently delivering goods to the more capacious markets of developed neighbors. While various factors influence regional development, this paper presents a focused investigation into the impact of specific factors, such as proximity to borders and the presence of port and railway infrastructure, on the economic development of Hungarian counties.
The central hypotheses of this article are formulated as follows:
Hypothesis 1. 
Counties with significant major railway or water routes exhibit superior economic development and display notably accelerated growth in GDP per capita compared with counties lacking such transportation networks.
Hypothesis 2. 
Counties close to international borders exhibit enhanced economic development and manifest swifter growth rates in GDP per capita compared with counties located farther away from these borders.
Hypothesis 3. 
Counties positioned at a considerable distance from international borders and devoid of substantial railway or waterway infrastructure experience relatively lower levels of economic development and present slower growth patterns in GDP per capita than counties benefiting from closer border proximity and robust transportation networks.
In this paper, we acknowledge the multitude of factors that influence regional development. However, our research takes a specific and focused approach by examining the influence of proximity to international borders and the presence of major port and railway infrastructure on the change and growth rate of GDP per capita in Hungary’s NUTS-3 regions. We recognize that regional disparities are multifaceted and influenced by a wide range of factors, from population distribution to economic activities. While our analysis provides valuable insights into the relationship between certain transportation-related factors and economic development, it is just one piece of the larger puzzle of Hungary’s regional dynamics. Our methodology will help us gain a better understanding of how these specific factors contribute to economic growth at the regional level, even though it may not comprehensively address all aspects of regional development. We aim to contribute to the empirical basis for understanding these dynamics, with the recognition that policies may not be able to alter Hungary’s political map but can benefit from a more nuanced understanding of regional economic drivers.
The rest of the paper is organized as follows: Section 2 presents the theoretical framework and the literature review. Section 3 presents the methodology. The results are presented in Section 4, and are discussed in Section 5. In Section 6, we draw conclusions.

2. Theoretical Framework and Literature Review

The foundational theories guiding this article are deeply rooted in the principles of Regional Economic Development, New Economic Geography (NEG), Endogenous Growth Theory, Infrastructure-Based Development Theory, and Spatial Interaction Theory. These theories collectively frame the development of our central hypotheses:
Hypothesis 1. 
Drawing from Infrastructure-Based Development Theory, we posit that counties with substantial railway or water routes are likely to demonstrate superior economic development, exhibiting accelerated growth in GDP per capita. This hypothesis aligns with the theory’s assertion that robust infrastructure is a critical driver of economic progress. Calderon, C. and Servén, L. examined the impact of infrastructure development on economic growth and income distribution using a large dataset of countries (Calderon and Servén 2004). Esfahani, H. and Ramírez, M. explored the interplay between institutions, infrastructure, and economic growth, arguing that the quality of institutions can significantly influence the productivity of infrastructure investments (Esfahani and Ramírez 2003).
Hypothesis 2. 
Informed by New Economic Geography and Spatial Interaction Theory principles, we hypothesize that counties proximate to international borders will experience enhanced economic development, reflected in swifter GDP per capita growth rates. These theories support the idea that geographical positioning relative to borders can significantly impact economic activities and growth. Anderson, J. and van Wincoop, E. provided insights into how borders significantly affect trade patterns, emphasizing the role of geographical positioning in economic activities (Anderson and Wincoop 2003). Fujita, M., and Thisse, J. offered a comprehensive view of the spatial economy, emphasizing how location relative to borders and centers of economic mass can impact economic activities (Fujita and Thisse 1996).
Hypothesis 3. 
Synthesizing insights from Regional Economic Development Theory and NEG, we propose that counties far from international borders and lacking significant railway or waterway infrastructure will experience lower economic development levels and slower GDP per capita growth. This hypothesis underscores the role of spatial disparities and infrastructure in regional economic outcomes. Stimson R. et al. analyzed regional growth and local development theories, exploring how economic actors choose their locations and the impact of these decisions on regional economic development (Stimson et al. 2006). Pinder, D. provided a survey of major theories of regional economic development, guiding strategic planning and policy-making processes in the European Union (Pinder 2017). Krugman, P. launched the foundations of NEG theory, explaining the formation of highly concentrated industrial hubs and the impacts of transportation costs and economies of scale on this process (Krugman 1991). Baldwin, R. et al. discussed NEG in the context of globalization, analyzing how it impacts regional economies and shapes global economic geography (Baldwin et al. 2001).
Today, more than 70% of traded goods traverse global supply chains (Zábojník et al. 2020). Ensuring competitiveness in the international markets is imperative for fostering economic growth. Paul Krugman emphasized the necessity for individual countries to exhibit competitiveness in foreign markets, drawing a parallel between competition among countries and that among corporations (Krugman 1996). Venturing into foreign markets imposes additional requisites on exporters, simultaneously leading to enhanced efficiency gains. Battisti et al. postulated that firms engaged in international markets typically demonstrate higher productivity levels than their domestic counterparts (Battisti et al. 2021). The success of penetrating global markets depends significantly on the adaptability of the domestic market to external demands (Wang et al. 2022).
Even within the scope of a unified market like the European Union, competition prevails among individual countries vying for sales opportunities. Lomachynska I. et al. dissected the influence of well-developed European markets on the competitive landscape of new EU member states (Lomachynska and Podgorna 2018). Jarosz-Angowska A. et al. highlighted that integrating new EU members into the single European market subjects them to intense competitive pressures from fellow Community members and third-party nations (Jarosz-Angowska et al. 2022). Competition is observed both in individual enterprises and across industries (Grzegorzewska and Stasiak-Betlejewska 2021). Research has extensively explored the experience of Eastern European countries in the broader pan-European market. Lomachynska et al. scrutinized the impact of foreign direct investment on the export dynamics of Hungary, Poland, Slovakia, and the Czech Republic (Lomachynska et al. 2020). Pawera et al. delved into the nuances of effective collaboration between Slovakia and Austria (Pawera et al. 2020).
A pivotal determinant influencing successful forays into foreign markets is the status of the logistics infrastructure. The intricacies of global logistics infrastructure development and its implications for national progress were explored by Šakalys and Batarlienė (2017) and Seo et al. (2017). The imperative to modernize logistics infrastructure for international trade was underscored in works by Otsuka et al. (2017), Liao (2017), and earlier contributions by the authors themselves (Fedorenko et al. 2021; Fedorenko and Khmeleva 2021).
The impact of railway infrastructure on the European economy has been scrutinized in various contemporary articles. Schumann T. et al. analyzed Europe’s high-speed freight train initiative (Schumann et al. 2018). Bukvic et al. investigated the application of game theory for optimizing transportation costs among Eastern European countries (Bukvić et al. 2021). Minarik M. et al. evidenced the positive influence of importing transport services from EU countries to Slovakia, Czechia, and Poland (Minárik et al. 2022). Kalman B. et al. explored the interplay between competitiveness and logistics performance within the Visegrád Group (Kálmán and Tóth 2021). Additionally, the logistics infrastructure of Visegrad Group countries has been analyzed by other researchers (Tóth 2019; Włodarczyk and Mesjasz-Lech 2019).
Distinct attention has been directed toward the economic development of Hungary and its potential integration into the global economic framework by scholars such as Nagy et al. (2018) and Oláh et al. (2017a, 2017b), among others. Kano et al. analyzed the intricacies of Hungary’s regional inclusion in the pan-European market, albeit focusing on the impact of international corporations rather than the regions themselves (Szakálné Kanó et al. 2019).
We acknowledge the complex tapestry of factors that mold regional development. However, our research narrows its lens to scrutinize the role of international border proximity and the availability of major port and railway infrastructure in modulating GDP per capita changes and growth rates across Hungary’s NUTS-3 regions. Regional disparities result from a confluence of variables, from demographic compositions to the spectrum of economic activities present.
Although our analysis offers critical insights into how transport-centric factors correlate with economic development, it represents a singular facet in the multifaceted realm of Hungary’s regional economic dynamics. Our methodological approach, fortified by data-driven decision making principles, seeks to unravel the contributions of these targeted factors to regional economic development, albeit without capturing every element influencing regional development comprehensively.
Despite the comprehensive body of literature delving into various aspects of economic competitiveness, international market entry, logistics infrastructure, and their interplay, specific questions warrant further investigation. While existing research has shed light on the impact of transportation networks, proximity to international borders, and the role of logistics infrastructure, some nuances require deeper exploration. Furthermore, the complex relationships between competitiveness, economic growth, and the specific contexts of subnational regions like Hungarian counties, call for a more targeted inquiry. As a result, this paper aims to contribute to the existing knowledge by focusing on the intricate connections between major transportation routes, border proximity, and economic development within Hungarian counties. By addressing these gaps and employing a comprehensive analytical approach, this study seeks to provide a more nuanced understanding of the factors influencing subnational economic growth and to offer insights that can guide policy decisions and future research endeavors.

3. Methodology

We examined the statistical data of Hungary for the period from 2000 to 2020. The primary sources are presented in Table 1.
Our study is dedicated to specific Hungarian counties that markedly differ in their levels of economic development. Figure 1 presents a map of Hungary where the color illustrates the disparity in GDP levels across the counties as of 2020.
Hungary’s economy exhibits an extremely high concentration of economic activity within the capital area. Such a situation is common among many small countries and can significantly distort the influence of other factors. In this paper, we explore two key economic indicators, Gross Domestic Product (GDP) and GDP per capita, as central components of our analysis. The dataset employed in this study encompasses annual GDP values for a selection of counties spanning the years from 2000 to 2020, with each county’s GDP measured in millions of forints. GDP represents the total economic output of a region and serves as a fundamental measure of economic activity. In addition to GDP, we also utilize GDP per capita, which is obtained by dividing the GDP by the population of each county. GDP per capita, in contrast to GDP, provides a more nuanced perspective by reflecting the economic output on a per-person basis, allowing for a better understanding of the standard of living and economic well-being within a region. These two indicators offer a comprehensive view of the economic dynamics within the counties under study and form the basis for our subsequent analysis. To quantify each county’s economic performance, the GDP per capita growth rate from 2000 to 2020 was computed. The growth rate, denoted as G R i , Y t , was calculated using the following formula:
G R i , Y t = C i C i ( Y t 1 ) C i ( Y t 1 ) × 100
To assess the economic changes experienced by each county, the change in GDP per capita between 2000 and 2020 was determined. The GDP per capita change, denoted as G D P i , was computed using the following formula:
G D P i = G D P 2020 , i G D P 2000 , i
The average GDP per capita change ( G D P A v g ) across all counties and the average growth rate ( G R A v g ) were calculated to provide a reference point for comparison. The formulas for these averages are as follows:
G D P A v g = 1 N i = 1 N G D P i
G R A v g = G D P A v g ,   2020 G D P A v g , 2000 G D P A v g , 2000
A matrix plot was generated to visually represent the relationships between growth rates and GDP per capita changes for each county. The x-axis of the matrix plot represents the growth rate, while the y-axis represents the GDP per capita change. Additionally, the average GDP per capita change and average growth rate are indicated as dashed lines on the matrix plot. An empty matrix that we use to visualize the results of calculations is shown in Figure 2.
According to our hypotheses, we assume that counties without a border, railroad, or port infrastructure will demonstrate the least GDP per capita change and the slowest economic growth. Furthermore, as we assume that both geographical position and railway or water routes have a positive influence, we expect the counties with at least two of these factors, and especially combining all three of them, to demonstrate the best results.
We expect counties like Veszprem, Vas, Heves, and Jasz-Nagykun-Szolnok to appear in zone A of the proposed matrix. Komarom-Esztergom, Gyor-Moson-Sopron, Somogy, Hajdu-Bihar, Szabolcs-Szatmar-Bereg, Bacs-Kiskun, and Csongrad-Csanad, are expected to be in zone D.
As the GDP per capita level varies throughout the country, the absolute change will depend on the previous year’s parameters. We suppose that the growth rate is a more critical parameter as it shows future development possibilities. We assume that during the growth periods, counties with better connections to the world market will demonstrate higher growth rates. To measure it, we calculate the growth rate for each county and compare it with the total growth rate of Hungary. We assume that with 20 years of data, we should find some patterns and see that counties with better objective obstacles more frequently have a higher growth rate than the whole country. To do this, we perform several steps:
  • Calculate the average GDP per capita for all counties for each year;
  • Calculate the growth rate for each county for every year, comparing GDP per capita at the current year with the previous;
  • Calculate the average growth rate for every year, comparing the average GDP per capita at the current year with the previous;
  • Compare the growth rate of each county with the average growth rate in the same years;
  • Calculate the number of years when the county’s growth rate was higher than the average growth rate in the same year;
  • Rank the counties according to the calculations.
Formally,
  • Calculate the average GDP ( A v g G D P Y t ) for year Yt as:
    A v g G D P Y t = 1 N 1 N C i
  • where:
  • N is the total number of counties;
  • Ci is the GDP per capita of the county I;
  • Yt is the year t, where t ranges from 2000 to 2020.
2.
Calculate the growth rate ( G R i , Y t ) of county i for year Yt as:
G R i , Y t = C i C i ( Y t 1 ) C i ( Y t 1 ) × 100
3.
Calculate the total growth rate ( T o t a l G R Y t ) for year Yt as:
T o t a l G R Y t = 1 N ( C i C i ( Y t 1 ) ) 1 N C i ( Y t 1 ) × 100
4.
Compare the growth rate of county i with the total growth rate for year Yt:
GR i , Y t > TotalGR Y t : 1 GR i , Y t TotalGR Y t : 0
5.
Calculate the number of years ( H i g h e r Y e a r s i ) when the growth rate of county i was higher than the total growth rate:
H i g h e r Y e a r s i = t = 2001 2020 C o m p a r i s o n i , Y t
6.
Rank the counties based on H i g h e r Y e a r s i , where a higher value indicates a higher rank.
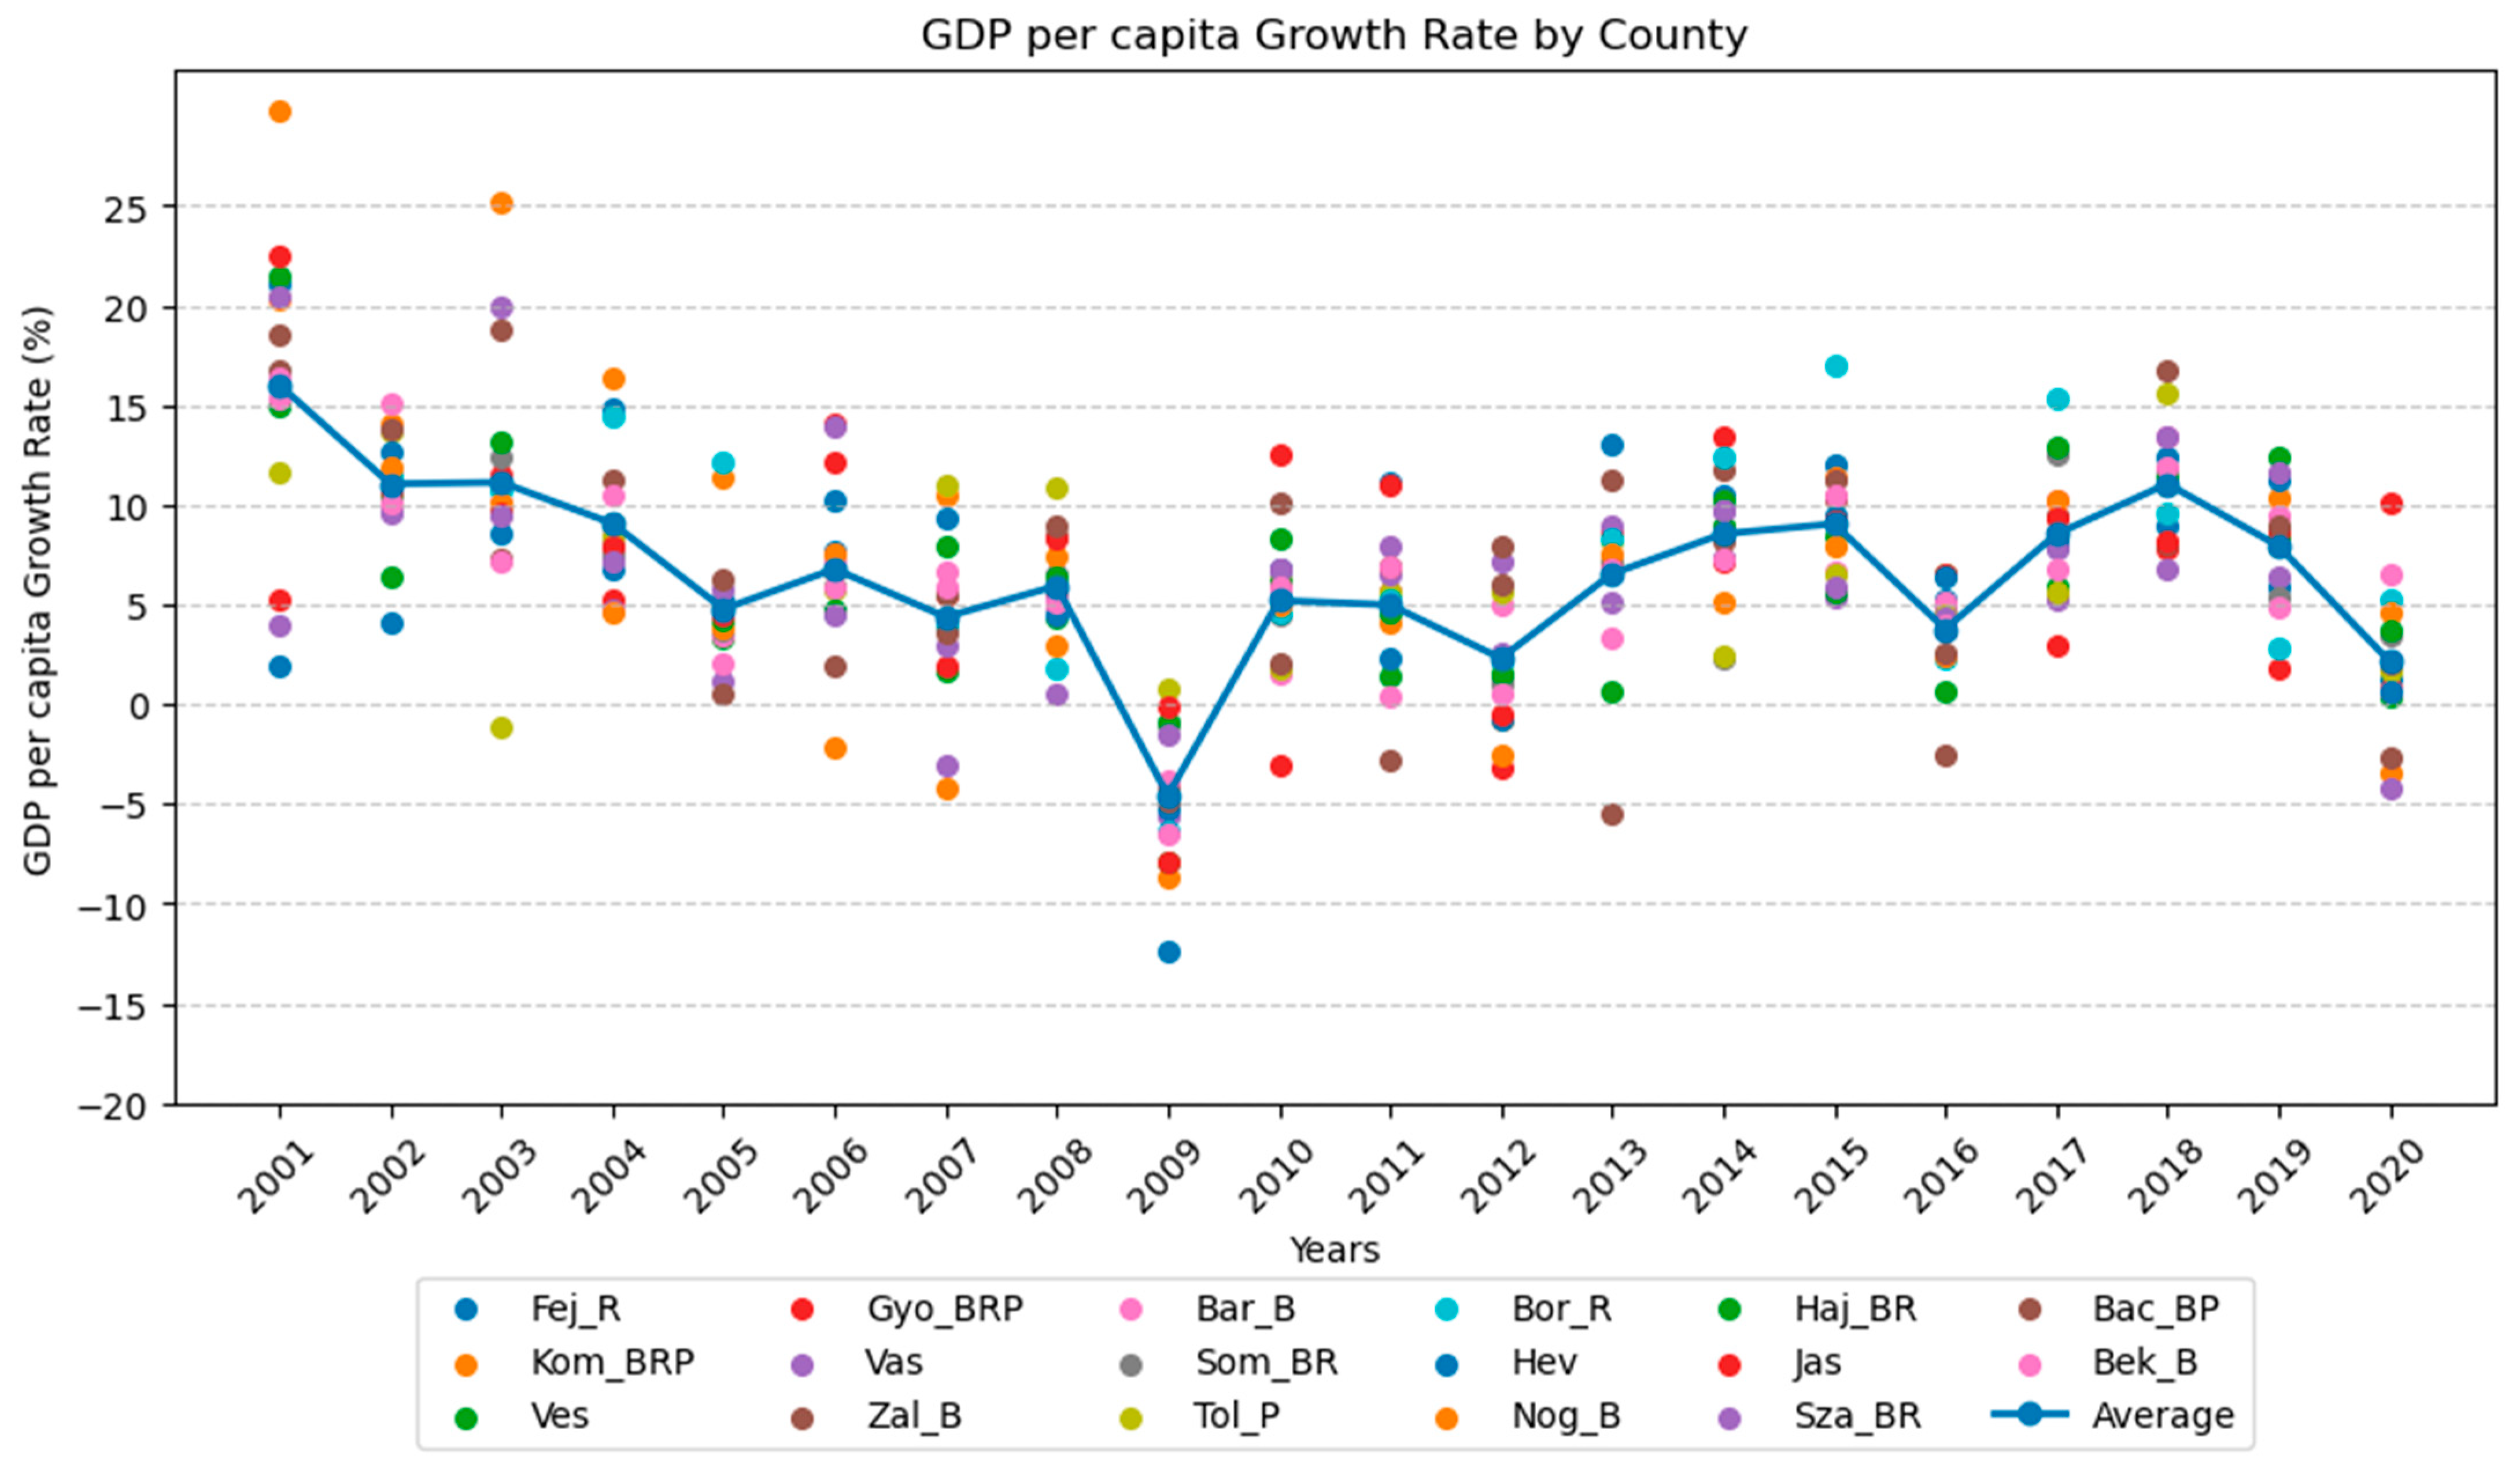
We perform all the calculations using Python code.

4. Results

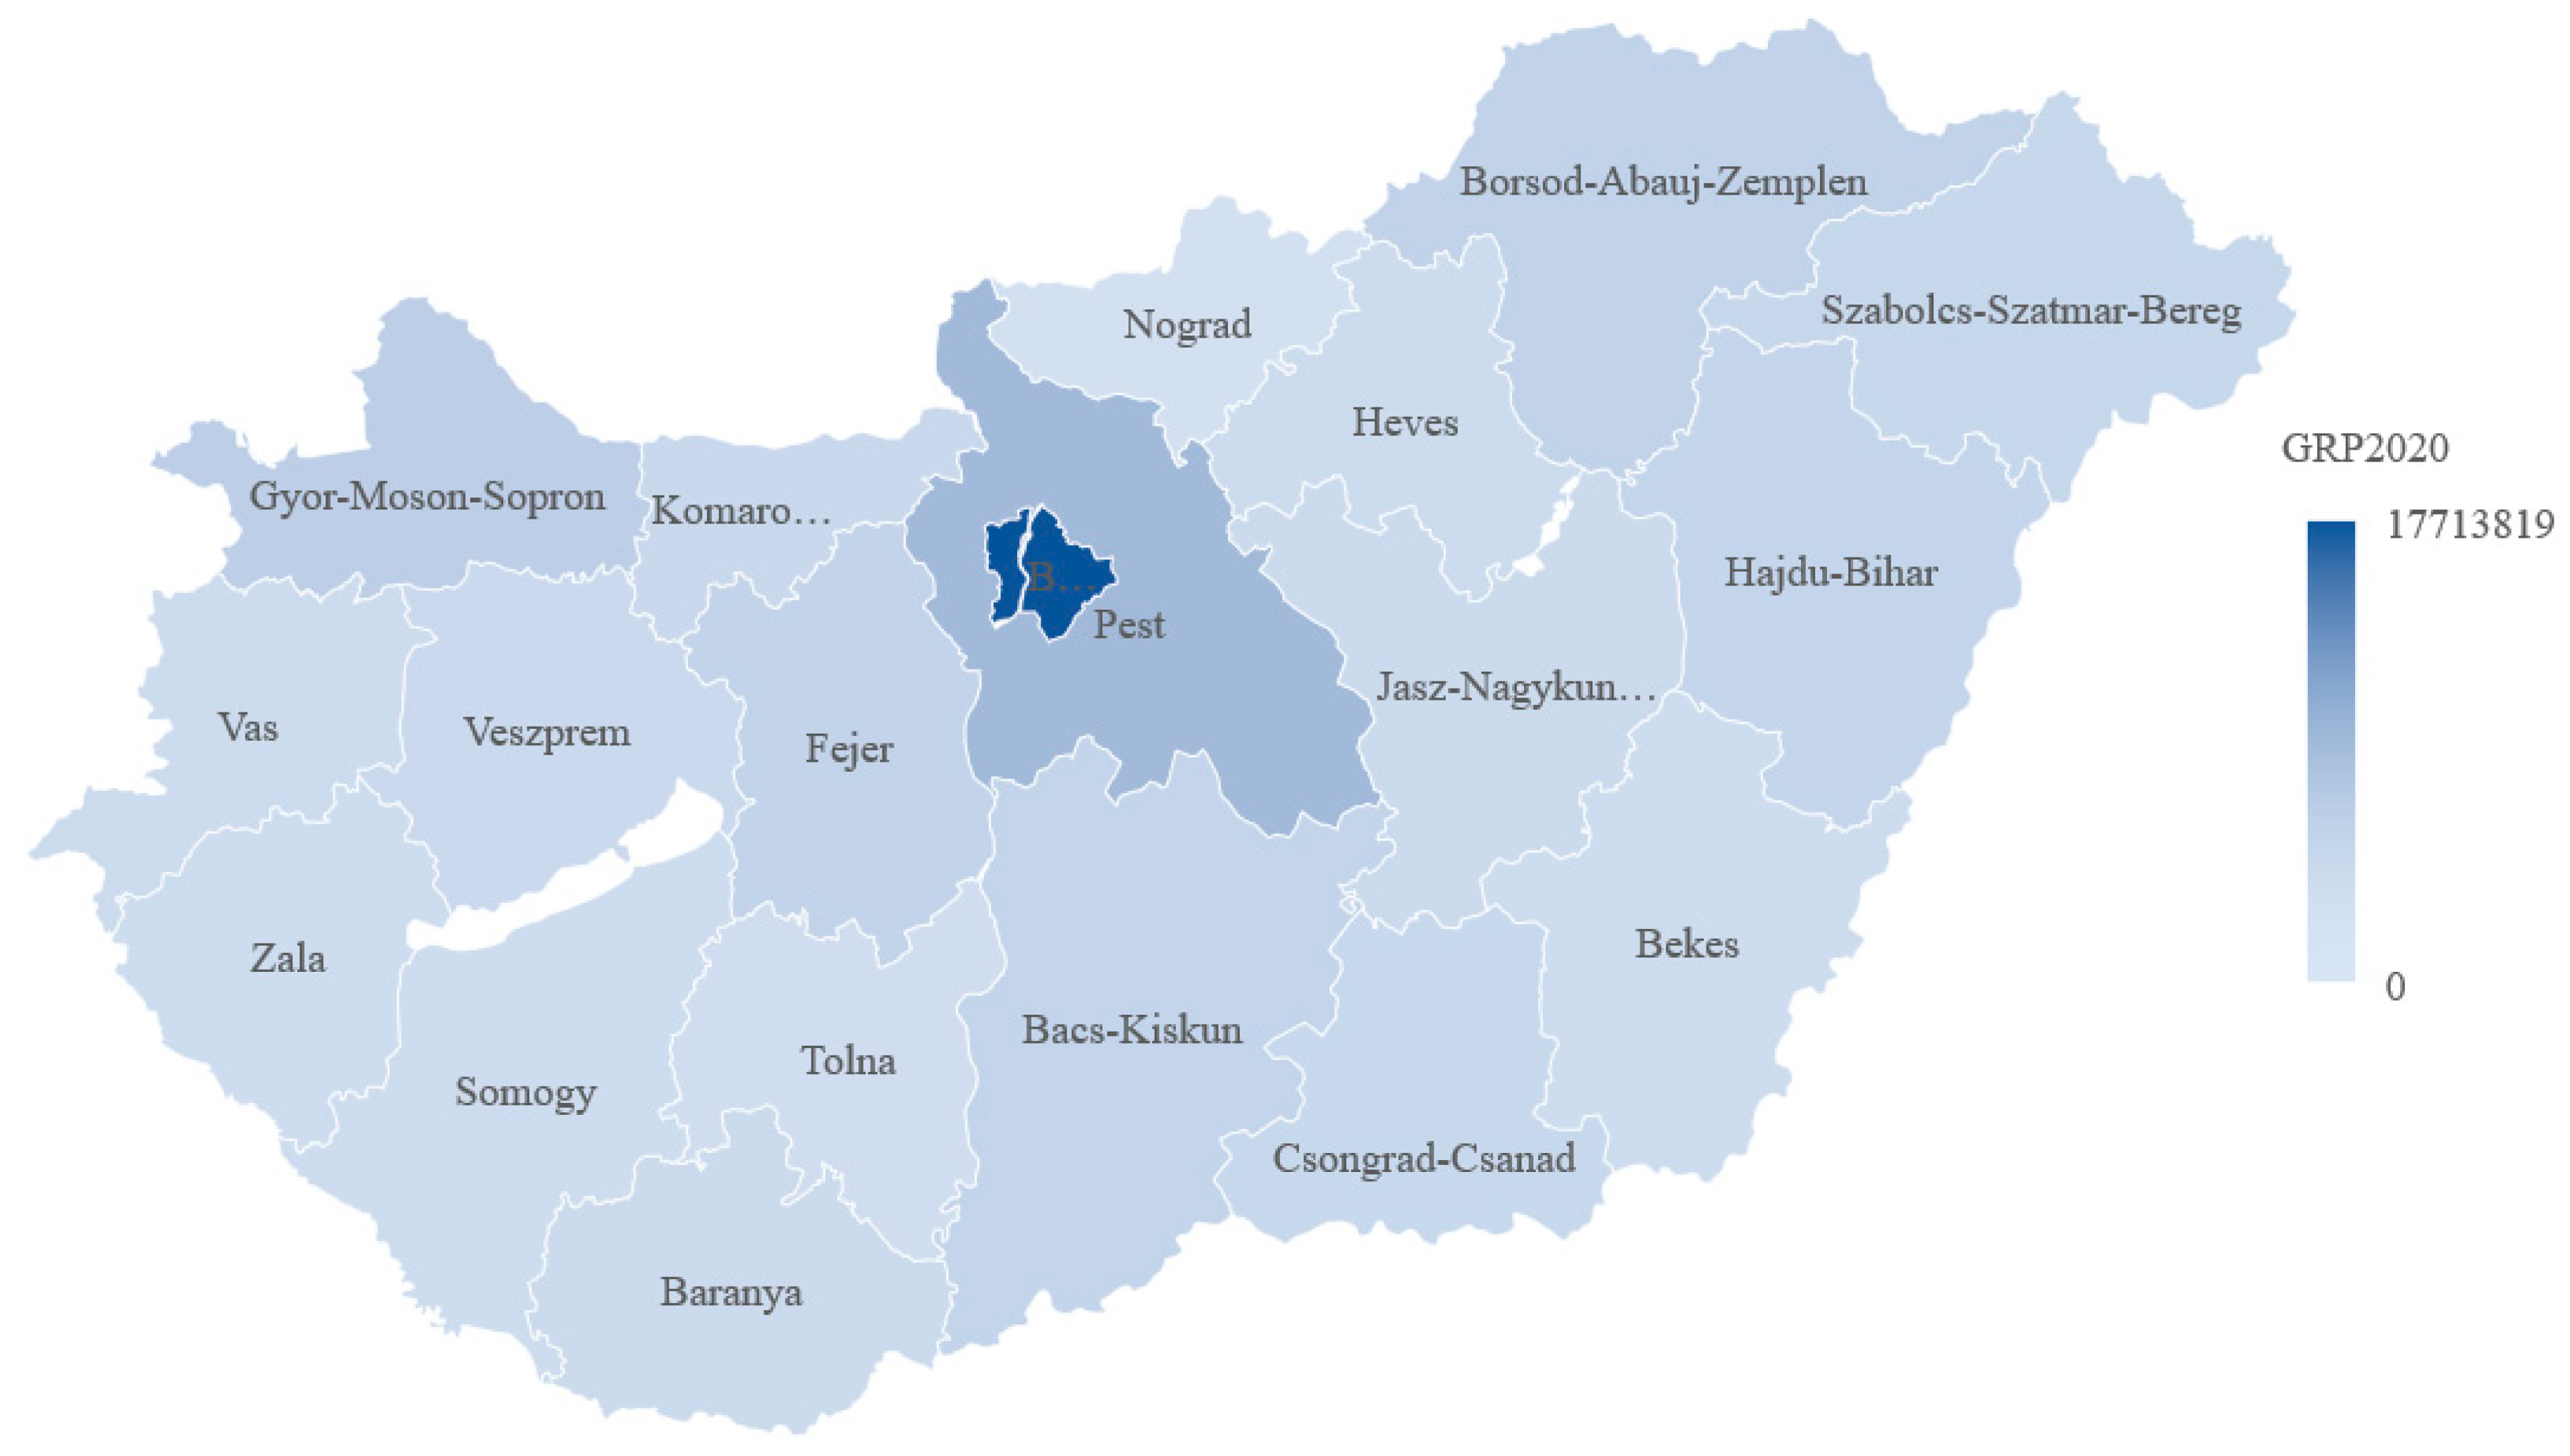
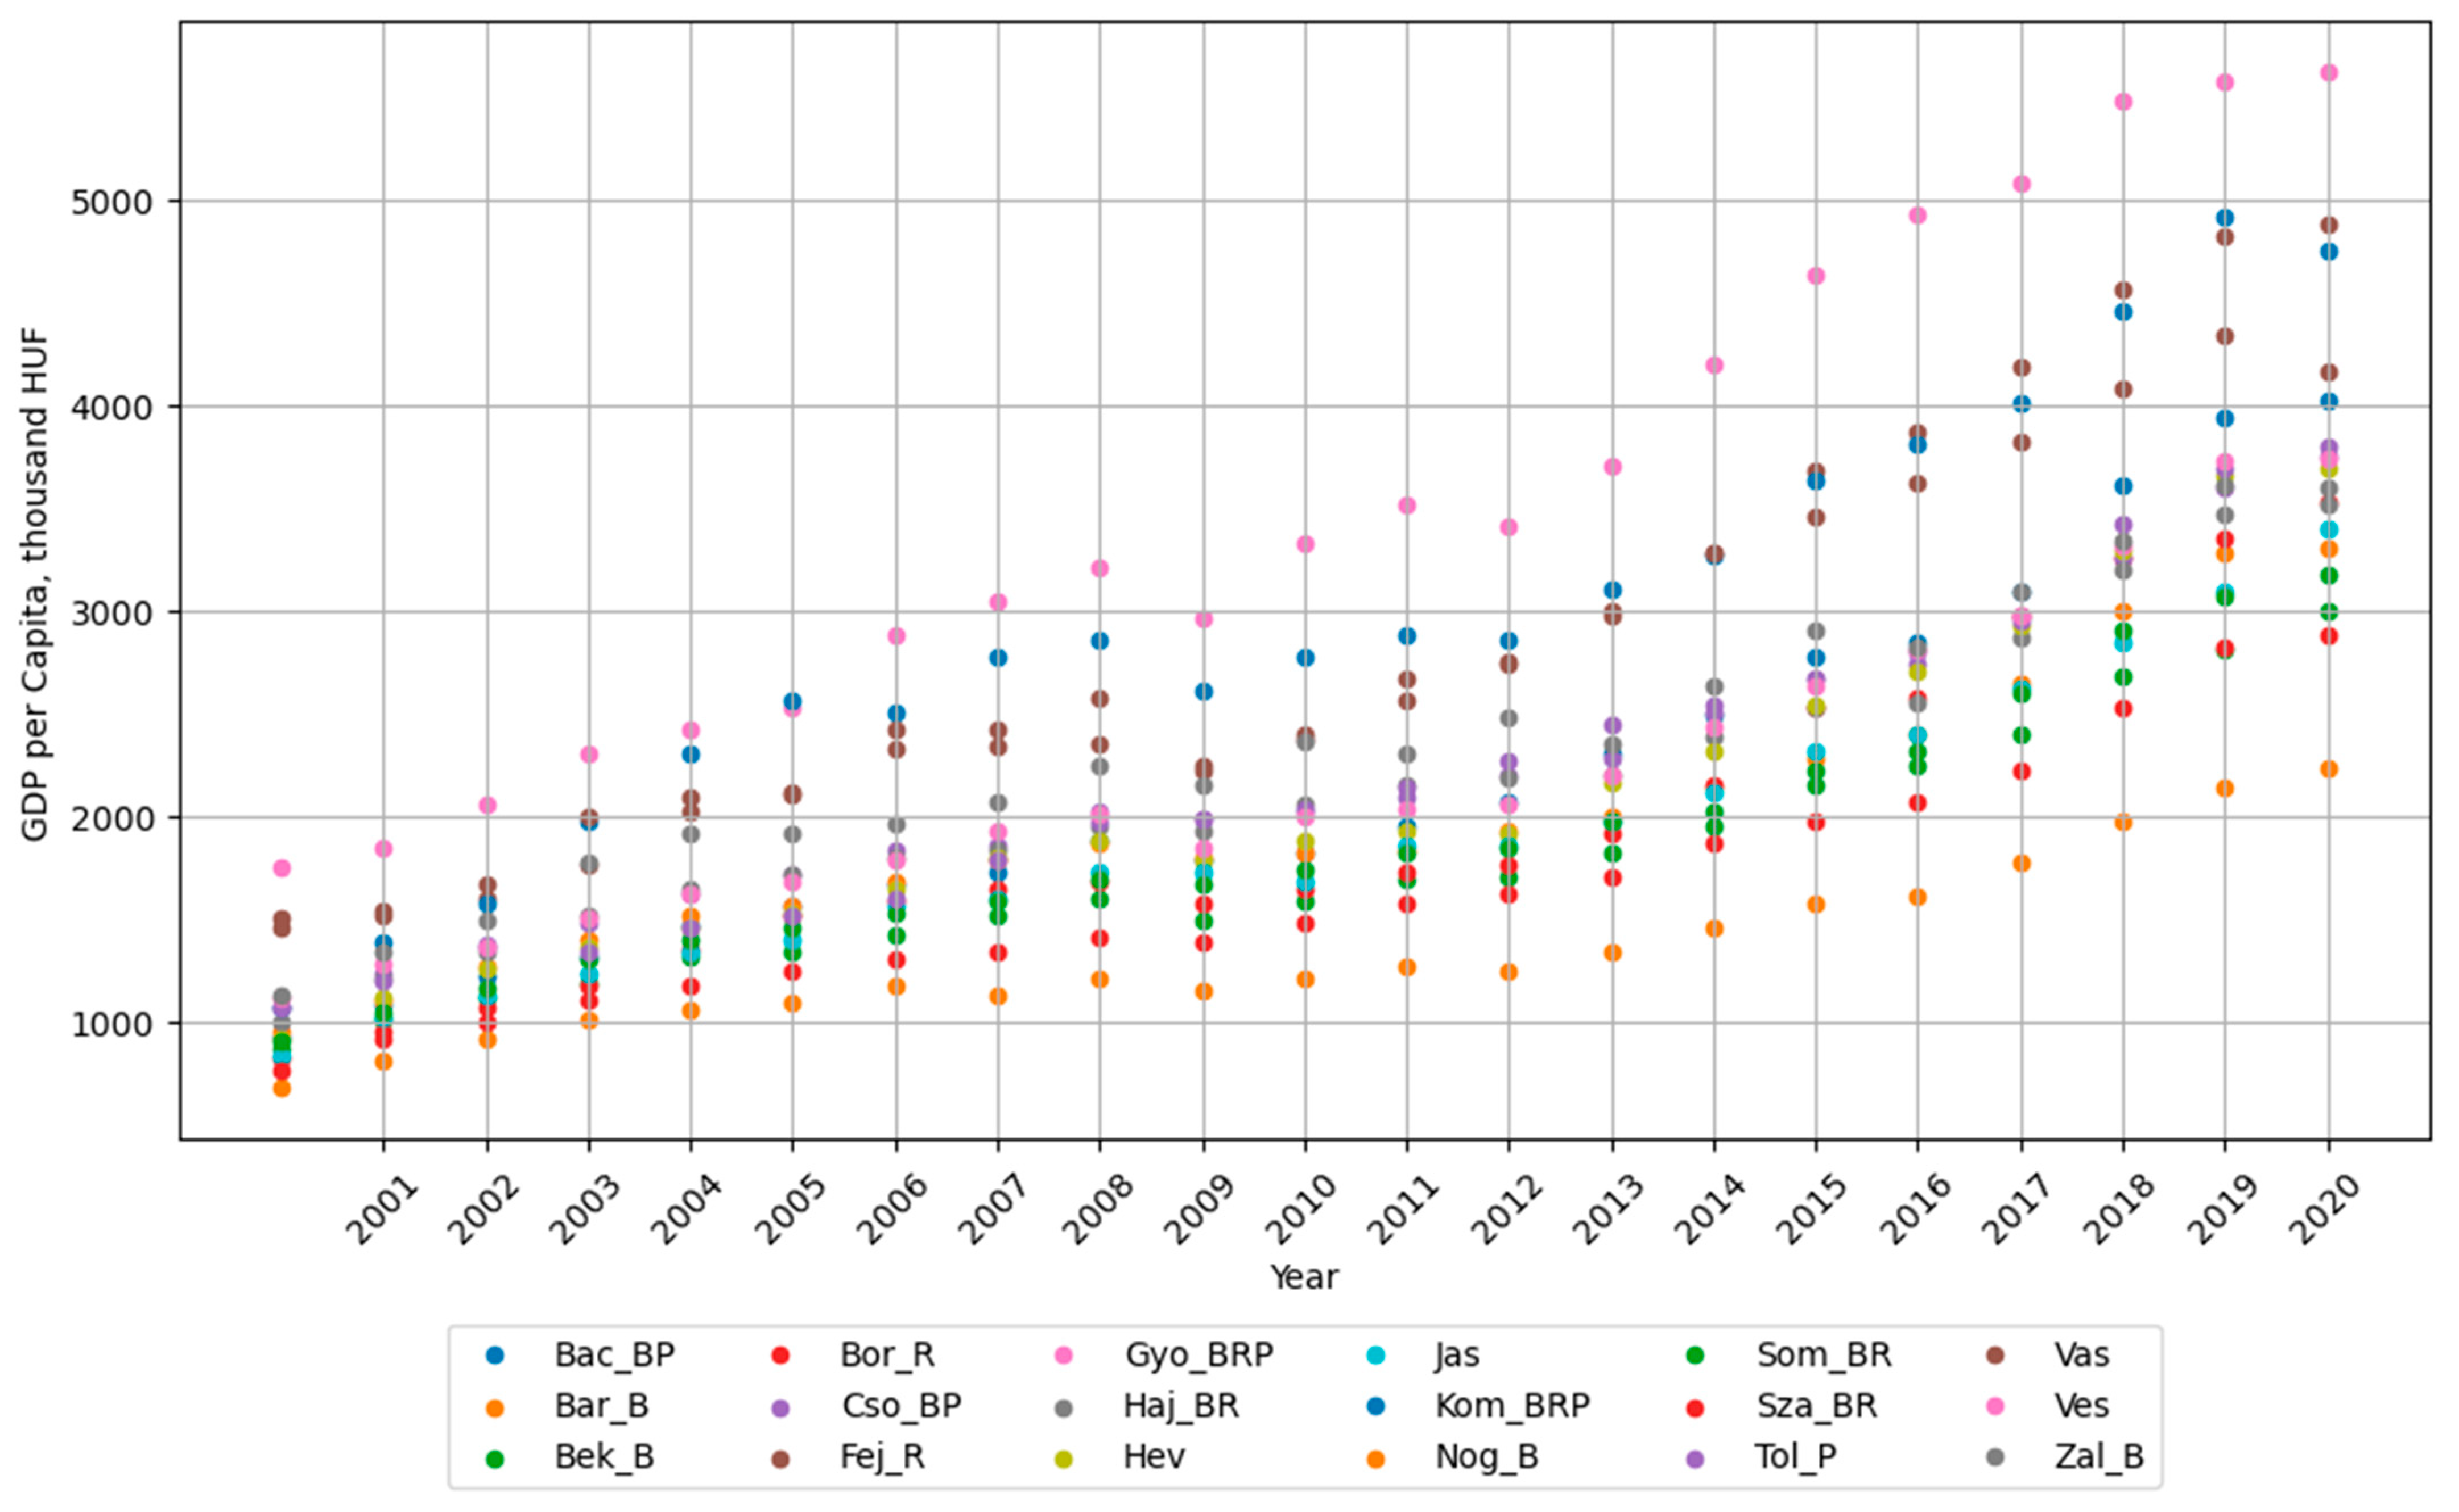
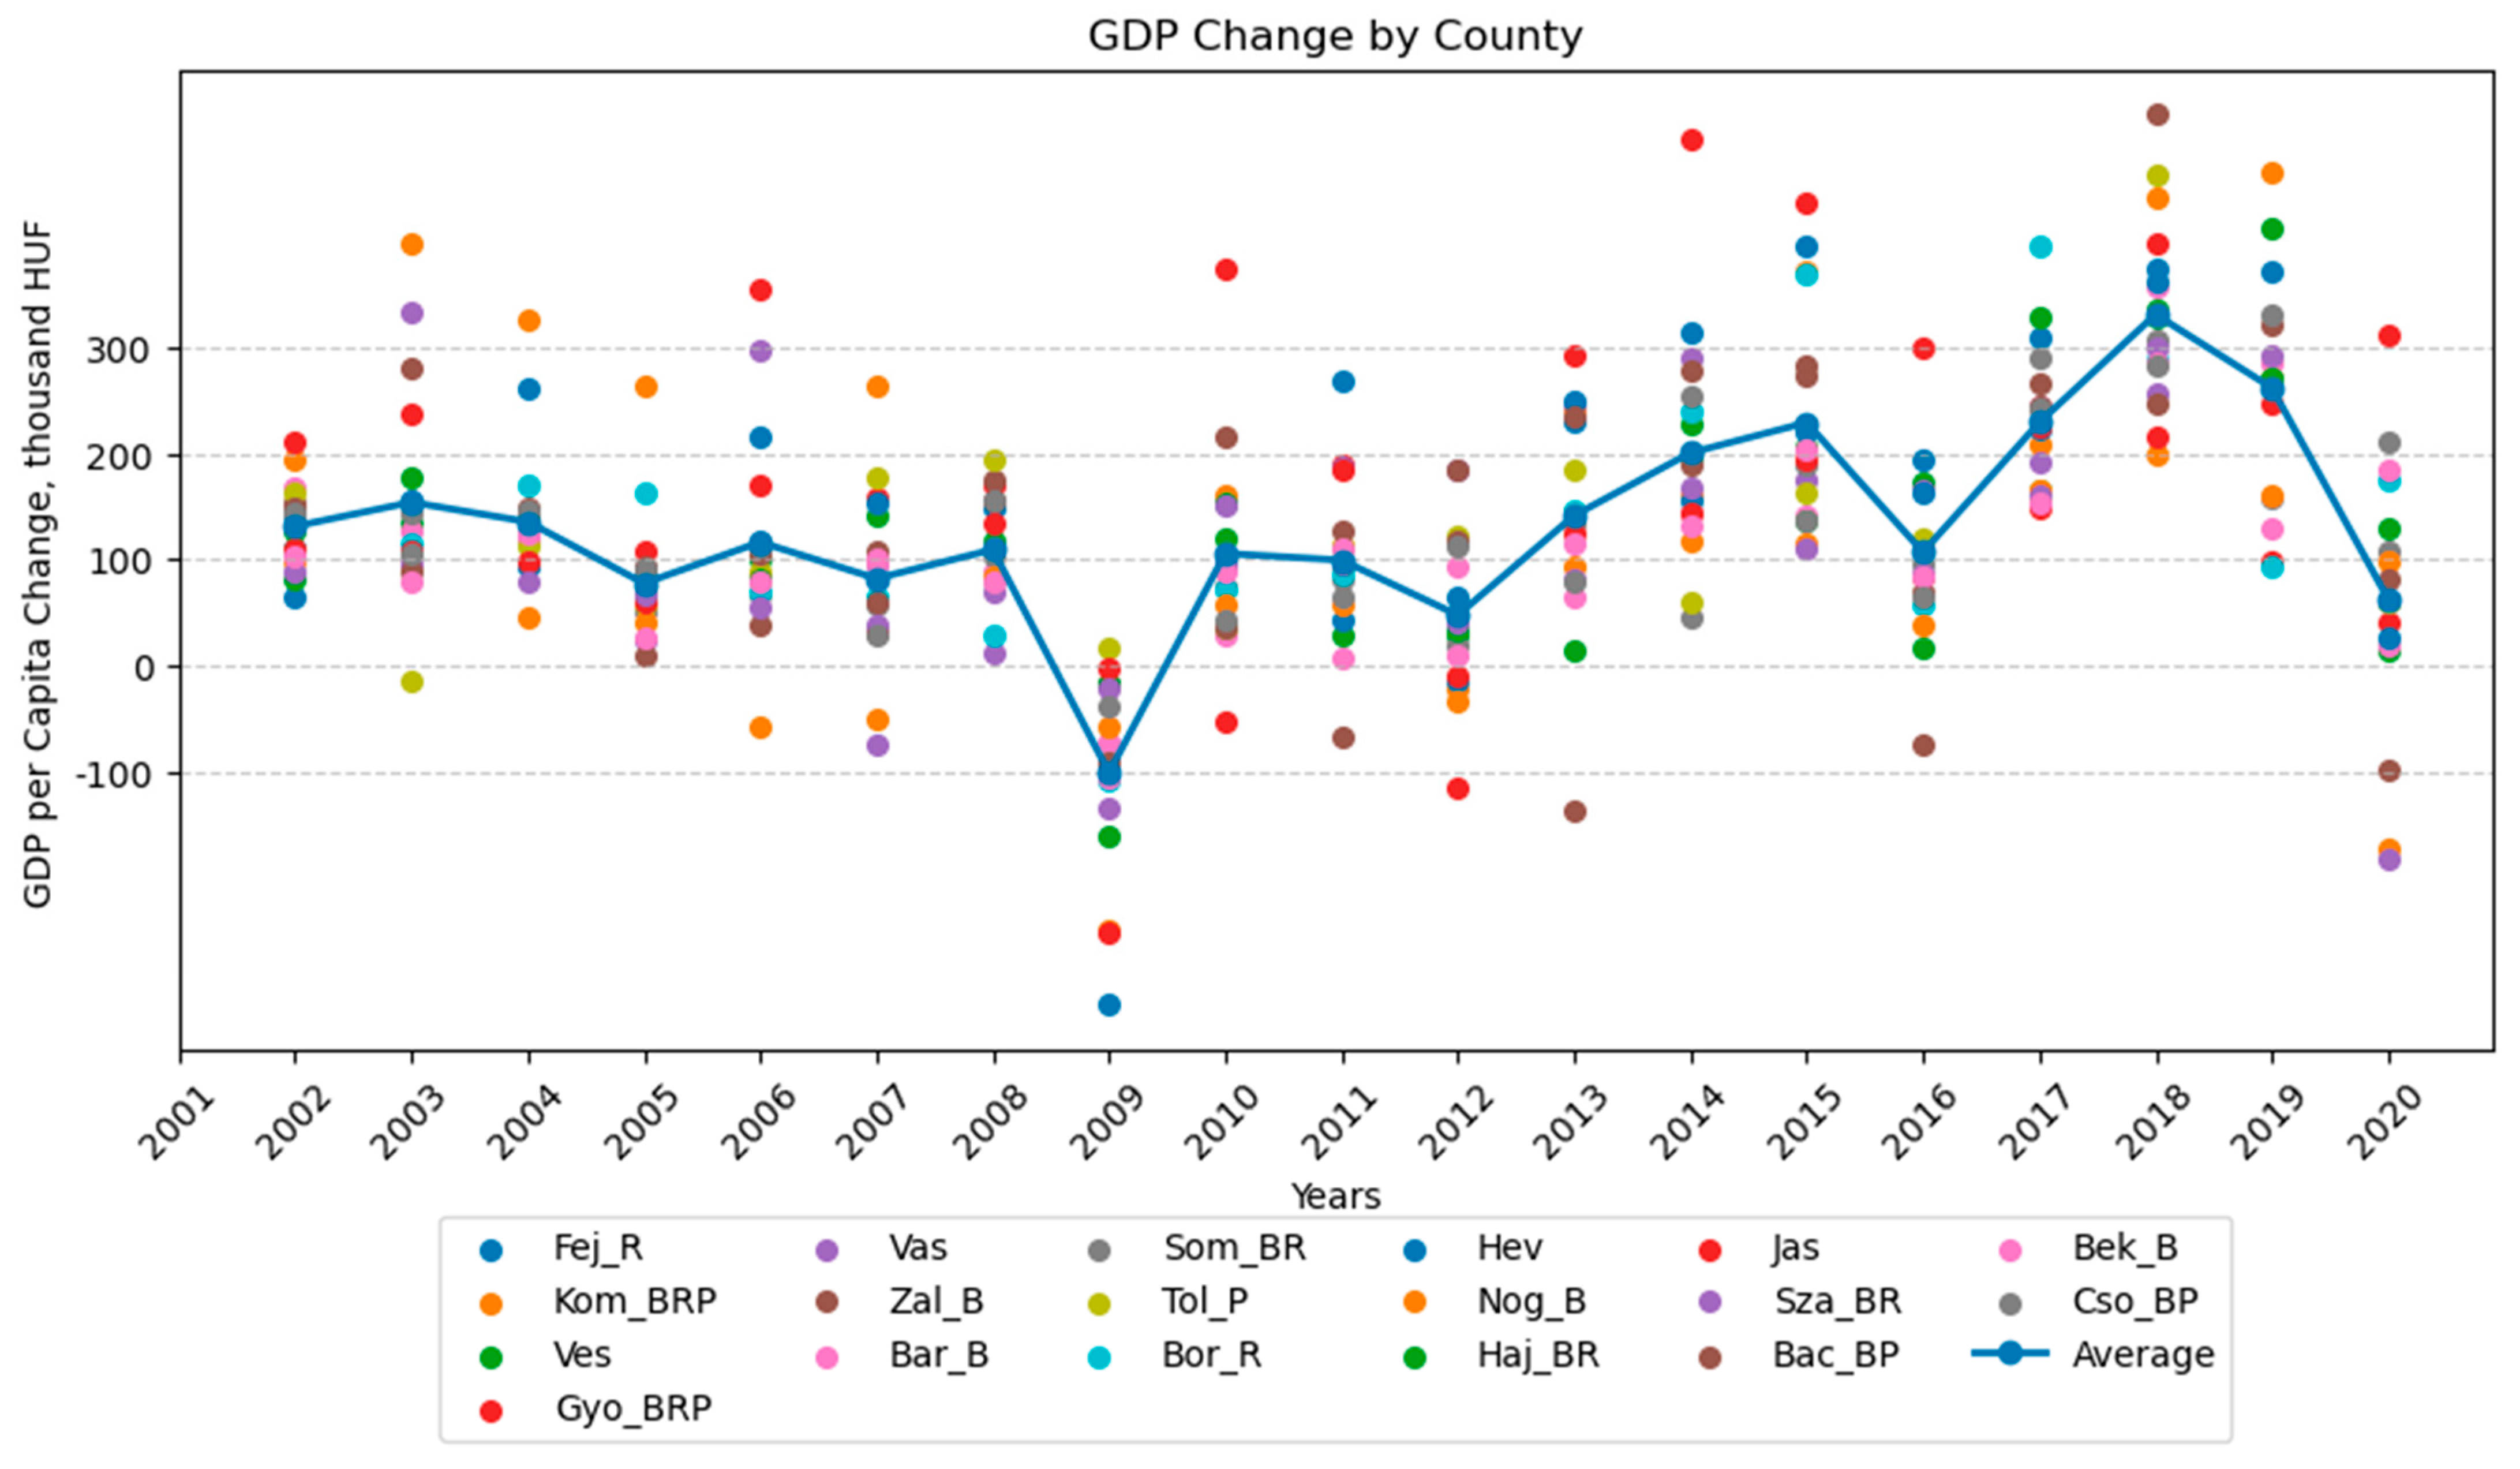
4.1. Characteristics of Regional Differences in the Economic Development of Hungary

Like most small European countries, Hungary exhibits a substantial concentration of economic activity in its capital region. As of the end of 2020, Hungary’s GDP stood at HUF 47.9 billion, with 48% of this total, or 22.4 billion forints, stemming from the capital, Budapest, and the surrounding metropolitan area of Pest. This concentration primarily arises from the presence of head offices of Hungarian companies within the metropolitan area. The distribution of the remaining GDP significantly depends on the economic potential of non-capital counties, underscoring the importance of assessing regional economic development. To assess the impact of factors like proximity to international borders and the presence of railway and water routes on the levels and rates of economic development in Hungarian counties more accurately, we excluded the capital, Budapest, and its metropolitan area, Pest, from our calculations. Table 2 provides an overview of the analyzed regions and their assigned codes for subsequent processing. In the provided codes, “B” signifies that the region borders a neighboring country. “R” indicates the presence of significant railway connections within the region, while “P” denotes the existence of major freight river ports.
We can see from the table that some counties have multiple attributes (e.g., Komarom-Esztergom or Gyor-Moson-Sopron with all three labels), and others have none (e.g., Vas with no labels). The following subsection will illustrate the relationship between geographical characteristics, such as proximity to international borders or major railroads or ports, and critical economic development indicators.
In our study, we have explored economic indicators for individual counties in Hungary in recent years, with a specific focus on GDP per capita. Unlike the traditional GDP, GDP per capita provides a per-person measure of economic well-being and offers a more accurate reflection of the average economic conditions in a region. By utilizing GDP per capita, we gain a more nuanced understanding of regional economic disparities, which can be invaluable for policy analysis and development strategies.
Figure 3 shows the economic performance of Hungarian counties between 2000 and 2020. Throughout all the years presented, the top ranked counties in terms of economic development have been border regions focused on trade with Hungary’s key partners—Austria, Germany, Romania, and Slovakia. The leading county among non-capital counties is Gyor-Moson-Sopron, located on the western border of Hungary. In 2020, the GDP of this county was HUF 2.64 billion, which was 10.55% of all non-capital counties in Hungary. This county is consistently one of the economic leaders among the non-capital counties of Hungary. The average share of this county from 2000 to 2020 was 10,39%, with the minimum indicator of 9.11% in 2005, and the maximum of 11.57% in 2016. If we use GDP per capita as an indicator, we see the same picture. In 2022, the GDP per capita in Gyor-Moson-Sopron was HUF 5617 thousand, the best result for all non-capital counties in Hungary. The average share of this county form 2000 to 2020 was 8,87%, with the minimum indicator of 8.25% in 2005, and the maximum of 9.64% in 2016.
In second place according to the GDP indicator for non-capital counties is Borsod-Abauj-Zemplen, located in the northwest of the country. Its share in GDP in 2020 was 4.59%. This is the average for the period 2001–2020. The share of the GDP of Borsod-Abauj-Zemplen in the Hungarian economy ranged from 4.12% in 2010 to 4.94% in 2017. Thus, the top rankings belong to two border counties oriented towards Hungary’s western and northeastern foreign trade partners. However, if we use GDP per capita as an indicator, the rank of Borsod-Abauj-Zemplen is much lower. In 2022, the GDP per capita in Borsod-Abauj-Zemplen was HUF 3534 thousand, only 11th place among all non-capital regions in Hungary. We combined the average indicators of GDP and GDP per capita in 2000–2020 in Table 3.
As mentioned earlier, in our further study we will use GDP per capita as our main indicator. The level of GDP per capita in neighboring counties can differ significantly. So, for example, Vas and Veszprem counties, which neighbor Gyor-Moson-Sopron county, had the average share of all non-capital counties in Hungary in 2000–2020 equal to 6.20% and 5.58%, respectively. At the same time, Vas county, like Gyor-Moson-Sopron county, is a border region and, in terms of its geographical location, is as close as possible to Hungary’s critical foreign trade partners. The neighbor county of Borsod-Abauj-Zemplen, the county of Nograd, lags behind it more noticeably. Nograd county’s average share of all non-capital counties in Hungary in 2000–2020 was only 3.33%. This figure is the lowest in Hungary. We can see in Table 2 that for GDP as an indicator the differences between the counties are even larger.
Why do neighboring border counties in Hungary differ so much regarding GDP? In the case of Nograd County, its low performance can be explained by the land area of the county, which is several times smaller than the land area of Borsod-Abauj-Zemplen County. However, the counties of Vas and Veszprem are not inferior in size to those of Gyor-Moson-Sopron but are significantly behind in terms of economic indicators.

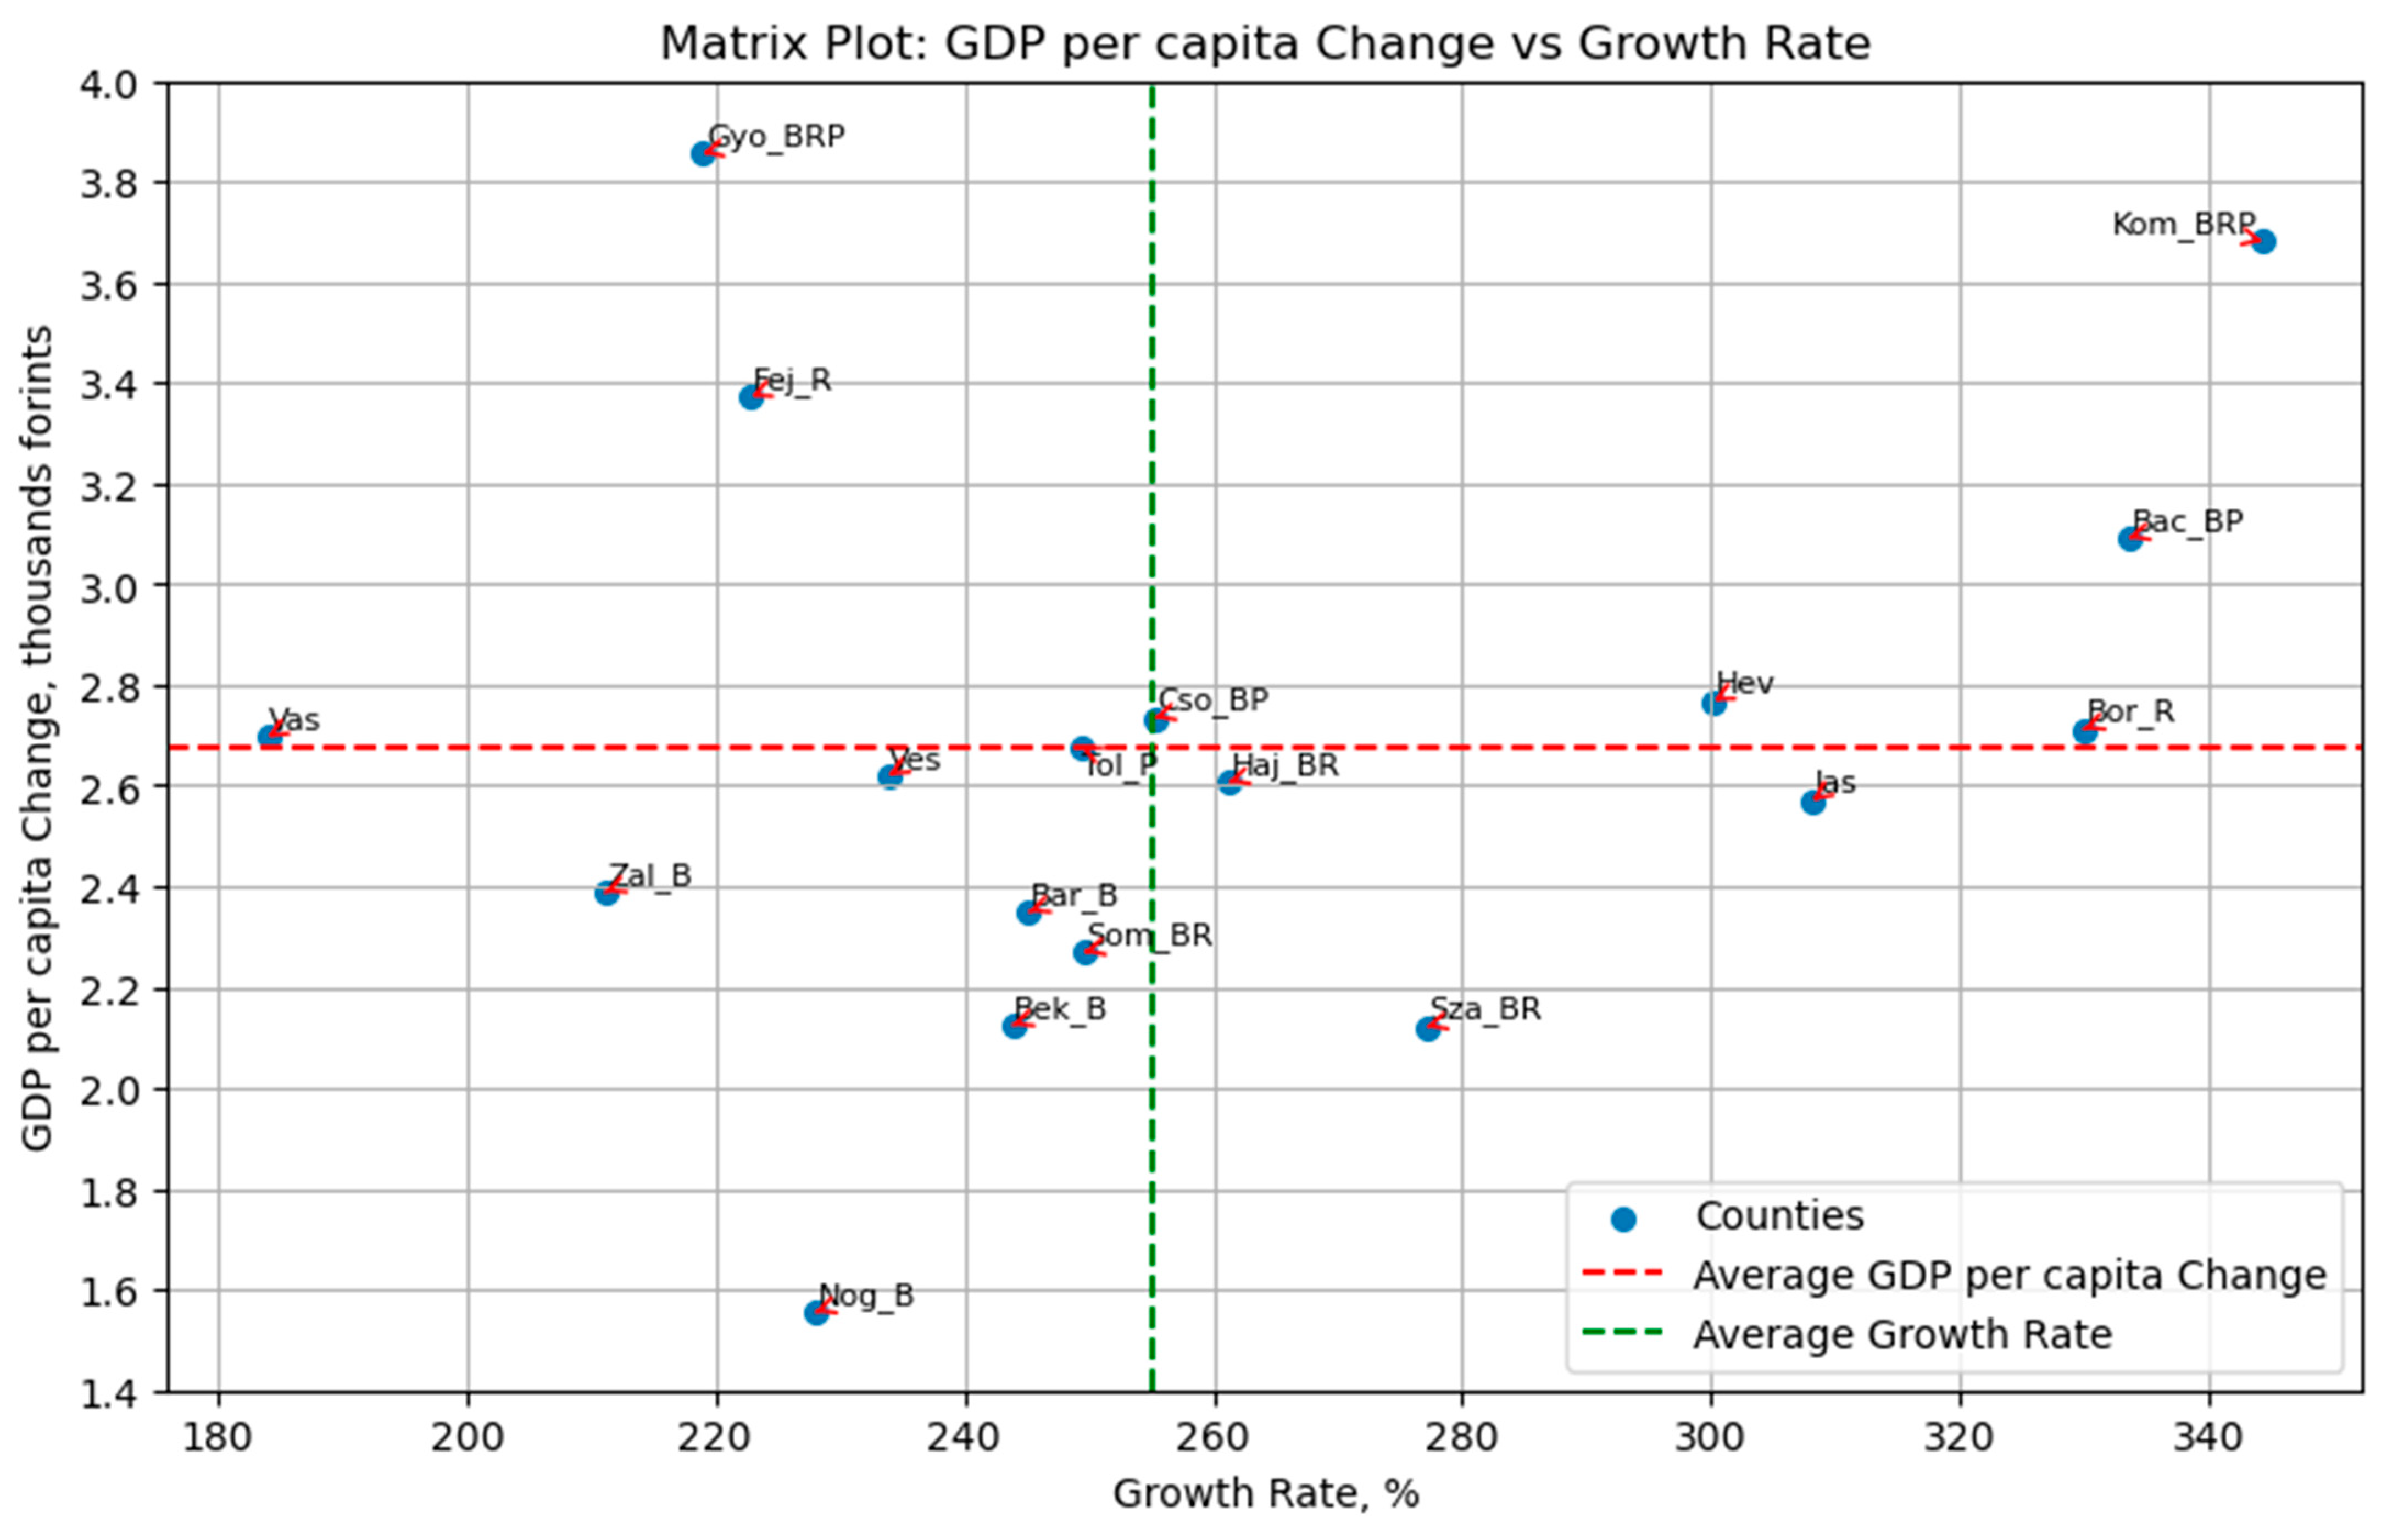
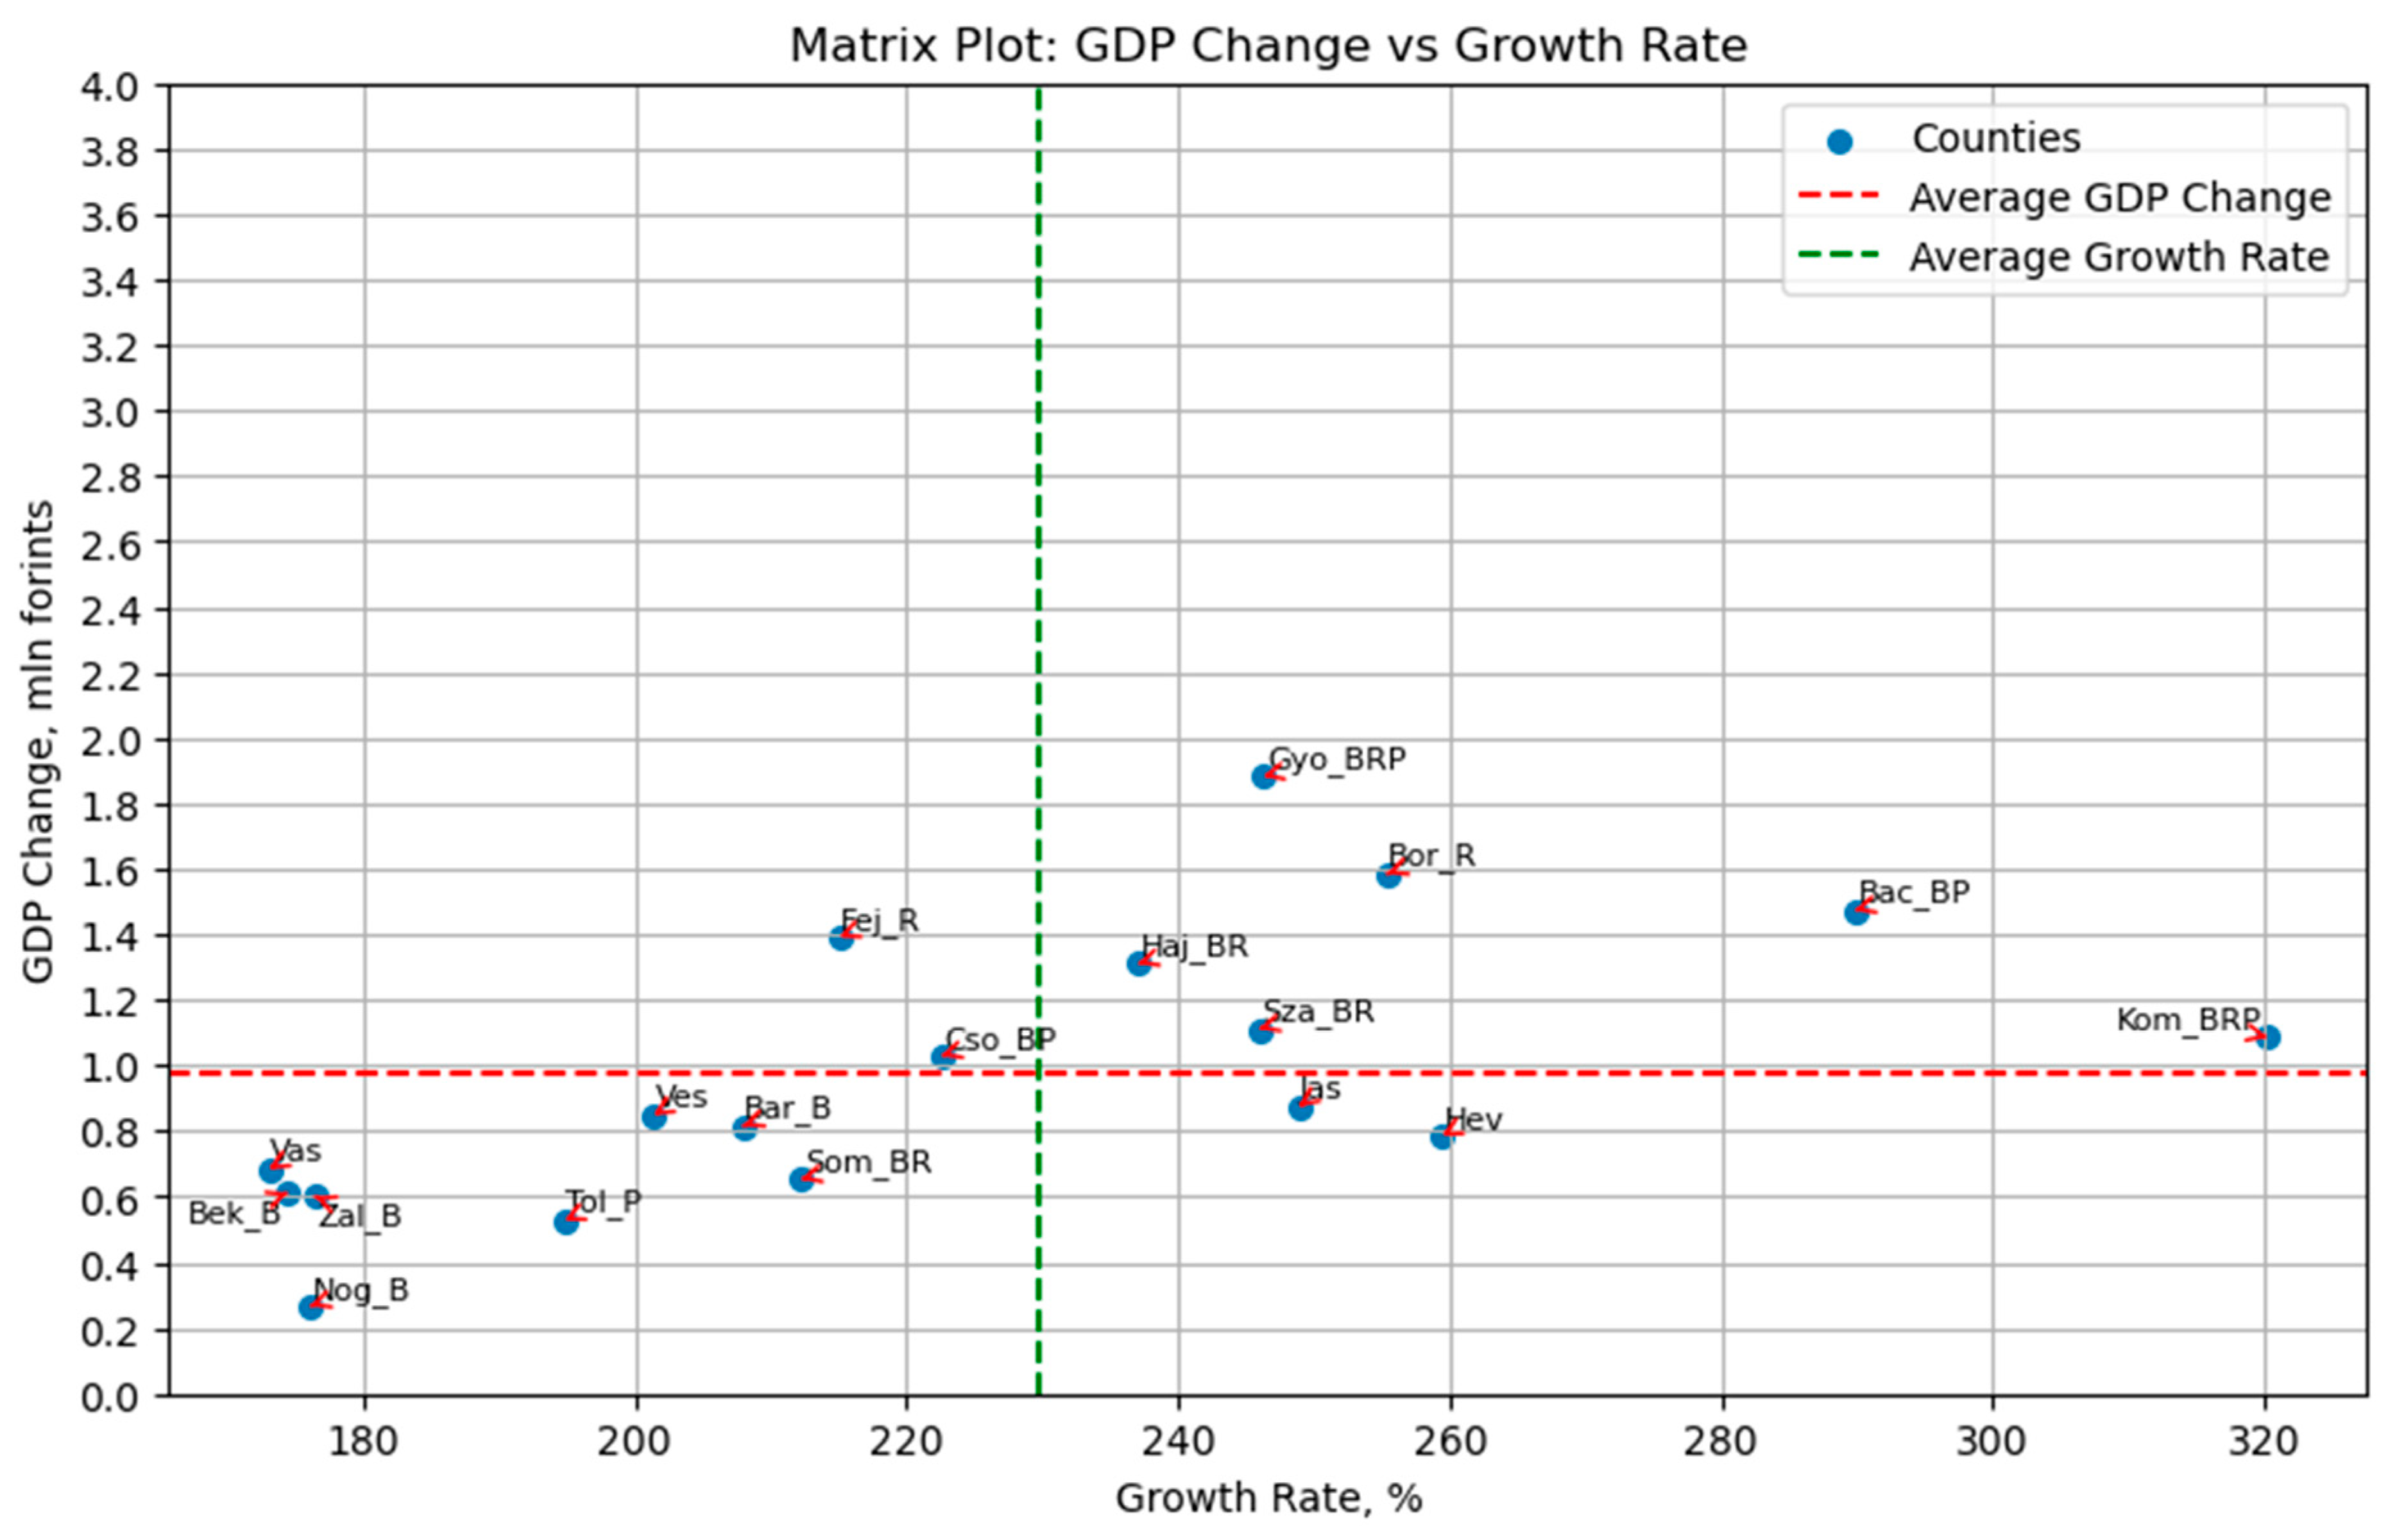
4.2. Calculating the Influence of Factors

We start by calculating the GDP per capita change over the past two decades. We calculate the average GDP per capita change for 18 Hungarian counties, excluding the capital region. In Figure 4, the average GDP per capita change is represented by a blue line, while the change for every county is represented by a colored dot.
As the Hungarian economy has been growing over the last two decades, we can see that the average GDP was positive each year, except for 2009. We can see on the graph that some counties are much more frequently above or under the average line. This indicates that the GDP change in these counties is either higher or lower than the average. We rank all the counties in the following table due to the number of higher years.
According to our previous labeling, we have three groups of counties. We will label them according to the Hypotheses’ numbers. The first group, H1, comprises ten counties with a railroad or a port. The second group, H2, consists of 12 counties, which are border regions. The third group, H3, consists of four counties that do not have any of these factors. We can see from Table 4 that counties with multiple attributes rank higher. For example, Komarom-Esztergom and Gyor-Moson-Sopron, with all three labels, are among the highest ranked according to this parameter. On the other hand, the counties without proximity to international borders or the presence of major railroads or ports rank much lower. Also, we can conclude that only five counties experienced higher than average GDP per capita change in more than half of the years we had data for. And none of them is from the H3 group.
So, after this stage of calculations, we can confirm Hypothesis 3, as all four counties in the H3 group have a lower ranking in the table. We can also take the results of the H1 group as a light confirmation because six of the 10 counties are among the highest ranked in the table. As for H2, the results are divided 50/50, so we cannot see any proof or refutation of these hypotheses. However, it is important to note that the GDP per capita change is measured in absolute numbers. So, the counties with higher GDP per capita in previous years will have better results in a growing economy. In such cases, whether their high ranking is solely attributable to the analyzed factors is uncertain, as it could also result from previous advantages. To deal with this problem, we decided to calculate the growth rate of all counties. We suppose that the counties that are closer to borders, and/or have ports and railroads, will demonstrate higher growth rates, as this is crucial in Hungary, a highly open economy oriented mainly toward the world market instead of the inner one. We programmed all the calculations in Python. The results are presented in Figure 5.
This graph illustrates various counties’ annual GDP per capita growth rates over a two-decade period, from 2001 to 2020. Each data point represents the percentage growth rate in GDP per capita for a specific county in Hungary. The counties are plotted as scattered dots, with each county represented by a different color. The line graph depicts the average GDP per capita growth rate across all counties yearly, providing insights into regional economic trends and disparities. The graph highlights the dynamic nature of economic growth, enabling viewers to compare individual county performance with the overall average throughout the years. Table 5 shows the ranking of Hungarian counties by GDP per capita growth rate performance.
We can see from the table that the differences between the top and bottom ranked counties are not as significant as in Table 4. Occasionally, all counties demonstrate a growth rate higher than the average. Still, we can assume that the number of these years tells us about some advantages of development opportunities.
Let us check our hypotheses once again. We can see from Table 5 that our Hypothesis 3 is the truest. All four counties without a border, port, or major railroad are in the bottom half of the table. Moreover, three of them are in the last positions. This means that most of the time, even in the growing economy, they grow with less speed. Combining this with the results from Table 4, we see that these counties lag behind the leading counties year by year, leading to increased economic differences within the country.
We can also take the results as a partial confirmation of Hypotheses 1 and 2, as the lowest result for a county with a port or railroad is nine advantaged years of 20. We can also conclude that the counties combining all three factors have the best opportunities for economic development. To finalize our calculations and visualize all the results, we prepared a Python code for the combined calculation of growth rate and GDP per capita change. We printed a matrix demonstrating the top and bottom ranked of the non-capital Hungarian counties (Figure 6).
According to the matrix, the 18 counties are divided into four zones. There are six counties in zone A, which means that these counties demonstrate both a growth rate and GDP per capita change worse than the average. Among these counties, there are Veszprem, Zala, Baranya, Somogy, Bekes, and Nograd. There are four counties in zone B, which means that they have higher than average volumes of GDP per capita change but lower than average growth rates. Among these counties, we can see Gyor-Moson-Sopron, Fejer, Vas, and Tolna. Three counties with higher growth rates and lower GDP per capita change are presented in zone C. Those are Hajdu-Bihar, Jasz-Nagykun-Szolnok, and Szabolcs-Szatmar-Bereg. Finally, five counties in zone D are among the top ranked, both by growth rate and GDP per capita change. These counties are Komarom-Esztergom, Bacs-Kiskun, Csongrad-Csanad, Heves, and Borsod-Abauj-Zemplen.
We use the matrix to check our hypotheses once again. Hypotheses 1 is not proved, as we can see border counties in all four zones of the matrix. Zala and Nograd, despite their positions close to borders, demonstrate worse results both in growth rate and GPD per capita change. On the other hand, two leading counties are also close to borders—Borsod-Abauj-Zemplen in the northeast and Komarom-Esztergom in the northwest. We can draw the conclusion that closeness to a border can be a solo factor influencing the county’s economic development.
There are ten counties which have major ports and/or railroads. Only one of these counties is located in zone A. In zone D four of the five counties are from the H2 group. We can see in the matrix that the absolute majority of H2 counties outperform the average indicators. So, we can assume the Hypothesis 2 is proved. We can also draw an additional conclusion that combining closeness to borders, ports, and railroad infrastructure, as can be seen in Gyor-Moson-Sopron or Komarom-Esztergom, allows a county to achieve the best results.
As for Hypothesis 3, we can draw a conclusion that the absence of a major port and railroad infrastructure, as well as an inner geographical position, is not really crucial in the case of such a small country like Hungary. Although three of the four H3 counties have lower than average results for growth rate and GDP per capita change indicators, one of them, Heves, is present in zone D of the matrix. The growth potential can be based on other factors not explored in our research. Yet, we can say that the absence of all three factors makes rapid economic development more difficult. To check our conclusions, we prepared a Python code for the same calculation for the GDP indicator. The matrix is shown in Figure 7.
The lag of the regions of group H3 when calculated by GDP is much more noticeable, as is the ranking of the counties in which all three factors are represented. We can see that eight of all non-capital counties have lower than average GDP change and lower than average growth rates. These low ranked counties, year by year, have weakened economic positions compared with the rest of the country. We can see that seven of these counties have only one or zero of the factors we evaluate. On the other hand, six counties have higher than average GDP change and higher than average growth rates. And five of these counties have at least two of the evaluated factors. Moreover, both counties with all three factors are ranked top: Komarom-Esztergom has the highest growth rate, and Gyor-Moson-Sopron has the highest GDP change.
Using GDP as an indicator makes our previous conclusions more obvious. We can draw a conclusion that the presence of at least two of the evaluated factors significantly influences the county’s development potential. As a result, we see that the differences in the economic potential of individual counties are only increasing each year. Using GDP per capita as a key indicator slightly reduces the level of difference, but does not reverse the overall trend. However, the value of proximity to borders turns out to be less than expected, and the availability of a developed transport infrastructure suitable for large volumes of cargo transportation is of paramount importance.

5. Discussion

In our comprehensive analysis of Hungary’s regional economic disparities spanning two decades, from 2001 to 2020, we focused on proximity to international borders and the presence of major railroads and ports as critical determinants of economic trajectories.
We shed light on the significant influence of geographical factors on economic growth at the county level. Specifically, our study focused on proximity to international borders and the presence of major railroads and ports as critical determinants of economic trajectories. The factors that we chose for our analyses are parts of major research objects, which are among the topics of interest for many researchers. Gallup et al. delve into the relationship between geographical factors and economic development and provide insights into how spatial characteristics influence industrial performance and economic activity (Gallup et al. 1999). Nordhaus discusses the often overlooked role of geographic factors in macroeconomics and growth economics. It highlights aspects like climate, proximity to water, and soil quality as influential factors in economic development (Nordhaus 2006). The methodology presented in our article for analyzing the influence of individual factors on absolute and relative changes in key economic indicators can also be applied to analyzing the above-mentioned geographical factors.
Our investigation into the economic dynamics of Hungary offers insights that can be of interest to researchers across European countries. Rasvanis and Tselios, for instance, delve into the intersection of geography and institutional factors impacting entrepreneurial activities, shedding light on how these elements affect business prospects and economic growth in Greece (Rasvanis and Tselios 2023). Basboga’s exploration of border openness and cross-border cooperation’s impact on regional growth in European regions underscores the role of cross-border activities in fostering economic development (Basboga 2020). Neuberger et al. have scrutinized the relationship between regional innovativeness and location factors, including proximity to borders (Neuberger et al. 2021). While our study confirms the importance of border proximity, it also emphasizes that it cannot be the sole determinant.
Similarly, Ferrari et al.’s focus on port activities in European regions highlights the pivotal role of ports in local development (Ferrari et al. 2012). Additionally, Bottasso et al.’s analysis of port activities on local development across European countries suggests that ports have non-negligible effects on local GDP (Bottasso et al. 2014). Our research reaffirms the positive impact of port infrastructure on local economic development. We find that these geographical advantages significantly influence economic growth, with counties lacking these advantages consistently experiencing slower economic expansion, thus exacerbating regional disparities. Our findings align with those of scholars like Lugovoy et al. (2007) and Chen and Hall (2011), who have observed similar trends in various regions.
Future research should aim to delve deeper into the intricate interactions between geographical factors and other socioeconomic variables to enhance our understanding of this multifaceted topic. Moreover, investigating policy interventions and institutional development, as suggested by Rodrik et al. (2004), can play a vital role in mitigating regional economic disparities, not only in Hungary but also in regions confronting similar challenges.

6. Conclusions

In our detailed examination of economic performance across Hungarian counties over the past two decades, we focused on three critical factors: proximity to international borders, significant ports, and major railway junctions. Utilizing GDP per capita as our principal indicator, we discerned a complex narrative of regional disparities and growth opportunities within Hungary. Our study reaffirms the complexity of these three factors in influencing economic growth. Counties without the advantage of border proximity, significant ports, or major railway junctions, such as Jasz-Nagykun-Szolnok, Vas, and Veszprem, consistently exhibit slower economic growth. This reaffirms that the absence of these specific advantages poses substantial challenges in fostering economic development, causing these regions to fall below national average development indicator levels frequently. To enhance our analysis and present our findings more effectively, we employed Python coding to create a matrix, categorizing counties based on their economic performance. This methodological approach allowed for an in-depth validation of our hypotheses and a nuanced understanding of the multifaceted economic landscape in Hungary.
Our findings also provide a nuanced view of the effects of border proximity on economic performance. While Hypothesis 1, focusing on border proximity, is not universally confirmed—with border counties present in all four matrix zones—it is clear that this factor alone does not guarantee superior economic outcomes. Notably, while Zala and Nograd are close to borders, they underperform in both growth rate and GDP per capita change. However, border proximity does contribute significantly to the success of top ranked counties like Borsod-Abauj-Zemplen and Komarom-Esztergom, suggesting that while border closeness is not a standalone factor, it can contribute positively in certain contexts.
Regarding the presence of significant ports and railway junctions, our analysis confirms Hypothesis 2. The majority of counties benefiting from these infrastructures outperform average economic indicators. Specifically, four out of five counties with the highest performance in both growth rate and GDP per capita change possess these logistical advantages. Our data suggests that these factors, especially when combined with border proximity, as seen in counties like Gyor-Moson-Sopron and Komarom-Esztergom, create the most conducive conditions for economic prosperity. For Hypothesis 3, our results indicate that while the absence of significant ports and railway infrastructure, coupled with an inland position, generally correlates with lower economic performance, it is not definitively detrimental in Hungary’s context. An example is Heves county, which exhibits high performance despite lacking these three factors. This suggests that other unexplored factors may also significantly influence economic growth.
In conclusion, our research highlights the intricate interplay between border proximity, ports, and railway junctions in regional economic performance in Hungary. While the absence of these factors can impede growth, their presence—especially in combination—offers substantial economic opportunities. Understanding these regional disparities is vital for stakeholders and policymakers committed to fostering balanced growth and national prosperity. It is also clear that further research might uncover additional factors that contribute to the economic vitality of Hungary’s counties, providing a more comprehensive picture of development drivers.

Author Contributions

Conceptualization, R.F., G.K. and M.K.; methodology, R.F.; formal analysis, R.F.; investigation, R.F.; writing—original draft preparation, R.F.; writing—review and editing, R.F., G.K. and M.K. All authors have read and agreed to the published version of the manuscript.

Funding

The reported study was funded by RFBR and FRLC according to the research project № 21-510-23002.

Institutional Review Board Statement

Not applicable.

Informed Consent Statement

Not applicable.

Data Availability Statement

Publicly available datasets of the Hungarian Central Statistics Office were analyzed in this study. This data can be found here: https://www.ksh.hu/stadat_eng?lang=en&theme=gdp (accessed on 15 September 2023).

Conflicts of Interest

The authors declare no conflict of interest.

References

  1. Anderson, James E., and Eric Van Wincoop. 2003. Gravity with gravitas: A solution to the border puzzle. American Economic Review 93: 170–92. [Google Scholar]
  2. Baldwin, Richard E., Philippe Martin, and Gianmarco I. P. Ottaviano. 2001. Global income divergence, trade, and industrialization: The geography of growth take-offs. Journal of Economic Growth 6: 5–37. [Google Scholar]
  3. Basboga, Kadir. 2020. The role of open borders and cross-border cooperation in regional growth across Europe. Regional Studies, Regional Science 7: 532–49. [Google Scholar] [CrossRef]
  4. Battisti, Michele, Filippo Belloc, and Massimo Del Gatto. 2021. Is the productivity premium of internationalized firms technology-driven? Empirical Economics 60: 3069–102. [Google Scholar] [CrossRef]
  5. Börjesson, Maria, and Jonas Eliasson. 2019. Should values of time be differentiated? Transport Reviews 39: 357–75. [Google Scholar] [CrossRef]
  6. Bottasso, Anna, Maurizio Conti, Claudio Ferrari, and Alessio Tei. 2014. Ports and regional development: A spatial analysis on a panel of European regions. Transportation Research Part A: Policy and Practice 65: 44–55. [Google Scholar]
  7. Bukvić, Lucija, Jasmina Pašagić Škrinjar, Borna Abramović, and Vladislav Zitrický. 2021. Route Selection Decision-Making in an Intermodal Transport Network Using Game Theory. Sustainability 13: 4443. [Google Scholar] [CrossRef]
  8. Calderon, Cesar A., and Luis Servén. 2004. The Effects of Infrastructure Development on Growth and Income Distribution. Available online: https://ssrn.com/abstract=625277 (accessed on 15 September 2023).
  9. Chen, Chia-Lin, and Peter Hall. 2011. The impacts of high-speed trains on British economic geography: A study of the UK’s InterCity 125/225 and its effects. Journal of Transport Geography 19: 689–704. [Google Scholar] [CrossRef]
  10. Di Berardino, Claudio, Ilaria Doganieri, Stefano D’Angelo, and Gianni Onesti. 2022. Intersectoral and intercountry linkages as drivers of employment growth in emerging economies: The case of Visegrád countries. Metroeconomica 74: 163–87. [Google Scholar] [CrossRef]
  11. Elekes, Zoltán, and Balázs Lengyel. 2020. Related trade variety, foreign-domestic spillovers and regional employment in Hungary. Acta Oeconomica 70: 551–70. [Google Scholar] [CrossRef]
  12. Esfahani, Hadi Salehi, and María Teresa Ramírez. 2003. Institutions, infrastructure, and economic growth. Journal of development Economics 70: 443–77. [Google Scholar] [CrossRef]
  13. Fedorenko, Roman, Irina Yakhneeva, Nadezhda Zaychikova, and Dmitry Lipinsky. 2021. Evaluating the Socio-Economic Factors Impacting Foreign Trade Development in Port Areas. Sustainability 13: 8447. [Google Scholar] [CrossRef]
  14. Fedorenko, Roman Vladimirovich, and Galina Anatolievna Khmeleva. 2021. Preferential Treatment as a Tool for Managing the Coastal Area Sustainable Development: The Case of the Vladivostok Free Port. Journal of Marine Science and Engineering 9: 329. [Google Scholar] [CrossRef]
  15. Ferrari, Claudio, Olaf Merk, Anna Bottasso, Maurizio Conti, and Alessio Tei. 2012. Ports and Regional Development: A European Perspective. Available online: https://oecd-ilibrary.org (accessed on 15 September 2023).
  16. Fujita, Masahisa, and Jacques-François Thisse. 1996. Economics of agglomeration. Journal of the Japanese and International Economies 10: 339–78. [Google Scholar] [CrossRef]
  17. Gallup, John Luke, Jeffrey D. Sachs, and Andrew D. Mellinger. 1999. Geography and economic development. International Regional Science Review 22: 179–232. [Google Scholar] [CrossRef]
  18. GDP per Capita (current US$)—Hungary. n.d. Available online: https://data.worldbank.org/indicator/NY.GDP.PCAP.CD?locations=HU (accessed on 15 September 2023).
  19. Gross Domestic Product (GDP) by County and Region [at Purchasers’ Prices, Million HUF]. n.d. Available online: https://www.ksh.hu/stadat_files/gdp/en/gdp0077.html (accessed on 15 September 2023).
  20. Grzegorzewska, Emilia, and Renata Stasiak-Betlejewska. 2021. International Competitiveness of the Visegrad Group Countries on the Furniture Market. In The Response of the Forest-Based Sector to Changes in the Global Economy. Edited by Jost Mastej. Koper: WoodEMA, pp. 147–52. [Google Scholar]
  21. Jarosz-Angowska, Aneta, Anna Nowak, Elżbieta Kołodziej, and Hanna Klikocka. 2022. Effect of European Integration on the Competitiveness of the Agricultural Sector in New Member States (EU-13) on the Internal EU Market. Sustainability 14: 13124. [Google Scholar] [CrossRef]
  22. Kálmán, Botond, and Arnold Tóth. 2021. Links between the economy competitiveness and logistics performance in the Visegrád Group countries: Empirical evidence for the years 2007–2018. Entrepreneurial Business and Economics Review 9: 169–90. [Google Scholar] [CrossRef]
  23. Krugman, Paul. 1991. Increasing returns and economic geography. Journal of Political Economy 99: 483–99. [Google Scholar] [CrossRef]
  24. Krugman, Paul. 1996. Making Sense of the Competitiveness Debate. Oxford Review of Economic Policy 12: 17–25. [Google Scholar] [CrossRef]
  25. Liao, R. 2017. Supernetwork-Based Risk Management of Customs Logistics Monitoring System. Complex Systems and Complexity Science 14: 39–45. [Google Scholar]
  26. Logistics Sector in Hungary. n.d. Available online: https://www.flandersinvestmentandtrade.com/export/sites/trade/files/market_studies/2019-Hungary_Logistics.pdf (accessed on 15 September 2023).
  27. Lomachynska, Iryna, and Ivelyna Podgorna. 2018. Innovation potential: Impact on the national economy competitiveness of the EU developed countries. Baltic Journal of Economic Studies 4: 262–70. [Google Scholar] [CrossRef]
  28. Lomachynska, Iryna, Vitalina Babenko, Olha Yemets, Sergey Yakubovskiy, and Robert Hryhorian. 2020. Impact of the foreign direct investment inflow on the export growth of the Visegrad group countries. Estudios de Economia Aplicada 38: 1–11. [Google Scholar] [CrossRef]
  29. Lugovoy, Oleg, Vladimir Dashkeev, Ilya Mazayev, Denis Fomchenko, Evgeny Polyakov, and Alfred Hecht. 2007. Analysis of Economic Growth in Regions: Geographical and Institutional Aspect. Available online: https://ssrn.com/abstract=1268088 (accessed on 15 September 2023).
  30. Minárik, Marek, Stanislav Zábojník, and Janka Pásztorová. 2022. Sources of Value-Added in V4 Automotive GVCs: The Case of Transport and Storage Services and Firm-Level Technology Absorption. Central European Business Review 11: 1. [Google Scholar] [CrossRef]
  31. Nagy, Judit, Judit Oláh, Edina Erdei, Domicián Máté, and József Popp. 2018. The Role and Impact of Industry 4.0 and the Internet of Things on the Business Strategy of the Value Chain—The Case of Hungary. Sustainability 10: 3491. [Google Scholar] [CrossRef]
  32. Neuberger, Sabine, Helmut W. Saatkamp, Alfons G. J. M. Oude Lansink, and Dietrich Darr. 2021. Can differences in innovativeness between European cross-border regions be explained by factors impeding cross-border business interaction? PLoS ONE 16: e0258591. [Google Scholar] [CrossRef] [PubMed]
  33. Nordhaus, William D. 2006. Geography and macroeconomics: New data and new findings. Proceedings of the National Academy of Sciences 103: 3510–17. [Google Scholar] [CrossRef]
  34. Oláh, Judit, Attila Bai, György Karmazin, Péter Balogh, and József Popp. 2017a. The Role Played by Trust and Its Effect on the Competiveness of Logistics Service Providers in Hungary. Sustainability 9: 2303. [Google Scholar] [CrossRef]
  35. Oláh, Judit, György Karmazin, Károly Pető, and József Popp. 2017b. Information technology developments of logistics service providers in Hungary. International Journal of Logistics Research and Applications. [Google Scholar] [CrossRef]
  36. Otsuka, Noriko, Felix Christian Günther, Ilaria Tosoni, and Cecilia Braun. 2017. Developing trans-European Railway Corridors: Lessons from the Rhine-Alpine Corridor. Case Studies on Transport Policy 5: 527–36. [Google Scholar] [CrossRef]
  37. Pawera, René, František Vojtech, Michal Levický, and Stanislav Filip. 2020. Effects and motivation of political—economic cooperation between two countries: A case study of Slovakia and Austria. Journal Entrepreneurship and Sustainability Issues 8: 454–70. [Google Scholar] [CrossRef]
  38. Pinder, David. 2017. Regional Economic Development and Policy: Theory and Practice in the European Community. London: Routledge. [Google Scholar]
  39. Radosevic, Slavo. 2002. Regional Innovation Systems in Central and Eastern Europe: Determinants, Organizers and Alignments. The Journal of Technology Transfer 27: 87–96. [Google Scholar] [CrossRef]
  40. Rasvanis, Evangelos, and Vassilis Tselios. 2023. Do geography and institutions affect entrepreneurs’ future business plans? Insights from Greece. Journal of Innovation and Entrepreneurship 12: 3. [Google Scholar] [CrossRef]
  41. Resmini, Laura. 2010. Regional Patterns of Industry Location in Transition Countries: Does Economic Integration with the European Union Matter? Regional Studies 41: 747–64. [Google Scholar] [CrossRef]
  42. Rodrik, Dani, Arvind Subramanian, and Francesco Trebbi. 2004. Institutions rule: The primacy of institutions over geography and integration in economic development. Journal of Economic Growth 9: 131–65. [Google Scholar] [CrossRef]
  43. Rymarczyk, Jan. 2020. Technologies, opportunities and challenges of the Industrial Revolution 4.0: Theoretical considerations. Entrepreneurial Business and Economics Review 8: 185–98. [Google Scholar] [CrossRef]
  44. Šakalys, Raimondas, and Nijolė Batarlienė. 2017. Research on Intermodal Terminal Interaction in International Transport Corridors. Procedia Engineering 187: 281–88. [Google Scholar] [CrossRef]
  45. Schumann, Tilo, Michael Mönsters, Christian Meirich, and Bärbel Jäger. 2018. NGT CARGO—Concept for a high-speed freight train in Europe. WIT Transactions on the Built Environment 181: 555–65. [Google Scholar] [CrossRef]
  46. Seo, Young Joon, Feilong Chen, and Sae Yeon Roh. 2017. Multimodal Transportation: The Case of Laptop from Chongqing in China to Rotterdam in Europe. Asian Journal of Shipping and Logistics 33: 155–65. [Google Scholar] [CrossRef]
  47. Stimson, Robert J., Roger R. Stough, and Brian H. Roberts. 2006. Regional Economic Development: Analysis and Planning Strategy. Berlin and Heidelberg: Springer Science & Business Media. [Google Scholar]
  48. Szakálné Kanó, Izabella, Balázs Lengyel, Zoltán Elekes, and Imre Lengyel. 2019. Agglomeration, foreign firms and firm exit in regions under transition: The increasing importance of related variety in Hungary. European Planning Studies 27: 2099–122. [Google Scholar] [CrossRef]
  49. Tóth, Bálint L. 2019. The Visegrád Group and the railway development interest articulation in Central Eastern Europe. Eastern Journal of European Studies 10: 175–95. Available online: https://ejes.uaic.ro/articles/EJES2019_1002_TOT.pdf (accessed on 20 September 2023).
  50. Vámos, Péter. 2022. This is a Favorable Moment for Us to Move Forward with Hungarian–Hungarian-Taiwanese relations. East Central Europe 49: 46–70. [Google Scholar] [CrossRef]
  51. Wang, Fayuan, Rong Wang, and Zhili He. 2022. Exploring the Impact of “Double Cycle” and Industrial Upgrading on Sustainable High-Quality Economic Development: Application of Spatial and Mediation Models. Sustainability 14: 2432. [Google Scholar] [CrossRef]
  52. Włodarczyk, Aneta, and Agata Mesjasz-Lech. 2019. Development of Road Transport Logistic Infrastructure and Air Pollution in the Visegrad Group Countries. Journal of Economic and Social Development 6: 93–103. [Google Scholar] [CrossRef]
  53. Zábojník, Stanislav, Denisa Čiderová, and Daniel Krajčík. 2020. Competitiveness in International Business. Prague: Wolters Kluwer. [Google Scholar]
Figure 1. Differences in the GDP level of the Hungarian counties (2020) (forints).
Economies 11 00278 g001
Figure 2. Empty matrix for representing results.
Economies 11 00278 g002
Figure 3. Economic Performance of Hungarian Counties (2000–2020). Source: Compiled by the authors based on data from the Hungarian Central Statistical Office.
Economies 11 00278 g003
Figure 4. County-wise GDP change, 2001–2020.
Economies 11 00278 g004
Figure 5. County-wise GDP per capita growth rate (2001–2020). Source: Compiled by the authors in Python based on data from the Hungarian Central Statistical Office.
Economies 11 00278 g005
Figure 6. GDP per capita change and growth rate matrix for non-capital Hungarian counties (2000–2020).
Economies 11 00278 g006
Figure 7. GDP change and growth rate matrix for non-capital Hungarian counties (2000–2020). Source: Compiled by the authors in Python based on data from the Hungarian Central Statistical Office.
Economies 11 00278 g007
Table 1. Analyzed international, national, regional, and local documents.
Information SourceInformation TypeReference
World Bank GroupData on the volume of the gross domestic product of Hungary for 2000–2021.https://data.worldbank.org (GDP per Capita (current US$)—Hungary n.d.)
Hungarian Central Statistics OfficeData on the volumes of the gross regional product of individual counties of Hungary for 2000–2021https://www.ksh.hu (Gross Domestic Product (GDP) n.d.)
Flanders Investment and TradeHungarian logistics infrastructure datahttps://www.flandersinvestmentandtrade.com (Logistics Sector in Hungary n.d.)
Table 2. Analyzed counties and their labels.
CountyBorder RegionRailroadRiver PortsLabel
FejerFalseTrueFalseFej_R
Komarom-EsztergomTrueTrueTrueKom_BRP
VeszpremFalseFalseFalseVes
Gyor-Moson-SopronTrueTrueTrueGyo_BRP
VasFalseFalseFalseVas
ZalaTrueFalseFalseZal_B
BaranyaTrueFalseFalseBar_B
SomogyTrueTrueFalseSom_BR
TolnaFalseFalseTrueTol_P
Borsod-Abauj-ZemplenTrueTrueFalseBor_R
HevesFalseFalseFalseHev
NogradTrueFalseFalseNog_B
Hajdu-BiharTrueTrueFalseHaj_BR
Jasz-Nagykun-SzolnokFalseFalseFalseJas
Szabolcs-Szatmar-BeregTrueTrueFalseSza_BR
Bacs-KiskunTrueFalseTrueBac_BP
BekesTrueFalseFalseBek_B
Csongrad-CsanadTrueFalseTrueCso_BP
Table 3. The average indicators of GDP and GDP per capita in 2000–2020, Hungarian non-capital counties.
CountyAverage GDP,
Millions HUF
ShareAverage GDP per Capita,
Thousands HUF
Share
Gyo_BRP1,606,45710.39%56178.37%
Fej_R1,211,2277.84%48857.28%
Kom_BRP905,6935.86%47507.08%
Vas709,3334.59%41616.20%
Bac_BP1,129,5837.31%40195.99%
Cso_BP911,5935.90%38055.67%
Tol_P503,8003.26%37525.59%
Ves775,8255.02%37405.58%
Hev640,1974.14%36905.50%
Haj_BR1,159,6667.50%36055.37%
Bor_R1,324,9598.57%35345.27%
Zal_B665,3794.30%35195.25%
Jas733,3974.74%34045.07%
Bar_B754,8684.88%33074.93%
Som_BR595,3623.85%31784.74%
Bek_B633,0234.10%29954.46%
Sza_BR927,0526.00%28854.30%
Nog_B270,4381.75%22373.33%
Table 4. Ranking of Hungarian Counties by GDP Change Performance (2001–2020).
RankCountyLabelNumber of Higher Years
1Fejer Fej_R16
2Bacs-KiskunBac_BP13
3Gyor-Moson-SopronGyo_BRP13
4Komarom-EsztergomKom_BRP12
5ZalaZal_B12
6TolnaTol_P10
7Csongrad-CsanadCso_BP10
8VasVas10
9BaranyaBar_B8
10Heves Hev8
11Hajdu-BiharHaj_BR8
12VeszpremVes7
13Borsod-Abauj-ZemplenBor_R7
14Jasz-Nagykun-SzolnokJas5
15SomogySom_BR3
16BekesBek_B3
17NogradNog_B2
18Szabolcs-Szatmar-BeregSza_BR2
Table 5. Ranking of Hungarian counties by GDP per capita growth rate performance (2001–2020).
RankCountyLabelNumber of Higher Years
1Bacs-KiskunBac_BP11
2ZalaZal_B11
3Fejer Fej_R10
4TolnaTol_P10
5Szabolcs-Szatmar-BeregSza_BR10
6Heves Hev10
7Komarom-EsztergomKom_BRP10
8Csongrad-CsanadCso_BP10
9Gyor-Moson-SopronGyo_BRP10
10SomogySom_BR9
11BaranyaBar_B9
12NogradNog_B9
13Hajdu-BiharHaj_BR9
14Borsod-Abauj-ZemplenBor_R9
15BekesBek_B9
16Jasz-Nagykun-SzolnokJas9
17VasVas8
18VeszpremVes7
Disclaimer/Publisher’s Note: The statements, opinions and data contained in all publications are solely those of the individual author(s) and contributor(s) and not of MDPI and/or the editor(s). MDPI and/or the editor(s) disclaim responsibility for any injury to people or property resulting from any ideas, methods, instructions or products referred to in the content.

