Article

Green Governance and Sustainability Report Quality: The Moderating Role of Sustainability Commitment in ASEAN Countries

by
Chairina Chairina
1,2 and
Bambang Tjahjadi
1,*
1
Faculty of Economics and Business, University Airlangga, Surabaya 60286, Indonesia
2
Faculty of Economics and Business, University Lambung Mangkurat, Banjarmasin 70123, Indonesia
*
Author to whom correspondence should be addressed.
Economies 2023, 11(1), 27; https://doi.org/10.3390/economies11010027
Submission received: 10 October 2022 / Revised: 13 December 2022 / Accepted: 25 December 2022 / Published: 12 January 2023
(This article belongs to the Special Issue Determinants of Firm Performance in Developing Countries)

Abstract

:
This study aims to examine the role of green governance in the quality of sustainability reports. We also examine the moderating role of sustainability commitment between green governance and the quality of sustainability reports. This research is a quantitative study by using unbalanced data panels. The study retrieves the samples from the companies listed on the ASEAN Stock Exchange that published sustainability reports from 2015 to 2019. The research finding shows that the board’s independence, board diversity, and sustainability commitment are significantly associated with the quality sustainability reports. Moreover, the board size indicates a low effect on the reliability and the chief sustainability officer on the conciseness of sustainability reports. Meanwhile, it has not been possible to prove that the presence of sustainability committee can lead effect on the report quality. The sustainability commitment also moderates female directors and the quality of sustainability reports. Other findings are obtained from the company’s characteristics where company size and type of industry are positively correlated with the quality of sustainability reports. This study has several limitations. First, some companies that are under observation spend money on social costs, but the amounts are not clearly disclosed. Second, this research only focuses on three quality aspects: conciseness, clarity, and reliability. These research findings contribute to the following scopes. First, how green governance and commitment to sustainability help improve the quality of corporate reporting. Second, the investors should invest in companies that apply good green governance and sustainability commitment. Third, companies with strong commitments to sustainability and good corporate governance are competitive resources that support businesses in growing, attracting more investment, and earning stakeholders’ trust. Lastly, this research also contributes to the agency and the resource-based view theories related to the green governance and the sustainability reports’ quality of ASEAN countries.

1. Introduction

Sustainability reporting practices have increased significantly in the last two decades. This phenomenon has been caused by the number of companies publishing social and environmental responsibility information in annual reports, sustainability reports, and integrated reports on their websites. Sustainability reporting is a development of the Triple Bottom Line (TBL) concept. Previously, business was only oriented to one P (Profit); now, it has developed into the Triple P model (Profit, Planet, People). The corporate sustainability concept describes the companies’ abilities to create value and the ability to stand in the long term. Mahmood (2018) argues that sustainability activities and governance practices are essential in company operations because the governance practices are designed for all interests within the organizational context.
Green governance is a concept that bridges conflicts between humans and nature through a set of institutional rules. In other words, the green governance action ensures that decision-making maintains sustainable operations in terms of their economic, social, and environmental aspects (Mahmood and Orazalin 2017; Post et al. 2011). The sustainability performance succeeds when it is supported by the company’s commitment to energy-saving, reducing environmental impacts, using natural resources effectively and efficiently, developing human resources, as well as invest in the community, so that the company is sustainable. Green governance, which is supported by a sustainability commitment, is expected to have a positive impact by improving sustainability performance and disclosure quality (Aznar et al. 2016). Several studies explain that green governance has an important role in the quality sustainability report and sustainability performance (García-Sánchez et al. 2019; Mahmood and Orazalin 2017; Amran et al. 2014; Post et al. 2011). Sustainability report quality (SRQ) faces challenges in terms of reliability and transparency. Hussain and Rigoni (2018) argue that company management has control over the reporting process so that information is only disseminated if it has a positive impact on the company rather than providing transparent and accountable information to stakeholders. However, stakeholders’ demands for ethical or socially responsible investments are increasing. As a result, the need for quality sustainability reports is also increasing. According to agency theory there is a relationship between corporate governance practices and corporate disclosure practices. Good governance practices will strengthen the company’s internal control in terms of environmental protection, reduce opportunistic management behavior and information asymmetry, and improve reporting quality. Meanwhile, the resource-based view (RBV) theory explains that companies must use resources effectively to achieve strategic goals. The board is a strategic resource responsible for confirming the management interests, the shareholders, and other stakeholders. The values and attitudes of boards, managers, and committees regarding sustainability are very important for the company’s success or failure (Jo and Harjoto 2011; Naciti 2019).
Previous research has examined the board size and the proportion independent board members on the effect of sustainability reports (Naciti 2019; Mason 2019; Liu et al. 2020). However, Amran et al. (2014) do not find a significant relationship between the existence of a board and the voluntary disclosure since the governance practices have a deficiency, such as the lack of disclosure caused by the low level of the effectiveness and reliability of internal control mechanisms. The board diversity affects the quality of sustainability reports (Post et al. 2011; Hussain and Rigoni 2018; García-Sánchez et al. 2019; Arayssi et al. 2020). In contrast, Adams (2015) argues that female directors have the same impact as male directors. Furthermore, a chief sustainability officer (CSO) is an executive manager who is responsible to the program design, and has the duty of implementing and reporting the sustainability activities (Peters and Romi 2012; Fu et al. 2019). However, Menz and Scheef (2014) find no evidence that the existence of a CSO improved the company’s performance. In order to ensure that the CSO has carried out his or her duties and functions, a sustainability committee is needed. A special committee that deals with sustainability or CSR, is expected to play an important role in ensuring that the CSR perspective is serving as a part of the organization’s strategic direction and to apply it into a real action (Amran et al. 2014; Hussain and Rigoni 2018; Arayssi et al. 2020). However, according to Berrone and Gomez-Mejia (2009), the committee’s role does not run optimally. Rodrigue et al. (2013) state that the presence of the sustainability committee provides only symbolic legitimacy the eyes to the public, rather than having substantive effects.
The findings of this study still yield inconsistent results. Therefore, this study propose a moderating variable that potentially strengthens the relationship between green governance and the quality of sustainability reports, namely sustainability commitment, this is because (1) the company’s success in the future is not only influenced by green governance practices but also needs to be supported by a strong commitment to sustainability activities (Aznar et al. 2016); and (2) commitment is an intangible resource that helps organizations gain a competitive advantage. However, the relationship between commitment to sustainability and performance has not been widely studied. This is because sustainability commitments must be initiated effectively in the company to lead to performance improvement (Luzzini et al. 2015). In this study, the sustainability commitments are measured by social costs (Rhou et al. 2016). The uniqueness of this research is (1) measuring the quality of sustainability report is placed on conciseness, clarity, and reliability (García-Sánchez et al. 2019); (2) the use of sustainability commitment measured by social costs as a moderating variable; and (3) the research focuses on the phenomenon of the quality of sustainability reports in ASEAN countries.
The trend of sustainability reports in ASEAN countries has also increased in line with the formation of the ASEAN CSR Network (ACN) community through the ASEAN Foundation. ASEAN countries have a unique geographical location; therefore, it is not easy to bridge the environmental sustainability issues to the economic development of other regions. The high growth of the economic sector that improves prosperity is not well-balanced by attention to environment and social investment. As a result, it can be a problem for the company’s sustainability in the future (Loh et al. 2018). Therefore, the ASEAN CSR Network has a responsibility to promote the social responsibility (CSR) agenda in all ASEAN into the visions and missions of companies. Furthermore, it is expected that the investment will contribute to the sustainable social and economic development; therefore, it will make ASEAN countries a better place to live (Loh et al. 2018; Husni Syam et al. 2020).
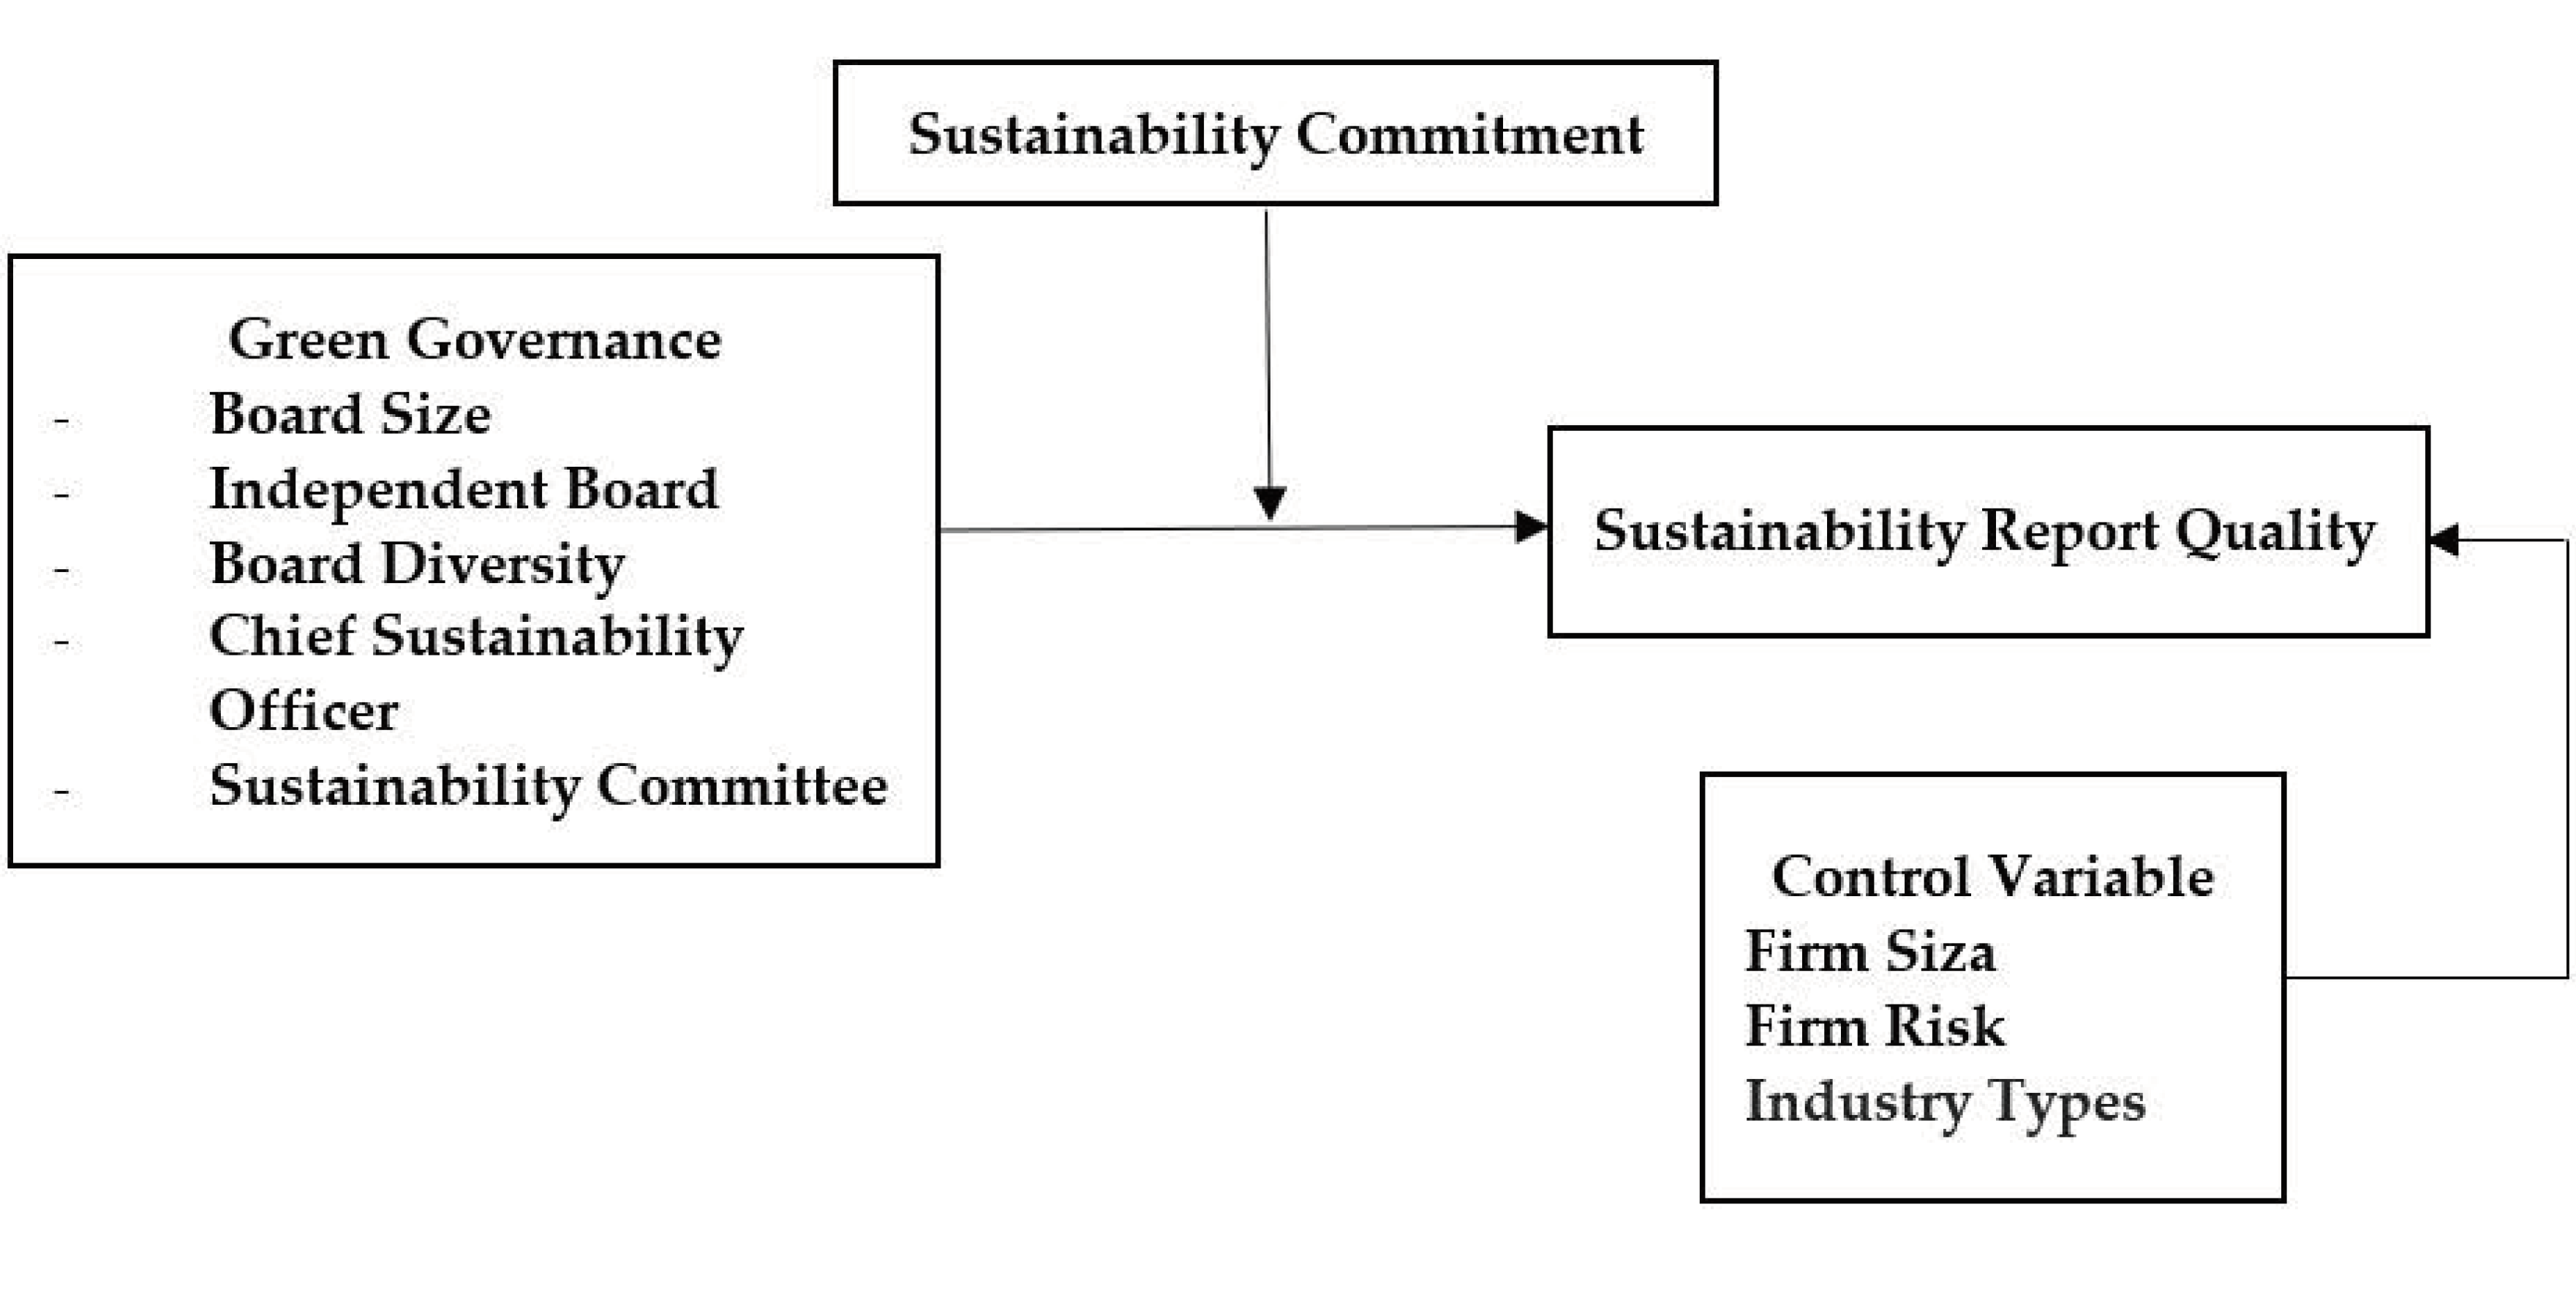
This study examines the effect of green governance on the quality of sustainability reports. Then, we examine the moderating role of sustainability commitment to the relationship between green governance and the quality of sustainability reports. The study is based on a sample comprising 409 observations from 154 companies in six ASEAN countries: Indonesia, Malaysia, Singapore, Thailand, the Philippines, and Vietnam. These six countries have developing capital markets and since 2012, they have started a securities transaction connectivity program to encourage the growth of the ASEAN capital market and to expand all investment opportunities. The findings of this study are expected to encourage the business organizations in ASEAN to improve sustainability practices based on good governance and high commitment in the future. Ultimely, this will help to improve the sustainability reports’ quality.
This paper is organized into five sections including the introduction section. Section 2 reviews the literature and develops the hypotheses. Section 3 describes the method or approach used in this research. The results and analysis are presented and discussed in Section 4 and Section 5, the authors provide conclusions, implications, and suggestions for future research.

2. Literature Review and Hypothesis Development

2.1. Literature Review

Sustainability reporting is a company’s communication process in demonstrating its responsibilities to stakeholders. Sustainability reporting presents the company’s values, business strategies, and commitment to a sustainable economy (Dilling 2016). The phenomenon of disclosure of sustainability reporting in Southeast Asian countries (ASEAN) continues to increase along with business taking responsibility for social, environment, and economic matters. ASEAN countries have unique geographical locations, and it is not easy to harmonize environmental sustainability issues with economic development compared to other regions. The growth of the economic sector seeks to increase prosperity; there is no development by investing in the environment and society so that the companies perform well in the future (Loh et al. 2018).
The ASEAN CSR Network (ACN) was established in December 2010 as a form of regional cooperation in CSR implementation, capacity building, information exchange, and relations between the business world and ASEAN countries and as well as other international organizations. According to the results of research conducted by the ASEAN CSR Network and the National University of Singapore, the EES (Economic, Environment, and Social) level is quite adequate. Go Public Companies in Malaysia and Singapore have demonstrated excellent performance with average levels of 64.5% and 61.7%, respectively. The score for Thailand is 60% and the Philippines has a score of 56.3%. Meanwhile, Indonesia has an even lower rate of 53.6%. ASEAN countries that have higher performance are good for two reasons, namely (1) companies are consistent in implementing governance and (2) they have good law enforcement. Malaysia, Singapore, and Thailand are listed at the top of the rankings because these three countries have fairly good governance. Malaysia has a clear Corporate Governance (CG) Code of Ethics, Singapore has strengthened law enforcement and developed good corporate culture, and Thailand has a policy of reducing the roles and responsibilities of the board. These three countries have clear government policies and regulations to encourage the establishment of existing public companies (Loh et al. 2018).
The theoretical framework and the hypothesis development of this study are based on agency theory and resource-based view theory (RBV) to identify the factors that drive the organizational SRQ. Combining the agency theory and RBV, framework assume that managers should increase the social responsibility disclosure as a tool to improve social and environmental behavior in certain areas, as this affects the organization’s reputation and the important external resources that determine the success of the organization. From the perspective of agency theory, it describes a potential conflict when the interests of the agent and the principal have different goals. This may be caused by the existence of information asymmetry, opportunistic behavior, and conflicts of interest between managers and shareholders. Good governance practices are expected to balance the company’s activities with environment and align them to all stakeholder interests, and, in so doing the company may gain social legitimacy (Shamil et al. 2014).
The RBV theory explains that the driving factor for competitive advantage is the effective allocation of resources. Resources that are managed effectively will be a good signal that management is creating a competitive advantage for the company. (Supriyati and Tjahjadi 2017). In this study, this opinion about a resource-based approach was adopted to provide theoretical arguments for two reasons. Firstly, to admit the invisible resources such as information, skills, knowledge, commitments, suppliers, customers, public policies, social groups, governance and legitimacy, and others, which help the company to gain a competitive advantage. Secondly, to establish the importance of building the company’s external and internal relationships to meet its interests in term of developing unique and relevant resources. Companies that have a good internal governance structure and are able to respond to the demands of the external environment will have a sustainable advantage in the future (Mahmood and Orazalin 2017). Therefore, these two theories are appropriate to support sustainability reporting practices and to provide explanatory power in assessing reporting quality.

2.2. Hypothesis Development

2.2.1. Green Governance and the Quality Sustainability Reports

The board of directors is a source of excellence for sustainable competition (Amran et al. 2014; Lone et al. 2016; Nursimloo et al. 2020). The level of the board is expected to be one of the main determinants of the corporate governance mechanism for conducting effective business operations. An effective board will maintain organizational resources by reducing the opportunism problem, resulting in a higher SRQ. The board size has a positive effect on CSR practices. They have a professional experience that strengthens the decision-making process (Correa-Garcia et al. 2020). Agency theory posits that a large board size will help to reduce agency costs by engaging in more socially responsible activities. A larger number of board and members that consist of various groups can provide more input into the company’s SR practices; thereby, they may expand the area and improve the quality of SR practices (Frias-Aceituno et al. 2013). Building a larger board of directors with various stakeholder groups can enhance the organization’s corporate reputation, and in the end, it may increase its legitimacy in a wider social context. Based on this description, the following proposed hypotheses are proposed in this study:
H1. 
The board size is positively related to sustainability report quality.
The independent board comprises independent-non-executive directors who are not originally from the company and are not affiliated with any group. They conduct independent board work in supervising, providing advice to the CEO, and protecting the rights of stakeholders. According to agency theory, it is important to improve the governance practices and limit the opportunistic behavior of managers so that they can improve the company’s reputation and improve reporting quality (Vu et al. 2011; Chams and García-Blandón 2019; Novitasari and Bernawati 2020). Nevertheless, Baysinger and Butler (1985) have found that boards with a higher proportion of independent boards can lead to excessive monitoring and Goodstein et al. (1994) also find that boards with a higher position of independent board members may prevent companies from engaging in strategic actions. Furthermore, Eng and Mak (2003), have discovered a negative impact of ownership structure and board composition on voluntary disclosure in Singapore. Nasih et al. (2019) find that the conservative behavior of independent board members tends to reveal itself in lower carbon emissions in Indonesia. Based on this description, the following hypothesis is proposed:
H2. 
The proportion of independent board members is negatively related to sustainability report quality.
The concept of diversity relates to board composition attributes. One of the main characteristics of board diversity is gender. Gender diversity refers to the presence of women in the board structure. Gender diversity has been proven to relate positively to sustainability reporting quality (Al-Shaer and Zaman 2016). In addition, female directors have personality values, communication patterns, and leadership styles that are different from male directors in seeing the goals of the organization. (Chandani and Rathnayaka 2018; Chams and García-Blandón 2019; Arayssi et al. 2020). Moreover, female directors tend to have more participatory and democratic leadership style to improve the quality of decision-making and supervision. They are seen as being more sensitive in making decisions related to social and the environmental activities and thereby, they may encourage more disclosure of activities (Liao et al. 2014; DeBoskey et al. 2018; García-Sánchez et al. 2019). The ratio of women’s leadership increases in line with the company’s commitment to support the achievement the Sustainable Development Goals (SDGs) on Gender Equality since female directors have the ability to build good communication and trust from all sides, thereby, reducing conflict and asymmetry of information (Husted and Sousa-Filho 2019). Based on this description, the following hypothesis is proposed:
H3. 
Female directors are positively related to sustainability report quality.
Chief sustainability officers (CSOs) are executive managers in the top management teams (TMT) working to manage their companies’ sustainability performance. They play a role in formulating, executing, and supervising the company’s sustainability strategy. They evaluate business practices, analyze social needs, and propose strategies that integrate profit growth with sustainable development. In addition, the CSO plays a role in maintaining stakeholder relationships, hiring employees, and fostering a culture of sustainability in the company (Fu et al. 2019). The educational background and experience of the CSO enable them to have a good understanding of social and environmental issues, and thereby, increasing the quality of sustainability reporting and reducing the company’s operational risks (Peters and Romi 2012). Therefore, the competence of the CSO in communicating with the community is important to overcoming conflict and increasing disclosure of the company’s social and environmental activities more transparently. Based on this description, the following hypothesis for this study is proposed:
H4. 
The Chief Sustainability Officer is positively related to sustainability report quality.
A Special sustainability committee’s existence as one of the governance mechanisms has an important role in the company. It is expected to increase the oversight of better sustainability performance (Haque 2017; Hussain and Rigoni 2018) which plays an important role in ensuring that the CSR perspective is embedded in organization’s strategic direction and translated into real actions. According to the results of previous research, the sustainability committee has a positive effect on the company’s social and environmental performance (Amran et al. 2014; Chams and García-Blandón 2019; Orazalin 2020; Arayssi et al. 2020). According to RBV theory, the existence of a sustainability committee (that is reponsible for CSR) is seen as a company’s resource capital. The experience, skills, and the knowledge expected from the sustainability perspective become a part of the company’s strategy and can be applied through real actions by saving energy, reducing carbon emissions, and increasing employee awareness of environmental impacts. The existence of the sustainability committee is a form of accountability and a medium for communication with external stakeholders (Liao et al. 2014). Based on this description, the following hypothesis is proposed:
H5. 
The Sustainability Committee is positively related to sustainability report quality.

2.2.2. Green Governance, the Sustainability Commitment and Sustainability Report Quality

In the context of sustainability, a commitment to sustainability is a company’s desire to stay or survive in an environment by considering or analyzing economic values. Sustainability commitment is an integral part of the company’s business strategy (Jo and Harjoto 2011; Amran et al. 2014). The rationalization process of social costs as a form of commitment to sustainability, is a company strategy to reduce the possibility of claims from the community and serves as an organizational identity (Soewarno et al. 2019).
The accountability and transparency for sustainability activities must be carried out with stakeholders. The social costs incurred are real investments in the environment and society that will have an impact the company’s economic value. Social costs such as environmental costs, restoration, reduction of carbon emissions, waste management, R&D to improve the quality of environmentally friendly products, and other costs are the company’s efforts to avoid socially irresponsible and environmentally demaging actions.
Sustainability reports are the right form of media to disclose information about the sustainability of activities because they comprise content that is used by management to convey their environmental, social, and economic responsibilities. A social cost is a form of the company’s partiality to the environment and society. It contains a legitimate motive to gain recognition from stakeholders to reduce the negative impact of their claims. Besides reducing the estimation gap, social costs can also improve the image and reputation in the eyes of the public (corporate image). Therefore, the greater the social costs as a form of company commitment, the higher the quality of sustainability reporting will be (Eide et al. 2020). Based on this description, the following hypothesis is proposed:
H6. 
Sustainability Commitment moderates the relationship between green governance and sustainability report quality.
Figure 1 explains the conceptual model of this research, which describes the relationship between green governance, sustainability commitment and sustainability report quality.

3. Methodology

3.1. Data and Sample Collection

This study has involved companies from almost all sectors except the financial sector listed on the Stock Exchange in Indonesia, Malaysia, Singapore, Thailand, Philippines, and Vietnam. They are the members of ASEAN that published sustainability reports and disclosed the number of social costs during the observation period 2015–2019. The final sample consisted of 154 companies with 409 yearly observations using unbalanced data. The data used in this study have been obtained from the GRI Database, the companies’ websites, and the OSIRIS database. Table 1 presents the distribution of the samples by industry.

3.2. Definition and Measurement

All the variables used in this study used quantitative data. Research variables are measured based on theory and previous research according to the context of this study (See Table 2). Previous studies on the sustainability report quality (SRQ) are measured it by using the conciseness indicator obtained from the natural logarithm of the number of pages in all sustainability reports. Clarity is measured as the natural logarithm from the total number of words, while reliability is measured by the existence of a guarantee statement from a third party originating from professional institution concerned with sustainability report assurance (García-Sánchez et al. 2019).
Furthermore, green governance that consists of Board Size is the representation of the board of non-executive structure in corporate governance (Mahmood and Orazalin 2017). The Independent Board is the percentage of independent non executives who are not originally from the company and have no relationship or affiliation with its owners and management (Tang et al. 2018; Hussain and Rigoni 2018). The Gender Diversity of Directors is the representation of females in the board of directors’ structure in corporate governance (Hussain and Rigoni 2018). The CSO is an executive manager in charge of formulating, executing, and supervising the company’s sustainability strategy (Fu et al. 2019). The Sustainability Committee is formed to ensure that the sustainability/CSR perspective is embedded as part of the strategic direction and to apply it through concrete actions. Interaction variables with social costs are total expenditures (1) environmental costs (2) carbon emission reduction costs (3) CSR costs (4) education and training costs, and (5) R&D costs.
Finally, the results were controlled for firm characteristics, including firm size, firm risk, and industry type. The size represents the scale of the company as measured by the logarithm of the total assets (Hussain and Rigoni 2018; Arayssi et al. 2020). The Leverage Ratio represents the debt risk which is measured as the ratio of total debt to total equity (Chams and García-Blandón 2019; Arayssi et al. 2020). Industry type is a group of industries where based on the complexity and the company’s operations risk (Amran et al. 2014; Chams and García-Blandón 2019).

3.3. Analysis Data

This is one example of an equation: The inferential statistics involved in this study use the PLS method. This method was chosen based on the consideration of the existence of a construct that was formed with reflective indicators as a manifest of the construct domain. In this study, the sustainability report quality construct was formed with three indicators: conciseness, clarity, and reliability. Furthermore, the researchers tested the effect of green governance on the quality of sustainability reports partially with conciseness (Model 1), clarity (Model 2), reliability (Model 3), and an aggregate test of conciseness, clarity, and reliability of sustainability reports (Model 4). Sustainability commitment was examined and measured by social costs as a variable with a moderating effect on the relationship between green governance and the quality of sustainability reports. The moderating effect is seen from the coefficient of the Green Governance * Social Cost coefficient (BSIZE_SCOST, BIND_SCOST, BGEND_SCOST, CSO_SCOST, and COMMSCR_SCOST).

4. Results and Discussion

4.1. Descriptive Statistics

Table 3 describes some of the descriptive statistics (i.e., the mean and the standard deviation), and Table 4 describes the discriminant validity to all variables for analysis.

4.2. Structural Analysis Model

Table 5 shows the test of the effect of the green governance toward the sustainability reports’ quality. Green governance is proxided by the board size, the independent board, and the female directors. Meanwhile, the sustainability report quality is proxided by its conciseness, clarity, and reliability.
The findings from Table 5 obtained various results and stated that board size is positive and that the significance on reliability is 0.208, p < 0.01, but has no effect on clarity, conciseness, and aggregate SRQ. This shows that the first hypothesis is partially supported (H1). The results of this study are consistent with research by Mahmood and Orazalin (2017), and show that the board size relates to the reliability of sustainability information. They also influence the company’s decision to have external and independent assurance on its sustainability reports. However, this is greatly influenced by the existence of regulations or suggestions from these guidelines. At the same time, sample distribution data (Table 1) shows that only 114 out of 409 observations (27.8%) of the sustainability reports have assurance because they are still considerably voluntary in order to increase reliability and public trust.
The proportion of the independent board shows a negative and significant effect on clarity (0.141, p < 0.01) and conciseness (0.099, p < 0.05). The aggregate SRQs is 0.85, p < 0.1, showing that the second hypothesis is supported (H2). Our findings support the work of Hassan and Lahyani (2020); Naciti (2019), and Eng and Mak (2003). According to them, large proportions of independent boards could cause the managers to find it difficult to incorporate them into their strategic plans, reducing the quality of sustainability reports. In other words, the higher the existence of independent non-executives and the higher the level of protection for shareholders and stakeholders to represent their interests, the more they can obtain information directly, rather than from public disclosure.
Our results show that number of female directors has a positive and significant on conciseness (0.127, p < 0.05), clarity (0.136, p < 0.05), and reliability (0.169, p < 0.01). Aggregate SRQs is 0.174, p < 0.01. Therefore, the third hypothesis is supported (H3). This result is in line with the findings of García-Sánchez et al. (2019) and Erin et al. (2021). Gender diversity has a significant impact on the quality of sustainability reports. Female directors tend to have a more participattory and democratic leadership style with regard decisions related to social and environmental activities. Their existence determines the policies and ways the company discloses information to external groups. This study’s research hypothesis concludes that a board with female representation in green governance can reduce the risk of asymmetry in sustainability disclosure. They are easily influenced to provide clearer and more simple information due to their narrative-driven character and point of view.
The Chief Sustainability Officer (CSO) has a significant relation to the conciseness in 0.092, p < 0.01 and hypothesis (H4) is partially supported. The impact of the CSO’s existence on the brevity of the sustainability report is relatively small. These results show how management executives also play a crucial role in decision-making (Fu et al. 2019). The existence of CSOs in the TMT plays a positive role in the company’s social performance. This is clearly seen in the increase of social responsibility activities and the reduction of socially irresponsible activities. Meanwhile, the sustainability committee has not been able to prove an effect on the quality of the sustainability report. As a result, the fifth hypothesis (H5) is not supported. The results of this study are also supported by Berrone and Gomez-Mejia (2009) and Rodrigue et al. (2013); they stated that the environmental committee has no effect on the environmental performance because the committee’s role does not run optimally and only represents a symbolic and not subtantive legitimacy.
The firm size has a positive and significant effect on clarity, conciseness, reliability and aggregate SRQ when it is in the range of 0.142, p < 0.05; 0.195, p < 0.01; 0.281, p < 0.01 and 0.248, p < 0.01. Large companies tend to be the center of attention from many parties; therefore, to minimize intervention, companies implement disclosure mechanisms as a forum to provide company operational information. The leverage has negative and significant effects to clarity when it is in 0.066, p < 0.10. Giannarakis (2014) states that a negative affect on the level of CSR information that they disclose will be seen in companies with high levels of leverage, and this is caused by the large costs to produce this information, meanwhile companies that have low level of leverage will freely publish their CSR information. It was claimed industrial would have positive and significant effect on clarity, conciseness, reliability and aggregate SRQ when it is in 0.280, p < 0.01; 0.268, p < 0.01; 0.107, p < 0.05 and 0.28275, p < 0.01.
The significant test results demonstrate green governance have an effect on the quality of sustainability reports in ASEAN countries. This shows that the resource-based view theory can explain the importance of board size, independent boards, diversity of directors, and CSOs as effective corporate resources in improving the quality of sustainability reports in terms of conciseness and clarity reliability of reporting.

4.3. The Effect of Moderation: Sustainability Commitment

The results of testing the moderating effect of sustainability commitment as measured by social costs are presented in Table 6. However, the evidence suggests that green governance and the quality of corporate sustainability reports vary in terms of clarity, conciseness, and reliability when examining the moderating effect of sustainability commitment. In this case, the findings indicate how the sustainability commitment influences the quality of the information in sustainability reports.
Table 6 shows that the number of female directors has a positive effect toward the quality of sustainability reports at a value of 0.131 (p < 0.01); this finding is consistent with the previous findings presented in (Table 5). The sustainability commitment in the form of social costs, has a positive and significant effect on the quality of sustainability reports where it reaches a value of 0.201 (p < 0.01). These results may support Evans and Sridhar (2002) and Shwairef et al. (2021) in their examination the effect of social costs on social performance and strategic posture containing benefits to increase legitimacy and increase the asymmetry of stakeholders. Stakeholder-oriented companies will incur social costs and release information widely and publicize their social responsibility activities while minimizing the negative potential for irresponsibility and negative impacts on their activities (Rhou et al. 2016). In other words, the commitment to social responsibility that is carried out through social costs affects sustainability report quality.
The moderating role between female directors and sustainability commitment is significant to the quality of the sustainability report since it reaches a value of 0.174 (p < 0.1). Therefore, the sixth hypothesis is partially supported (H6). The existence of female directors on the board is positively related in improving the quality of sustainability reports. The results of this study are supported by Liao et al. (2014) and García-Sánchez et al. (2019), who state that female directors have high competence and commitment to ethical standards (Ben-Amar and McIlkenny 2015) along with higher concern about pollution and climate change (Ciocirlan and Pettersson 2012). As a result, this encourages them to have higher discipline on their commitment to effectively overcome environmental and social issues. Therefore, when present on the board, they have not only been appointed to maintain gender equality, but also to work for the business’s needs and towards the better functioning of the board (Arayssi et al. 2020). However, the presence of females on boards remains low in ASEAN countries (i.e., only one or two members). Therefore, it may negatively affect the commitment to the quality of sustainability reports. This result is steadily consistent and shows a negative effect on the sustainability commitment. This indicates that the sustainability commitment will be lower when the number of females a board of directors is relatively small. Female directors are kinder and more sensitive to the issues such as corporate donations, occupational health and safety, human resources, and ethics, even though they have weaknesses regarding technical issues such as climate change, carbon emission reduction and environmental management systems (EMS).
The effect of the interactions between the board size (β = 0.024, p > 0.1), the independent board (β = 0.074, p > 0.1), the CSO (β = −0.001, p > 0.1), and the sustainability committee (β = 0.002, p > 0.1) with sustainability commitment on the quality of sustainability reports have not been proven. This result is due to sustainability commitments being measured by the social costs of philanthropic activities (charity) to demonstrate their social care for the community. However, this result is not sufficient if the company’s operational activities endanger the environment through carbon emissions, waste, and cause other kinds of damage. The disclosure of social costs is proven to have an effect on the clarity and reliability of sustainability reports, but it is not strong enough to influence green governance practices and sustainability. The non-significant findings outlined above test the moderating effect of social costs on the effects of green governance and sustainability and provide limited support for the agency theory practices. Social costs are expected to bridge stakeholder expectations about the importance of sustainability commitments so that companies have social legitimacy.
Tests on the control variables prove that the firm size has a positive and significant effect on SRQ (0.141, p < 0.01). Large companies tend to be the center of attention from many parties; therefore, in order to minimize the intervention, companies implement disclosure mechanisms as a forum to provide company operational information (Hussain and Rigoni 2018; Arayssi et al. 2020). Likewise, industry type has a positive and significant effect on SRQ (0.207, p < 0.01). These findings are consistent with Amran et al. (2014) and Chams and García-Blandón (2019), who stated that the social disclosure activities are determined by the industries where companies in the manufacturing, chemical, mining industries are wider than other industries. The results of his research also show that the social disclosure practiced is generally triggered by pressure from external stakeholders, such as the government, NGOs, consumers, and others.
A summary of results can be found in Table 7.

4.4. Additional Test

This test was conducted to obtain additional information and stronger results (See Table 8). The test is with respect to nations with the highest number of companies, such as Indonesia, Malaysia, and Singapore. These results indicate how sustainability commitment influences the quality of information on sustainability reports. The number of female directors has a positive effect on the quality of sustainability reports in Indonesia and Singapore. The moderating effect of between female directors, sustainability committee and quality of the sustainability report are significant in Singapore. Other findings are that company size and type of industry correlate to sustainability reports’ quality.

5. Conclusions

This study examines the effects of green governance on the quality of sustainability reports and the role of sustainability commitment in ASEAN countries. A sustainability report is a good medium to communicate the relevant information about sustainability and monitor management behavior. The results of the research show that green governance plays an important role in sustainability reporting and in ensuring the quality of the reports. Other results such as the proportion of independent board members, female directors, and the commitment to sustainability have great influences on the quality of sustainability reports. The board size has little effect on the reliability of the quality. Likewise, effect of the chief sustainability officer on the conciseness of the sustainability reports is small. Meanwhile, the existence of sustainability committee is not proven to be correlated to the quality of reports.
In particular, the commitment to sustainability affects the quality of sustainability reports. In contrast, the commitment to social responsibility is applied through the social costs. Companies have an interest in widely disclosing and publishing their social responsibility activities. The social costs also moderate the proportion of female directors and the quality of sustainability reports. However, the role of sustainability commitment does not moderate the effect of the board size, the independent board, the CSOs, and the sustainability committees on the quality of sustainability reports.
The empirical evidence shows that quality of sustainability reports in ASEAN countries needs to be improved. This result can also be seen in terms of the sustainability report which is only observed at 27.87%. It has an assurance assessment from an independent party. One possible explanation is the existence of mandatory regulations and an external environment that is weak in encouraging it. There are regulations to require quality assurance. The most important finding is the low presence of female directors in the composition of the boards of directors. Even though their role has a significant effect on the quality of sustainability reports because their narrative ability and sensitivity, further research is required on the role of boards, management, committees, and sustainability commitments in the reporting process. The practice of green governance throughout the company is an important step that cannot be ignored in designing an effective sustainability report. The company must establish strategy and commitment in its organization to produce quality sustainability practices and for this to be reflected in the report. Other findings are obtained from the company’s characteristics where company size and type of industry are positively correlated with the quality of sustainability reports.
This research findings contribute to the following scopes: Firstly, the empirical results show that green governance helps to improve corporate reporting quality. Therefore, the government and the regulators must have initiatives to implement green governance and commitment to sustainability. Secondly, investors should invest in companies with good green governance practices and a commitment to sustainability. In particular, the proportion of independent members on boards, gender diversity, and CSO are essential factors. Thirdly, companies with strong commitments to sustainability and green corporate governance are competitive resources that support businesses in growing, attracting more investment, and earning stakeholders’ trust. Lastly, this research also contributes to the agency theory and the resource-based theory related to the green governance practices as effective corporate resources in improving the quality of sustainability reports in terms of clarity, conciseness, and reliability of reporting in the context of ASEAN countries.
Furthermore, this study has several limitations, which may also serve to provide opportunities for future research. Firstly, the sample companies sample only provides information on obtained social costs. Some of the companies under observation spent money on social costs, but the amount was unclear. Therefore, it is necessary to consider using another measurement to represent each company’s sustainability commitment. Lastly, while this study only focuses on three aspects of quality, namely, clarity, conciseness, and reliability, looking at other aspects such as tone, accuracy, completeness, comparability, and legibility may also be necessary to further investigate the comprehensive SRQ. This offers many opportunities for future research in expanding the scope of SRQ.

Author Contributions

Conceptualization, C.C. and B.T.; methodology, C.C. and B.T.; data curation C.C.; validation, C.C.; formal analysis, C.C. and B.T.; writing—original draft preparation, C.C.; writing—review and editing, B.T.; supervision, B.T.; project administration, C.C.; All authors have read and agreed to the published version of the manuscript.

Funding

This research received no external funding.

Informed Consent Statement

Not applicable.

Data Availability Statement

Not applicable.

Conflicts of Interest

The authors declare no conflict of interest.

References

  1. Adams, Renee B. 2015. Myths and Facts about Female Directors. Washington: International Finance Corporation. Available online: https://www.ifc.org/wps/wcm/connect/a1a8a380484aba4293f3f7299ede9589/PSO37.pdf?MOD=AJPERES (accessed on 1 September 2022).
  2. Al-Shaer, Habiba, and Mahbub Zaman. 2016. Board gender diversity and sustainability reporting quality. Journal of Contemporary Accounting & Economics 12: 210–22. [Google Scholar] [CrossRef] [Green Version]
  3. Amran, Azlan, Shiau Ping Lee, and S. Susela Devi. 2014. The influence of governance structure and strategic corporate social responsibility toward sustainability reporting quality. Business Strategy and the Environment 23: 217–35. [Google Scholar] [CrossRef]
  4. Arayssi, Mahmoud, Jizi Muhammad, and Hala Hussein Tabaja. 2020. The impact of board composition on the level of ESG disclosures in GCC countries. Sustainability Accounting, Management and Policy Journal 11: 137–61. [Google Scholar] [CrossRef]
  5. Aznar, Juan Pedro, Josep Maria Sayeras, Jorge Galiana, and Alba Rocafort. 2016. Sustainability Commitment, New Competitors’ Presence, and Hotel Performance: The Hotel Industry in Barcelona. Sustainability 8: 755. [Google Scholar] [CrossRef] [Green Version]
  6. Baysinger, Barry D., and Henry N. Butler. 1985. Corporate governance and the board of directors: Performance effects of changes in board composition. Corporate Governance: Values, Ethics and Leadership 1: 215–38. [Google Scholar] [CrossRef]
  7. Ben-Amar, Walid, and Philip McIlkenny. 2015. Board Effectiveness and the Voluntary Disclosure of Climate Change Information. Business Strategy and the Environment 24: 704–19. [Google Scholar] [CrossRef]
  8. Berrone, Pascual, and Luis R. Gomez-Mejia. 2009. Environment Performance and Executive Compensation: An Integreted Agency-Institution Perspective. Academy of Management Journal 52: 103–26. [Google Scholar] [CrossRef]
  9. Chams, Nour, and Josep García-Blandón. 2019. Sustainable or not sustainable? The role of the board of directors. Journal of Cleaner Production 226: 1067–81. [Google Scholar] [CrossRef]
  10. Chandani, Nayana, and Rathnayaka Mudiyanselage. 2018. Board involvement in corporate sustainability reporting: Evidence from Sri Lanka. Corporate Governance: The International Journal of Business in Society 18: 1042–56. [Google Scholar] [CrossRef]
  11. Ciocirlan, Cristina, and Caroline Pettersson. 2012. Does Workforce Diversity Matter in the Fight against Climate Change? An Analysis of Fortune 500 Companies. Corporate Social Responsibility and Environmental Management 19: 47–62. [Google Scholar] [CrossRef]
  12. Correa-Garcia, Jaime Andres, Maria Antonia Garcia-Benau, and Emma Garcia-Meca. 2020. Corporate governance and its implications for sustainability reporting quality in Latin American business groups. Journal of Cleaner Production 260: 121142. [Google Scholar] [CrossRef]
  13. DeBoskey, D. G., Yan Luo, and Jeff Wang. 2018. Does board gender diversity affect the transparency of corporate political disclosure? Asian Review of Accounting 26: 444–63. [Google Scholar] [CrossRef]
  14. Dilling, Petra F. A. 2016. Reporting on long-term value creation—The example of public Canadian energy and mining companies. Sustainability 8: 938. [Google Scholar] [CrossRef] [Green Version]
  15. Eide, Ann Elida, Erik Andreas Saether, and Arild Aspelund. 2020. An investigation of leaders’ motivation, intellectual leadership, and sustainability strategy in relation to Norwegian manufacturers’ performance. Journal of Cleaner Production 254: 120053. [Google Scholar] [CrossRef]
  16. Eng, Li Li, and Yuen Teen Mak. 2003. Corporate governance and voluntary disclosure. Journal of Accounting and Public Policy 22: 325–45. [Google Scholar] [CrossRef]
  17. Erin, Olayinka, Alex Adegboye, and Omololu Adex Bamigboye. 2021. Corporate Governance and Sustainability Reporting Quality: Evidence from Nigeria Governance. Sustainability Accounting, Management and Policy Journal 13: 680–707. [Google Scholar] [CrossRef]
  18. Evans, John H., and Sri S. Sridhar. 2002. Disclosure-disciplining mechanisms: Capital markets, product markets, and shareholder litigation. Accounting Review 77: 595–626. [Google Scholar] [CrossRef]
  19. Frias-Aceituno, José V., Lazaro Rodriguez-Ariza, and Isabel M. Garcia-Sanchez. 2013. The role of the board in the dissemination of integrated corporate social reporting. Corporate Social Responsibility and Environmental Management 20: 219–33. [Google Scholar] [CrossRef]
  20. Fu, Ruchunyi, Yi Tang, and Guoli Chen. 2019. Chief sustainability officers and corporate social (Ir) responsibility. Strategic Manajement Journal 41: 656–80. [Google Scholar] [CrossRef]
  21. García-Sánchez, Isabel-María, Oscar Suárez-Fernández, and Jennifer Martínez-Ferrero. 2019. Female directors and impression management in sustainability reporting. International Business Review 28: 359–74. [Google Scholar] [CrossRef]
  22. Giannarakis, Grigoris. 2014. Corporate governance and financial characteristic effects on the extent of corporate social responsibility disclosure. Social Responsibility Journal 10: 569–590. [Google Scholar] [CrossRef]
  23. Goodstein, Jerry, Kanak Gautam, and Warren Boeker. 1994. The effect of Board Sizr and Diversity on Strategic Change. Strategic Management Journal 15: 241–50. [Google Scholar] [CrossRef]
  24. Haque, Faizul. 2017. The effects of board characteristics and sustainable compensation policy on carbon performance of UK firms. British Accounting Review 49: 347–64. [Google Scholar] [CrossRef]
  25. Hassan, Mostafa Kamal, and Fathia Elleuch Lahyani. 2020. Media, independent non-executive directors and strategy disclosure by non-financial listed firms in the UAE. Corporate Governance (Bingley) 20: 216–39. [Google Scholar] [CrossRef]
  26. Husni Syam, Mohammad, Eka An Aqimuddin, Arinto Nurcahyono, and Erik Setiawan. 2020. Corporate Social Responsibility in ASEAN. Advances in Social Science, Education and Humanities Research 409: 158–62. [Google Scholar]
  27. Hussain, Nazim, Ugo Rigoni, and René P. Orij. 2018. Corporate Governance and Sustainability Performance: Analysis of Triple Bottom Line Performance. Journal of Business Ethics 149: 411–32. [Google Scholar] [CrossRef]
  28. Husted, Bryan W., and José Milton de Sousa-Filho. 2019. Board structure and environmental, social, and governance disclosure in Latin America. Journal of Business Research 102: 220–27. [Google Scholar] [CrossRef]
  29. Jo, Hoje, and Maretno A. Harjoto. 2011. Corporate Governance and Firm Value: The Impact of Corporate Social Responsibility. Journal of Business Ethics 103: 351–83. [Google Scholar] [CrossRef]
  30. Liao, Lin, Le Luo, and Qingliang Tang. 2014. Gender diversity, board independence, environmental committee and greenhouse gas disclosure. The British Accounting Review 47: 409–24. [Google Scholar] [CrossRef]
  31. Liu, Tiansen, He Liu, Yufeng Zhang, Yazhi Song, Yi Su, and Yue Zhu. 2020. Linking governance structure and sustainable operations of Chinese manufacturing firms: The moderating effect of internationalization. Journal of Cleaner Production 253: 119949. [Google Scholar] [CrossRef]
  32. Loh, Lowrence, and Thomas Thomas. 2018. Sustainability Reporting in ASEAN Countries. Singapore: Asean CSR Network and Center for Governance, Institutioms & Organisations NUS Business School, pp. 1–48. [Google Scholar]
  33. Lone, Ehtazaz Javaid, Amjad Ali, and Imran Khan. 2016. Corporate governance and corporate social responsibility disclosure: Evidence from Pakistan. Corporate Governance: The International Journal of Business in Society 16: 785–97. [Google Scholar] [CrossRef]
  34. Luzzini, Davide, Emma Brandon-Jones, Alistair Brandon-Jones, and Gianluca Spina. 2015. From sustainability commitment to performance: The role of intra- and inter-firm collaborative capabilities in the upstream supply chain. International Journal of Production Economics 165: 51–63. [Google Scholar] [CrossRef] [Green Version]
  35. Mahmood, Monowar, and Nurlan Orazalin. 2017. Green governance and sustainability reporting in Kazakhstan’s oil, gas, and mining sector: Evidence from a former USSR emerging economy. Journal of Cleaner Production 164: 389–97. [Google Scholar] [CrossRef]
  36. Mahmood, Zeeshan, Rehana Kouser, Waris Ali, Zubair Ahmad, and Tahira Salman. 2018. Does Corporate Governance Affect Sustainability Disclosure? A Mixed Methods Study. Sustainability 10: 207. [Google Scholar] [CrossRef] [Green Version]
  37. Mason, Michael. 2019. Transparency, accountability and empowerment in sustainability governance: A conceptual review. Journal of Environmental Policy and Planning 22: 98–111. [Google Scholar] [CrossRef]
  38. Menz, Markus, and Christine Scheef. 2014. Chief strategy officers: Contingency analysis of their presence in top management teams. Strategic Management Journal 35: 461–71. [Google Scholar] [CrossRef]
  39. Naciti, Valeria. 2019. Corporate governance and board of directors: The effect of a board composition on firm sustainability performance. Journal of Cleaner Production 237: 117727. [Google Scholar] [CrossRef]
  40. Nasih, Mohammad, Iman Harymawan, Yuanita Intan Paramitasari, and Azizah Handayani. 2019. Carbon Emissions, Firm Size, and Corporate Governance Structure: Evidence from the Mining and Agricultural Industries in Indonesia. Sustainability 11: 2483. [Google Scholar] [CrossRef] [Green Version]
  41. Novitasari, Dian, and Yustrida Bernawati. 2020. The Impact of Good Corporate Governance on the Disclosure of Corporate Social Responsibility. International Journal of Innovation, Creativity and Change 10: 265–76. [Google Scholar]
  42. Nursimloo, Sandira, Dinesh Ramdhony, and Oren Mooneeapen. 2020. Influence of board characteristics on TBL reporting. Corporate Governance (Bingley) 20: 765–80. [Google Scholar] [CrossRef]
  43. Orazalin, Nurlan. 2020. Do board sustainability committees contribute to corporate environmental and social performance? The mediating role of corporate social responsibility strategy. Business Strategy and the Environment 29: 140–53. [Google Scholar] [CrossRef]
  44. Peters, Gary F., and Andrea M. Romi. 2012. The Effect of Corporate Governance on Voluntary Risk Disclosures: Evidence from Greenhouse Gas Emission Reporting. Kelley School of Business. pp. 1–58. Available online: https://d30i16bbj53pdg.cloudfront.net/sites/default/files/documents/school-of-accounting/ghg_disclosure_and_corp_gov_20120202.pdf (accessed on 1 September 2022).
  45. Post, Corinne, Noushi Rahman, and Emily Rubow. 2011. Green governance: Boards of directors’ composition and environmental corporate social responsibility. Business & Society Journal 50: 189–223. [Google Scholar] [CrossRef]
  46. Rhou, Yinyoung, Manisha Singal, and Yoon Koh. 2016. International Journal of Hospitality Management CSR and financial performance: The role of CSR awareness in the restaurant industry. International Journal of Hospitality Management 57: 30–39. [Google Scholar] [CrossRef]
  47. Rodrigue, Michelle, Michel Magnan, and Charles H. Cho. 2013. Is Environmental Governance Substantive or Symbolic? An Empirical Investigation. Journal of Business Ethics 114: 107–29. [Google Scholar] [CrossRef]
  48. Shamil, Mohamed M., Junaid M. Shaikh, Poh-Ling Ho, and Anbalagan Krishnan. 2014. The influence of board characteristics on sustainability reporting Empirical evidence from Sri Lankan firms. Asian Review of Accounting 22: 78–97. [Google Scholar] [CrossRef]
  49. Shwairef, Abdalla, Azlan Amran, Mohammad Iranmanesh, and Noor Hazlina Ahmad. 2021. The mediating effect of strategic posture on corporate governance and environmental reporting. Review of Managerial Science 15: 349–78. [Google Scholar] [CrossRef]
  50. Soewarno, Noorlailie, Bambang Tjahjadi, and Febrina Fithrianti. 2019. Green innovation strategy and green innovation: The roles of green organizational identity and environmental organizational legitimacy. Management Decision 57: 3061–78. [Google Scholar] [CrossRef]
  51. Supriyati, Supriyati, and Bambang Tjahjadi. 2017. Corporate Sosial Responsibility and Financial Performance: Stakeholder Theory vs. Good Management Theory. International Journal of Economic Research 14: 235–44. [Google Scholar]
  52. Tang, Yanhong, Yanling Ma, Christina W. Y. Wong, and Xin Miao. 2018. Evolution of Government Policies on Guiding Corporate Social Responsibility in China. Sustainability 10: 741. [Google Scholar] [CrossRef] [Green Version]
  53. Vu, Kelly Anh, Greg Tower, and Glennda Scully. 2011. Corporate communication for Vietnamese listed firms. Asian Review of Accounting 19: 125–46. [Google Scholar] [CrossRef]
Figure 1. Conceptual Model.
Economies 11 00027 g001
Table 1. Sample Distribution Analysis.
CountryThe Number of Company(%)The Number of Sustainability Reporting(%)The Industry TypesThe Number of Company(%)
Indonesia4227.2712530.56Trade and services2415.58
Malaysia3623.387718.83Miscellaneous industries127.79
Singapore2918.836616.14Consuming good Industry1610.39
Thailand2516.237819.07Basic & Chemistry2415.58
Philippines1610.395212.71Mining & Energy1610.39
Vietnam63.90112.69Plantation3019.48
Total154100409100Property and Real Estate127.79
Infrastructure, unity, and transportation127.79
AssuranceAssurance11427.87Others1610.39
Non-Assurance29572.13
Total 409100Total154100
Table 2. Variable Measurement.
LabelsVariablesMeasurementData Sources
SRQSustainability Report QualityThe quality of sustainability report disclosure is measured by clarity (conciseness) measured by the logarithm of Length pages, brevity (clarity) is measured by the logarithm of Length words, and reliability (reliability) is measured by a dummy variable. The score of one (1) was given if the company’s SR report is guaranteed by the accounting profession or by other specialist practitioners; otherwise, the variable is coded as zero (0)Annual report, Sustainability Report
BSIZEBoard SizeNumber of directors in the company structureAnnual report, Sustainability Report
BINDIndependent BoardPercentage of independent commissioners in the number of commissionersAnnual report, Sustainability Report
BGENDFemale BoardNumber of women on the board of directorsAnnual report, Sustainability Report
CSOChief Sustainability OfficerChief Sustainability Officer as measured by a dummy score variable of 1 if the company has a Sustainability Officer and zero otherAnnual report, Sustainability Report
COMMCSRSustainability CommitteeThe Sustainability/CSR Committee is measured by the variable dummy score 1 if the company has a Sustainability/CSR Committee and zero otherwiseAnnual report, Sustainability Report
SCOSTSustainability CommitmentSustainability Commitment is measured by social costs, which are the total expenditures of (1) environmental costs, (2) carbon emission reduction costs, (3) CSR costs, (4) education and training costs, and (5) R&D costsAnnual report, Sustainability Report, Osiris database
FSIZEFirm SizeFirm size is measured by the logarithm of total assetsOsiris database
FLEVFirm RiskCompany risk is measured by the Leverage ratioOsiris database
INDTYPEIndustry TypeGrouping based on industrial complexity with the following scores: (1) for various industries, consumer goods industry, basic and chemical industry, agriculture, mining, and energy, and others (0)Osiris database
Table 3. Descriptive Statistics.
MeanStdMinimumMaximum
BSIZE6.7972.5822.00016.000
BIND56.21423.40411.110100.000
BGEND0.3220.8580.0005.000
CSO0.4030.4910.0001.000
COMMCSR0.3890.4880.0001.000
SCOST13.7752.7754.87020.660
CONCISENESS94.6308155.167611.00041.000
CLARITY29,230.0719,421.733554154,430
RELIABILITY0.2790.4490.0001.000
FSIZE14.4981.6814.97019.880
FLEV74.55275.1560.000780.290
INDTYPE0.3010.4590.0001.000
BSIZE = Board Size. BIND = Independent Board. BGEND = Female Board. CSO = Chief Sustainability Officer. COMMCSR = Sustainability Committee. SCOST = Log Social. Cost. Conciseness = Ln_Length; Clarity = Ln_Word; Reliability = Assurance. FSIZE = Log Firm Size. FLEV = Firm Risk. INDTYPE = Industry Type.
Table 4. Discriminant Validity.
BGENDBINDBSIZECOMMCSRCSOFLEVFSIZEINDTYPESCOSTSRQ
BGEND1.000
BIND0.0111.000
BSIZE−0.104−0.1991.000
COMMCSR−0.0760.1520.1111.000
CSO−0.144−0.1510.0720.3971.000
FLEV0.006−0.0030.1170.030−0.0401.000
FSIZE−0.169−0.0040.3810.0920.1690.1361.000
INDTYPE−0.013−0.121−0.132−0.1400.167−0.141−0.1811.000
SCOST−0.0910.0190.2370.1410.0800.1250.359−0.0781.000
SRQ0.117−0.0510.2050.0400.130−0.0180.2920.1470.2961.000
BSIZE = Board Size. BIND = Independent Board. BGEND = Female Board. CSO = Chief Sustainability Officer. COMMCSR = Sustainability Committee. SCOST = Social Cost. SRQ = Sustainability Report Quality. FSIZE = Firm Size. FLEV = Firm Risk. INDTYPE = Industry Type.
Table 5. The regression result caused by the effect of green governance on the quality of the sustainability Information report.
Variable(Model 1)(Model 2)(Model 3)(Model 4)
ConcisenessClarityReliabilityTSRQ
BSIZE−0.052−0.0470.208 ***0.023
(−1.018)(−0.981)(3.951)(0.364)
BIND−0.141 ***−0.099 **0.075−0.085 *
(−3.064)(−2.015)(1.633)(−1.663)
BGEND0.127 **0.136 **0.169 ***0.174 **
(2.453)(2.836)(3.706)(3.598)
CSO0.0660.091 *0.0160.077
(1.162)(1.682)(0.314)(1.394)
COMMCSR0.0660.0000.0140.034
(1.226)(0.010)(0.270)(0.626)
Control
FSIZE0.142 **0.195 ***0.281 ***0.248 ***
(2.924)(3.887)(5.872)(4.433)
FLEV−0.067−0.066 *−0.018−0.067 *
(−1.617)(−1.862)(−0.488)(−1.729)
INDTYPE0.280 ***0.268 ***0.107 **0.282 ***
(6.111)(5.816)(2.101)(5.862)
r20.1430.1430.1650.169
r2_a0.1260.1260.1490.153
Conciseness = Ln_Length; Clarity = Ln_Word; Reliability = Assurance. TSRQ = Conciseness, Clarity, Reliability. BSIZE = Board Size. BIND = Independent Board. BGEND = Female Board. CSO = Chief Sustainability Officer. COMMCSR = Sustainability Committee. SCOST = Social Cost. SRQ = Sustainability Report Quality. FSIZE = Firm Size. FLEV = Firm Risk. INDTYPE = Industry Type. Significance levels: * p < 0.010, ** p < 0.05, *** p < 0.01.
Table 6. The regression result caused by the green governance toward the quality of the sustainability report.
CoeffT Statisticsp Values
BSIZE -> SRQ0.0991.0680.286
BIND -> SRQ−0.025−0.365−0.715
BGEND -> SRQ0.1532.9800.003 ***
CSO -> SRQ0.0751.2140.225
COMMCSR -> SRQ−0.015−0.248−0.804
SCOST -> SRQ0.1882.7490.006 ***
FSIZE -> SRQ0.2413.8450.000 ***
FLEV -> SRQ−0.054−1.263−0.207
INDTYPE -> SRQ0.2072.6030.009 ***
Moderating Effect BSIZE -> SRQ0.0240.4980.618
Moderating Effect BIND -> SRQ0.0741.3150.189
Moderating Effect BGEND -> SRQ−0.174−1.721−0.085 *
Moderating Effect CSO -> SRQ−0.001−0.018−0.986
Moderating Effect COMMSCR -> SRQ0.0020.0330.974
F Square BSIZE0.010
F Square BIND0.001
F Square BGEND0.025
F Square CSO0.004
F Square COMMCSR0.000
F Square Moderating effect BSIZE_SRQ0.006
F Square Moderating effect BIND_SRQ0.001
F Square Moderating effect BGEND_SRQ0.015
F Square Moderating effect CSO_SRQ0.000
F Square Moderating effect COMMCSR_SRQ0.000
R Square0.239
R Square Adjusted0.212
BSIZE = Board Size. BIND = Independent Board. BGEND = Female Board. CSO = Chief Sustainability Officer. COMMCSR = Sustainability Committee. SCOST = Social Cost. SRQ = Sustainability Report Quality. FSIZE = Firm Size. FLEV = Firm Risk. INDTYPE = Industry Type. Significance levels: * p < 0.010, *** p < 0.01. Effect on = ->.
Table 7. The Summary of hypotheses test results.
HypothesisSignSignificant (Sig)Decision
H1: Board size’s effect on SRQ+Sig, ReliabilityPartially supported
H2: The proportion of independent board’s effect on SRQSigSupported
H3: Female directors’ effect on SRQ+SigSupported
H4: Chief sustainability officer effect on SRQ+Sig, ClarityPartially supported
H5: Sustainability committee effect on SRQ+Not SigNot supported
H6: The Sustainability commitment’s mediating role on the relationship between green governance and SQRSig, female directorsPartially supported
Table 8. The summary of the additional test.
CountryIndonesiaMalaysiaSingapore
p Valuesp Valuesp Values
BSIZE -> SRQ−0.822−0.8130.938
BIND -> SRQ0.6410.2550.138
BGEND -> SRQ0.040 **0.5680.043 **
CSO -> SRQ0.4130.2800.242
COMMCSR -> SRQ−0.210−0.8430.269
SCOST -> SRQ0.053 **0.021**0.067 **
FSIZE -> SRQ0.000 ***0.1490.061 **
FLEV -> SRQ−0.318−0.868−0.266
INDTYPE -> SRQ0.6870.042 **0.707
Moderating Effect BSIZE -> SRQ0.4330.848−0.412
Moderating Effect BIND -> SRQ0.4060.6530.115
Moderating Effect BGEND -> SRQ0.9830.7100.076 **
Moderating Effect CSO -> SRQ−0.953−0.068 **0.256
Moderating Effect COMMCSR -> SRQ0.342−0.052 **0.095 **
R Square 0.2830.5640.746
R Square Adjusted0.1920.4650.677
BSIZE = Board Size. BIND = Independent Board. BGEND = Femaile Board. CSO = Chief Sustainability Officer. COMMCSR = Sustainability Committee. SCOST = Social Cost. SRQ = Sustainability Report Quality. FSIZE = Firm Size. FLEV = Firm Risk. INDTYPE = Industry Type. Significance levels: ** p < 0.05, *** p < 0.01. Effect on = ->.
Disclaimer/Publisher’s Note: The statements, opinions and data contained in all publications are solely those of the individual author(s) and contributor(s) and not of MDPI and/or the editor(s). MDPI and/or the editor(s) disclaim responsibility for any injury to people or property resulting from any ideas, methods, instructions or products referred to in the content.

