Article

The Impact of the National Economic Recovery Program and Digitalization on MSME Resilience during the COVID-19 Pandemic: A Case Study of Bank Rakyat Indonesia

1
Bank Rakyat Indonesia 1, Jakarta 10210, Indonesia
2
BRI Research Institute, Bank Rakyat Indonesia 2, Jakarta 10210, Indonesia
*
Author to whom correspondence should be addressed.
Economies 2022, 10(7), 160; https://doi.org/10.3390/economies10070160
Submission received: 7 March 2022 / Revised: 2 June 2022 / Accepted: 10 June 2022 / Published: 1 July 2022
(This article belongs to the Topic Open Innovation and Entrepreneurship)

Abstract

:
This study aims to evaluate the impact of the National Economic Recovery Program—Pemulihan Ekonomi Nasional (PEN) and digitalization on micro, small, and medium enterprises’ (MSMEs) resilience during the COVID-19 pandemic. This research is based on primary data from a survey of 6009 Bank Rakyat Indonesia customers conducted from March–June 2021. Using the generalized ordered logistic regression technique, this study found that a combination of new loans, credit restructuring, and/or interest subsidies was the most successful PEN for enhancing MSME resilience. Meanwhile, providing new loans merely improved liquidity, not sales or profitability. However, just providing a restructuring program weakened resiliency. This research also discovered that MSMEs that have been digitalizing for more than a year are more resilient than those that have not. This study highlights the necessity of offering several interventions for MSMEs and assisting MSMEs in going digital to improve MSME resilience during the COVID-19 pandemic.

1. Introduction

Micro, small, and medium enterprises (MSMEs) were one of the most stricken sectors during the current COVID-19 pandemic. According to a survey conducted by the International Trade Center (ITC) with a sample of 4467 enterprises from 132 countries, MSMEs had a higher risk of going bankrupt than large businesses, with one-fifth (21%) of MSMEs reporting the suspension of operations three months into the pandemic (ITC 2020). In Indonesia in particular, 50% of MSMEs shut down their operations within a month of the outbreak (ADB 2020).
In fact, MSMEs have become the most important pillars of the Indonesian economy. By 2021, the number of MSMEs reached 64.2 million, contributing 61.07% of the national GDP or 8573.89 trillion rupiah (US$ 596,762.1 million), employing 97% of the workforce, and encompassing 60.4% of total investments. MSMEs play important roles in economic development by generating employment, raising domestic investment, and establishing international markets. Therefore, it is important for governments and other financial institutions to protect MSMEs against unpredictable circumstances and economic shocks, since the deterioration of MSMEs’ performance has spillover consequences on other economic sectors.
To mitigate the impact of the pandemic on the performance of MSMEs, the Indonesian government has issued a series of policies called the National Economic Recovery Program (Pemulihan Ekonomi Nasional/PEN) worth 695 trillion rupiah (US$ 48,373.5 millions). PEN provides support for MSMEs in the form of interest rate subsidies, credit relaxation and restructuring, loan guarantee schemes, and tax incentives. Bank Rakyat Indonesia (BRI), which serves 56% of Indonesia’s MSME customers, has disbursed PEN with the priority of providing new credit schemes worth 293.07 trillion rupiah (US$ 20,398.3 million) to 9,233,323 customers, loan restructuring worth 109.7 trillion rupiah (US$ 7635.3 million) to 3.5 million customers, and an interest subsidy program worth 1.2 trillion rupiah (US$ 83.5 million) to 34.8 million customers.
Resilience refers to an organization’s capacity to adjust to the environment and new conditions (Supardi and Hadi 2020). Small businesses’ capacity to adapt and survive is determined by both internal and external factors (Olawale and Garwe 2010). Previous research has focused on the impact of internal elements on a company’s capacity to survive. Managerial and organizational characteristics such as age, gender, ownership, location, capital intensity, and the type of business sectors have a significant impact on the survival rate of MSEs (Fitriasari 2020; Holmes et al. 2010; Rajagopaul et al. 2020). Other internal characteristics that contribute to increased efficiency and resilience include strong collaboration and integration (Ali et al. 2017).
Substantial disruptions in business and consumption patterns due to the pandemic require MSMEs to make immediate strategic adjustments. Digitalization is one of the most widely used strategies for MSMEs to reduce the impact of the pandemic. Previous studies have extensively discussed the importance of digitalization as a survivability and resilience instrument for MSMEs (Costa and Castro 2021; Klein and Todesco 2021). Costa and Castro (2021) argued that MSMEs should be embracing digital business to survive in this pandemic situation, since digital business can create competitive advantages and increase business scale. Digitalization also improves MSME performance through efficiency, encourages innovation, and accelerates financial inclusion (Joseph and Dhanabhakyam 2021). Other studies analyze the factors of digitalization that might promote resilience, such as MSMEs’ commitment to supply resources, staff skills, a clear digital strategy, and a supportive digital environment (Eller et al. 2020; Hermawan and Nugraha 2022). Although the impact of digitalization on MSMEs’ resilience has been extensively studied in the literature, the influence of digital adoption length on resilience has not received as much attention.
In fact, MSMEs experience many obstacles to adapting and transforming due to limited resources, skills, and commitment and knowledge (Giotopoulos et al. 2017; Nasco et al. 2008). External support from the government and other stakeholders is an important element to adapt and achieve MSME resilience during a pandemic. Government assistance has been proven to be critical in assisting MSMEs in surviving through the pandemic by reducing financial burdens and enabling MSMEs to conduct strategic adjustments (Martí and Quas 2018; Tambunan 2018). A previous study has discussed the impact of government support for MSME resilience during the pandemic. Park et al. (2020) found that government support is not sufficient to help Korean SME to increase annual sales and asset growth, but when government support is paired with public loan funding, they are beneficial in increasing Korean SMEs resilience. Furthermore, utilizing Indonesian SMEs in the restaurant industry as a case study, Najib et al. (2021) revealed that government support had a positive impact on resilience through innovation. Taneo et al. (2022) also confirm that government support in the form of training has a positive impact on enhancing MSME resilience, since it can improve MSME innovation capabilities. Although previous studies have looked into the role of government help in increasing resilience, none have examined what type of intervention is most beneficial for MSMEs’ resilience in the event of a pandemic.
The objective of this study is to evaluate the impact of PENs and digitalization on MSME resilience using primary data on Bank Rakyat Indonesia customers. By using the generalized ordered logit model (gologit), researchers can analyze the probability of increasing or decreasing MSME resilience under the condition of participation in the PEN and the length of digitalization. This study will contribute to the literature in two important aspects: (1) by providing evidence of the most effective forms of PEN support in enhancing MSME resilience, and (2) by providing evidence of the impact of digitalization length on MSME resilience.

2. Theoretical Background and Hypothesis Development

Various resilience concepts have been extensively used in the MSME literature. Resilience indicates the ability of a system to withstand any disturbance, organize a response, and return to normal operation (Miceli et al. 2021). Supardi and Hadi (2020) divided resilience into three categories: proactive, adaptive, and reactive. Proactive resilience is defined as pre-crisis SME attributes, embedded factors, and preventive strategies that can make MSMEs more resilient to a shock. Adaptive resilience refers to SMEs’ ability to adapt during a crisis by implementing structural or strategic changes in response to a crisis. Finally, reactive resilience refers to an SME’s ability to recover into a new state of equilibrium that is similar or even superior to before the crisis. In addition, resilience is interpreted in terms of two concepts (Ndiaye et al. 2018). The first concept describes resilience as a process of absorption or bounce back, representing an organization’s ability to return to its initial condition after being hit by a shock. In this interpretation, organizational resilience is achieved because of the back-up factors that allow organizations to sustain their condition. The second concept is that resilience is achieved from the adaptation process, namely the capacity to incrementally modify its functions in the face of change. Based on previous studies presented above, in this study resilience is defined as the ability of the organization to use its resources and to evolve with change so that it can sustain its initial condition and/or grow beyond its initial condition.
The resource-based view (RBV) is a useful lens for understanding resilience in small businesses. According to the RBV, a company gains a competitive advantage by maximizing its distinctive internal and external resources, as well as its ability to manage such resources (Barney et al. 2001). Available resources come from internal resources such as capital, assets, business experience, skills and education, labor, and external resources, including the enabling environment, government intervention, and other support from financial institutions and agencies. These attributes can be a strength and defense for organizations to reduce the risk of business failure in times of crisis.
External support is an important element in achieving MSME resilience during a pandemic. MSMEs are the most vulnerable sector in times of crisis because they have basic characteristics that are less diversified, have a weaker financial structure, have fewer financing options, and are highly dependent on credit (OECD). Due to lockdown policies, MSMEs experienced a major drop in sales, operational revenue, and profitability, resulting in poor financial conditions with severe cash shortages, lower liquidity, and the challenge of having to repay loans and interest. In addition, MSMEs have limited resources, so they cannot quickly innovate to cope with change. External support has an important role in providing additional resources for MSMEs to overcome their weakness of smallness (Folta et al. 2006).
External support can be obtained from the government, financial institutions, non-government organizations, and other stakeholders. Government support can be in the form of measures to increase sales/cashflow, measures to increase the liquidity of access to bank loans, and measures to increase investment and support the growth of MSMEs (OECD). Previous studies have presented evidence of the importance of government support to encourage the growth and resilience of MSMEs. For example, government loans can increase MSME access to financing and fulfill MSME financial needs (Martí and Quas 2018; Tambunan 2018). Government loans can also increase the ability of MSMEs to create new job opportunities (Nitani and Riding 2015). However, some studies have found that government support is not sufficient for MSMEs to rely on. Government support may be limited and only be able to reach specific target clients (Park et al. 2020), and their support may not suit the needs of MSMEs (Najib et al. 2021), and the possibility of asymmetric information may cause government support to be inappropriate (Adam and Lestari 2017). Therefore, Park et al. (2020) suggested combining government loan support with other support from other public/private sectors to enhance MSME resilience.
Previous studies explained that new loans are a powerful intervention for MSMEs since they enable MSMEs to have greater operational flexibility, which can be leveraged to formulate and implement diverse strategic options (Park et al. 2020). In addition, MSMEs that have additional financing resources also have a greater opportunity to innovate, which generates a competitive advantage for MSMEs to survive in times of crisis. The existence of this competitive advantage allows MSMEs to be more cost efficient and to have good financial performance so that they can increase their resilience during the pandemic (Djufri et al. 2021).
Interest rate subsidies and credit restructuring have also become an alternative in supporting MSMEs during the pandemic. According to Bank Indonesia Regulation 14/15/PBI/2012, credit restructuring is defined as remedial action taken by the Bank for their debtors that are experiencing difficulties in meeting their obligations, such as lowering the credit interest rate, adjusting terms of credit, reducing credit principal, and other credit facilities. Credit restructuring and interest rate subsidies have the benefit of improving the financial performance of MSMEs by reducing the installment burden and loan interest that must be paid to banks. Credit restructuring also provides flexibility for MSMEs to delay payments and extend terms of credit so that it is possible to use their financial resources to overcome key problems. With less financial burden, MSMEs can also be more concerned about thinking about innovations that can be useful for maintaining sales stability or encouraging growth to achieve resilience in times of crisis. In this regard, the hypothesis tested is as follows:
Hypothesis 1
(H1). PENs in the form of new loans, interest subsidies, and credit restructuring provide liquidity, increase payment flexibility, and reduce financial burdens, thus improving MSMEs’ financial performance and resilience during the COVID-19 pandemic.
In addition, from an adaptive resilience standpoint, MSMEs’ resilience is linked to an organization’s ability to respond to exogenous volatility pressures by conducting systematic adjustments to mitigate the effects of a crisis. Adaptive resilience emphasizes the ability, flexibility, and agility of MSMEs to adapt business processes to develop resilience responses. Adaptive responses will vary in many aspects, such as changing strategies in production, human resources, and innovation. During the COVID-19 pandemic, one of the important innovations carried out by MSMEs was to digitalize business as a response to the social restriction policies carried out by the government.
Digitalization is a continuum consisting of several phases of change in a company from those that do not use of information technology (IT) to companies that carry out digital transformations, where each phase of change requires different resources, structures, growth strategies, metrics, and goals (Verhoef and Bijmolt 2019). To understand the effects of digitalization on resilience, this study uses innovation diffusion theory, which explains that organizations in a social environment will not adopt a technology at the same time (Wonglimpiyarat and Yuberk 2005). Organizations that emphasize innovation will adopt technology more quickly than other organizations in systems that are not concerned with innovation. The diffusion theory classifies the organization based on the point in time they adopt the innovation relative to other organizations, including no adoption, late adoption (less than one year), early majority (one to two years), early adopter (two to three years), and pioneers more than 3 years; (Beatty et al. 2001). The duration of being digital will affect an organization’s knowledge and ability to use the internet (Wolk and Skiera 2009). Organizations that use digital services longer can build credibility and customer awareness first. Digital technology also offers flexibility so that companies that adopt earlier can adapt and learn from mistakes. The length of digitalization can also affect the varied level of service utilization (Teo and Pian 2003). Wolk and Skiera (2009) confirmed that there is a positive and significant relationship between the duration of internet use and company performance; namely, the longer the company uses the internet, the better its performance because it can reach a wider market. In addition, the adoption of digital technology has cost-cutting and promotion benefits, which increase sales value and improves resilience (Bourletidis and Triantafyllopoulos 2014; Caballero-Morales 2021). Therefore, the second hypothesis to be tested is as follows:
Hypothesis 2
(H2). The duration of MSME digitalization influences the financial performance of MSMEs and their resilience.

3. Methodology

3.1. Data and Sampling Methodology

This study used primary data collected from a survey of Bank Rakyat Indonesia customers during the period from 28 June to 30 July 2021. The survey was conducted in 33 provinces in Indonesia with a total of 6009 MSME customers as respondents. Due to the pandemic, the survey was conducted by telephone (telesurvey) and, if possible, the surveyor went directly to the respondent’s house while following strict health procedures. We performed quality checks for each questionnaire by comparing the hard copy and the recorded copy to ensure the quality of the data.
The sampling method used was stratified random sampling based on the percentage distribution of customers by province and business sectors, where provinces and sectors with large populations received a larger sample allocation compared to sectors and provinces with smaller populations.

3.2. Variables

The dependent variable in this study was resilience. To measure resilience, this study used three outcome variables: (1) sales value, (2) liquidity as the ability of an institution to pay its current liabilities, and (3) profitability as the ability of the institution to generate profit. These dependent variables were categorical variables showing respondents’ perceptions of the outcome variables whether the outcome variable (1) had decreased, (2) was stagnant, or (3) had increased from the previous period (the first quarter of 2021). We only measured change quarterly to obtain a more accurate estimation.
Independent variables used in this study were the participation of the respondent in the PEN and the length of digitalization of an MSME. These independent variables were categorical variables, which show the classification of respondents based on their participation in the PEN and the time period for conducting online transactions. Some explanatory variables were used. Specifically, these were MSME organization characteristics, including location, region, market area, size, and age, shifting business, and MSME owner’s characteristics, such as owner education and owner gender. A detailed description of operational variables is presented in Table 1.

3.3. Method of Data Analysis

The type data generated informs the choice of statistical model to be employed during data analysis (Agresti 2003). As explained in the previous section, the dependent variable used in this study has a stratified ordinal scale which includes three categories: 1 = decrease, 2 = stagnant, 3 = increase, and the independent variables include both continuous and categorical variables. For this type of data characteristics, the most appropriate model is ordered logistic regression (Agresti 2003). One of the basic assumptions of ordered logistic regression is that each pair of outcome categories has the same interaction, which is known as the parallel regression assumption (Brant 1990). Under this assumption, the coefficients that explain the association between the lowest and all higher categories of the response variable are assumed to be the same. To test whether the dependent variable used in this study has a parallel regression assumption, a Brant test of the parallel regression assumption was performed. If the parallel assumption was not met, the gologit model was implemented to describe the relationship between each pair of outcome groups and the explanatory variables. We conducted the Brant test of the parallel regression assumption as presented in Table 2.
The Brant test showed that the statistical significance (p > chi-squared) of the test for each resilience variable was smaller than 0.05, indicating that all variables violated the proportional odds assumption. The results showed that using an ordered logit will give biased, incorrect, incomplete, or misleading results (Williams 2006). Based on this Brant test of parallel regression assumption, we employed the gologit model. The gologit model relaxes an assumption of the ordered logit model, as it does not assume a parallel regression assumption. We followed the gologit model formulated by Williams (2006) as follows:
P ( Y i > j ) = g ( X β j ) = exp ( α j + X i β j ) 1 + { exp ( α j + X i β j ) } ,   j = 1 , 2 , , M 1
where M is the number of categories of the ordinal dependent variable, while the partially constrained model is
P ( Y i > j ) = exp ( α j + X 1 i β 1 + X 2 i β 2 ) 1 + { exp ( α j + X 1 i β 1 + X 2 i β 2 ) } ,   j = 1 , 2 , , M 1
For the case of a dependent variable that has three values/M = 3 (e.g., 1, 2, and 3), two panels of coefficients were provided as if the variable recoded as J = 1 category 1 contrasted with categories 2 and 3; for J = 2, the contrast was between categories 1 and 2 versus 3.
In our study, based on the resilience definition by Miceli et al. (2021), resilience can be divided into two categories: first, resilience is defined as bounce back; the first model compares the outcome of “decreasing resilience” (1) to the outcome of “stagnant” (2) and the outcome of “increasing resilience” (3). The second panel represents adaptive resilience that compares the outcome of “decreasing resilience” (1) and the outcome of “stagnant” (2) to the outcome of “increasing resilience” (3). In this model, positive coefficients indicate that higher values regarding the explanatory variable make it more likely that the respondent will be in a higher category of Y than the current one, whereas negative coefficients indicate that higher values on the explanatory variable increase the likelihood of being in the current or a lower category.

4. Findings and Discussions

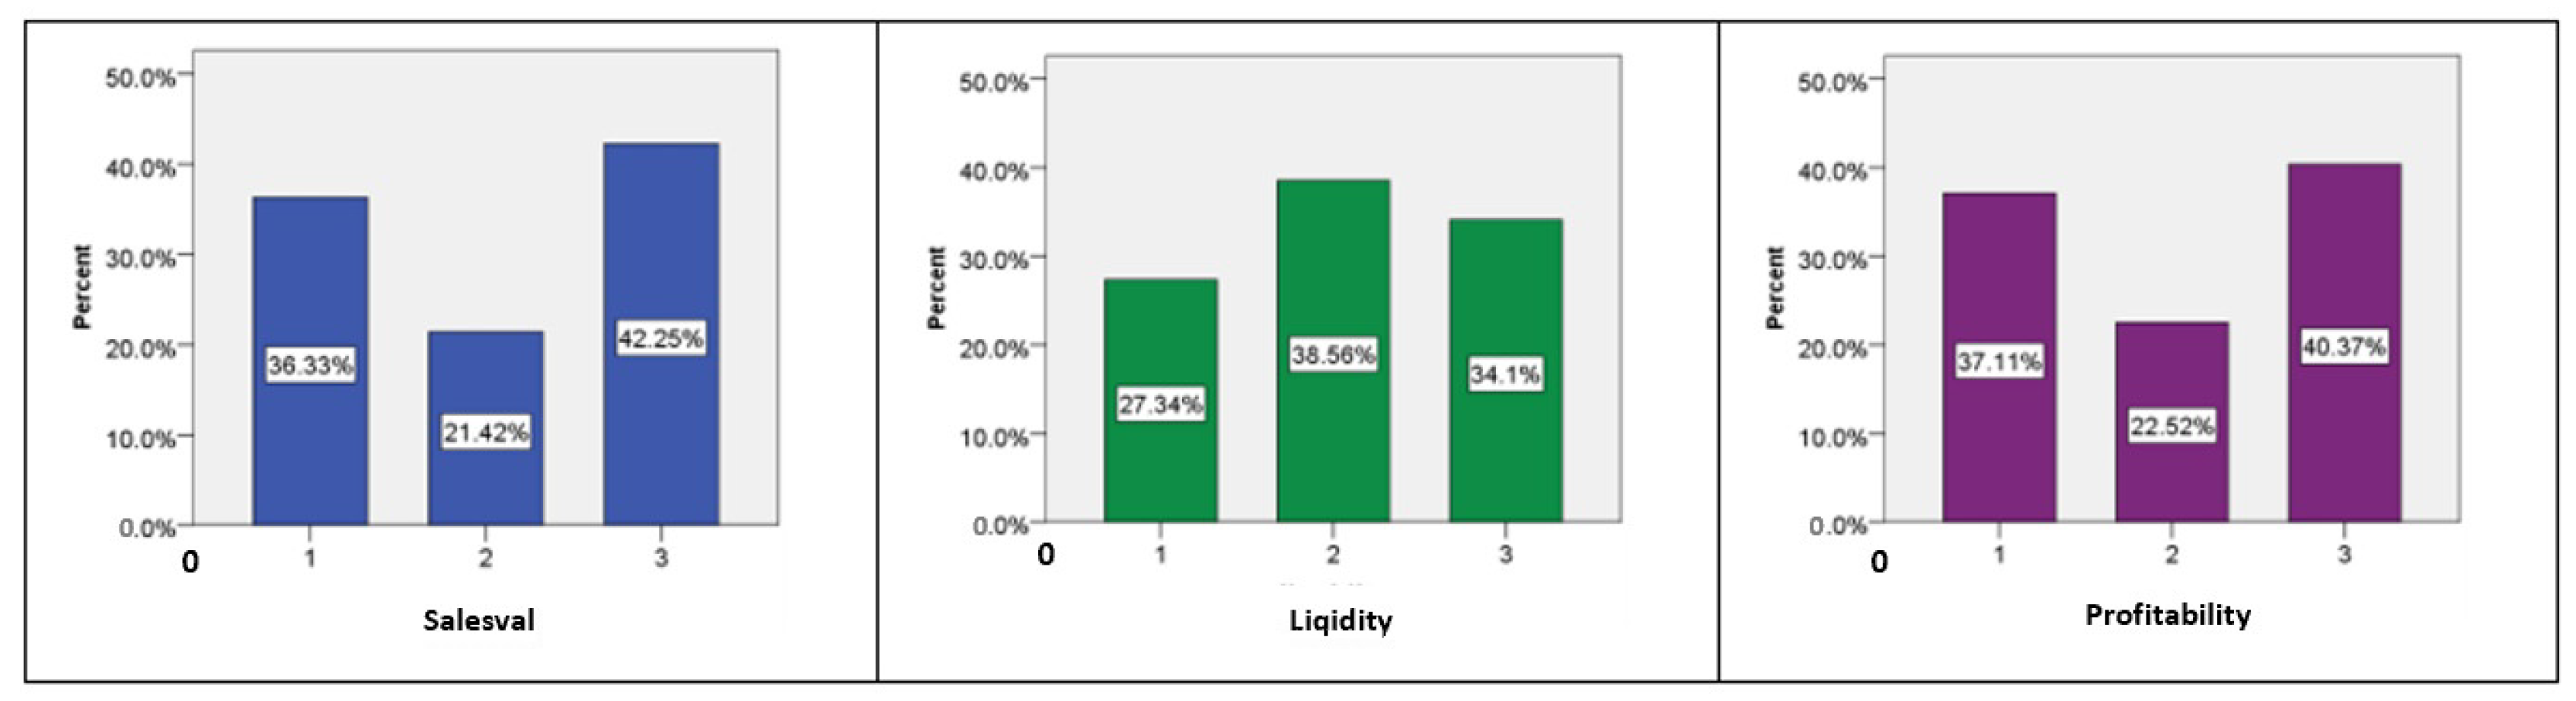
4.1. Descriptive Analysis

This study used three measures of resilience variables, namely sales volume, liquidity, and profitability. Figure 1 shows the distribution of resilience variables based on three categories: “1 = decreased”, “2 = stagnant”, and “3 = increased” from Q1 to Q2 of 2021. From the sales volume and profitability variable, 42.25% of respondents experienced an increase in sales, and 40.37% of respondents experienced an increase in profitability. However, from a liquidity perspective, most of the respondents (38.56%) experienced a stagnant level of liquidity from Q1 to Q2.
Although this result shows that some MSMEs had started to overcome the impact of the pandemic, this figure also shows that more than 30% of respondents still experienced a decline in sales and profitability from Q1 to Q2 2021. This study suggests that MSMEs were unable to execute the adaptation process and implement survival strategies during the pandemic. This MSME group may not have obtained external assistance, or the support they received is insufficient to enable the MSME to recover its performance.
Table 3 illustrates the distribution of selected variables based on the resilience variables. On average, the cross-section analysis between the explanatory and resilience variables showed that most MSMEs in this study experienced an increase in sales and profitability but experienced stagnant liquidity conditions from Q1 to Q2. However, the findings of this study showed that the industrial and service sectors, as well as MSMEs that received PEN support in the form of loan restructuring, performed worse.
Based on sector variables, these descriptive data show that although the agriculture, retail, and other sectors have experienced an increase in sales and profitability, the industrial and service sectors are still experiencing stagnant sales, liquidity, and profitability conditions from Q1 to Q2. Based on the PEN variable, 39.29% of respondents stated that they had never received assistance from the PEN, and the rest received one or a combination of PEN. When this PEN category variable was evaluated based on resilience outcome variables, respondents who received the type of assistance in the form of additional new loans, those who received additional new loans and reduced interest and/or credit restructuring, and those who received interest subsidies only experienced an increase in sales volume and an increase in profitability from Q1 to Q2. However, those who received credit restructuring and those who received assistance in the form of credit restructuring and interest subsidies experienced a decrease in sales and profitability.
Based on the length of digitalization, descriptive data show that 75.89% of respondents had not done business digitally, and only 24.11% of MSMEs used social media, websites, or marketplaces to sell during this pandemic. According to the cross-section analysis, MSMEs who have digitalized are more resilient than those who have not.
These descriptive statistical data also show the basic characteristics of respondents, namely shifting, location, market coverage, firm size, and firm age. Shifting is a variable that provides information on whether the respondent makes business changes as a strategy to survive the pandemic. This study shows that only 1.36% of respondents decided to change their business from one sector to another or change the type of business in the same sector. This study had almost evenly distributed respondents in urban (42%) and rural areas (58%). The data also showed an increase in sales and profitability, as well as liquidity stagnation during Q1 to Q2 for MSMEs in both urban and rural areas. Similar findings regarding increased sales and profitability, as well as liquidity stagnation during Q1 to Q2, were also found in different regions of Java Bali, Sumatra, and other regions.
From the size perspective, the majority of respondents in this study were micro enterprises (84.16%), and the rest were small and medium enterprises. Based on the age of the business, this research showed that these enterprises were fairly varied in age; most (46%) were under 10 years old and 36% were 10–20 years old. The rest had been in business for more than 20 years. This study also showed consistent results, namely an increase in sales and profitability, as well as liquidity stagnation from Q1 to Q2 in all categories of MSMEs based on scale and age.
Based on the characteristics of the owner, the respondents of this research were mostly males (69%), and most had a high school education. Based on gender, the initial findings show consistent results, namely an increase in sales and profitability, as well as stagnation of liquidity during Q1 to Q2 in MSMEs owned by both men and women. Based on education, this study also found similar findings across different education levels.

4.2. Model Estimation Using the Generalized Ordered Logit Model

Table 4 illustrates the results obtained from the gologit model. The dependent variable of the inferential model is resilience (sales value, liquidity, and profitability). This dependent variable is a categorical variable. We asked respondents whether their sales value, liquidity, and profitability: 1 (had decreased), 2 (was stagnant), or 3 (had increased) in Q2 2021 compared to Q1 2021.
The output of this model included two panels of binary regression. The first we called “panel 1” and compares category 1 versus categories 2 and 3. The second, “panel 2”, compares categories 1 and 2 versus category 3. We provided the relative risk ratio (RRR) measurement to indicate the more favorable category of each explanatory variable. When the RRR was more than 1, these indicated higher values on the explanatory variable make it more likely that the respondent will be in a higher category of Y than the current one. A negative coefficient or RRR less than 1, however, showed that higher values of the explanatory variables increased the odds of being in the current or a lower category of resilience.
From Table 4, findings related to the impact of the PEN on MSME resilience show that compared to the one who did not receive any PEN, the respondent who received PENs in category 3 (new loan plus rate subsidy and/or credit restructuring) was found to have a positive coefficient with an RRR of 1.367 for sales and 1.298 for liquidity. This means that, all things being equal, the new loan support was 1.367 times more likely to increase sales volume at a 1% level of significance and 1.298 times more likely to increase liquidity at a 5% level of significance.
This output also shows that compared to those who did not receive any PEN, the respondent who received restructuring credit support was found to have a negative coefficient with an RRR of 0.791 for sales value, 0.65 for liquidity, and 0.704 for profitability. These findings indicate that when all things are equal, MSMEs who receive restructuring credit support are 0.79 times less likely to increase their sales, 0.65 times less likely to increase their liquidity, and 0.704 times less likely to increase profitability. In addition, MSMEs who only received new loan support had a positive coefficient with an RRR of 1.194 for its liquidity variable, indicating that these MSMEs are more likely to increase their liquidity 1.194 times more than those who did not receive any assistance.
The second panel study also found that, compared to respondents who did not receive the PEN, MSMEs that received the new credit and interest subsidies and/or credit restructuring had a positive coefficient with an RRR value of 1367 for sales value and 1298 for liquidity value. Similar to the previous interpretations, an RRR value of more than 1 indicates that by getting assistance in the form of additional credit and interest subsidies and/or credit restructuring, MSMEs had the possibility to significantly increase their sales and liquidity, so they can move from categories 1 and 2—sales and decreased and fixed liquidity—toward being in category of 3—sales and increased liquidity. From this finding, we may conclude that not all PENs are effective for boosting MSME resilience; therefore, this study partially rejects the first hypothesis.
Table 4 also shows the effect of the duration of digitalization on the resilience of MSMEs. The variable length of digitalization was measured by four categories: (1) never online, (2) online < one year, (3) online one to three years, (4) online > three years. In general, the gologit estimation model showed that compared to those that have never gone digital, MSMEs that adopt digital business have a higher probability of resilience, as indicated by increased sales, increased liquidity, and increased profitability. From the first and second panels, MSMEs that have been digital for one to three years have a positive coefficient and RRR of 1145 for sales, 1203 for liquidity, and 1181 for profitability. These results indicate that these MSMEs are more likely to have an increase in sales of 1145 times, are more likely to have an increase in liquidity of 1203 times, and are more likely to have an increase in profitability of 1181 times compared to the ones who have never adopted online selling.
In addition, MSMEs that have been digital for > three years have a positive coefficient and an RRR of 1220 for sales, 1228 for liquidity, and 1129 for profitability. Comparing being digital for one to three years and more than three years, the output estimation shows an increase in the RRR value in the sales model but a decrease in the RRR value in the liquidity and profitability model. This suggests that the longer MSMEs implement digital business, the more competitive advantage they acquire in terms of increasing sales, but this does not improve liquidity or profitability, since increasing liquidity and profitability requires a sound financial management approach. The findings of this study support the second hypothesis, which states that the longer a firm is digital, the higher its sales income and resilience.
Another interesting finding in Table 4 is regarding the effect of business shifting on resilience. Although this variable is not the focus of our analysis, the result of the estimation model is interesting to reveal. This study found that MSMEs that switched businesses/sectors had a significant RRR of 0.664 for sales and 0.678 for profitability. These results indicate that MSMEs that are shifting are less likely to have an increase in sales of 0.664 times and are less likely to have an increase in profitability of 0.678 times compared to MSMEs that stayed in a similar business before the pandemic. This is an intriguing conclusion since, based on the earlier data, just 1.36% of the overall sample, or 82 MSMEs, were shifting. Yet, all the MSMEs that decided to change failed. This finding implies that shifting is not a feasible option during a pandemic, since developing a new market involves a lot of investment and effort.
This estimation model also included control variables in the form of business characteristics and owners. The estimation results showed that the region, business sector, market coverage, and size of MSMEs significantly affected MSME resilience. Meanwhile, business location and age did not show significant resilience effects. Based on the characteristics of business owners, it was found that the gender of business owners had no significant effect on MSME resilience, but MSMEs owned by university/diploma graduates were able to manage their finances to produce higher business liquidity and profitability compared to MSMEs owned by school graduates.

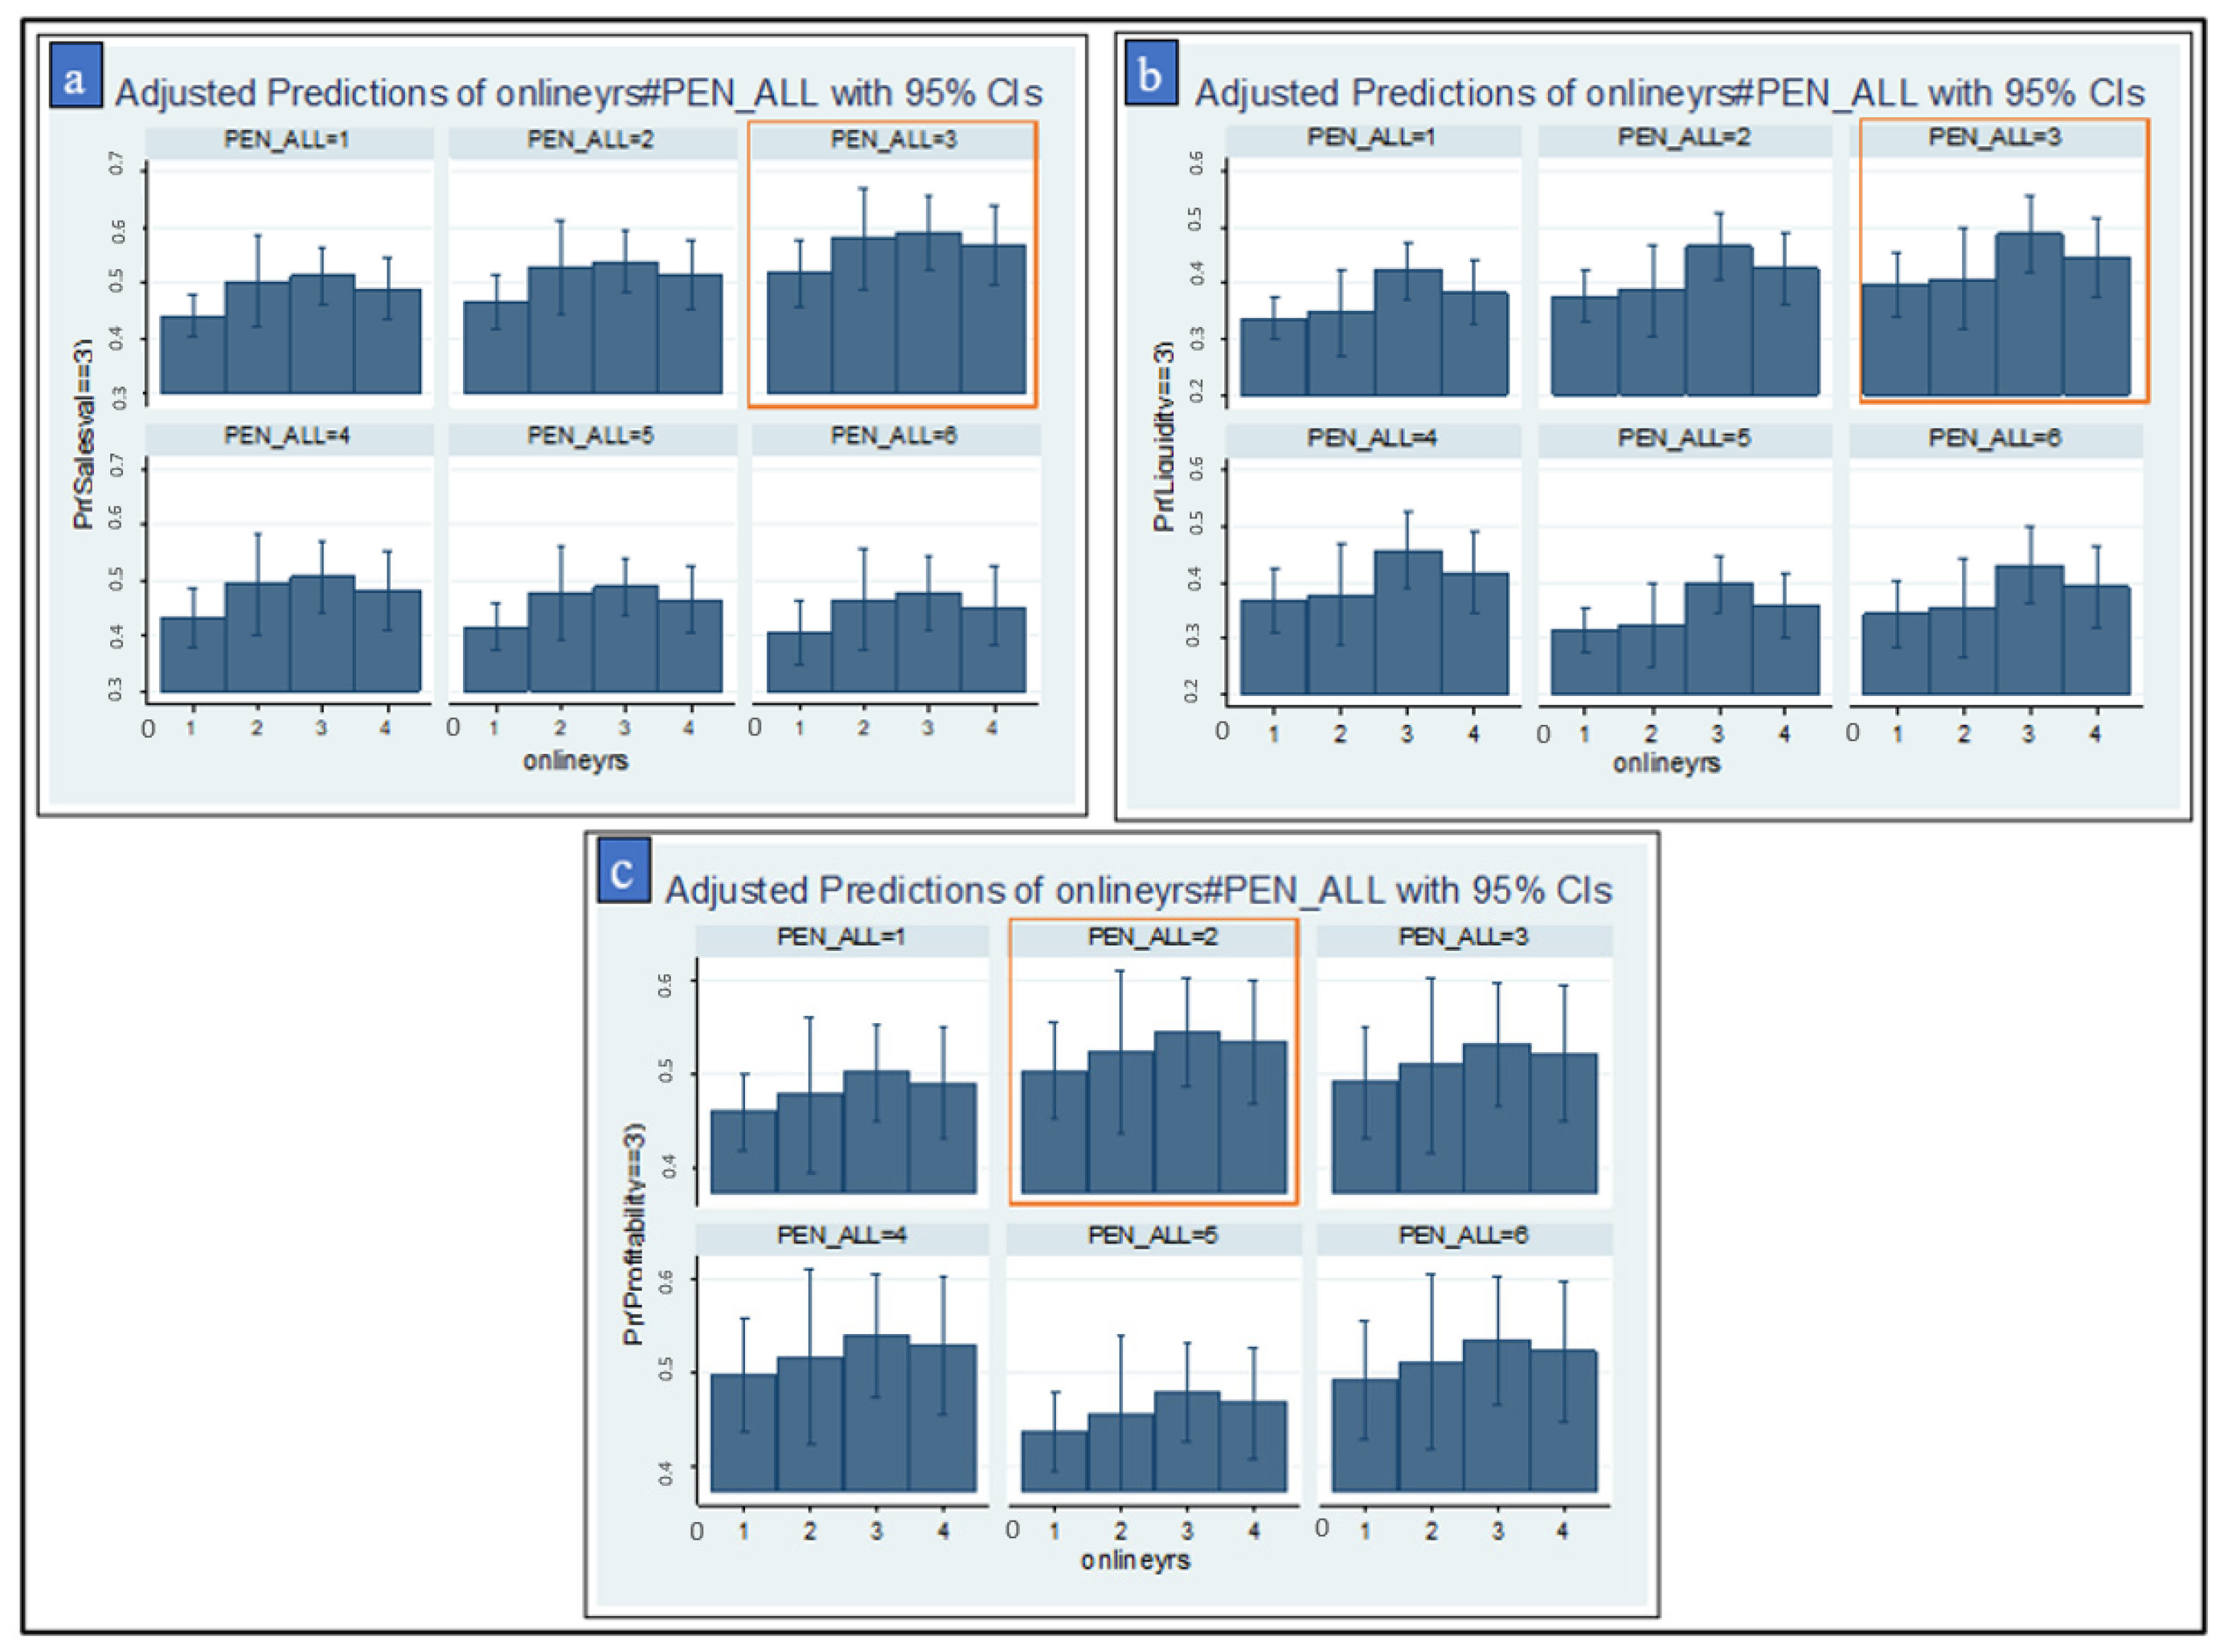
4.3. Adjusted Predicted Value of Probability

Figure 2 illustrates the predictive value of the probability of increasing MSME resilience under the condition of the type of PEN accepted and the length of digitalization. Each bar represents the probability of a group of MSMEs getting a certain PEN and a certain length of digitalization pursuit. Based on the sales resilience, the predicted value of probability results indicates that the group of MSMEs that has the highest probability of increasing resilience are those that have received category 3 PEN, namely a combination of new loans and restructuring/interest subsidies and have been digitalizing for one to three years. Meanwhile, the MSME group that had the lowest probability of experiencing an increase in resilience was the MSME group that received category 6 PEN, namely those that received a combination of restructuring and interest subsidies and had never undergone any digitalization.
Based on the liquidity resilience measure, the predicted value of probability results showed almost the same results, namely the MSME group that had the highest probability of increasing resilience sales was MSMEs that had received the category 3 PEN, specifically a combination of new loans and restructuring/interest subsidies and that have been digitalizing for one to three years. However, the MSME group that had the lowest probability of experiencing an increase in liquidity was the MSME group that had received category 5 PEN in the form of restructuring and had never done digitalization.
The predicted value of probability showed different results for the measure of profitability resilience. This model showed that the MSME group that had the highest probability of experiencing an increase in profitability was the MSME group that had received category 2 PEN and that has been digitalizing for one to three years. Meanwhile, the MSME group that had the lowest probability of increasing profitability was the MSME group that had received category 5 PEN in the form of restructuring and had not yet undergone digitalization.
In general, MSMEs who get assistance in the form of new loans or a mix of new loans and restructuring/interest subsidies and have been digitalizing for one to three years have a higher likelihood of building resilience. Meanwhile, the MSME with the lowest likelihood of improving resilience is the one that receives only restructuring support and has not yet embraced digitalization. The predicted probability model’s findings are consistent with the gologit estimation finding, namely that one intervention is insufficient to improve MSME resilience during the pandemic and that the most effective intervention is a combination of new loans, restructuring, and/or interest subsidies. These results also emphasize the importance of digitalization to support MSME resilience.

5. Discussion

The objective of this study is to evaluate the impact of the National Economic Recovery Program (PEN) and digitalization on MSMEs resilience during the COVID-19 pandemic. Using extensive data from customers of Bank Rakyat Indonesia, this study found that no type of PEN program is able to increase MSME resilience. The PEN includes three programs: interest rate subsidies, credit restructuring, and new credit schemes. The findings of this study show that providing a combination of new credits and additional PEN support is the most effective PEN for increasing MSME resilience. In addition, this study also found that providing new loans only merely improved liquidity, not sales or the profitability of MSMEs. However, the provision of the PEN in the form of credit restructuring significantly reduced the level of sales, liquidity, and profitability. Thus, the provision of credit restructuring alone without additional assistance will not help MSMEs to increase their resilience.
The findings of this study reveal that MSMEs require multiple types of support to enhance their survivability in a crisis, and one of the types of assistance that must be provided to MSMEs is a new credit scheme. One of the constraints of MSMEs’ ability to adapt and innovate in times of crisis, as highlighted in earlier research, is a lack of funds (Martí and Quas 2018). Providing additional funds to MSMEs can help them change their business plan, innovate, and adopt technology in order to enhance sales during the pandemic (Djufri et al. 2021). Additional support in the form of credit restructuring or rate subsidies, in addition to new financing, can help MSMEs become more resilient by easing their financial burden. This finding supports the study by Park et al. (2020) that demonstrated evidence that government loan support should be combined with additional public/private sector initiatives to enhance MSME resilience. This finding certainly has very important implications for the government and banks in determining priority programs for economic recovery.
Regarding digitalization, this study found that the longer a firm has been “digital”, the higher its sales income and resilience. This result is consistent with earlier studies of the diffusion theory that state that early adopters have the benefit of accessing a larger market, modifying ineffective online sales techniques, and being able to take use of digital application capabilities (Beatty et al. 2001; Wolk and Skiera 2009). This study emphasizes the necessity of assisting SMEs in going digital. Based on preliminary data, just 25% of this study sample had engaged in online sales activity. Despite being forced to accept digital services as a result of the lockdown policy, the majority of respondents in this survey have not done so for a variety of reasons, including a lack of proper equipment and signals, a lack of expertise, and a fear of online fraud.
This study has limitations, as the research sample for this study only consists of MSMEs who are customers of BRI, a state-owned commercial bank in Indonesia. The study may provide different findings if it was implemented for non-banking clients. Furthermore, this study only focused on two factors that influence MSMEs’ resilience: the government assistance program and digitization. This research has found that different types of government support have a different impact on SME resilience in terms of sales value, liquidity and profitability. This finding could make a significant contribution to the literature. However, this study has limitations in evaluating the impact of digitalization on resilience because it only evaluates how long SMEs have been digital and their effect on resilience. This study was unable to determine aspects of digitalization, such as technology investment, digital skills, and social media use and their impact on MSME resilience. Following that, additional in-depth research on components of digitalization that affect resilience may be conducted. Other studies may consider a longer period of study to be able to evaluate the resilience of SME before and after the pandemic. In addition, performing a qualitative study to highlight SME’s strategy and creativity in strengthening their resilience during a pandemic might be beneficial for future research.

6. Conclusions and Implications

During a pandemic, government assistance and digitization play a vital role in strengthening MSMEs’ resilience. Government intervention measures, on the other hand, are not always successful in enhancing resilience. According to the study’s findings, the most effective government intervention for improving resilience is a mix of new loans and interest subsidies/credit restructuring. Due to the lockdown policy, MSMEs experienced a decline in sales, which resulted in a decrease in liquidity. A new loan is often needed by MSMEs to survive, innovate and adapt to new circumstances. Only one type of government support, however, is insufficient. Additional intervention in the form of term interest subsidies and/or credit restructuring is necessary to assist MSMEs in decreasing their financial burden. In addition, this study found that government support in the form of credit restructuring has a significant effect on reducing resilience. Therefore, credit restructuring is not a type of government intervention that can be successful alone; it has to be complemented with other interventions. The result of this study provides significant information for policymakers on what types of intervention are beneficial in increasing MSME resilience during the pandemic.
In terms of digitalization, the length of MSME digitization had a positive and substantial impact on resilience. MSMEs that had been digitally transformed for more than a year had a higher likelihood of resilience than those that had never digitized or were late adopters. The government and other stakeholders should encourage MSMEs to digitalize as a strategy for survival in times of crisis by offering training, infrastructure support, and collaboration in the digital ecosystem. Finally, our findings demonstrate that BRI’s strategy of emphasizing PEN in the form of new loans and a combination of interventions has played a significant role in strengthening Indonesian MSMEs’ resilience.

Author Contributions

Conceptualization, S.S.; Methodology, H.A. All authors have read and agreed to the published version of the manuscript.

Funding

This research received no external funding.

Institutional Review Board Statement

Not applicable.

Informed Consent Statement

Not applicable.

Conflicts of Interest

The authors declare no conflict of interest.

References

  1. Adam, Latif, and Esta Lestari. 2017. Indonesia’s guaranteed microfinance programme (KUR): Lessons from the first stage of implementation. Journal of Southeast Asian Economies 34: 322–44. [Google Scholar] [CrossRef]
  2. ADB. 2020. Asia Small and Medium-Sized Enterprise Monitor 2020: COVID-19 Impact on Micro, Small, and Medium-Sized Enterprises in Developing Asia: Vol. II (Issue November). Available online: https://www.adb.org/publications/asia-sme-monitor-2020-country-regional-reviews (accessed on 23 November 2021).
  3. Agresti, Alan. 2003. Categorical Data Analysis. Hoboken: John Wiley and Sons. [Google Scholar]
  4. Ali, Imran, Sev Nagalingam, and Bruce Gurd. 2017. Building resilience in SMEs of perishable product supply chains: Enablers, barriers and risks. Production Planning and Control 28: 1236–50. [Google Scholar] [CrossRef]
  5. Barney, Jay, Mike Wright, and David J. Ketchen. 2001. The resource-based view of the firm: Ten years after 1991. Journal of Management 27: 625–41. [Google Scholar] [CrossRef]
  6. Beatty, Robert C., Jung P. Shim, and Mary C. Jones. 2001. Factors influencing corporate web site adoption: A time-based assessment. Information and Management 38: 337–54. [Google Scholar] [CrossRef]
  7. Bourletidis, Konstantinos, and Yiannis Triantafyllopoulos. 2014. SMEs Survival in Time of Crisis: Strategies, Tactics and Commercial Success Stories. Procedia—Social and Behavioral Sciences 148: 639–44. [Google Scholar] [CrossRef] [Green Version]
  8. Brant, Rollin. 1990. Assessing Proportionality in the Proportional Odds Model for Ordinal Logistic Regression. Biometrics 46: 1171. [Google Scholar] [CrossRef]
  9. Caballero-Morales, Santiago Omar. 2021. Innovation as recovery strategy for SMEs in emerging economies during the COVID-19 pandemic. Research in International Business and Finance 57: 101396. [Google Scholar] [CrossRef]
  10. Costa, Joana, and Rafael Castro. 2021. SMEs Must Go Online—E-Commerce as an Escape Hatch for Resilience and Survivability. Journal of Theoretical and Applied Electronic Commerce Research 16: 3043–62. [Google Scholar] [CrossRef]
  11. Djufri, Farhan, Basri Modding, Zainuddin Rahman, and Dahlia Baharuddin. 2021. The Effectiveness of Small Business Loans and People’s Business Loans on Increasing Competitiveness through Small Business Financial Performance at PT. Bank Mandiri, Sulawesi Maluku, Indonesia. American Journal of Humanities and Social Sciences Research (AJHSSR) 5: 194–203. [Google Scholar]
  12. Eller, Robert, Philip Alford, Andreas Kallmünzer, and Mike Peters. 2020. Antecedents, consequences, and challenges of small and medium-sized enterprise digitalization. Journal of Business Research 112: 119–27. [Google Scholar] [CrossRef]
  13. Fitriasari, Fika. 2020. How do Small and Medium Enterprises (SMEs) Survive the COVID-19 Outbreak? Jurnal Inovasi Ekonomi 5: 53–62. [Google Scholar] [CrossRef]
  14. Folta, Timothy B., Arnold C. Cooper, and Yoon Suk Baik. 2006. Geographic cluster size and firm performance. Journal of Business Venturing 21: 217–42. [Google Scholar] [CrossRef]
  15. Giotopoulos, Ioannis, Alexandra Kontolaimou, and Aggelos Tsakanikas. 2017. Drivers of high-quality entrepreneurship: What changes did the crisis bring about? Small Business Economics 48: 913–30. [Google Scholar] [CrossRef]
  16. Hermawan, Marko S., and Ubaidillah Nugraha. 2022. The Development of Small-Medium Enterprises (SMEs) and the Role of Digital Ecosystems During the COVID-19 Pandemic: A Case of Indonesia. In Handbook of Research on Current Trends in Asian Economics, Business, and Administration. Guangzhou: IGI Global. [Google Scholar]
  17. Holmes, Phil, Andrew John Hunt, and Ian Stone. 2010. An analysis of new firm survival using a hazard function. Applied Economics 42: 185–95. [Google Scholar] [CrossRef] [Green Version]
  18. ITC. 2020. International Trade Centre’s 2020 SME Competitiveness Outlook. Available online: https://www.intracen.org/smeco2020/ (accessed on 30 November 2021).
  19. Joseph, Emil, and M. M. Dhanabhakyam. 2021. Role of Digitalization Post-Pandemic for Development of SMEs. In Handbook of Research on Sustaining SMEs and Entrepreneurial Innovation in the Post-COVID-19 Era. Guangzhou: IGI Global, pp. 310–30. [Google Scholar] [CrossRef]
  20. Klein, Vinícius Barreto, and José Leomar Todesco. 2021. COVID-19 crisis and SMEs responses: The role of digital transformation. Knowledge and Process Management 28: 117–33. [Google Scholar] [CrossRef]
  21. Martí, José, and Anita Quas. 2018. A beacon in the night: Government certification of SMEs towards banks. Small Business Economics 50: 397–413. [Google Scholar] [CrossRef]
  22. Miceli, Antonio, Birgit Hagen, Maria Pia Riccardi, Francesco Sotti, and Davide Settembre-Blundo. 2021. Thriving, not just surviving in changing times: How sustainability, agility and digitalization intertwine with organizational resilience. Sustainability 13: 2052. [Google Scholar] [CrossRef]
  23. Najib, Mukhamad, Abdul Aziz Abdul Rahman, and Farah Fahma. 2021. Business survival of small and medium-sized restaurants through a crisis: The role of government support and innovation. Sustainability 13: 10535. [Google Scholar] [CrossRef]
  24. Nasco, Suzanne Altobello, Elizabeth Grandón Toledo, and Peter P. Mykytyn. 2008. Predicting electronic commerce adoption in Chilean SMEs. Journal of Business Research 61: 697–705. [Google Scholar] [CrossRef]
  25. Ndiaye, Ndeye, Lutfi Abdul Razak, Ruslan Nagayev, and Adam Ng. 2018. Demystifying small and medium enterprises’ (SMEs) performance in emerging and developing economies. Borsa Istanbul Review 18: 269–81. [Google Scholar] [CrossRef]
  26. Nitani, Miwako, and Allan Riding. 2015. Risk factors and the Canada Small Business Financing Program. Journal of Small Business and Entrepreneurship 27: 251–74. [Google Scholar] [CrossRef]
  27. Olawale, Fatoki, and David Garwe. 2010. Obstacles to the growth of new SMEs in South Africa: A principal component analysis approach. African Journal of Business Management 4: 729–38. Available online: http://www.academicjournals.org/AJBM (accessed on 29 November 2021).
  28. Park, Soonae, In Hyeock Lee, and Jung Eun Kim. 2020. Government support and small- and medium-sized enterprise (SME) performance: The moderating effects of diagnostic and support services. Asian Business and Management 19: 213–38. [Google Scholar] [CrossRef]
  29. Rajagopaul, Agesan, Nomfanelo Magwentshu, and Shakeel Kalidas. 2020. How South African SMEs can survive and thrive post COVID-19. In Providing the Right Support to Enable SME Growth Now and Beyond the Crisis. Brussels: McKinsey and Company, Available online: https://www.brookings (accessed on 30 November 2021).
  30. Supardi, and Syamsul Hadi. 2020. New Perspective on the Resilience of SMEs Proactive, Adaptive, Reactive from Business Turbulence: A Systematic Review. Journal of Xi’an University of Architecture and Technology 12: 1265–75. [Google Scholar] [CrossRef]
  31. Tambunan, Tulus T.H. 2018. The Performance of Indonesia’s Public Credit Guarantee Scheme for MSMEs: A Regional Comparative Perspective. Journal of Southeast Asian Economies (JSEAE) 35: 319–32. [Google Scholar] [CrossRef]
  32. Taneo, Stefanus Yufra M., Sunday Noya, Melany Melany, and Etsa Astridya SETIYATI. 2022. The Role of Local Government in Improving Resilience and Performance of Small and Medium-Sized Enterprises in Indonesia. Journal of Asian Finance 9: 245–56. [Google Scholar] [CrossRef]
  33. Teo, Thompson S.H., and Yujun Pian. 2003. A contingency perspective on Internet adoption and competitive advantage. European Journal of Information Systems 12: 78–92. [Google Scholar] [CrossRef]
  34. Verhoef, Peter C., and Tammo H.A. Bijmolt. 2019. Marketing perspectives on digital business models: A framework and overview of the special issue. International Journal of Research in Marketing 36: 341–49. [Google Scholar] [CrossRef]
  35. Williams, Richard. 2006. Generalized ordered logit/partial proportional odds models for ordinal dependent variables. Stata Journal 6: 58–82. [Google Scholar] [CrossRef] [Green Version]
  36. Wolk, Agnieszka, and Bernd Skiera. 2009. Antecedents and consequences of Internet channel performance. Journal of Retailing and Consumer Services 16: 163–73. [Google Scholar] [CrossRef]
  37. Wonglimpiyarat, Jarunee, and Napaporn Yuberk. 2005. In support of innovation management and Roger’s Innovation Diffusion theory. Government Information Quarterly 22: 411–22. [Google Scholar] [CrossRef]
Figure 1. Distribution of resilience variable.
Economies 10 00160 g001
Figure 2. Adjusted predicted value of probability. (a) predictive value based on sales resilience; (b) Predictive value based on liquidity; (c) Predictive analysis based on profitability.
Economies 10 00160 g002
Table 1. Operational variables.
VariableDescriptionDimension
Dependent variables
Resilience 1 (Sales)Sales volumeOrdinal, 1 = decrease, 2 = stagnant, 3 = increase
Resilience 2 (Liquidity)Ability to pay current liabilitiesOrdinal, 1 = decrease, 2 = stagnant, 3 = increase
Resilience 3 (Profitability)Ability to generate profitOrdinal, 1 = decrease, 2 = stagnant, 3 = increase
Independent variables
PEN and BRI supportWhether a respondent received National Economic recovery program and BRI Support for MSMEs during COVID-19Dummy categorical,
1 = none,
2 = receives a new credit support only
3 = receives a new credit support and interest rate subsidy and/or credit restructuring scheme
4 = receives interest rate subsidy only
5 = receives credit restructuring scheme only
6 = receives both interest rate subsidy and credit restructuring scheme
Length of digitalizationHow long the respondent has been utilized internet application for transactionDummy categorical, 1 = never online; 2 = >one year; 3 = online one to three years; 4 = online >three years
Business characteristics
LocationBusiness locationDummy, 1 = urban, 0 = other
RegionRegion of businessDummy categorical, 1 = Sumatra, 2 = Jawa and Bali, 3 = other
SectorMSME sectorDummy categorical, 1 = agriculture, 2 = industry, 3 = retail, 4 = service, 5 = others
Market areaMarket coverageDummy categorical, 1 = local district, 2 = several districts in a province, 3 = national/international coverage
Firm sizeSize of the MSMEsDummy categorical, 1 = micro 2 = small 3 = medium
Firm ageAge of the MSMEContinuous
Shiftingshifting business sector during pandemicDummy, 1 = yes, 0 = other
Owner characteristics
Owner educationEducation of the MSME ownersDummy categorical, 1 = elementary school and under, 2 = junior high school, 3 = senior high school, 4 = university/diploma
Owner genderGender of the MSME ownersDummy, 1 = male, 0 = lainnya
Table 2. Brant test of parallel regression assumption.
Model (Dependent var.)All
chi-Squaredp > chi-Squared
Salesval45.840.010
Liquidity71.760.000
Rentability125.890.000
The null hypothesis is that there was no difference in the coefficients between models.
Table 3. Descriptive Statistics.
VariablesDescription Change Q2 2021 vs. QI 2021
Dist.Sales ValueLiquidityProfitability
123123123
LocationUrban41.7737.7722.5139.7228.4939.1632.3537.4524.9437.61
Rural58.2335.3020.6344.0726.5238.1335.3536.8720.7842.35
RegionSumatra21.7534.6619.4345.9126.0135.8838.1036.1118.9744.91
Jawa & Bali52.2239.0120.8440.1529.9239.3230.7539.9922.0237.99
Other26.0332.3524.2343.4123.2739.2637.4732.1626.4741.37
SectorAgriculture21.3030.0020.6349.3819.5336.8843.5935.2317.5847.19
Industry6.4240.6721.7637.5632.9036.7930.3141.9724.3533.68
Retail52.4436.6921.3641.9529.0438.2132.7535.4522.5641.99
Service10.642.5422.1435.3231.7141.6026.6943.8027.4728.73
Other9.2438.7422.5238.7426.8542.1630.9939.8226.6733.51
Market AreaOne district only77.4736.6722.1341.2027.2839.433.3237.2123.3539.44
Several districts in one province14.7335.2518.5346.2128.0234.837.1836.1619.6644.18
Several provinces/national/export7.834.9719.8345.2026.6537.3136.0337.9519.6242.43
Online yearsNever75.8936.8922.0241.1027.6839.2833.0537.5022.8539.65
Online <1 year2.5328.9527.6343.4226.9741.4531.5832.8928.2938.82
Online 1–3 years14.4435.2517.8646.8926.0434.7939.1735.7120.3943.89
Online >3 years7.1435.2020.0544.7626.5737.5335.9037.3021.2141.49
Firm sizeMicro84.1635.7121.6742.6126.9738.3234.7036.5022.8840.62
Small13.3139.7519.8840.3829.3839.6331.0040.1320.5039.38
Medium2.5338.8221.0540.1328.9540.7930.2641.4521.0537.50
Firm age (y)<1046.2635.5021.2643.2426.4439.9333.6335.6123.3541.04
10–2035.8037.1921.2941.5228.8237.3833.8038.6821.4839.84
21–3013.7536.8022.0341.1627.8537.1734.9937.0523.0039.95
31–403.4136.1020.4943.4122.4437.5640.0039.0220.0040.98
>400.7838.3029.7931.9125.5340.4334.0446.8123.4029.79
ShiftingYes1.3645.1220.7334.1531.7135.3732.9348.7815.8535.37
No98.6436.2121.4342.3727.2838.6034.1236.9522.6140.44
Owner education1 = elementary and under19.2735.7521.1643.0926.6036.7936.6138.2622.1939.55
2 = junior high18.7738.0322.4339.5428.5538.8332.6238.6523.6737.68
3 = senior high44.2736.221.4742.3328.4638.3533.2037.1122.3340.56
4 = university/diploma17.6935.4720.5144.0324.0840.7335.1834.2422.1143.65
Owner genderMale68.3536.320.8942.827.8537.7634.3837.5021.8240.69
Female31.6536.3822.5641.0626.2440.2733.4936.2824.0339.70
PEN1 = none 39.2934.5223.342.1924.8241.4233.7634.1825.7540.07
2 = new credit13.5332.621.6545.7620.341.738.0135.9219.5644.53
3 = new credit and rate subsidy and/or credit restructuring6.0729.0420.0050.9620.8238.6340.5531.2326.0342.74
4 = rate subsidy only7.1936.8121.7641.4428.2435.1936.5736.5719.9143.52
5 = credit restructuring only27.6141.2919.1739.5434.4834.9030.6242.8620.1337.01
6 = rate subsidy and credit restructuring6.3140.3720.0539.5832.1933.7734.0439.0518.7342.22
Note: 1 = decrease, 2 = stable, and 3 = increase.
Table 4. The Generalized Ordered Logit Estimation Output.
Output Sales ValueLiquidityProfitability
VARIABLESPanel 1 (1 vs. 2, 3)Panel 2 (1, 2 vs. 3)Panel 1 (1 vs. 2, 3)Panel 2 (1, 2 vs. 3)Panel 1 (1 vs. 2, 3)Panel 2 (1, 2 vs. 3)
coef.RRRcoef.RRRcoef.RRRcoef.RRRcoef.RRRcoef.RRR
PEN (base = none)
2. Only receive new loan0.09851.1040.09851.1040.177 **1.194 **0.177 **1.194 **−0.07720.9260.176 **1.192 **
(0.0765)(0.0844)(0.0765)(0.0844)(0.0759)(0.0906)(0.0759)(0.0906)(0.0851)(0.0788)(0.0825)(0.0984)
3. Receive new loan, and restructuring/interest rate subsidy0.313 ***1.367 ***0.313 ***1.367 ***0.261 **1.298 **0.261 **1.298 **0.1261.1340.1261.134
(0.108)(0.147)(0.108)(0.147)(0.106)(0.138)(0.106)(0.138)(0.105)(0.119)(0.105)(0.119)
4. Only receive interest rate subsidy−0.03770.963−0.03770.963−0.1640.8490.1421.153−0.08780.9160.1531.166
(0.0988)(0.0952)(0.0988)(0.0952)(0.118)(0.100)(0.110)(0.127)(0.110)(0.101)(0.107)(0.125)
5. Only receive restructuring credit−0.234 ***0.791 ***−0.1060.900−0.431 ***0.650 ***−0.1030.903−0.351 ***0.704 ***−0.09140.913
(0.0654)(0.0517)(0.0651)(0.0586)(0.0694)(0.0451)(0.0688)(0.0621)(0.0665)(0.0468)(0.0666)(0.0607)
6. Receive interest rate subsidy and credit restructuring−0.1530.858−0.1530.858−0.346 ***0.708 ***0.03691.038−0.202 *0.817 *0.1311.140
(0.105)(0.0901)(0.105)(0.0901)(0.120)(0.0851)(0.118)(0.123)(0.115)(0.0938)(0.113)(0.129)
Online (base = never online)
2. Online <one year 0.2471.2810.2471.2810.04431.0450.04431.0450.07591.0790.07591.079
(0.153)(0.196)(0.153)(0.196)(0.153)(0.160)(0.153)(0.160)(0.152)(0.164)(0.152)(0.164)
3. Online one to three years0.135 *1.145 *0.293 ***1.341 ***0.185 **1.203 **0.368 ***1.445 ***0.166 **1.181 **0.166 **1.181 **
(0.0802)(0.0918)(0.0774)(0.104)(0.0869)(0.105)(0.0797)(0.115)(0.0727)(0.0859)(0.0727)(0.0859)
4. Online >three years0.199 **1.220 **0.199 **1.220 **0.205 **1.228 **0.205 **1.228 **0.1211.1290.1211.129
(0.0987)(0.120)(0.0987)(0.120)(0.0977)(0.120)(0.0977)(0.120)(0.0986)(0.111)(0.0986)(0.111)
Shifting (1 = yes)−0.409 *0.664 *−0.409 *0.664 *−0.1640.848−0.1640.848−0.389 *0.678 *−0.389 *0.678 *
(0.211)(0.140)(0.211)(0.140)(0.210)(0.178)(0.210)(0.178)(0.217)(0.147)(0.217)(0.147)
Control Variable
Location (1 = urban)−0.08580.918−0.08580.918−0.01050.990−0.01050.990−0.08620.917−0.08620.917
(0.0539)(0.0495)(0.0539)(0.0495)(0.0534)(0.0529)(0.0534)(0.0529)(0.0540)(0.0495)(0.0540)(0.0495)
Region (base = Sumatra)
2. Jawa & Bali−0.174 ***0.840 ***−0.174 ***0.840 ***−0.199 ***0.819 ***−0.199 ***0.819 ***−0.215 ***0.806 ***−0.215 ***0.806 ***
(0.0651)(0.0547)(0.0651)(0.0547)(0.0647)(0.0530)(0.0647)(0.0530)(0.0651)(0.0525)(0.0651)(0.0525)
3. others0.1091.115−0.05450.9470.07481.0780.07481.0780.140 *1.150 *−0.07720.926
(0.0780)(0.0870)(0.0753)(0.0713)(0.0713)(0.0768)(0.0713)(0.0768)(0.0780)(0.0897)(0.0757)(0.0700)
Sector (base = trade and retail)
1. Agriculture0.230 ***1.259 ***0.230 ***1.259 ***0.423 ***1.526 ***0.423 ***1.526 ***−0.1030.9020.140 *1.150 *
(0.0699)(0.0880)(0.0699)(0.0880)(0.0696)(0.106)(0.0696)(0.106)(0.0760)(0.0686)(0.0737)(0.0848)
2. Industry−0.225 **0.799 **−0.225 **0.799 **−0.176 *0.839 *−0.176 *0.839 *−0.342 ***0.711 ***−0.342 ***0.711 ***
(0.102)(0.0814)(0.102)(0.0814)(0.101)(0.0851)(0.101)(0.0851)(0.101)(0.0720)(0.101)(0.0720)
4. Service−0.288 ***0.750 ***−0.288 ***0.750 ***−0.228 ***0.796 ***−0.228 ***0.796 ***−0.374 ***0.688 ***−0.625 ***0.535 ***
(0.0825)(0.0618)(0.0825)(0.0618)(0.0814)(0.0648)(0.0814)(0.0648)(0.0898)(0.0617)(0.0961)(0.0514)
5. Others−0.1420.867−0.1420.867−0.009670.990−0.009670.990−0.212 **0.809 **−0.390 ***0.677 ***
(0.0868)(0.0753)(0.0868)(0.0753)(0.0853)(0.0845)(0.0853)(0.0845)(0.0957)(0.0774)(0.0980)(0.0663)
Market area (base = intra district)
2. Intra−province0.186 ***1.205 ***0.186 ***1.205 ***0.02711.0270.213 ***1.237 ***0.1141.1200.262 ***1.300 ***
(0.0712)(0.0858)(0.0712)(0.0858)(0.0840)(0.0863)(0.0785)(0.0971)(0.0783)(0.0877)(0.0763)(0.0992)
3. Inter−province/national/export0.162 *1.176 *0.162 *1.176 *0.1241.1320.1241.1320.1121.1190.1121.119
(0.0949)(0.112)(0.0949)(0.112)(0.0941)(0.106)(0.0941)(0.106)(0.0951)(0.106)(0.0951)(0.106)
Firm size (base = micro)
2. Small−0.142 *0.868 *−0.142 *0.868 *−0.144 *0.866 *−0.144 *0.866 *−0.180 **0.835 **−0.180 **0.835 **
(0.0749)(0.0650)(0.0749)(0.0650)(0.0737)(0.0638)(0.0737)(0.0638)(0.0749)(0.0626)(0.0749)(0.0626)
3. Medium−0.1020.903−0.1020.903−0.1240.884−0.1240.884−0.2170.805−0.2170.805
(0.157)(0.142)(0.157)(0.142)(0.154)(0.136)(0.154)(0.136)(0.158)(0.127)(0.158)(0.127)
Firm age−0.0149 *0.985 *−0.0149 *0.985 *−0.01350.987−0.01350.987−0.008160.992−0.008160.992
(0.00882)(0.00869)(0.00882)(0.00869)(0.00882)(0.00870)(0.00882)(0.00870)(0.00883)(0.00876)(0.00883)(0.00876)
Firm age20.0003361.0000.0003361.0000.00046 *1.00 *0.00046 *1.00 *0.0001471.0000.0001471.000
(0.00024)(0.00024)(0.00024)(0.00024)(0.00025)(0.00025)(0.00025)(0.00025)(0.00025)(0.00025)(0.00025)(0.00025)
Owner education (base = elementary and below)
2. Junior high−0.1040.901−0.1040.901−0.09410.910−0.09410.910−0.02550.975−0.02550.975
(0.0786)(0.0708)(0.0786)(0.0708)(0.0783)(0.0713)(0.0783)(0.0713)(0.0784)(0.0764)(0.0784)(0.0764)
3. Senior high−0.002460.998−0.002460.998−0.07780.925−0.07780.9250.07541.0780.07541.078
(0.0677)(0.0676)(0.0677)(0.0676)(0.0673)(0.0623)(0.0673)(0.0623)(0.0676)(0.0729)(0.0676)(0.0729)
4.PT/diploma0.06211.0640.06211.0640.181 *1.198 *−0.01860.9820.226 ***1.254 ***0.226 ***1.254 ***
(0.0837)(0.0890)(0.0837)(0.0890)(0.0963)(0.115)(0.0898)(0.0882)(0.0835)(0.105)(0.0835)(0.105)
Owner gender (1 = male)0.03361.0340.03361.034−0.02990.971−0.02990.971−0.005380.995−0.005380.995
(0.0530)(0.0548)(0.0530)(0.0548)(0.0526)(0.0510)(0.0526)(0.0510)(0.0530)(0.0527)(0.0530)(0.0527)
Constant0.767 ***2.154 ***−0.1400.8691.232 ***3.428 ***−0.609 ***0.544 ***0.849 ***2.336 ***−0.209 *0.812 *
(0.116)(0.250)(0.116)(0.101)(0.117)(0.401)(0.116)(0.0630)(0.118)(0.275)(0.117)(0.0948)
Pseudo R20.01220.01860.0179
LR chi−squared155.86 ***242.91 ***230.15 ***
Observations600960096009600960096009600960096009600960096009
Standard errors in parentheses. *** p < 0.01, ** p < 0.05, * p < 0.1.
Publisher’s Note: MDPI stays neutral with regard to jurisdictional claims in published maps and institutional affiliations.

