
Efficiency Comparison of Pro-Growth Poverty Reduction Spending before and during the COVID-19 Pandemic: A Study of Regional Governments in Indonesia

 ,
, 
Abstract
:1. Introduction
2. Theoretical Background
2.1. Output Used in Efficiency Measurement
2.2. Inputs Used in Efficiency Measurement
3. Materials and Method
3.1. Dataset
3.2. Data Envelopment Analysis
- Objective function
- Subject to
4. Research Results and Discussion
5. Conclusions
Author Contributions
Funding
Acknowledgments
Conflicts of Interest
References
- Abdieva, Raziiakhan, Damira Baigonushova, and Junus Ganiev. 2017. Relationship between government expenditure and economic growth in transition Countries: Case of Kyrgyzstan and Tajikistan. Bilig 83: 241–58. Available online: http://bilig.yesevi.edu.tr/yonetim/icerik/makaleler/2083-published.pdf (accessed on 11 June 2021).
- Afonso, Antonio, João Tovar Jalles, and Ana Venâncio. 2021. Structural Tax Reforms and Public Spending Efficiency. Open Economies Review 32: 1017–61. [Google Scholar] [CrossRef]
- Albassam, Bassam A. 2020. A model for assessing the efficiency of government expenditure. Cogent Economics and Finance 8: 1823065. [Google Scholar] [CrossRef]
- Alper, F. Ozlem, and Mehmet Demiral. 2016. Public Social Expenditures and Economic Growth: Evidence from Selected OECD Countries. Research in World Economy 7: 44–51. [Google Scholar] [CrossRef] [Green Version]
- Ambarkhane, Dilip, Ardhendu Shekhar Singh, and Bhama Venkataramani. 2020. Measuring efficiency of Indian states for reducing poverty using data envelopment analysis. Poverty and Public Policy 12: 357–85. [Google Scholar] [CrossRef]
- Antonelli, Maria Alessandra, and Valeria De Bonis. 2018. The efficiency of social public expenditure in European countries: A two-stage analysis. Applied of Economucs 51: 47–60. [Google Scholar] [CrossRef]
- Babatunde, Shakirat Adepeju. 2018. Government spending on infrastructure and economic growth in Nigeria. Economic Research-Ekonomska Istrazivanja 31: 997–1014. [Google Scholar] [CrossRef] [Green Version]
- Bogetoft, Peter, and Lars Otto. 2011. Benchmarking with DEA, SFA, and R. New York: Springer. [Google Scholar]
- Brini, Riadh, and Hatem Jemmali. 2016. Public spending efficiency, governance, political and economic policies: Is there a substantial causal relation? Evidence from selected MENA countries. International Journal of Economics and Financial Management 1: 24–34. Available online: https://www.researchgate.net/publication/311320727 (accessed on 20 March 2020).
- Celikay, Ferdi, and Erdal Gumus. 2017. The effect of social spending on reducing poverty. International Journal of Social Economics 44: 620–32. [Google Scholar] [CrossRef]
- Coelli, Timothy J., Dodla Sai Prasada Rao, Christopher J. O’Donnell, and George Edward Battese. 2005. An Introduction to Efficiency and Productivity Analysis, 2nd ed. New York: Springer. [Google Scholar]
- Cooper, Willam W., Lawrence M. Seiford, and Kaoru Tone. 2002. Data Envelopment Analysis: A Comprehensive Text with Models, Applications, References, and DEA Solver Software. New York: Kluwer Academic Publishers. [Google Scholar]
- Cyrek, Magdalena. 2019. Government social spending in the EU countries: Efficiency in poverty and income inequality reduction. Equilibrium. Quarterly Journal of Economics and Economic Policy 14: 405–24. [Google Scholar] [CrossRef]
- Dufrechou, Paola Azar. 2016. The efficiency of public education spending in Latin America: A comparison to high income countries. International Journal of Educational Development 49: 188–203. [Google Scholar] [CrossRef]
- Ebunoluwa, Oyegoke O., and Wasiu A. Yusuf. 2018. Effects of Economic Growth on Poverty Reduction In Nigeria. IOSR Journal of Economics and Finance (IOSR-JEF) 9: 25–29. [Google Scholar] [CrossRef]
- Fonayet, Fransesc Valls, Ángel Belzunegui Eraso, and Jorge De Andrés Sánchez. 2020. Efficiency of Social Expenditure Levels in Reducing Poverty Risk in the EU-28. Poverty and Public Policy 12: 43–62. [Google Scholar] [CrossRef]
- Gavurova, Betata, Kristina Kocisova, Lubomir Belas, and Vladimir Krajcik. 2017. Relative efficiency of government expenditure on secondary education. Journal of International Studies 10: 329–43. [Google Scholar] [CrossRef] [PubMed]
- Guo, Xuesong, Jun Zhang, Zhiwei Xu, Xin Cong, and Zhenli Zhu. 2021. The efficiency of provincial government health care expenditure after China’s new health care reform. PLoS ONE 16: e0258274. [Google Scholar] [CrossRef] [PubMed]
- Halaskova, Martina, Renata Halaskova, and Viktor Prokop. 2018. Evaluation of efficiency in selected areas of public services in European Union Countries. Sustainability 10: 4592. [Google Scholar] [CrossRef] [Green Version]
- Hidalgo-Hidalgo, Maria, and Inigo Iturbe-Ormaetxe. 2018. Long-run effects of public expenditure on poverty. Journal of Economic Inequality 16: 1–22. [Google Scholar] [CrossRef] [Green Version]
- Kiendrebeogo, Youssouf, Kossi Assimaidou, and Abdoulaye Tall. 2017. Social protection for poverty reduction in times of crisis. Journal of Policy Modeling 39: 1163–83. [Google Scholar] [CrossRef] [Green Version]
- Kouadio, Hugues Kouassi, and Lewis-Landry Gakpa. 2021. Do economic growth and institutional quality reduce poverty and inequality in West Africa? Journal of Policy Modeling 44: 41–63. [Google Scholar] [CrossRef]
- Lee, Jong Chan, Yi Joong Won, and Sang Young Jei. 2019. Study of the relationship between government expenditures and economic growth for China and Korea. Sustainability 11: 6344. [Google Scholar] [CrossRef] [Green Version]
- Loría, Eduardo. 2020. Poverty trap in Mexico, 1992–2016. International Journal of Development Issues 19: 277–301. [Google Scholar] [CrossRef]
- Mackett, Odille. 2020. Social grants as a tool for poverty reduction in South Africa? A longitudinal analysis using the NIDS survey. African Studies Quarterly 19: 41–64. Available online: https://sites.clas.ufl.edu/africanquarterly/files/V19I1a3.pdf (accessed on 18 November 2021).
- Nakabashi, Luciano. 2018. Poverty and economic development: Evidence for the Brazilian states. EconomiA 19: 445–58. [Google Scholar] [CrossRef]
- Ojede, Andrew, Bebonchu Atems, and Steven Yamarik. 2018. The Direct and Indirect (Spillover) Effects of Productive Government Spending on State Economic Growth. Growth and Change 49: 122–41. [Google Scholar] [CrossRef]
- Olanubi, Sijuola Orioye, and Oluwanbepelumi Esther Osode. 2017. The efficiency of government spending on health: A comparison of different administrations in Nigeria. Journal of Policy Modeling 39: 79–98. [Google Scholar] [CrossRef]
- Olaoye, Olumide O., Oluwatosin O. Eluwole, Aziz Ayesha, and Olugbenga O. Afolabi. 2020. Government spending and economic growth in ECOWAS: An asymmetric analysis. Journal of Economic Asymmetries 22: e00180. [Google Scholar] [CrossRef]
- Ou, Zhirong, Fuwen Zeng, and Xinyu Zhan. 2020. Does Public Spending Structure Affect the Efficiency of Spending? Evidence from a Panel Tobit Model for Chinese Provinces. International Journal of Mangement, Economics and Social Sciences 9: 206–23. [Google Scholar] [CrossRef]
- Ouertani, Mohamed Nejib, Nader Naifar, and Hedi Ben Haddad. 2018. Assessing government spending efficiency and explaining inefficiency scores: DEA-bootstrap analysis in the case of Saudi Arabia. Cogent Economics and Finance 6: 1493666. [Google Scholar] [CrossRef] [Green Version]
- Purmini, Purmini, and Roosemarina Anggraini Rambe. 2021. Labor and Government Policies on Poverty Reduction in Sumatera Island, Indonesia. Jurnal Ekonomi Pembangunan 19: 61–74. [Google Scholar] [CrossRef]
- Rambe, Roosemarina Anggraini. 2020. Implications of Regional Split in Local Government Efficiency: Evidence from North Sumatra, Indonesia. Jurnal Ekonomi Dan Studi Pembangunan 12: 159–75. Available online: http://journal2.um.ac.id/index.php/JESP/article/view/12789 (accessed on 13 March 2021).
- Sasmal, Ritwik, and Joydeb Sasmal. 2016. Public Expenditure, Economic Growth and Poverty Alleviation. International Journal of Social Economics 43: 604–18. [Google Scholar] [CrossRef]
- Sedrakyan, Gohar Samvel, and Laura Varela-Candamio. 2019. Wagner’s law vs. Keynes’ hypothesis in very different countries (Armenia and Spain). Journal of Policy Modeling 41: 747–62. [Google Scholar] [CrossRef]
- Sharif, Naubahar, Kevin Chandra, Athar Mansoor, and Kirti Bhasin Sinha. 2021. A comparative analysis of research and development spending and total factor productivity growth in Hong Kong, Shenzhen, Singapore. Structural Change and Economic Dynamics 57: 108–20. [Google Scholar] [CrossRef]
- Shin, Dong Jin, Byung Sub Cha, and Brian H. S. Kim. 2020. Efficient expenditure allocation for sustainable public services?—Comparative cases of korea and OECD countries. Sustainability 12: 9501. [Google Scholar] [CrossRef]
- Škare, Marinko, and Romina Prziklas Družeta. 2016. Poverty and economic growth: A review. Technological and Economic Development of Economy 22: 156–75. [Google Scholar] [CrossRef] [Green Version]
- Thanh, Su Dinh, Neil Hart, and Nguyen Phuc Canh. 2020. Public spending, public governance and economic growth at the Vietnamese provincial level: A disaggregate analysis. Economic Systems 44: 100780. [Google Scholar] [CrossRef]
- Thorbecke, Erik, and Yusi Ouyang. 2022. Towards A Virtuous Spiral Between Poverty Reduction And Growth: Comparing Sub Saharan Africa With The Developing World. World Development 152: 105776. [Google Scholar] [CrossRef]
- Tirtosuharto, Darius. 2022. The impact of fiscal efficiency on poverty reduction in Indonesia: Institutional factor and geographical differences. Journal of Geographical Systems 24: 67–93. [Google Scholar] [CrossRef]
- Yang, Guotao, Yue Wang, Huibin Chang, and Qinghua Chen. 2021. Evaluating anti-poverty policy efficiencies in China: Meta-frontier analysis using the two-stage data envelopment analysis model. China Agricultural Economic Review 14: 416–42. [Google Scholar] [CrossRef]


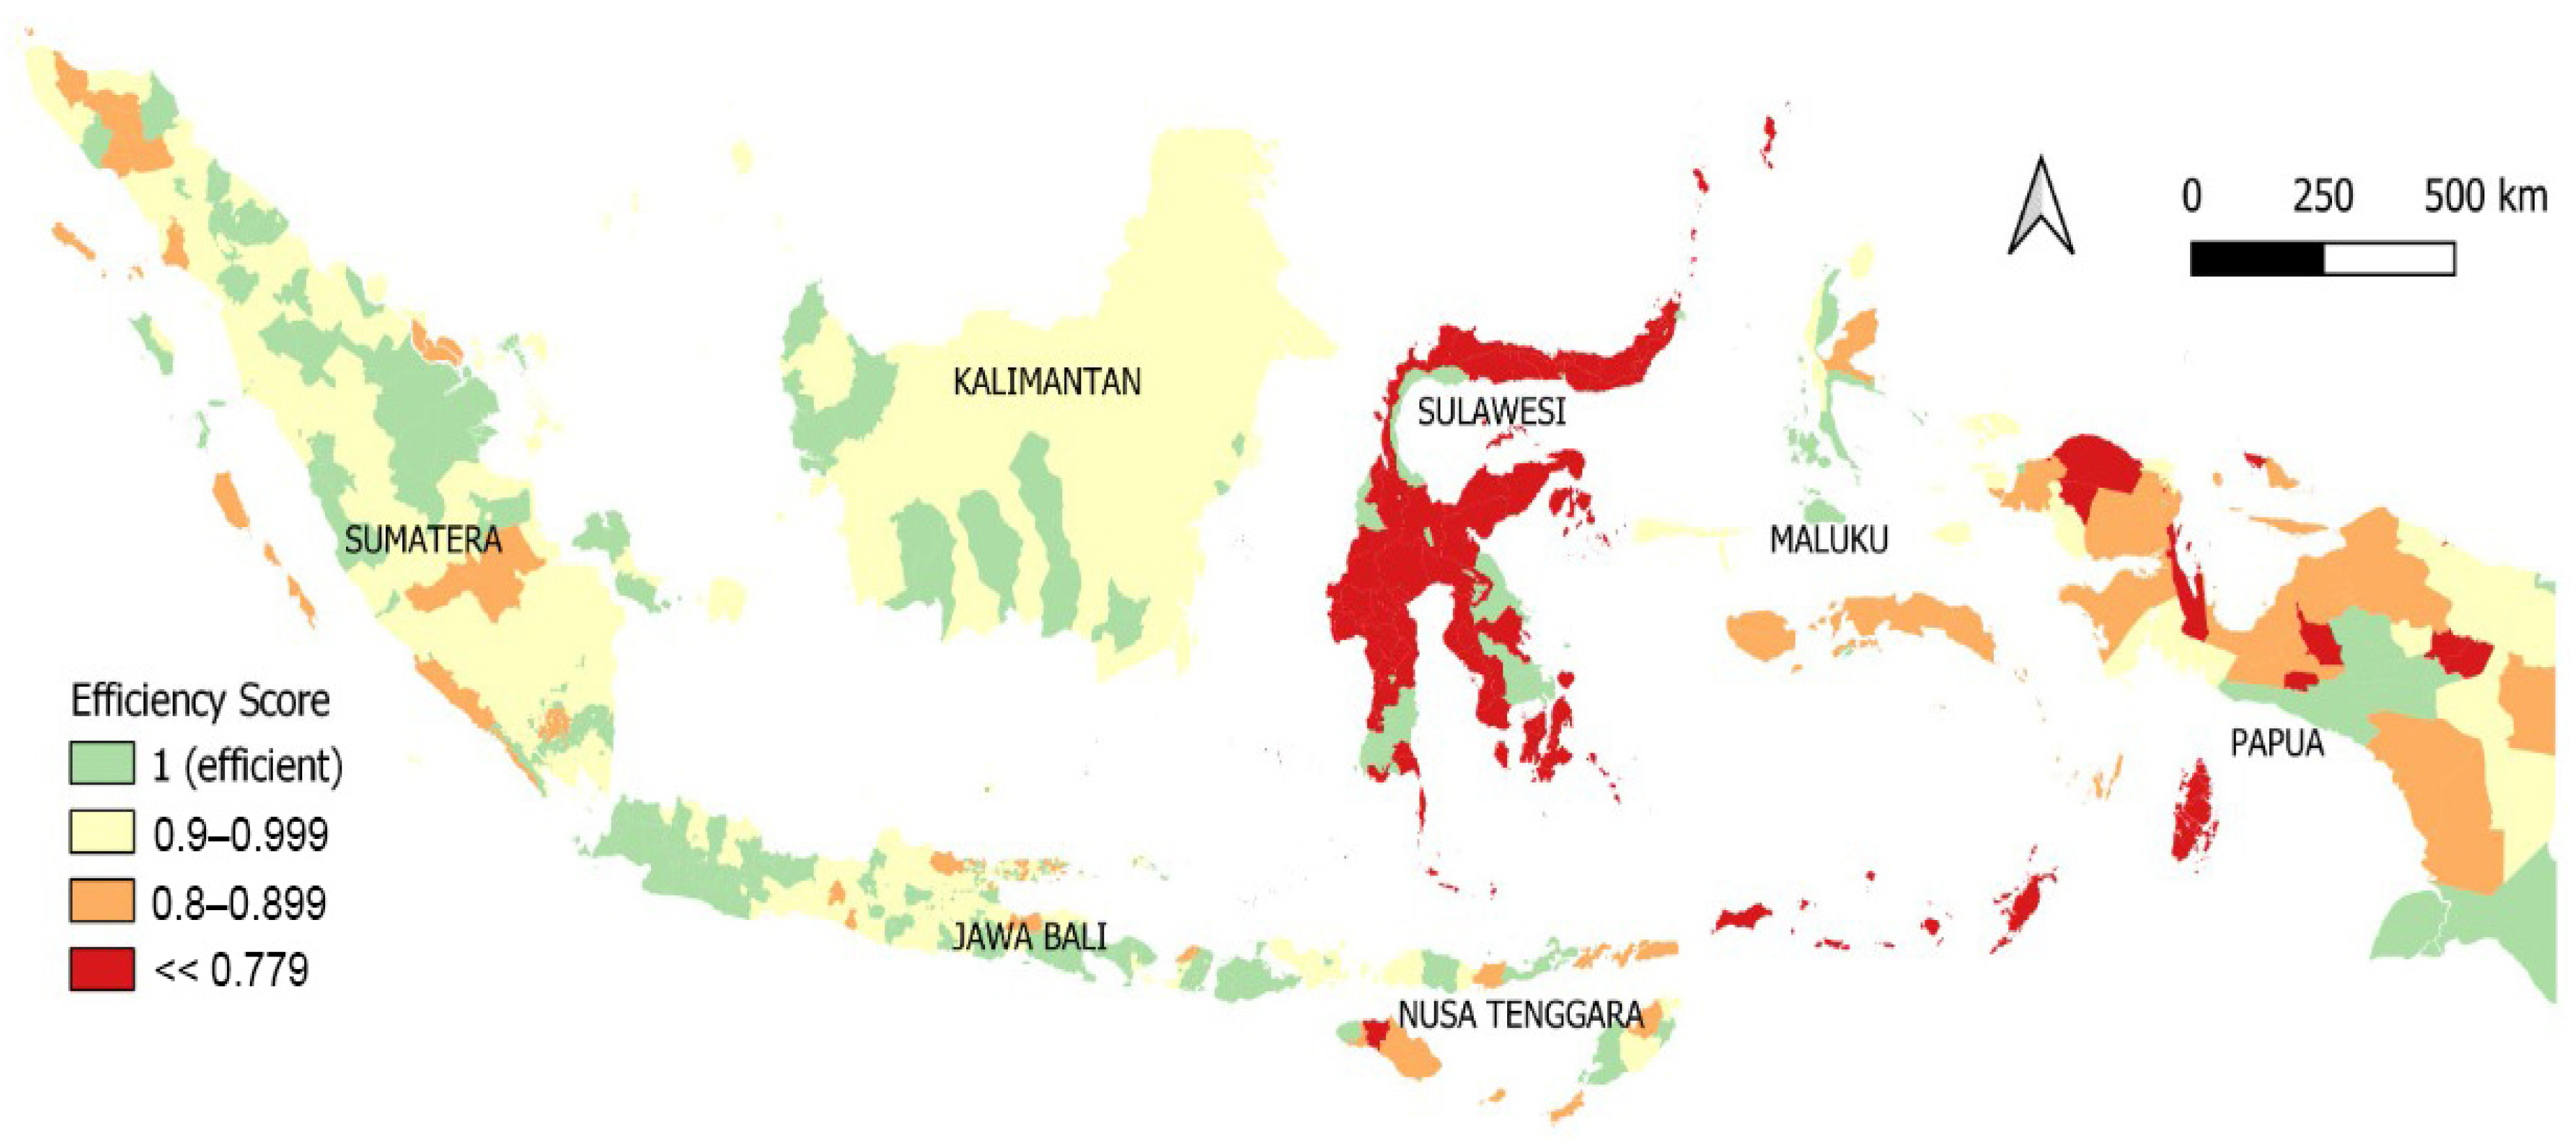
| Region | Item | City/District Government | |||||
|---|---|---|---|---|---|---|---|
| 2015 | 2016 | 2017 | 2018 | 2019 | 2020 | ||
| Java-Bali | No. of efficient local government | 19 | 16 | 19 | 25 | 20 | 40 |
| The ratio of efficient government | 15% | 13% | 15% | 20% | 16% | 32% | |
| Mean of Efficiency | 0.94 | 0.93 | 0.93 | 0.95 | 0.95 | 0.97 | |
| Lowest Efficiency | 0.76 | 0.78 | 0.78 | 0.83 | 0.83 | 0.84 | |
| Sumatra | No. of efficient local government | 16 | 13 | 17 | 21 | 16 | 27 |
| The ratio of efficient government | 10% | 8% | 11% | 14% | 10% | 17% | |
| Mean of Efficiency | 0.94 | 0.92 | 0.92 | 0.94 | 0.98 | 0.94 | |
| Lowest Efficiency | 0.83 | 0.71 | 0.73 | 0.79 | 0.75 | 0.83 | |
| Kalimantan | No. of efficient local government | 12 | 9 | 14 | 13 | 13 | 15 |
| The ratio of efficient government | 21% | 16% | 25% | 23% | 23% | 27% | |
| Mean of Efficiency | 0.97 | 0.97 | 0.97 | 0.97 | 0.97 | 0.97 | |
| Lowest Efficiency | 0.90 | 0.90 | 0.90 | 0.90 | 0.89 | 0.90 | |
| Sulawesi | No. of efficient local government | 5 | 11 | 12 | 8 | 9 | 14 |
| The ratio of efficient government | 6% | 14% | 15% | 10% | 11% | 17% | |
| Mean of Efficiency | 0.64 | 0.65 | 0.65 | 0.65 | 0.65 | 0.71 | |
| Lowest Efficiency | 0.56 | 0.57 | 0.57 | 0.58 | 0.59 | 0.60 | |
| Nusa Tenggara | No. of efficient local government | 7 | 9 | 11 | 9 | 10 | 13 |
| The ratio of efficient government | 17% | 21% | 27% | 21% | 24% | 32% | |
| Mean of Efficiency | 0.89 | 0.90 | 0.95 | 0.98 | 0.95 | 0.94 | |
| Lowest Efficiency | 0.71 | 0.70 | 0.88 | 0.82 | 0.86 | 0.73 | |
| Maluku | No. of efficient local government | 4 | 7 | 5 | 5 | 4 | 5 |
| The ratio of efficient government | 20% | 35% | 25% | 25% | 20% | 25% | |
| Mean of Efficiency | 0.88 | 0.90 | 0.89 | 0.89 | 0.92 | 0.89 | |
| Lowest Efficiency | 0.70 | 0.72 | 0.72 | 0.72 | 0.79 | 0.73 | |
| Papua | No. of efficient local government | 9 | 9 | 9 | 8 | 7 | 9 |
| The ratio of efficient government | 21% | 21% | 21% | 19% | 17% | 21% | |
| Mean of Efficiency | 0.86 | 0.83 | 0.88 | 0.85 | 0.96 | 0.87 | |
| Lowest Efficiency | 0.68 | 0.66 | 0.67 | 0.63 | 0.88 | 0.66 | |
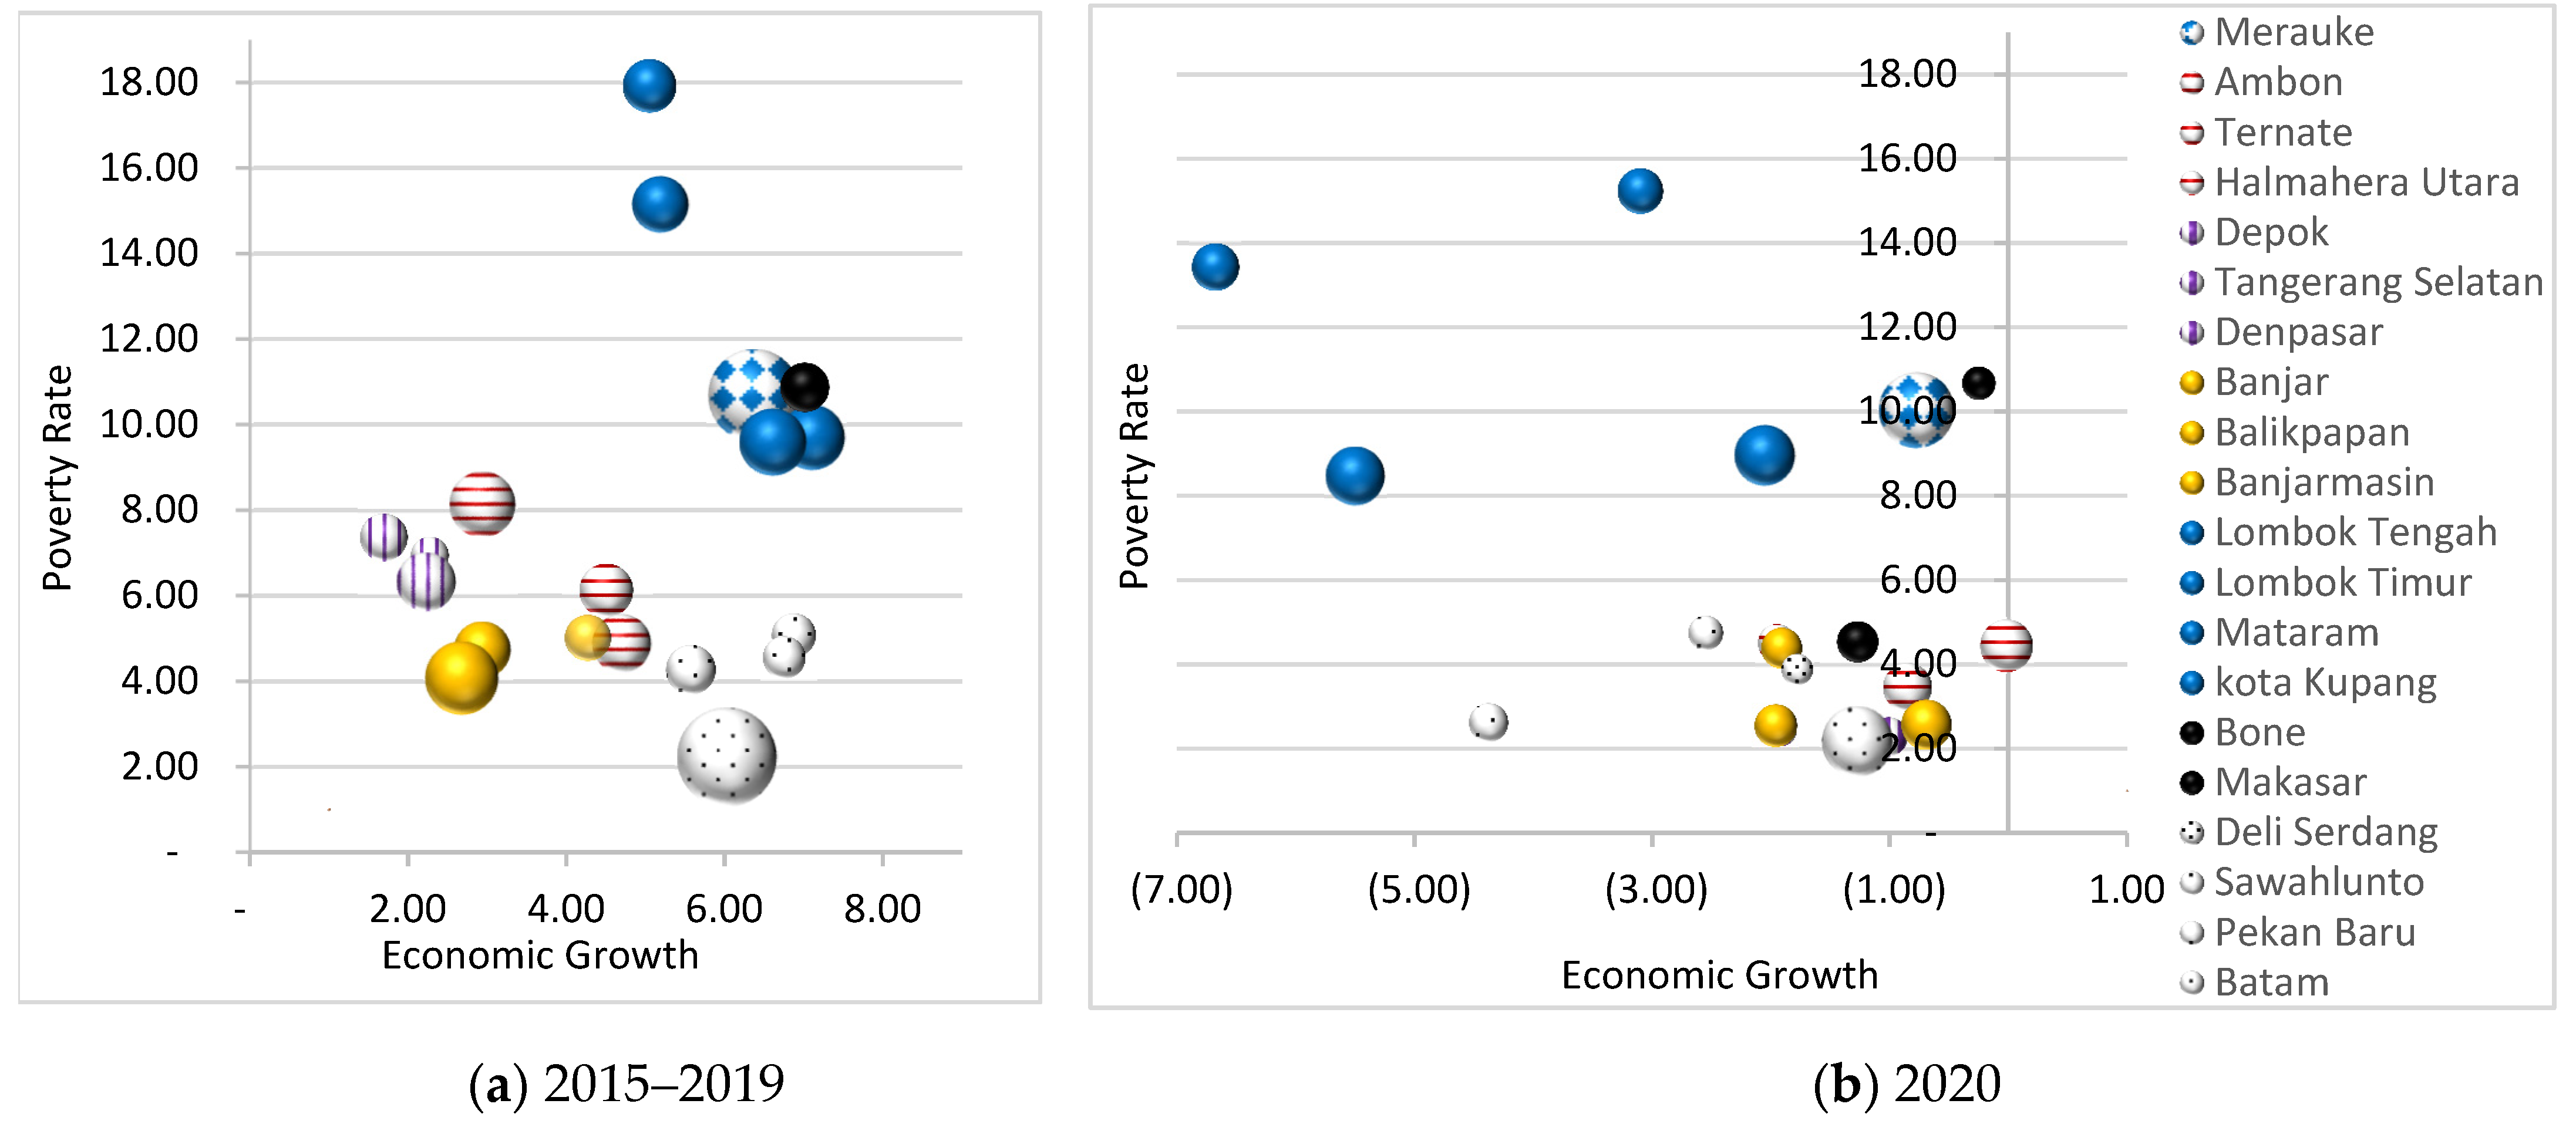
| Region | Five Types of Spending/Capita (000IDR) | Economic Growth (in %) | Poverty Rate (in %) | |||
|---|---|---|---|---|---|---|
| 2015–2019 | 2020 | 2015–2019 | 2020 | 2015–2019 | 2020 | |
| Java-Bali | 162–410 | 210–474 | 4.94–7.37 | (1.01)–(9.42) | 2.27–10.44 | 2.14–9.31 |
| Sumatra | 215–1171 | 195–987 | 5.57–6.87 | (1.27)–(4.38) | 2.22–5.08 | 2.16–4.75 |
| Kalimantan | 253–635 | 332–498 | 4.07–5.02 | (0.69)–(1.96) | 2.68–4.27 | 2.55–4.39 |
| Sulawesi | 286–235 | 221–338 | 7.01–9.53 | (0.25)–(1.27) | 4.28–10.88 | 4.54–10.68 |
| Nusa Tenggara | 336–531 | 413–721 | 5.05–7.11 | (2.05)–(6.68) | 9.59–17.93 | 8.47–15.24 |
| Maluku | 338–511 | 287–547 | 4.88–8.13 | (0.02)–(1.95) | 2.94–4.70 | 3.46–4.51 |
| Papua | 1012 | 1135 | 6.38 | (0.77) | 10.68 | 10.03 |
| Regions | Local Governments | 2015–2019 | 2020 | ||||
|---|---|---|---|---|---|---|---|
| EG | PR | Spending/Cap (000IDR) | EG | PR | Spending/Cap (000IDR) | ||
| Papua | Merauke | 6.38 | 10.68 | 1012.73 | −0.77 | 10.03 | 1135.62 |
| Maluku | Ambon | 6.13 | 4.50 | 338.59 | −1.95 | 4.51 | 287.55 |
| Ternate | 8.13 | 2.94 | 511.78 | −0.85 | 3.46 | 470.97 | |
| Jawa-Bali | Depok | 6.94 | 2.27 | 170.30 | −1.92 | 2.45 | 212.93 |
| Tangerang Selatan | 7.37 | 1.69 | 267.69 | −1.01 | 2.29 | 294.27 | |
| Denpasar | 6.32 | 2.23 | 410.37 | −9.42 | 2.14 | 474.68 | |
| Kalimantan | Balikpapan | 4.07 | 2.68 | 635.24 | −0.69 | 2.57 | 498.46 |
| Nusa tenggara | Lombok Tengah | 5.19 | 15.15 | 376.29 | −6.68 | 13.44 | 446.93 |
| Lombok Timur | 5.05 | 17.93 | 336.78 | −3.10 | 15.24 | 413.11 | |
| Mataram | 7.11 | 9.70 | 501.30 | −5.50 | 8.47 | 687.13 | |
| Kota Kupang | 6.61 | 9.59 | 531.56 | −2.05 | 8.96 | 721.66 | |
Publisher’s Note: MDPI stays neutral with regard to jurisdictional claims in published maps and institutional affiliations. |
© 2022 by the authors. Licensee MDPI, Basel, Switzerland. This article is an open access article distributed under the terms and conditions of the Creative Commons Attribution (CC BY) license (https://creativecommons.org/licenses/by/4.0/).
Share and Cite
Rambe, R.A.; Purmini, P.; Armelly, A.; Alfansi, L.; Febriani, R.E. Efficiency Comparison of Pro-Growth Poverty Reduction Spending before and during the COVID-19 Pandemic: A Study of Regional Governments in Indonesia. Economies 2022, 10, 150. https://doi.org/10.3390/economies10060150
Rambe RA, Purmini P, Armelly A, Alfansi L, Febriani RE. Efficiency Comparison of Pro-Growth Poverty Reduction Spending before and during the COVID-19 Pandemic: A Study of Regional Governments in Indonesia. Economies. 2022; 10(6):150. https://doi.org/10.3390/economies10060150
Chicago/Turabian StyleRambe, Roosemarina Anggraini, Purmini Purmini, Armelly Armelly, Lizar Alfansi, and Ratu Eva Febriani. 2022. "Efficiency Comparison of Pro-Growth Poverty Reduction Spending before and during the COVID-19 Pandemic: A Study of Regional Governments in Indonesia" Economies 10, no. 6: 150. https://doi.org/10.3390/economies10060150