Article

Actor Fluidity and Knowledge Persistence in Regional Inventor Networks

Department of Economics, Friedrich Schiller University Jena, Carl-Zeiss-Str. 3, 07743 Jena, Germany
*
Author to whom correspondence should be addressed.
Economies 2022, 10(12), 298; https://doi.org/10.3390/economies10120298
Submission received: 5 October 2022 / Revised: 18 November 2022 / Accepted: 24 November 2022 / Published: 26 November 2022
(This article belongs to the Special Issue Focused Issues and Trends in Economic Research from Germany)

Abstract

:
The development of inventor networks is characterized by the addition of a significant number of new inventors, while a considerable number of incumbent inventors discontinue. We estimated the persistence of knowledge in the inventor networks of nine German regions using alternative assumptions about knowledge transfer. Based on these estimates, we analyzed how the size and structure of a network may influence knowledge persistence over time. In a final step, we assessed how persistent knowledge as well as the knowledge of new inventors affect the performance of regional innovation systems (RIS). The results suggest that the knowledge of new inventors is much more important for RIS performance than old knowledge that persists.
JEL Classification:
O3; R1; D2; D8

1. Fluidity of Network Actors and Regional Knowledge

Well-functioning regional innovation systems (RIS) are characterized by a high level of knowledge transfer and the division of innovative labor (Asheim et al. 2019). This means that the relationships between actors within and outside a region can play a key role in the development of the regional knowledge base and the performance of RIS. The network of relationships among actors that are involved in innovation processes may, therefore contribute to explaining the scope, nature, and efficiency of regional innovation activity (Ejermo and Karlsson 2006; Jackson 2008; Cantner and Graf 2011).
Innovation networks are not static at all and may be characterized by rather high levels of newly emerging actors, while many incumbent actors withdraw from regional innovation processes. The rather few empirical studies that have analyzed the dynamics of actors and their links in innovation networks (Fritsch and Zoellner 2020; Fritsch and Kudic 2021; Greve et al. 2009; Ramlogan and Consoli 2014) have shown surprisingly high levels of new and existing actors as well as newly established and terminated links. For example, Fritsch and Zoellner (2020), in an analysis of regional inventor networks, found that more than 78 percent of all inventors were only present in one three-year period, 14.51 percent were active in two periods, and only about 7 percent appeared in networks for more than two successive periods. Only 9.7% of all links between inventors could still be found in the successive period. Analyzing the effect of fluidity on the structure of the inventor networks, Fritsch and Zoellner (2020) found some statistically significant relationships with the share of the largest network component and the share of isolates. Relating the levels of fluidity to the performance of networks in terms of the number of patents per R&D employee (patent productivity) suggests the positive effects of new actors and links.
The consequences of this high level of actor-turnover or ‘fluidity’ for the network and the performance of the respective regional innovation system (RIS) have largely been unexplored. In general, the high level of fluidity in inventor networks can be regarded as an indication that there are benefits of switching cooperation partners despite considerable transaction costs. These transaction costs involve the effort of establishing new links as well as sunk costs related to abandoning an established link. One specific benefit may be access to new knowledge through newly established links.
The empirical analyses of the performance of inventor networks in German regions by Fritsch and Zoellner (2020) showed mixed results for the relationship between the turnover of inventors with the performance of the respective RIS measured by the level and change in the number of patents per R&D employee (patent productivity). While there was a significantly positive relationship of the share of new inventors with RIS performance, the relationship of patent productivity with the share of discontinued actors was also positive, but showed a negative effect for the share of discontinued links (Fritsch and Zoellner 2020). A possible explanation for the positive relationship between RIS performance and the share of new actors is the additional knowledge that the new inventors add to the system. A reason for the non-negative relationship between the share of discontinued actors and RIS performance may be that the knowledge of discontinuing actors remains with their cooperation partners, who continue in the network.
Based on the data used by Fritsch and Zoellner (2020), this article investigated two potential sources of knowledge, namely persistent knowledge and the knowledge of inventors who newly entered inventor networks in nine German regions. We tried to assess how much of the knowledge of the inventors that disappeared from an inventor network may still be available because it has been passed onto continuing network inventors during their cooperation. For this purpose, we identified the inventors that cooperated with discontinuing inventors and determined whether these co-inventors were included in the network in the subsequent period. We assumed that at least part of the knowledge of a discontinued inventor was still available if the co-inventors were still within the network. Based on alternative assumptions about the amount of knowledge transfer among co-inventors, we estimated the share of knowledge that is still available in the network and analyzed the role of network characteristics that measure the frequency relationships and the integration of inventors in larger components for knowledge continuity. Our analyses suggest that there is a higher level of persistent knowledge in a network that is well-integrated and has a large average component and team size, with relatively high shares of inventors in the largest component, and low shares of isolates. Finally, we analyzed the effect of persistent knowledge and the knowledge of new inventors on the performance of RIS. The results suggest that the knowledge of new inventors is much more important for RIS performance than old knowledge that persists.
Our analyses contribute to the research into the role of inventor networks and their dynamics in regional innovation processes (Cantner and Graf 2011). In particular, our results help understand the capacity of networks not only to generate new knowledge and to disseminate it, but also to retain that knowledge in case the respective inventors leave the network. Moreover, the results link to the literature on brain drain, migration, and innovation (Bahar et al. 2020; Lissoni 2018).
The rest of this paper is organized as follows. In Section 2, we first discuss the cost and the benefits of changing actors and relationships in innovation networks). Section 3 introduces the data and indicators, and in the following section, and we assess the effect of inventor fluidity on the continuity of knowledge in the network in Section 4. We then investigate to what extent the level of knowledge continuity is related to characteristics of the respective inventor network in Section 5. The effect of knowledge persistence on the performance of RIS is investigated in Section 6. The final section summarizes the results and conclusions.

2. Actor Turnover, Knowledge Persistence, and Network Characteristics

Knowledge, especially non-codified tacit knowledge, is of fundamental importance for innovations and the performance of RIS (Wang and Wang 2012). Hence, the performance of RIS may suffer if an inventor discontinues their activity and is no longer part of the network. However, if an inventor disappears from a network, their knowledge is not necessarily lost, but may persist in the network because it has been transferred to co-inventors who are still part of the network during the period of their cooperation. Cooperative activities, then, not only lead to the generation of new knowledge, but they may also ensure that knowledge of discontinued inventors persists (Schilling and Phelps 2007). Keeping the knowledge of discontinuing inventors available may be an important way of how networks affect the performance of the respective RIS. If knowledge is transferred by co-inventorship, then the size of inventor teams should be important for the persistence of knowledge (see, Tang et al. 2008). The larger the inventor team, the higher the propensity that one or more of the inventors from the original team who possess at least parts of the discontinued inventor’s knowledge will be available in a successive period. Assuming that the knowledge of inventor teams may also be passed on to inventors who are linked to other inventors but not directly linked to a certain invention, this argument may be extended to the respective network component (see, Fronczak et al. 2004); inventors who are directly and indirectly linked. Hence, RIS with larger inventor teams and larger network components should benefit from a higher intensity of knowledge exchange that may keep the knowledge of discontinuing inventors available. Fritsch and Kudic (2021), in an analysis of inventor networks in German laser technology, found that inventors who became key players in the network had frequently been members of the ego network of an inventor who assumed a role as a key player in a previous period. For these reasons, one may expect:
Hypothesis 1:
The larger the size of inventor teams, the more the knowledge of discontinuing inventors can be stored in the network and is able to persist.
Hypothesis 2:
The larger the size of a network’s components, the more the knowledge of discontinuing inventors can be stored in the network and is able to persist.
It may, however, not only be the size of a network’s components, but also the density of relationships that define a network’s level of cohesion that is important for the amount of knowledge that is transferred within a network (Ahuja 2000; Uzzi and Spiro 2005; Jackson 2008). Cohesion measures the clustering or density of a network (Burt 2001; Cowan and Jonard 2004; Fritsch and Kauffeld-Monz 2010), whereas range describes the average distance between inventors within a network. If a network shows a high level of clustering and a low range, this indicates small world properties. Since more ties between inventors should lead to increased knowledge transfer, the knowledge of discontinuing inventors should more easily persist in dense networks.
Hypothesis 3:
The higher the cohesion of a network, the more the knowledge of discontinuing inventors can persist and is available in later periods.
It is plausible to expect that the performance of a RIS will benefit if knowledge of the discontinuing inventors persists and remains available. Another important source of knowledge that should be important for RIS performance is the entry of new inventors that add new knowledge. Based on these considerations it is expected that:
Hypothesis 4:
The more the knowledge of discontinuing inventors remains available in a network, the better the performance of the respective innovation system.
Hypothesis 5:
The larger the share of new inventors who enter the network and make their knowledge available, the better the performance of the respective innovation system.
It is, however, an open question of which of the two sources of knowledge―new knowledge or knowledge from previous periods that persists―has a more pronounced effect on RIS performance. We will try to answer this question in our empirical analysis.

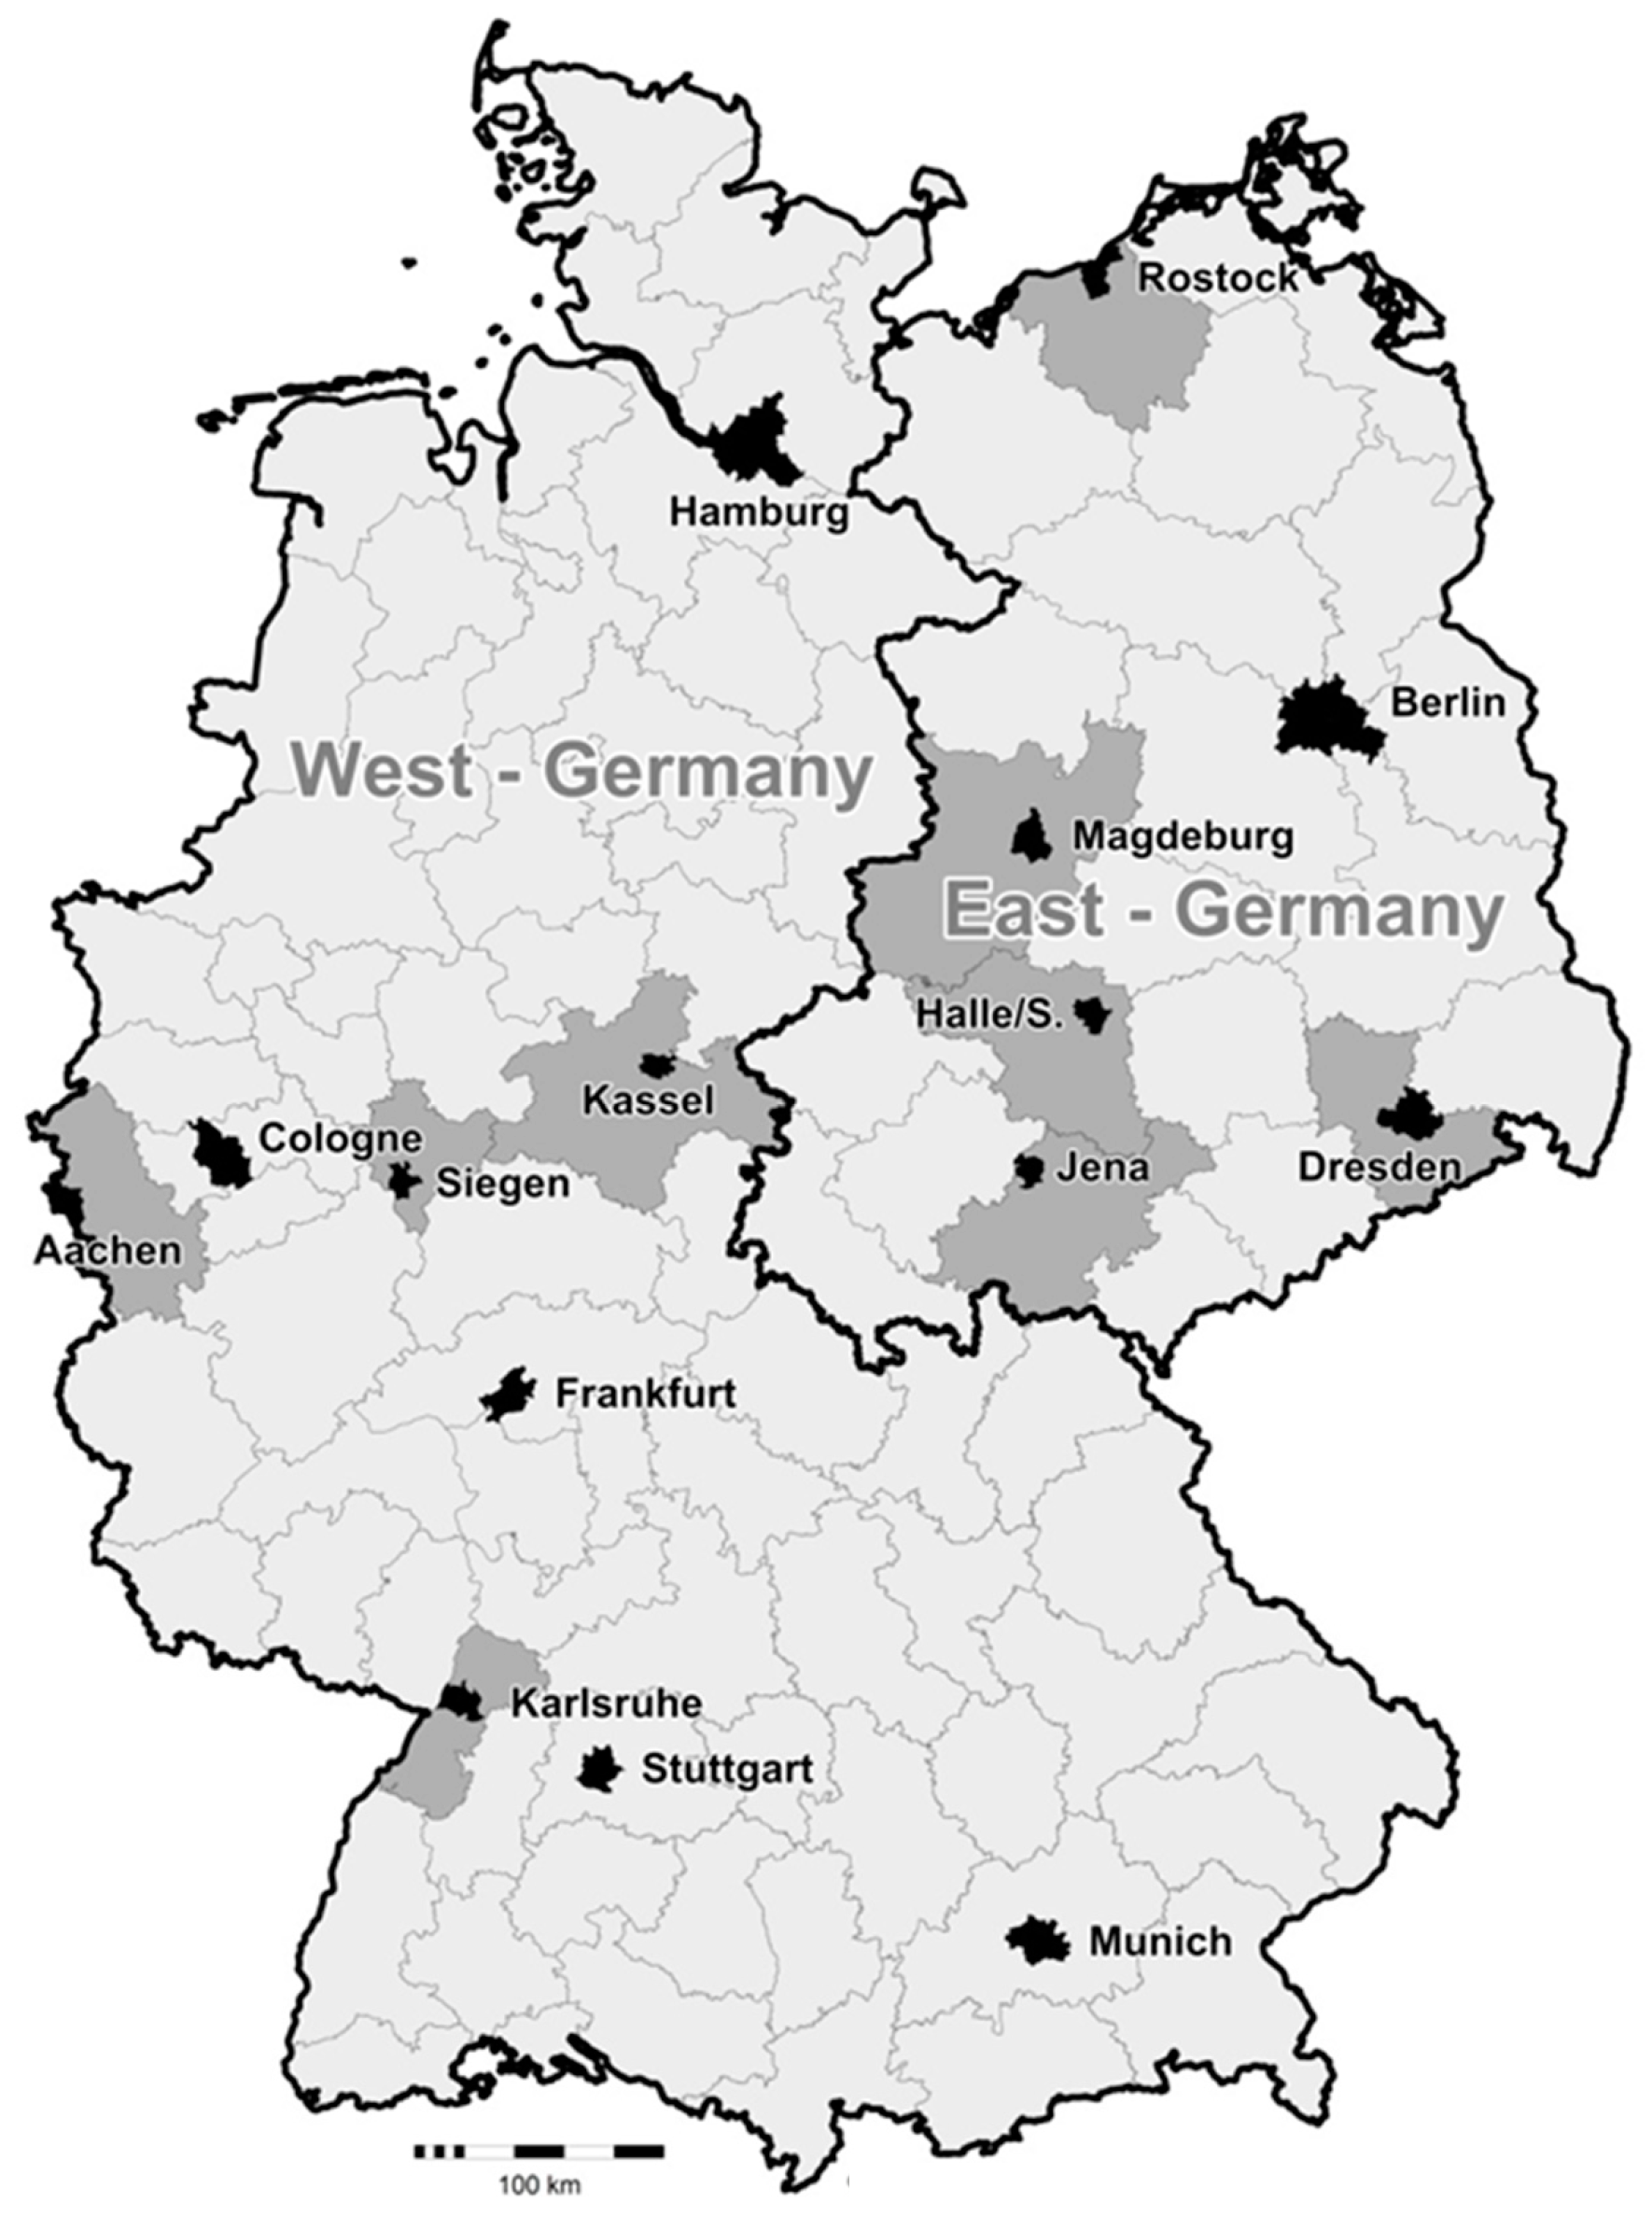
3. Data and Spatial Framework

We analyzed inventor networks based on patent applications as documented in the DEPATISnet database (www.depatisnet.de, accessed on 4 October 2022) maintained by the German Patent and Trademark Office (Deutsches Patent- und Markenamt). Compared to the OECD RegPat data, these data are considerably more comprehensive since it also contains the complete set of patents that has only been filed at the German Patent Office and not the European Patent Office, so are not included in the RegPat data. For example, the number of patents that is recorded in RegPat for the same regions and period of time was only about 53% percent of the number of patents that we found in our database. Quite remarkably, this share varies considerably across the regions of our sample. We spent rather considerable amounts of effort and time to identify the same inventors named in several patents, an issue that is of key importance for the topic of our analysis. This included correcting typing errors and identifying variant spellings of an inventor’s name as well as—in some cases—detailed web-based research.
The key assumption in constructing networks of inventors is that inventors who are named in the same patent document know each other and have worked together in generating the respective invention (Balconi et al. 2004). More specifically, we assumed that all of these links between co-inventors were of the same intensity so that all connections were weighted equally. Patents were assigned to regions based on the information about the residence of the inventor (Breschi and Lissoni 2001; Raffo and Lhuillery 2009). If some of the inventors named in a patent had residences in different regions, we divided the respective patent by the number of inventors involved and assigned only that fraction to the region that corresponded to those inventors who had their residence in the region. If, for example, a patent had three inventors and only two inventors had their residence in the region, we assigned two thirds of the patent to the region. Hence, the number of regional patents may not always be a whole number.
As an alternative to inventor networks, one could analyze the cooperative patenting activities between organizations that apply for a patent (e.g., public research institutes and firms). This would be based on the assumption that the relevant knowledge is retained mainly in the researching organizations and not with the inventors. Such cooperative relationships between organizations can be identified in the patent statistics if the patent document names several organizations as applicants. There is, however, no information is available in such cases that identifies the partner with which an individual inventor that is listed in the patent document is affiliated. The total number of patents that had several applicants (over all regions and time periods) in our data amounted to 2748 cases. This is only a rather small share (0.57% percent) of all patent applications. This implies that the largest part of cooperative efforts by inventors occurs within the same organization. Given the small share of co-applications, we believe that an analysis of cooperative relationships at the level of inventors provides a much more comprehensive picture of knowledge flows in a RIS than investigating the co-applications of organizations1. Such an analysis assumes that the relevant knowledge is represented by the inventors rather than by the organizations with which they are affiliated.
We constructed the regional inventor networks in nine German planning regions for five three-year periods over a time span of 15 years. These periods were 1994–1996, 1997–1999, 2000–2002, 2003–2005, and 2006–2008. Using longer time-periods (e.g., five year periods) does not lead to substantially different results. Patents were assigned to time periods according to the year they were filed. Five of these regions were located in East Germany, the former socialist GDR, and four regions were in West Germany (see Figure 1). Planning regions are functional spatial units that are somewhat larger than labor market regions or travel-to-work areas. They normally comprise several NUTS3-level districts, namely, a core city and its surrounding area. While districts are administrative geographic units, planning regions are more often used for spatial analysis and policy development, particularly regarding public infrastructure planning.
We considered planning regions as more suitable than districts for an analysis of regional innovation systems (RIS) for two reasons. First, a single district, particularly a core city, is probably too small to include the most important inventors of innovation-related local interaction. The second reason is of a methodological nature: Since patents are assigned to the residence of the inventor, taking only a core city as a region would lead to an underestimation of patenting activity since many inventors who work in cities have their private residence in surrounding districts. Looking at the spatial structure of the co-inventor relationships, we found that 73.4% of these interactions were with inventors located in the same planning region, and 16.8% were with inventors in adjacent planning regions. These figures clearly indicate that planning regions are a meaningful spatial category for the analysis of regional innovation processes.
The case study regions were selected to primarily fulfil two purposes. First, they were supposed to serve as a comparison of regions with a relatively high or low innovation performance. Second, the sample contained regions in East and West Germany that were similar in size and density. This allows us to make a meaningful comparison between the two parts of the country, even though this was not the focus of this paper. Aachen, Dresden, Jena, and Karlsruhe have medium level population densities, and are characterized by a RIS that has a relatively good performance. The other five regions, Halle, Kassel, Magdeburg, Rostock and Siegen, have considerably lower levels of innovation activity. Rostock and Siegen are smaller cities located in rather low-density rural areas. Halle, Magdeburg, and Kassel have larger populations than Rostock and Siegen, but they can hardly be regarded as densely populated. All regions are host to at least one university. Data on the regional number of employees in R&D are from the Establishment History File of the Institute for Employment Research (IAB, Nuremberg). Figure 1 shows the location of the nine case-study regions.
The nine regional inventor networks under inspection are quite heterogeneous with regard to the numbers of patents, inventors, ties, and components (see Table A1 in the Appendix A). All regions, except Halle and Aachen, showed a steady growth in the numbers of inventors (network size) and ties. In all regions, the number of components increased over the period of analysis. Except for Halle, all regions exhibited a total increase in the mean degree, indicating increasing interconnectedness of regional inventors (Table A1). The number of patents reached its maximum in the 2000–2002 period, followed by a decrease in the following period and an increase in the final period.
The share of co-patents increased over the observation period and made up about 90 percent in the final sub-period (Table A4). These developments of the mean degree and the increasing importance of R&D collaborations were in line with the overall trends reported in the literature (e.g., Wuchty et al. 2007; Jones et al. 2008) and indicated an increasing importance of research collaboration. Due to the increasing mean degree of the networks under inspection, one might also expect a decrease in the average path length. We found, however, an increase in the average path length in most of the networks (Table A4), which can be explained by the growing number of actors, and therefore, to an exponential increase in the number of potential cooperation partners. A further explanation could be the growing number of components (Table A1) that may also indicate an increasing variety of knowledge fields within a region.
We used two metrics for the performance of a network. The first was the number of patents per R&D employee and describes the productivity of a network in generating patentable inventions (patent productivity). The higher the level of patent productivity, the better the performance of the network in terms of generating new ideas (Fritsch 2002; Fritsch and Slavtchev 2011). The second performance indicator was the percent change of patent productivity. Table A3 in Appendix A provides the descriptive statistics for the variables and Table A5 displays the correlations between variables.

4. Inventor Turnover and Continuity of Knowledge

4.1. Inventor Turnover in Inventor Networks

In contrast to the widespread assumption that inventors and ties in networks are persistent over time, our data showed a rather high level of inventor turnover between time periods. We found that more than 78 percent of all inventors were present only in one observation period, 14.51 percent were active in two periods, and only about 7 percent appear in networks for more than two periods (Figure 2). On average, 32.34 percent of the inventors that were active in a network were carryovers from the previous period. Hence, at least 60 percent of the inventors in a regional network appeared in a sub-period for the first time, indicating that large amounts of new knowledge frequently enter the network from period to period. The share of applicants present in two successive periods was in about the same range. Taking all applicants together, the average share was 25.54%. There were, however, rather pronounced differences in this respect between the types of applicants. While the share of reappearing private persons that could not be assigned to a certain organization was rather low (14.44%), the share for organizations (firms and public research organizations) was much higher (33.85%). For larger universities, the share was close to 100%.
The persistence of links among actors was even less pronounced. We found that 83.73 percent of the links existed only in one period, 13.06 percent lasted for two periods, 2.51 percent of the links could be found in three periods, 0.52 percent in four periods, and only 0.17 percent of the links lasted over five periods. For the shares of discontinued actors and new actors in the different regions and time periods, see Table A2 in Appendix A.
The increasing share of co-patents (Table A4) indicates that the networks are characterized by a growing tendency to cooperate. Figure 3 supports this assumption. Thus, around 93 percent of new inventors—those that were not present in a previous period—entered a network in a collaboration with other inventors, while only a minor share emerged as an isolate (7%). With regard to the largest component, the share of discontinuing inventors (7.4%) was more than compensated for by the share of new inventors (9%). In the group of isolates, the share of discontinued inventors was larger than the share of newly emerging ones. These developments clearly indicate a growing level of connectivity between network inventors.
Overall, we found that inventor networks are characterized by rapidly changing compositions of inventors and links, contradicting the transaction cost theory (Ejermo and Karlsson 2006) as well as the assumptions of Barabási and Albert (1999). The networks of our sample showed a tendency to grow continuously since the number of discontinued inventors was more than compensated for by new inventors that mainly entered with a cooperative relationship. Thus, the inventor networks under inspection showed an increasing level of connectivity over time.

4.2. Assessing the Share of Persistent Knowledge

We used several indicators to assess the amount of a discontinuing inventor’s knowledge that may still be available because it has been passed onto their co-inventors in the previous period. For this purpose, we identified the co-inventors of a discontinued inventor that were still included in the network in the subsequent period. If a co-inventor of a discontinued inventor remained in the network, we assumed that at least certain parts of the patent-specific knowledge of the discontinued inventor was still available. If a discontinued inventor was involved in several co-patents, we assumed that they only transferred the knowledge specific to the patented invention and not the knowledge relevant for their other patents.
In the baseline version, we assumed that the patent-specific knowledge of a discontinuing inventor was entirely transferred to each co-inventor during the time of collaboration. We then identified the inventors who remained active in the network in the subsequent period and the knowledge that they represent. Based on this information, we finally determined the amount of persistent knowledge.
In detail, we proceeded as follows:
  • We generated a list of all patents that involved regional inventors, which represents the knowledge stock of period t-0.
  • If an inventor from period t-0 was still in the network in period t-1, we assigned their patents from period t-0 to them.
  • The share of knowledge that is transferred between period t-0 and t-1 is the number of patents in the list from period t-1 over the total number of patents in period t-0. Since an inventor from period t-0 may not be present in t-1 but re-emerge in a later period t-2 or t-3, we ran additional models to compare the list of patents between more distant time periods as a robustness check. However, the direction and significance of the coefficients remained the same.
As robustness checks, we also calculated the share of knowledge that was transferred across periods in two alternative ways.
  • The first alternative method was based on the assumption that knowledge transfer among inventors is not complete, but that inventors keep parts of their knowledge that is completely lost when they discontinue in the network. We assumed that co-inventors transferred only 50 percent of their knowledge to each co-inventor.
  • In a second alternative way of calculating the transferred knowledge, we assumed that the complete patent-specific knowledge was equally divided among all co-inventors. Hence, if there are, say, three (five) co-inventors of a patent, each co-inventor represents one third (one fifth) of the new knowledge that is behind the patent. In the next step, we checked which inventors remained active within a network in the next period. If only one inventor remained active in the subsequent period, then one third (one fifth) of the knowledge remains available. In the case of two remaining inventors, two thirds (two fifths) of the knowledge is available. The rest of the procedure followed the previous model. The idea behind this second alternative method of estimating the amount of knowledge transfer is that there should be more specialization and division of labor in larger teams so that the knowledge of an inventor may not be completely transferred to all team members. Moreover, larger teams may be characterized by a rather pronounced division of labor between specialists, with limited understanding, who are only able to only absorb parts of the knowledge of their co-inventors.
Based on the first method of estimating the transfer of knowledge between periods that assumes that the knowledge of an inventor is completely transferred to all of their co-inventors, we found that between 30.1% and 92.7% of the knowledge from one period remained in the network in the subsequent period despite high levels of fluidity (Table 1)2. This share does, however, vary considerably across time periods and regions. If we assumed an only 50% transfer of knowledge, the share of remaining knowledge ranged between 18.9% and 64.4%. Under the assumption that the share of transferred knowledge depends on the number of co-inventors, the share of transferred knowledge was between 13.41% and 47.8%. These figures clearly suggest that the discontinuation of inventors leads to considerable losses of knowledge in the respective RIS, even if it is assumed that the inventor’s knowledge is completely transferred to all co-inventors during the cooperation.

5. What Determines the Persistence of Knowledge in Regional Networks?

The previous sections showed that inventor networks are characterized by diverging shares of persistent knowledge. This raises the question of how far micro-level fluidity and a network’s macro structure are related to the share of knowledge that is passed on to other members during their cooperation (knowledge persistence). To test for such effects, we estimated the fixed-effect models with different independent variables such as the share of reoccurring inventors from t-1, the share of discontinued inventors from t-1, and measures for the network structure (Table 2). Due to the relatively low number of observations and the considerable correlation between many of the measures for network characteristics, only one independent variable was included in a model. Since this method may imply an omitted variable bias, the results should be regarded with caution.
As expected, we found a highly significant negative relationship between the share of discontinued inventors of the previous period (t-1), the share of new inventors, and the share of persistent knowledge of a network (Table 2, Models I and II). We used several measures for the size of a network and its components. The average team size measures the number of inventors who cooperate in a project and may directly exchange their knowledge. The average component size and the number of inventors in the largest component represent the inventors who are directly and indirectly connected by co-inventorship. The share of inventors in the largest component as well as the share of isolates represent the level of (non-)integration of inventors in a RIS. The results indicate that larger inventor teams (Hypothesis 1) as well as larger network’s components enhance the share of persistent knowledge (Hypothesis 2).
The positive relationship between the share of inventors in the largest component and the measure for knowledge persistence as well as the negative relationship between knowledge persistence and the share of isolates suggests that knowledge persistence is higher in well-integrated networks (Hypothesis 2). However, relationships based on other measures of network cohesion such as mean degree (Model VIII) or density (Model XI) or even using different types of clustering coefficients were found to be statistically insignificant. This result contradicts our Hypothesis 3. All in all, the results clearly suggest that the continuity of inventors, larger teams and components, and a high level of integration of inventors may be important for keeping the knowledge of discontinued inventors available.

6. The Effect of Knowledge Persistence on Network Performance

To investigate the effect of persistent knowledge and new knowledge on the performance of the respective RIS, we used patent productivity as a measure of performance. Patent productivity is defined as the number of patents filed by private sector innovators with at least one inventor residing in the respective region per 1000 R&D employees. While this metric reflects the level of the efficiency of RIS (Fritsch 2002; Fritsch and Slavtchev 2011), we also used the percentage change of patent productivity to analyze the development of that level. An advantage of this second performance measure is that relating indicators for the dynamics of the composition and the structure of networks to changes of patent productivity may lead to a more robust identification of causal relationships.
All models include the share of manufacturing employees in establishments with less than 50 employees as a control variable. This variable accounts for the observation that the number of patents per unit of R&D input tends to be higher in smaller firms than in larger firms (for a theoretical explanation and discussion, see Cohen and Klepper 1996). Hence, we expect a negative sign for the estimated coefficient of this variable. In the models for the change of patent productivity, we also included the level of patent productivity in the previous period. The estimated coefficient of this variable should have a negative sign for two reasons. First, regions with an already relatively high level of patent productivity may have lower potentials for improvements than regions that are characterized by a comparatively low performance. Second, the level of patent productivity in the base year controls for a regression to the mean effect. This effect denotes the phenomenon that periods with relatively large changes in one direction may be followed by periods where the changes are relatively small, or even work in the opposite direction.
The estimation results presented in Table 3 provide empirical evidence for the positive connection between the performance of a network and the two potential sources of knowledge, namely new and persistent knowledge. Thus, we found a significantly positive relationship between a network’s patent productivity and the share of new inventors (Model I) as well as with the share of persistent knowledge (Models III and IV). The non-significance of the share of persistent knowledge in Model II that does not include the share of new knowledge may be caused by the relatively high correlation between the measures of these two knowledge sources (see Table A5 in the Appendix A). The share of persistent knowledge has, however, only a weakly significant effect if the change in patent productivity is taken as the dependent variable (Models VII and VIII). The insignificance of the coefficient of the weighted measure of knowledge transfer in Models V and IX may result from the fact that the construction of this measure is based on the assumption that only smaller amounts of the total knowledge are transferred, so that the share of persistent knowledge is, perhaps, underestimated.
We also found statistically positive relationships for our measure of new knowledge in the models for the change in patent productivity (Models VI–XII). For two out of our three measures of knowledge persistence, we also found a statistically significant relationship with the expected positive sign (Table 3, Models VII–IX). Again, the weighted knowledge transfer remained statistically insignificant in models that did not include the share of new inventors (Model IX). When we introduced the share of new inventors (Models X–XII), all three measures of knowledge persistence were statistically significant, supporting our earlier finding that both existing and new knowledge are extremely important to the process of enhancing the efficiency of a RIS.
All in all, these results indicate that the generation of inventions may benefit from both persistent knowledge and new sources of knowledge. This is consistent with our Hypotheses 4 and 5. The effect of our measure for new knowledge―the share of new inventors―is, however, considerably more robust at higher levels of statistical significance. This pattern suggests that new knowledge may be more important for the performance of RIS than old knowledge. We can, however, not exclude that the reason for the poor performance of our measure of persistent knowledge is due to its construction. If the interpretation is correct, that new knowledge is more important for the performance of a RIS than older knowledge, which could also contribute to explaining the rather high levels of inventor fluidity in the networks under investigation. New ideas are mainly introduced by new people, and inventors switch their cooperation partners because they believe that this may be more promising for producing newness than continuing to cooperate with their old partners or their former collaborators.
We have argued that new inventors who enter the network as part of a component create new opportunities of knowledge recombination by making their knowledge available to co-inventors (Section 2). Hence, they should have a stronger effect on the performance of a RIS than inventors who enter as an isolate. In order to test this assertion, we distinguished between new inventors who entered as part of a component and those who entered as isolates. Consistent with our expectations, we found that only those new inventors who were attached to a component had a significantly positive effect on the performance of the respective RIS (Models I, II, V, and VI of Table 4). This result may also be regarded as confirmation of the findings of Wuchty et al. (2007) and Jones et al. (2008) that team inventions are of higher quality than inventions by single inventors.
In a final step of analysis, we compared the effects of new inventors who were attached to a component with at least one continuing inventor with new inventors who entered as part of a component that did not include any continuing inventor. The idea behind this approach is that combinations of old and new knowledge may be particularly important for the performance of the respective RIS. Hence, one might expect that new inventors who enter as part of a component that also includes a continuing inventor have a stronger effect on RIS performance. The results of Models III, IV, VII, and VIII in Table 4 clearly suggest the opposite (i.e., components that entirely consist of new inventors have a strong effect on RIS, while the effect of those newcomers who are attached to a component that also comprises at least one old inventor remains completely insignificant). This result underlines our findings of the relative effect of old and new knowledge (Table 3). It is new inventors who emerge as new components that drive the performance of RIS. In contrast, combinations of new knowledge and the knowledge of continuing inventors seem to be unimportant.

7. Discussion and Conclusions

If inventors are no longer active in innovation networks, their knowledge for the respective RIS may be lost. Assuming that inventors transfer at least parts of their knowledge during their cooperation with other inventors, we constructed indicators for the persistence of discontinuing inventors’ knowledge. Based on these measures, we found that the discontinuation of inventors can lead to large losses of knowledge, and that the share of these losses varies quite considerably across regions and time periods.
Using our measures for the persistence of knowledge, we analyzed the role of network characteristics in knowledge persistence. We found a positive relationship between the share of transferred knowledge and measures that indicate the connectedness of network members. According to our expectations, more knowledge is transferred and preserved over time in more densely connected network structures. We also found a positive relationship between knowledge persistence and the size of a network’s components. Hence, the size of the components of a network and dense relationships among inventors are positively related with the persistence of knowledge across time.
In a next step, we estimated the effect of the share of persistent knowledge that is transferred between two subsequent time periods and the share of new knowledge that is introduced by new inventors on the performance of the respective RIS. RIS performance was measured by patent productivity and the change in patent productivity. The results of these analyses indicate that both old and new knowledge may make a positive contribution to RIS performance, but that the effect of new knowledge, measured by the share of new inventors, is considerably more important. Moreover, we found that only newcomers who were attached to a component that entirely consisted of new inventors had a positive effect on the performance of the respective RIS. New inventors who were attached to a component with old inventors as well as new inventors who entered as isolates had no significant effect.
In a nutshell, the knowledge of discontinuing inventors may particularly remain in large and dense networks. Hence, one important way by which networks contribute to the performance of RIS is to make knowledge of discontinuing inventors available in later time periods. Both new and persistent old knowledge contribute to the performance of RIS, but the effect of new knowledge is much stronger. The significant role played by new actors and their knowledge in the generation of inventions may also explain why inventor teams are rather unstable. A main implication of our analysis is that the ability of regions to attract knowledgeable actors from outside can make an important contribution to local innovation and economic prosperity.
Our analysis is not without limitations. Since patents cover only a part of total innovation activities in a region, our method of estimating the share of persistent knowledge could lead to an underestimation of that knowledge. For example, a patent-based analysis neglects inventions that cannot be patented (incremental inventions and results of basic research) as well as inventions that, for various reasons, are not filed for patenting (Hall et al. 2014; Walter et al. 2011). Moreover, inventors may exchange knowledge in many other, often rather, informal ways. A further limitation of our empirical analysis is the relatively low number of observations (regions and time periods).
Further analyses should try to overcome these shortcomings by including other channels of knowledge transfer (see Fritsch et al. 2020) and by generating datasets with larger numbers of observations. In particular, further work in this field should test different indicators for knowledge persistence as well as for the performance of RIS.

Author Contributions

Both authors have in equal ways contributed to conceptualization, methodology, data curation, and writing; M.F. was responsible for project administration and M.Z. was responsible for the empirical analysis. All authors have read and agreed to the published version of the manuscript.

Funding

This research received no external funding.

Informed Consent Statement

Not applicable.

Data Availability Statement

The data presented in this study are available on request from the corresponding author.

Acknowledgments

The authors are grateful to the anonymous reviewers for helpful comments on earlier versions of this paper.

Conflicts of Interest

The authors declare no conflict of interest.

Appendix A

Table A1. Numbers of nodes, ties, components, and total patents in different time periods.
AachenDresden
Number ofNumber of
InventorsTiesComponentsPatentsInventorsTiesComponentsPatents
94-96221954804071858194862983621458
97-99279972024822455279110,7984002556
00-02364313,9441412866312113,2744212295
03-05328313,2085461873330614,5784162062
06-08313511,8405061900370717,4304462522
HalleJena
Number ofNumber of
InventorsTiesComponentsPatentsInventorsTiesComponentsPatents
94-96815308212848511533722200753
97-9911834392199941178972122591477
00-0212305664209615191789222441147
03-058423172164384192590042541089
06-086422164141320193684382901152
KarlsruheKassel
Number ofNumber of
InventorsTiesComponentsPatentsInventorsTiesComponentsPatents
94-961339354429023137391838159509
97-99274510,256475432711183212238740
00-02484922,520688393211073354260677
03-05465722,212649307311153860221726
06-08497223,420622392413264332254828
MagdeburgRostock
Number ofNumber of
InventorsTiesComponentsPatentsInventorsTiesComponentsPatents
94-96635171014341424351459178
97-998652406178513426134275411
00-0210083504208577412159268235
03-059773048206526371156856188
06-089092880196518466184278256
SiegenAll regions
Number ofNumber of
InventorsTiesComponentsPatentsInventorsTiesComponentsPatents
94-967541776152662984527,96419008630
97-991051302419282014,76749,844249814,240
00-021095369820075915,39463,856243913,103
03-051007348218874217,48374,132270010,663
06-081231458619492818,32476,932272712,348
Table A2. Shares of discontinued inventors and new inventors in the case study regions in different time periods.
Share of Discontinued InventorsShare of New InventorsShare of Discontinued InventorsShare of New Inventors
AachenKassel
1997–19990.73880.73880.83910.8399
2000–20020.73830.77360.80240.8464
2003–20050.69020.75480.78190.8502
2006–20080.65710.75440.76920.8363
DresdenMagdeburg
1997–19990.77150.71010.83990.8428
2000–20020.68850.64050.83350.8621
2003–20050.63260.60710.79900.8628
2006–20080.60780.59670.78690.8680
HalleRostock
1997–19990.79030.78700.84160.8357
2000–20020.80160.81630.73720.7670
2003–20050.76720.82300.68730.7547
2006–20080.72740.81930.70820.7940
JenaSiegen
1997–19990.77320.77190.78210.7821
2000–20020.69780.73660.70230.7543
2003–20050.70490.77870.65940.7319
2006–20080.62260.70040.64420.7474
Karlsruhe
1997–19990.89840.8984
2000–20020.78620.8125
2003–20050.70780.7505
2006–20080.63780.7200
Table A3. Descriptive statistics.
MeanMedianMinimumMaximumStandard Deviation
Share of persistent knowledge0.5040.4710.2010.8840.175
Share of discontinued inventors0.7400.7390.6080.8980.072
Share of new inventors0.7770.7760.5970.8980.070
Share of re-emerging inventors0.2600.2610.1020.3920.072
Share of isolates0.0870.0840.0330.1880.037
Share of the largest component0.0980.0720.0230.3330.079
Average component size4.1023.9362.7746.0730.975
Mean degree5.3555.5653.2257.2601.165
Patent productivity (ln)−0.368−0.416−0.7850.5470.259
Change in patent productivity (ln)−0.038−0.048−0.4860.3370.188
Employment share of manufacturing establishments <50 employees0.3500.3310.1870.5600.106
Share of service employment0.8770.8760.7580.9710.048
Number of links6785386051423,4205982
Average team size2.7112.7902.0023.3240.320
Table A4. Number of co-patents, single patents, mean degree (all regions).
94–9697–9900–0203–0506–0894–08
Total number of patents8.6314.2413.1010.6612.3558.98
Number of co-patents7.3712.6011.859.5011.1452.46
Share of co-patents in %85.4588.4690.4289.0790.2088.93
Number of patents with single inventor 1.261.641.261.171.216.53
Number of inventors per patent2.712.822.993.073.002.91
Number of inventors per co-patents3.403.513.653.703.583.58
Mean degree3.765.115.515.445.363.76
Average path lengths2.223.573.853.773.833.45
Table A5. Correlation of variables.
12345678910111213
1Share of persistent knowledge1.00
2Share of discontinued inventors−0.66 ***1.00
3Share of new inventors−0.66 ***0.84 ***1.00
4Share of re-emerging inventors0.66 ***−1.00−0.84 ***1.00
5Share of isolates−0.330.45 ***0.40−0.45 ***1.00
6Share of the largest component0.58 ***−0.54 ***−0.64 ***0.54 ***−0.341.00
7Average component size0.55 ***−61 ***−0.64 ***0.61 ***−0.89 ***0.62 ***1.00
8Mean degree0.45 ***−0.36−0.48 ***0.36−0.61 ***0.54 ***0.79 ***1.00
9Patent productivity (ln)0.320.11−0.24−0.110.210.240.020.311.00
10Change in patent productivity (ln)0.260.030.03−0.03−0.01−0.18−0.070.060.291.00
11Employment share of manufacturing establishments <50 employees−0.290.230.06−0.23−0.080.070.020.01−0.290.061.00
12Number of inventors0.51 ***−0.17−0.51 ***0.37−0.44 ***0.330.60 ***0.53 ***0.46 ***−0.12−0.54 ***1.00
13Number of ties0.50 ***−0.42 ***−0.3 ***0.42 ***−0.55 ***0.38 ***0.700.61 ***0.40 ***−0.14−0.49 ***0.98 ***1.00
14Average team size0.24−0.46 ***−0.360.46 ***−0.81 ***0.380.77 ***0.63−0.38−0.060.27−0.180.20
Notes: Spearman rank correlation coefficients. *** Statistically significant at the 1% level The number of observations was 45 and 36, respectively (nine regions).

Notes

1
Another issue with identifying cooperative relationships between organizations is that some members of such organizations may file patent applications as private inventors. This is a particularly relevant scenario in Germany, because the professor’s privilege that allowed university researchers to file inventions for patenting on their own account was only abolished in 2002, while our period of analysis was 1994–2008. Moreover, even after this regulatory change, university professors are still entitled to patent as private inventors if their university is not interested in the exploitation of their invention (Von Proff et al. 2012). One main reason why universities may not use their right to patent an invention is that they do not want to pay the patent fees. The share of such cases is quite significant, but can considerably differ between universities and time periods.
2
If we assume that knowledge remains in the network if the respective applicant is still present in the successive period, then the share of persistent knowledge varies between 0.0% and 84% (average value 55.5%).

References

  1. Ahuja, Gautam. 2000. Collaboration networks, structural holes, and innovation: A longitudinal study. Administrative Science Quarterly 45: 425–55. [Google Scholar] [CrossRef] [Green Version]
  2. Asheim, Bjoern, Arne Isaksen, and Michaela Trippl. 2019. Regional Innovation Systems. Cheltenham: Elgar. [Google Scholar]
  3. Bahar, Dany, Prithwiraj Choudhury, and Hillel Rapoport. 2020. Migrant inventors and the technological advantage of nations. Research Policy 49: 103947. [Google Scholar] [CrossRef] [Green Version]
  4. Balconi, Margherita, Stefano Breschi, and Francesco Lissoni. 2004. Networks of Inventors and the Role of Academia: An Exploration of Italian Patent Data. Research Policy 33: 127–45. [Google Scholar] [CrossRef]
  5. Barabási, Albert-Lászlo, and Réka Albert. 1999. Emergence of Scaling in Random Networks. Science 286: 509–12. [Google Scholar] [CrossRef] [Green Version]
  6. Breschi, Stefano, and Francesco Lissoni. 2001. Knowledge spillovers and local innovation systems—A critical survey. Industrial and Corporate Change 10: 975–1005. [Google Scholar] [CrossRef] [Green Version]
  7. Burt, Ronald S. 2001. Structural holes versus network closure as social capital. In Social Capital: Theory and Research. Edited by Nan Lin, Karen S. Cook and Ronald S. Burt. Berlin: De Gruyter, pp. 31–56. [Google Scholar]
  8. Cantner, Uwe, and Holger Graf. 2011. Innovation networks: Formation, performance and dynamics. In Handbook on the Economic Complexity of Technological Change. Edited by Christiano Antonelli. Cheltenham: Elgar, pp. 366–94. [Google Scholar]
  9. Cohen, Wesley M., and Steven Klepper. 1996. Firm size and the nature of innovation within industries: The case of process and product R&D. Review of Economics and Statistics 78: 232–43. [Google Scholar] [CrossRef]
  10. Cowan, Robin, and Nicolas Jonard. 2004. Network structure and the diffusion of knowledge. Journal of Economic Dynamics & Control 18: 938–54. [Google Scholar] [CrossRef] [Green Version]
  11. Ejermo, Olof, and Charlie Karlsson. 2006. Interregional inventor networks as studied by patent coinventorships. Research Policy 35: 412–30. [Google Scholar] [CrossRef] [Green Version]
  12. Fritsch, Michael. 2002. Measuring the Quality of Regional Innovation Systems—A Knowledge Production Function Approach. International Regional Science Review 25: 86–101. [Google Scholar] [CrossRef] [Green Version]
  13. Fritsch, Michael, and Martina Kauffeld-Monz. 2010. The impact of network structure on knowledge transfer: An application of social network analysis in the context of regional innovation networks. Annals of Regional Science 44: 21–38. [Google Scholar] [CrossRef]
  14. Fritsch, Michael, and Moritz Zoellner. 2020. The Fluidity of Inventor Networks. Journal of Technology Transfer 45: 1063–87. [Google Scholar] [CrossRef] [Green Version]
  15. Fritsch, Michael, and Muhamed Kudic. 2021. Micro Fluidity and Macro Stability of Inventor Networks. Journal of Technology Transfer 47: 353–82. [Google Scholar] [CrossRef]
  16. Fritsch, Michael, and Viktor Slavtchev. 2011. Determinants of the Efficiency of Regional Innovation Systems. Regional Studies 45: 905–18. [Google Scholar] [CrossRef]
  17. Fritsch, Michael, Mirko Titze, and Matthias Piontek. 2020. Identifying cooperation for innovation―A comparison of data sources. Industry and Innovation 27: 630–59. [Google Scholar] [CrossRef] [Green Version]
  18. Fronczak, Agata, Piotr Fronczak, and Janusz A. Hołyst. 2004. Average path length in random networks. Physical Review E 70: 056110. [Google Scholar] [CrossRef] [Green Version]
  19. Greve, Heinrich, Joel A. Brown, Hitoshi Mitsuhashi, and Tim Rowley. 2009. Built to Last but Falling Apart: Cohesion, Friction, and Withdrawal from Interfirm Alliances. Academy of Management Journal 53: 302–22. [Google Scholar] [CrossRef]
  20. Hall, Bronwyn H., Christian Helmers, Mark Rogers, and Vania Sena. 2014. The choice between formal and informal intellectual property: A review. Journal of Economic Literature 52: 375–423. [Google Scholar] [CrossRef] [Green Version]
  21. Jackson, Matthew O. 2008. Social and Economic Networks. Princeton: Princeton University Press. [Google Scholar]
  22. Jones, F. Benjamin, Stefan Wuchty, and Brian Uzzi. 2008. Multi-University Research Teams—Shifting Impact, Geography, and Stratification in Science. Science 322: 1259–62. [Google Scholar] [CrossRef] [Green Version]
  23. Lissoni, Francesco. 2018. International migration and innovation diffusion: An eclectic survey. Regional Studies 52: 702–14. [Google Scholar] [CrossRef]
  24. Raffo, Julio, and Stéphane Lhuillery. 2009. How to play the “Names Game”: Patent retrieval comparing different heuristics. Research Policy 38: 1617–27. [Google Scholar] [CrossRef]
  25. Ramlogan, Ronnie, and Davide Consoli. 2014. Dynamics of collaborative research medicine: The case of glaucoma. Journal of Technology Transfer 39: 544–66. [Google Scholar] [CrossRef] [Green Version]
  26. Schilling, Melissa A., and Corey C. Phelps. 2007. Interfirm collaboration networks: The impact of large-scale network structure on firm innovation. Management Science 53: 1113–26. [Google Scholar] [CrossRef]
  27. Tang, Fangcheng, Jifeng Mu, and Douglas L. MacLachlan. 2008. Implication of network size and structure on organizations’ knowledge transfer. Expert Systems with Applications 34: 1109–14. [Google Scholar] [CrossRef]
  28. Uzzi, Brian, and Jarrett Spiro. 2005. Collaboration and creativity—The small world problem. American Journal of Sociology 111: 447–504. [Google Scholar] [CrossRef] [Green Version]
  29. Von Proff, Sidonia, Guido Buenstorf, and Martin Hummel. 2012. University patenting in Germany before and after 2002: What role did the professors’ privilege play? Industry and Innovation 19: 23–44. [Google Scholar] [CrossRef] [Green Version]
  30. Walter, Sascha G., Arne Schmidt, and Achim Walter. 2011. Do academic entrepreneurs patent their secrets? An empirical investigation of patent rationales. Frontiers of Entrepreneurship Research 31: 403–17. [Google Scholar]
  31. Wang, Zhining, and Nianxin Wang. 2012. Knowledge sharing, innovation and firm performance. Expert Systems with Applications 39: 8899–908. [Google Scholar] [CrossRef]
  32. Wuchty, Stefan, Benjamin F. Jones, and Brian Uzzi. 2007. The Increasing Dominance of Teams in Production of Knowledge. Science 316: 1036–39. [Google Scholar] [CrossRef]
Figure 1. The regional framework of the analysis.
Economies 10 00298 g001
Figure 2. Share of inventors that are present in different numbers of time periods.
Economies 10 00298 g002
Figure 3. Positions of the newly emerging and discontinued inventors over the entire observation period.
Economies 10 00298 g003
Table 1. Share of knowledge of the previous period that remains in the network.
Region 1997–19992000–20022003–20052006–2008Average
AachenI76.466.243.166.163.0
II37.234.131.045.336.9
III28.024.826.929.427.3
DresdenI92.768.673.288.480.7
II50.448.455.464.454.6
III32.340.845.647.841.6
HalleI72.137.427.930.141.9
II29.620.018.924.123.2
III23.920.019.120.020.7
JenaI90.859.673.881.276.4
II43.638.544.555.645.5
III25.030.027.237.630.0
KarlsruheI57.660.451.968.859.7
II26.632.639.048.436.7
III13.422.430.135.725.4
KasselI56.443.247.774.055.3
II24.922.929.145.230.5
III16.716.416.221.717.7
MagdeburgI48.847.244.441.145.4
II25.924.226.127.125.8
III18.015.716.216.016.5
RostockI69.134.848.568.655.3
II27.225.236.944.633.5
III17.224.627.424.123.3
SiegenI65.455.460.274.964.0
II34.835.141.950.140.5
III23.826.730.030.327.7
All regionsI66.562.957.871.764.7
II34.835.739.747.939.5
III23.525.928.031.727.3
Average valuesI69.952.552.365.960.15
II33.331.235.945.036.4
III22.024.626.529.225.6
Notes: The values in the first row are based in the assumption that the knowledge of an inventor is completely passed on to all his co-inventors. For the values in the second row it is assumed that only 50% of an inventor’s knowledge is transferred to co-inventors. The third row contains the values based on the assumption that the knowledge of a patent is equally divided between all co-inventors.
Table 2. Inventor fluidity, network characteristics, and the share of knowledge transfer over time.
Knowledge Persistence―Complete Transfer
IIIIIIIVVVIVIIVIIIIX
Share of discontinued inventors t-1 −2.175 ***--------
(0.361)
Share of new inventors t-0-−1.211 *-------
(0.830)
Average team size t-1--0.3849 ***
(0.0723)
------
Share of isolates t-1---−3.016 ***
(1.131)
-----
Average component size t-1----0.220 ***
(0.060)
----
Share of the largest component t-1-----1.267 **
(0.541)
---
Number of inventors in largest component t-1------0.0003 ***
(0.0002)
--
Mean degree t-1-------0.0316
(0.0387)
-
Density t-1--------−1.264
(1.097)
Constant−0.02891.476 ***−0.3139 *0.961 ***−0.1290.472 ***0.559 ***0.453 **0.569 ***
(0.114)(0.488)(0.1711)(0.157)(0.208)(0.092)(0.0825)(0.191)(0.0648)
Adjusted R20.8640.6240.79560.6980.7600.6760.6390.58720.5938
Knowledge Persistence―50% Transfer
IIIIIIIVVVIVIIVIIIIX
Share of discontinued inventors t-1−0.606 ***--------
(0.136)
Share of new inventors t-0-−0.606 *-------
(0.321)
Average team size t-1--0.1924 ***
(0.0362)
------
Share of isolates t-1-- −1.508 ***
(0.566)
-----
Average component size t-1----0.110 ***
(0.0300)
----
Share of the largest component t-1-----0.634 **
(0.270)
---
Number of inventors in largest component t-1------0.00002 ***
(0.0000)
--
Mean degree t-1-------0.0173
(0.0205)
-
Density t-1--------−0.407
(0.631)
Constant0.581 ***0.738 ***−0.1570 *0.480 ***−0.06470.236 ***0.280 ***0.347 ***0.406 ***
(0.071)(0.244)(0.0856)(0.078)(0.104)(0.046)(0.0413)(0.101)(0.0373)
Adjusted R20.8020.6240.79560.6980.7600.6760.6390.71890.6811
Knowledge Persistence―Weighted Transfer
IIIIIIIVVVIVIIVIIIIX
Share of discontinued inventors t-1 −0.386 ***--------
(0.0915)
Share of new inventors t-0-−0.575 ***
(0.202)
-------
Average team size t-1--0.1380 ***
(0.0228)
------
Share of isolates t-1-- −1.010 ***
(0.365)
-----
Average component size t-1----0.0754 ***
(0.0187)
----
Share of the largest component t-1-----0.376 **
(0.181)
---
Number of inventors in largest component t-1------0.0001 *
(0.0000)
--
Mean degree t-1-------0.00841
(0.00910)
-
Density t-1--------0.447
(0.415)
Constant0.348 ***−0.591 ***−0.1576 ***0.289 ***−0.08170.130 ***0.155 ***0.253 ***0.275 ***
(0.0475)(0.154)(0.0534)(0.0506)(0.0649)(0.0308)(0.0269)(0.0448)(0.0245)
Adjusted R20.7750.6150.79110.6830.7640.6330.6140.89710.7490
Notes: Fixed-effects panel regressions. Robust standard errors in parentheses. *** Statistically significant at the 1% level; ** Statistically significant at the 5% level; * Statistically significant at the 10% level. The number of observations was 36 in all models (nine regions).
Table 3. The relation between the share of persistent knowledge, the share of new inventors, and patent productivity.
Patent Productivity (ln)Change of Patent Productivity (%)
IIIIIIIVVVIVIIVIIIIXXXIXII
Share of new inventors2.714 ***
(0.892)
-3.044 ***
(0.874)
3.044 ***
(0.874)
3.239 ***
(0.940)
2.290 **
(0.930)
---2.345 ***
(0.861)
2.345 ***
(0.861)
2.676 ***
(0.925)
Share of persistent knowledge
– complete transfer-0.2930.494 *---0.610 *--0.631 **
(0.323)(0.275) (0.316)(0.281)
– 50% transfer---0.988 *
(0.549)
---1.219 *
(0.633)
- 1.262 **
(0.562)
– weighted transfer----1.370
(0.920)
---0.890
(1.018)
1.548 *
(0.919)
Employment share of manufacturing establishments <50 employees0.518
(0.717)
2.498 ***
(0.839)
1.988 ***
(0.713)
1.988 ***
(0.713)
1.978 ***
(0.753)
0.950
(0.766)
1.946 **
(0.783)
1.946 **
(0.783)
1.840 **
(0.859)
1.816 ***
(0.697)
1.816 ***
(0.697)
1.874 **
(0.751)
Patent productivity in t-1 (ln)-----−0.911 ***−0.517 ***−0.517 ***−0.614 ***−0.684 ***−0.684 ***−0.758 ***
(0.177)(0.186)(0.186)(0.192)(0.176)(0.176)(0.175)
Constant−2.721 ***−1.130 ***−3.403 ***−3.403 ***−3.484 ***−2.366 ***−1.031 ***−1.031 ***−0.824 **−2.820 ***−2.820 ***−2.992 ***
(0.639)(0.365)(0.720)(0.720)(0.807)(0.742)(0.319)(0.319)(0.338)(0.715)(0.715)(0.806)
Adjusted R20.66150.5510.58580.61830.69010.53470.4950.4950.4350.70170.70170.5858
Notes: Fixed-effects panel regressions. Robust standard errors in parentheses. *** Statistically significant at the 1 % level; ** Statistically significant at the 5% level; * Statistically significant at the 10% level. The number of observations was 36 in all models (nine regions).
Table 4. The relationship between the share of persistent knowledge and patent productivity.
Patent Productivity (ln)Change of Patent Productivity (%)
IIIIIIIVVVIVIIVIII
Share of new inventors attached to components0.681 ***
(0.224)
---0.595 **
(0.241)
---
Share of new inventors that are isolates-0.703---0.260--
(2.265) (2.128)
Share of new inventors attached to components with at least one old inventor--−2.954 ***---−2.448 **-
(1.033) (0.971)
Share of new inventors attached to a completely new component---2.323 **---1.992 **
(0.988) (0.912)
Employment share of manufacturing establishments <50 employees−0.831
(1.151)
1.941 **
(0.897)
0.690
(0.804)
1.529 **
(0.704)
−0.461
(1.099)
1.526 *
(0.901)
0.485
(0.843)
1.048
(0.782)
Patent productivity in t-1 (ln)----−0.886 ***−0.691 ***−0.717 ***−0.674 ***
(0.177)(0.181)(0.158)(0.161)
Constant−0.394−0.831 ***0.370−2.312 ***−0.419 *−0.627 **0.356−1.866 ***
(0.240)(0.235)(0.469)(0.648)(0.249)(0.266)(0.456)(0.613)
Adjusted R20.66110.53800.65050.62020.53520.41750.53920.5137
Notes: Fixed-effects panel regressions. Robust standard errors in parentheses. *** Statistically significant at the 1 % level; ** Statistically significant at the 5% level; * Statistically significant at the 10% level. The number of observations was 36 in all models (nine regions). To sum up, our results indicate that it is the new knowledge of new people that drives the performance of RIS. The share of old knowledge that remains in a regional inventor network across subsequent time periods is of only minor importance.
Publisher’s Note: MDPI stays neutral with regard to jurisdictional claims in published maps and institutional affiliations.

