Article

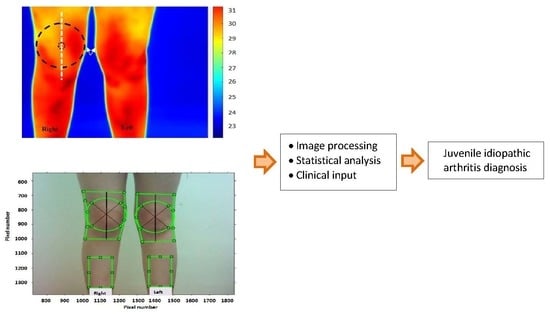
Thermal and Visual Imaging to Assist with Juvenile Idiopathic Arthritis Examination of the Knees

1
Industry and Innovation Research Institute, Sheffield Hallam University, Sheffield S1 1WB, UK
2
Department of Paediatric Rheumatology, Sheffield Children’s Hospital, Sheffield S10 2TH, UK
*
Author to whom correspondence should be addressed.
Technologies 2020, 8(2), 30; https://doi.org/10.3390/technologies8020030
Submission received: 17 April 2020 / Revised: 19 May 2020 / Accepted: 21 May 2020 / Published: 24 May 2020

Abstract

:
Juvenile idiopathic arthritis (JIA) causes inflammation of the joints, and it is frequently associated with their pain and stiffness. Its timely diagnosis is important to avoid its progressive damage to the bones and cartilage. Increases in the joint’s temperature and redness could be indicators of active JIA, hence their accurate quantification could assist with diagnosis. Thermal and visual images of the knees in 20 JIA participants (age: mean = 11.2 years, standard deviation = 2.3 years) were studied. The median temperature of knees with active inflammation was 3.198% higher than that of inactive knees. This difference, examined by a Wilcoxon signed-rank test, was statistically significant (p = 0.0078). In six out of the eight participants who had one active inflamed knee, thermal imaging identified the corresponding knee as warmer. In 16 out of 20 participants, the knee identified as warmer by thermal imaging was also identified as having a greater colour change by visual imaging as compared to their respective reference regions. The devised methods could accurately quantify the colour and temperature of the knees. It was concluded that thermal and visual imaging methods can be valuable in examining JIA. Further studies involving a larger number of participants and more detailed explorations would be needed prior to clinical application.

Graphical Abstract

1. Introduction

Juvenile idiopathic arthritis (JIA) is a broad term used to describe various forms of chronic arthritis that manifest before the age of 16 years and persist for more than 6 weeks [1]. It is the most common childhood chronic rheumatic disease, affecting about 1 in 500 children and can cause much disability [2,3]. Symptoms include joint warmth, skin redness, pain, stiffness and swelling [4]. Chronic joint inflammation can lead to irreversible joint damage, functional disability and altered bone growth. Although the cause of JIA is not yet fully established, it is known to be an auto-immune disease involving immune-mediated inflammation of the synovium (lining of the joints); genetic predisposition and environmental triggers are likely to be important factors in the development of the condition [2].
Increasing evidence suggests a “window of opportunity” early in the disease course to achieve improved long-term outcomes through early and aggressive (proactive) treatment [5,6], which has resulted in a paradigm shift in the approach to treatment for JIA over recent years. Current treatment strategies therefore advocate proactive treatment to abolish inflammation as soon as possible. An international task force has made recommendations on treatment targets for JIA, with the main one defined as remission, with the alternative target of low disease activity [7]. A “treat-to-target” approach is reported and explored for use in JIA [8]. The proactive treatment of JIA aims to allow the child or young person to live as active and independent a life as possible [9].
Proactive treatment strategies for JIA offer the potential for better long-term outcomes [5]; however, these benefits can only be realized when active arthritis is diagnosed early. The current diagnosis of JIA, and ongoing monitoring for flares of active arthritis, rests on the clinician examination of joints by the visual assessment of joint swelling and restricted movement, and touch to assess for joint warmth, swelling and to elicit joint tenderness [10]. This subjective method of detecting arthritis has inherent limitations that may result in unwanted diagnostic delay.
The serum levels of interleukin 6 (IL-6) and vascular endothelial growth factor A (VEGF-A) might be promising disease markers [11], but currently, there are no available serum biomarkers to sensitively and specifically assess for active arthritis. Historically, plain radiography (X-ray) has been used as an assessment tool; however, bone erosion (the associated change detected by plain radiographs) occurs late in the disease course and is a non-reversible change when it has occurred. More recently, contrast-enhanced MRI (CE-MRI) and musculoskeletal ultrasound (mUSS) have been shown to be useful in detecting active arthritis at an earlier stage [12,13,14,15], importantly, being able to detect “sub-clinical” arthritis that is not apparent on clinician examination only [16]. CE-MRI is recognized as the “gold standard” for identifying joint synovitis [17] and can demonstrate early features of arthritis such as bone oedema as well as being more sensitive than plain radiography at detecting early erosive bone changes [15]. Dynamic contrast-enhanced MRI parameters and the relative number of time-intensity curve shapes were analyzed to differentiate between clinically active and inactive patients [18]. The high cost of CE-MRI scanning makes it inaccessible for routine clinical use [13,17]. Musculoskeletal ultrasound is less expensive, but it is highly user-dependent [19,20].
The thermal imaging of joint inflammation has potential for providing a non-invasive, portable and inexpensive addition to the currently available tools as it can accurately quantify temperature, which in turn may assist with the diagnosis, monitoring of disease progression and response to medical treatment. A previous pilot study by our group showed variabilities between subjective clinicians’ touch and the objective thermometer measurement of joint skin temperature [21]. Thermal imaging has proved effective for a number of medical diagnostic and monitoring applications that include real-time respiration rate measurement [22], the diagnosis of acute non-specific limp [23] and identifying thoracic vertebral fractures in children and young people with osteogenesis imperfecta [24]. Previous studies in adults have demonstrated the clinical utility of thermal imaging in rheumatoid arthritis and osteoarthritis [19,25,26,27,28,29,30,31]. The potential utility of thermal imaging in children and young people with JIA has been described [32].
Thermal imaging could be performed more frequently than invasive measures (e.g., blood testing) or expensive CE-MRI imaging in children and young people to help confirm a diagnosis of JIA and track the disease progression, thus aiding more timely intervention than currently may be possible. Thermal imaging has been compared with mUSS, and both were found to be applicable tools for detecting wrist arthritis in adults [20]. Similarly, thermal imaging has also been compared with x-rays and has been observed to detect rheumatoid arthritis at an earlier stage [33]. Thermal imaging has also been shown effective for the screening of knee osteoarthritis by providing quantitative diagnostic information [34].
Rheumatoid arthritis’ visual signs may include skin redness centered on the affected joint [35]. This study related possible temperature and colour changes at the knees to establish the extent of correlation between the two effects and thus further assist with the understanding of the condition. Our study’s contributions include:
  • Devising a consistent method to extract the region of interest (ROI) centered on the knee and a procedure to analyze its temperature.
  • The analysis of knee temperature based on the sub-grouping of the participants into one knee, both knees and neither knee with active inflammation.
  • Correspondence analysis between thermal and visual (colour) imaging in JIA participants.
  • Correspondence analysis of thermal and visual imaging to the clinician’s assessment in identifying inflamed joints in participants with JIA.
In the following sections, the methodology is explained and the results are described.

2. Methods

2.1. Ethical Approvals

Ethical approvals were obtained from Sheffield Hallam University Research Ethics Committee (REC) (United Kingdom) and the National Health Service Research Ethics Committee (NHS, United Kingdom, REC reference number: 16/EM/0227, IRAS project number 189774, dated 8 June 2016). The carers of the children taking part and, whenever possible, the participants themselves, gave their written assent or consent prior to taking part in the study, and their data were anonymized to protect their identities.

2.2. Recruitment

The knee is the joint most commonly affected in JIA, and we therefore collected data relating to knee joints. Twenty participants, aged 4 to 16 years (age: mean = 11.2 years, standard deviation = 2.3 years) were recruited for the study. The recruitment was throughout the year, not specific to a particular season. Inclusion in the study required participants to have a confirmed diagnosis of JIA (oligoarticular, polyarticular, psoriatic and enthesitis-related arthritis subtype) made by a consultant paediatric rheumatologist according to the International League of Associations for Rheumatology criteria [36], under active management by the paediatric rheumatology service at the hospital where this study was undertaken. Individuals were excluded if they were aged 4 years or under (the paediatric gait arms legs and spine (pGALS) tool for musculoskeletal examination is validated for school-aged children), had any chronic or active infection, had any recent fracture (which could confound the thermal signature), exhibited the presence of any other diagnosis that could result in arthritis, or were non-English speaking (the study did not have language translators).
The study team recruited participants to the study from those who were referred for steroid joint injection to knee joints. Study visits for collection of thermal and visual imaging were combined with participants’ planned attendances for steroid (as an anti-inflammatory drug) joint injection. Thus, participants were expected to have active knee arthritis. Four of the 20 participants, however, when subsequently reassessed on the day they attended for their planned steroid joint injection, were found not to have active knee arthritis on clinician assessment. The data were collected (routine care clinical examination and thermal and visual imaging) before the steroid injection; therefore, the steroid injection would not impact on the data collected. Participants’ demographic details are included in Table 1.

2.3. Medical Examinations of Participants

Participation in the study did not influence, in any way, the standard treatment offered, and the participants were not informed of the results obtained in the study. At the time of thermal and visual imaging data collection, 16 participants had confirmation of active knee arthritis (in either one or both knees) based on clinician examination. Four participants were not assessed as having signs of active knee arthritis at the time of imaging. Thermal and visual imaging data recordings and musculoskeletal examinations were performed up to 30 min (depending on the length of the required preparation time) apart on the same day. All the participants were evaluated by an experienced paediatric rheumatology clinician 30 min before the time of thermal and visual data collection. Musculoskeletal examination was performed according to the standard pGALS [37] approach. During clinician examination, the presence or absence of restricted movement, joint swelling and increased joint temperature at each knee joint were recorded for all participants. Additional notes were taken detailing any other comorbidity that could alter biomechanics, height/weight and current medications. A summary of the assessments by the clinician is provided in Table 2.

2.4. Thermal and Visual Image Recordings

Thermal imaging was performed in a carefully chosen room within the hospital with consistent temperature and humidity and free of draught. The mean room temperature for the recordings was 23.6 °C (standard deviation, 1.26 °C) and the mean relative humidity was 33% (standard deviation, 2.4%).
On arrival, the participant sat on a stool draped with a towel (avoiding contact with the knees) for approximately 10 min to allow for acclimatization to the room temperature (a longer duration was not used to optimize participant concordance with the study protocol). Thermal recording of the front of the knees was performed, and then the same camera was used to take a visual image of the knees. The thermal camera used in the study was FLIR T630sc that had been recently calibrated. The camera’s temperature sensitivity is within 40 mK, image resolution: 640 × 480 pixels, spectral range: 7.5 µm to 13 µm, accuracy: within ±1 °C or ±1% of the reading, dynamic range: 14 bits, and it can operate between −14 °C and 50 °C. It has maximum image capture rate of 30 frames per second, and it can also take visual images. The camera was connected via a USB link to a high specification laptop computer to store the recordings. The images were processed and analyzed in Matlab© (version 2017, The MathWorks, Natick, MA, USA). The thermal camera was located on a tripod, one meter away from the participant. The thermal recording duration was 20 s at 30 frames per second, resulting in 600 images per participant. The video recording, instead, of a single thermal image was chosen as it allowed the pixel values within the selected region of interest to be averaged not only spatially but also temporally. Temporal averaging further reduced the effects of noise.

2.5. Image Processing Procedures

The procedure to process the thermal and visual images is described in this section.

2.5.1. Thermal Image Processing Procedure

Using the Matlab© package, the first image of the thermal video was displayed on the computer screen. Then, with the aid of the polygon cropping function in Matlab©, a region centered on the knees was manually cropped from the image. In order to make the cropping consistent for the knees in each participant and across all participants, a cropping procedure was devised. This followed the curvature of the knee, centered at the knee region. A circle was manually placed centered on the knee, with its perimeter touching the curvature of the knee (see the white arrows in Figure 1). From the center of the circle, an area that covered, vertically, 1.5 times the radius of the circle indicated the height of the region of interest (ROI) for analysis, while its width followed the knee’s contour. The choice of 1.5 times the radius for the ROI height was a compromise between the inclusion of the region most affected by arthritis and the sensitivity of the analysis. The inclusion of a larger region was considered as reducing the sensitivity of the analysis as the ROI was represented by the average of pixel values within the ROI.
The stages in the cropping operation and its extraction are shown in Figure 2. After the ROI was identified, a mask of the region was automatically generated and was mapped over the original image; cropping was then performed to extract the ROI from the full image.
Once the ROI for the first image of the video was extracted, the ROIs from the following images were extracted by using a template-matching tracking approach that detected similarity based on the normalized cross correlation (NCC) [38]. The template matching method tracked the extracted ROI from the first image by finding a region closest to it in each successive image. The tracking operation was incorporated to deal with small body movements that may have occurred during the 30 s thermal video recording. Template matching using NCC has been previously used for evaluating the similarity between images [39]. It has been reported to be more accurate than other methods such as the sum of absolute difference and sum of squared difference; however, it is more computationally intensive [39]. The value of NCC for an image region (f) and the template t is determined by Equation (1)
N C C ( u , v ) = x , y [ f ( x , y ) f ¯ u , v ] [ t ( x u , y v ) t ¯ ] x , y [ f ( x , y ) f ¯ u , v ] 2 [ t ( x u , y v ) t ¯ ] 2
where x, y, u and v and pixel coordinates, t ¯ is the mean of the pixel value for the template, and f ¯ u , v is the mean of f(x,y) in the region under the template [38]. The larger the NCC value, the greater the similarity.
In Figure 2, an example of an RGB coloured thermal image for visual display and for visually cropping the first image is shown. The images, however, were not processed in RGB colours. The pixels in the processed images represented the actual temperature values in degrees centigrade and thus they visually appeared in shades of grey. Once the ROIs were extracted from the images within the video, the pixel values contained within each ROI were averaged and then further averaged temporally across all 300 images to obtain a single value, representing the temperature of the selected region.

2.5.2. Visual Image Processing

The purpose of visual image analysis was to study whether possible skin colour changes associated with active arthritis could be accurately quantified and correlated with the findings from thermal imaging and the clinician’s assessment. A single visual colour image of the front of the knees was taken from each participant. Only a single visual image was taken (unlike the thermal recordings where videos of the knees where taken), as the visual images were less noisy than the thermal images and a single visual image was sufficient for the required analysis. The recording room was suitably lit to allow the participant to be clearly visible in the camera. The image was displayed on a computer screen using Matlab©, then the contours of both knees were cropped manually. The selected regions for the knees in each participant were roughly the same size. The procedure followed in order to extract the ROI was the same as that used for the thermal images except that tracking algorithm was not needed.
There were three possible options to assess any skin colour changes at the knees from the visual images. These were:
i.
The direct comparison of the colours of the right and left knees in each participant. This was not used as the method assumed that there was no baseline colour difference between the knees. Knees unaffected by arthritis may not have an identical skin colour due to factors such varying exposure to sun light etc.
ii.
The comparison of the colour of each knee with a reference region taken from under the same knee. In this method, any baseline colour difference would have been considered. This method was also not used as it meant that the two knees would have had different references, making the comparison of results inaccurate.
iii.
The method implemented compared the colours of the knees with the average of the reference regions taken under each knee. In this method, a common reference was used for both knees and the sources of error in methods (i) and (ii) were dealt with. The reference region was mid-way between the ankle and the knee. The method, however, assumed that arthritis had not affected the colour of the reference region. Figure 3 shows the reference regions under the knees manually cropped by displaying the visual image on the screen. The reference regions taken from the left and right legs had the same size and were averaged to produce a common reference for both knees.
Figure 4 shows the stages in extracting the regions of interest and their common reference.
In order to quantify any colour change and compare the colours of the knees, the following operations were performed:
  • The histograms of each knee’s ROI’s colour components (i.e., red, green and blue) and those for the common reference were obtained. The histogram for a colour component indicated the frequency of the occurrence of shade of colour for the related component. The cropped regions for the knees appeared on a square frame, with areas not covered by the selected region appearing black as shown Figure 4a,b. Therefore, this black colour was excluded from the histograms as it represented the image background after it had been cropped.
  • For each knee, the Euclidian distance between each colour component histogram and common reference region was obtained. The resulting three distances were then averaged to obtain a single distance measure quantifying the colour difference for the knee. The knee with a larger distance from the reference region was considered to have a greater colour difference.

3. Results and Discussion

To aid the interpretation of the results, the participants were divided into three diagnostic groupings according to clinician assessment of whether the knees were inflamed or not at the time of thermal and visual imaging. The groupings were:
  • Group I: participants with one inflamed knee joint.
  • Group II: participants with both knees actively inflamed.
  • Group III: participants with neither knee joint inflamed.
The motivation for dividing the participants into three groups was to relate the analysis to manner in which they were affected by JIA. This approach enabled the temperature of the JIA affected and unaffected knees to be directly compared in Group I. In Group II, where both knees were affected, a direct comparison of the temperatures of the knees would not have indicated the effect of arthritis, and so for those participants, their temperatures were compared with that of a reference region, assumed to be unaffected by arthritis. For Group III, where neither knee was affected, the temperatures were also compared with that of the reference region to explore whether they correlated with that of reference region (this would have indicated the efficacy of the reference region).
The thermal and visual imaging results were compared for correspondence with the clinician’s musculoskeletal examinations to determine the extent to which they correlated.

3.1. Correspondence between Thermal Imaging and Clinical Evaluation

3.1.1. Group I Participants

Table 3 provides the absolute temperature difference (ATD) and percentage temperature difference (PTD) between the knees of the participants in Group I.
The value of ATD indicates the magnitude of the temperature difference between the knees, i.e., A T D = | T L T R | , where the vertical bars signify magnitude, and TL and TR are the measured temperatures for the left and right knees, respectively. The PTD is a fraction, determined by dividing the ATD by the average of the knees’ temperatures, in percentage form.
P T D = A T D 0.5 ( T L + T R ) × 100
There were eight participants in Group I. In six (75%) out of the eight participants, there was correspondence between the thermal imaging identifying the left or right knee as warmer and the clinician’s diagnosis of active inflammation for the same knee. The averaged ATD and PTD values for the group were 0.97 °C and 3.13%, respectively (these values are compared with those from Groups II and III in following sections).
The temperatures of the knees with active and not active inflammation for Group I are further analyzed in Table 4. In all participants, the knee with active inflammation had a higher temperature as compared to the other knee. The associated percentage mean and median temperature increases were 31.63 30.66 30.66 × 100 = 3.164 % and 31.30 30.33 30.33 × 100 = 3.198 % , respectively.
The Shapiro–Wilk test for normality of distribution was performed on the temperature differences between the knees with and without active inflammation. Shapiro–Wilk provides a test statistic ( 0 W 1 ), with values closer to 1 pointing to a higher likelihood of normality in distribution, and a probability (p) value. The formula to calculate W is provided in a number of articles, including [40,41]. The test indicated that the temperature differences between the knees could not be considered to be from a normal distribution (test statistic value: W = 0.657, probability = 0.0024). Given the outcome of distribution test, a paired t-test of statistical significance was avoided, and instead, the Wilcoxon signed-rank test was used to determine whether the difference between the medians of the knee temperatures was statistically significant. The Wilcoxon signed-rank test is a non-parametric test for variables whose distributions cannot be confirmed to be from a normal distribution. The null hypothesis for the test is that there is no difference in the medians at the specified confidence level (in this study, 95%). The probability (p) value obtained from this test was 0.0078, indicating that the difference in the medians of the temperatures for the knees was statistically significant.
Boxplots of the temperatures of the knees with and without active inflammation for the group are shown in Figure 5. These indicate an overlap in the temperatures of the knees with skewed distributions, with the median (shown as a red horizontal line inside each box) being higher for the knees with active inflammation.
The temperature assessment of the knees identified as warmer by thermal imaging for Participants 5 and 9 did not correspond with the clinician’s identification of the knees with active inflammation (see Table 3). These two cases were further reviewed to explore the possible causes of the discrepancy. The exploration of the correspondence between the thermal imaging and the knee with active inflammation was only performed for Group I, as for Group II, both knees and for Group III, neither knee had active inflammation.
Participant 5: The clinician’s assessment of Participant 5 indicated that the right knee had active inflammation, was abnormally warm (assessment by touching the knee) and swollen, and had restricted movement. Thermal imaging indicated that left knee was warmer by 0.2 °C. This is the smallest temperature difference amongst the participants in Group I and is about one fifth of the mean difference between the knees for the group. The thermal images of the participant’s knees and the chosen ROIs are shown in Figure 6.
In Figure 6, the darker regions as indicated on the colour bars are relatively warmer. The participant walked with a limp and had a fixed flexion deformity (inability to fully straighten the knee) affecting the right knee. These issues may have influenced the participant’s walking pattern, leading to a greater reliance on the left knee (without active inflammation) and possibly accounting for the 0.2 °C temperature increase (indicated by thermal imaging) as compared to the other knee. The discrepancy between the clinician’s identification of the inflamed right knee as being abnormally warm and the thermal imaging indication of the other knee as being slightly warmer might be due to the clinician’s awareness of the overall diagnosis for the knees (e.g., the right knee being inflamed and swollen), thus possibly causing a bias toward the right knee when considering its temperatures.
Participant 9: The clinician’s assessment of Participant 9 indicated the left knee had active inflammation and had restricted movement. The clinical assessment did not find abnormal warmth for either knee. The thermal imaging indicated that the right knee was warmer by ATD = 0.99 °C. This value of ATD is close to the group’s ATD (i.e., 0.97). The participant had degenerative changes to the left hip and a fixed flexion deformity on the left knee. The participant walked with two elbow crutches with reduced weight-bearing on the left leg. On the thermal images (shown in Figure 7), the fixed flexion deformity can be noted on the left leg as it looks slightly bent forward. The darkest regions, which signify hotspots, also appear more on the right limb than the left limb. Although the left knee was clinically confirmed to have active inflammation, thermal imaging pointed to the right knee as being warmer. As in Participant 5, it might be possible that an increased reliance on the side (without active inflammation) for walking may have raised the knee temperature beyond a temperature increase produced by the knee with active inflammation. If this were to be the case, as in Participant 5, the acclimatization period had not stabilized the temperature of the knee without active inflammation. Additionally, as in Participant 5, the warmer knee as identified by thermal imaging was not correctly detected in the clinical assessment.

3.1.2. Group II Participants

There were eight participants in Group II, all with active inflammation of both knees at the time of thermal recordings. In order to examine the manner in which JIA may have affected the temperature of the knees, their direct comparison with an unaffected knee (like in Group I) was not possible. For this examination, the temperature of the two knees was compared against the temperature of a common reference. This common reference was obtained by manually selecting two sections of identical size mid-way between the ankle and the knee for each leg and then averaging their pixel values. The assumption was that the common reference section was not significantly affected by JIA. As indicated in Table 5, all but Participant 2 had higher temperatures for their knees as compared to their common reference.
For Participant 2, the temperature of the knees and their common reference were very close (temperature differences between the left and right knees and their common reference were 0.01 and 0.14 °C, respectively). A plot of the knees’ temperatures and their common reference is provided in Figure 8.
The boxplots of Group II’s temperature distributions are shown in Figure 9. A large overlap between the temperatures of the knees is evident. The median temperature (shown a red horizontal bar inside each box) of the common reference region is below those of the left and right knees.
Table 6 shows the results of the Shapiro–Wilk test (confidence interval, 95%) to establish whether the mean temperature differences are from a normal distribution and whether the differences were statistically significant.
The tests compared the left and right knee temperatures with their common reference temperature and the left knee against right knee temperature. For all three Shapiro–Wilk tests, the W values were close to 1 and the p-values were greater than 0.05; therefore, it was considered that the likelihood was that their differences were from a normal distribution, and so a paired t-test was applied to establish the statistical significance of the differences. The t-tests indicated statistically significant temperature differences between the knees and their common reference but not between each other.

3.1.3. Group III Participants

The knee temperatures for the four participants in Group III are provided in Table 7. The ATD and PTD values that indicated the temperature difference between the knees were 0.13 °C and 0.40%, respectively.
A summary comparison of the knee temperatures in Group III with those in Groups I and II is provided in Table 8. Comparing Groups I (one knee with active inflammation) and III (neither knee with active inflammation), the ATD and PTD values were 7.5 and 7.8 times larger, respectively, in Group I. Similarly, the ATD and PTD values were 2.9 and 3.0 times larger, respectively, in Group II than III. These results correlate with the earlier studies [32,42] indicating that active JIA joints show an elevated temperature.

3.2. Correspondence between Visual Imaging, Thermal Imaging and Clinician’s Evaluation

A summary of correspondence between visual (colour) imaging, thermal imaging and the clinician’s assessment of the knees for the three groups is provided in Table 9.
Complete correspondence existed between the thermal imaging and visual imaging for Group II, in which for all eight participants, the knees identified as warmer by thermal imaging were identified to have greater colour differences to their common reference regions. In Group III, correspondence existed in three out of four participants. The participant for which correspondence did not exist, i.e., Participant 4 had the lowest temperature difference between the knees in Group III, with ATD and PTD values of 0.03 and 0.09, respectively (i.e., the knees had almost identical temperatures).
In Group I, the thermal and visual imaging corresponded in five out of the eight participants. The agreement between visual imaging and the clinician’s identification of the knee with a greater colour change for this group occurred for five subjects. Of the three participants (i.e., 5, 6 and 11) that did not provide colour correspondence with the clinician, two participants (6 and 11) also did not show temperature correspondence with the clinician assessment. A possibility for the cause of reduced correspondence in Group I may be the manner in which the common reference was selected for the group. The common reference was chosen mid-way between the ankle and the knee. This region was visible in all thermal and visual images, and thus, its selection was therefore practical. However, it may be possible that temperature changes due to arthritis may have affected the common reference, making it biased to an extent. For the other two groups, where both knees had active inflammation or neither knee had active inflammation, this issue might not have been as significant. Another possible cause of thermal and visual discrepancy in Group I may be the possibility of a few participants relying more on the unaffected limb for walking, thus increasing the associated knee’s temperature due to the relatively increased mechanical loading, with the skin colour for the associated knee being less affected by this reliance. A third possibility could be that a distinct colour change may not always be present in knees with active inflammation. Overall, however, in 16 out of the 20 participants (i.e., 80%), the thermal and visual imaging methods identified the same knee as being warmer and with a greater colour change.
The study made contributions to the manner in which thermal and visual information are processed and their data interpreted. The results can provide further information about how inflammation in JIA affects temperature and colour at the knee as well as the extent of the correspondence between clinicians’ diagnoses and the two imaging methods.
The applications of thermal imaging in pediatric healthcare are growing. For example, a recent study reported its potential for fracture screening [43]. Although a variety of tests and imaging methods exist for monitoring and diagnosing JIA (e.g., [44,45,46]), an accurate quantification of possible temperature and colour changes may further assist in the timelier detection and treatment of JIA [44,45,46].
In this study, temporal and spatial averaging were used to denoise the thermal images. However, a number of studies have demonstrated the effectiveness of wavelet transform in image denoising, and this could an area of further development [47,48,49,50,51,52].
In a few cases, it was observed that the clinician’s knowledge of a knee with active inflammation (based on diagnostic tests) might have biased them to detect (by touch) the knee with active inflammation to be warmer even though the other inactive knee was actually warmer (evidenced by thermal imaging). The study confirmed the findings of a number of earlier studies with regard to the efficacy of thermal imaging in diagnosing arthritis. The main advantage of thermal imaging is that is an objective test and accurate method of quantifying warmth, and this information, combined with visual imaging, may make the diagnosis more reliable. The study should be performed on a larger number of participants, which could also allow the severity of arthritis to be correlated with the thermal and visual imaging data. The correlation of thermal and visual imaging data with CE-MRI data would provide a comparison with a more objective assessment of joint inflammation than clinician assessment alone.

4. Conclusions

Methods to accurately quantify knees’ temperature and colour were developed. The correspondence between thermal imaging, visual imaging and clinician’s examinations of the knees for detecting juvenile idiopathic arthritis (JIA) was investigated. A method for delineating the region of interest was devised and was used to process the images. The knees with active inflammation had a higher temperature as compared with the knees without active inflammation, and the temperature difference was statistically significant. A greater colour difference was observed when comparing the knees with active inflammation with their common reference as compared with inactive knees. In 16 out of the 20 participants, the findings from the thermal and visual imaging findings correlated. The study’s findings with regard to the effect of arthritis on the knee temperature were consistent with earlier studies.

Author Contributions

Conceptualization, methodology and validation by all authors; software by H.N. and R.S.; writing—original draft preparation, writing—review and editing by all authors. All authors have read and agreed to the published version of the manuscript.

Funding

This research received no external funding.

Acknowledgments

We are grateful to all patients and their carers who participated in the study without whom this study would not have been possible. We are grateful to the ethics committees that reviewed our application.

Conflicts of Interest

The authors declare no conflict of interest.

References

  1. Ravelli, A.; Martini, A. Juvenile idiopathic arthritis. Lancet 2007, 369, 767–778. [Google Scholar] [CrossRef] [Green Version]
  2. Prakken, B.; Albani, S.; Martini, A. Juvenile idiopathic arthritis. Lancet 2011, 377, 2138–2149. [Google Scholar] [CrossRef] [Green Version]
  3. Boros, C.; Whitehead, B. Juvenile idiopathic arthritis. Aust. Fam. Physician 2010, 39, 630–636. [Google Scholar]
  4. Chang, H.J.; Burke, A.E.; Glass, R.M. Juvenile Idiopathic Arthritis. JAMA 2010, 303, 1328. [Google Scholar] [CrossRef] [Green Version]
  5. Wallace, C.; Giannini, E.H.; Spalding, S.J.; Hashkes, P.J.; O’Neil, K.M.; Zeft, A.S.; Szer, I.S.; Ringold, S.; Brunner, H.I.; Schanberg, L.E.; et al. Trial of early aggressive therapy in polyarticular juvenile idiopathic arthritis. Arthritis Rheum. 2011, 64, 2012–2021. [Google Scholar] [CrossRef] [Green Version]
  6. Baildam, E. A complementary on TREAT: The trial of early aggressive drug therapy in juvenile idiopathic arthritis. BMC Med. 2012, 10, 59. Available online: https://bmcmedicine.biomedcentral.com/track/pdf/10.1186/1741-7015-10-59 (accessed on 24 October 2019). [CrossRef] [Green Version]
  7. Ravelli, A.; Consolaro, A.; Horneff, G.; Laxer, R.M.; Lovell, D.J.; Wulffraat, N.M.; Akikusa, J.D.; Al-Mayouf, S.M.; Antón, J.; Avčin, T.; et al. Treating juvenile idiopathic arthritis to target: Recommendations of an international task force. Ann. Rheum. Dis. 2018, 77, 819–828. [Google Scholar] [CrossRef]
  8. Giancane, G.; Ruperto, N. Paediatric Rheumatology International Trials Organisation (PRINTO) Treatment of juvenile idiopathic arthritis. Curr. Opin. Rheumatol. 2019, 31, 428–435. [Google Scholar] [CrossRef]
  9. VersusArthritis. Defying Arthritis Together. Available online: https://www.versusarthritis.org/ (accessed on 25 October 2019).
  10. Foster, H.E.; Kay, L.J.; Friswell, M.; Coady, D.; Myers, A. Musculoskeletal screening examination (pGALS) for school-age children based on the adult GALS screen. Arthritis Rheum. 2006, 55, 709–716. [Google Scholar] [CrossRef]
  11. Selaas, O.; Nordal, H.H.; Halse, A.-K.; Brun, J.G.; Jonsson, R.; Brokstad, K.A. Serum Markers in Rheumatoid Arthritis: A Longitudinal Study of Patients Undergoing Infliximab Treatment. Int. J. Rheumatol. 2015, 2015, 1–9. [Google Scholar] [CrossRef] [Green Version]
  12. Giancane, G.; Consolaro, A.; Lanni, S.; Davì, S.; Schiappapietra, B.; Ravelli, A. Juvenile Idiopathic Arthritis: Diagnosis and Treatment. Rheumatol. Ther. 2016, 3, 187–207. [Google Scholar] [CrossRef] [Green Version]
  13. Ramos, P.C.; Ceccarelli, F.; Jousse-Joulin, S. Role of ultrasound in the assessment of juvenile idiopathic arthritis. Rheumatology 2012, 51, vii10–vii12. [Google Scholar] [CrossRef] [Green Version]
  14. Miller, E.; Uleryk, E.; Doria, A.S. Evidence-Based Outcomes of Studies Addressing Diagnostic Accuracy of MRI of Juvenile Idiopathic Arthritis. Am. J. Roentgenol. 2009, 192, 1209–1218. [Google Scholar] [CrossRef]
  15. Ostergaard, M.; Edmonds, J.; McQueen, F.; Peterfy, C.; Lassere, M.; Ejbjerg, B.; Bird, P.; Emery, P.; Genant, H.; Conaghan, P.G. An introduction to the EULAR–OMERACT rheumatoid arthritis MRI reference image atlas. Ann. Rheum. Dis. 2005, 64, i3–i7. [Google Scholar] [CrossRef] [PubMed] [Green Version]
  16. Diamanti, A.P.; Navarini, L.; Messina, F.; Markovic, M.; Arcarese, L.; Basta, F.; Meneguzzi, G.; Margiotta, D.P.E.; Laganà, B.; Afeltra, A.; et al. Ultrasound detection of subclinical synovitis in rheumatoid arthritis patients in clinical remission: A new reduced-joint assessment in 3 target joints. Clin. Exp. Rheumatol. 2018, 36, 984–989. [Google Scholar]
  17. Hemke, R.; Maas, M.; Van Veenendaal, M.; Dolman, K.M.; Van Rossum, M.A.; Berg, J.M.V.D.; Kuijpers, T.W. Contrast-enhanced MRI compared with the physical examination in the evaluation of disease activity in juvenile idiopathic arthritis. Eur. Radiol. 2013, 24, 327–334. [Google Scholar] [CrossRef] [PubMed]
  18. Hemke, R.; Lavini, C.; Nusman, C.M.; Berg, J.M.V.D.; Dolman, K.M.; Schonenberg-Meinema, D.; Van Rossum, M.A.; Kuijpers, T.W.; Maas, M. Pixel-by-pixel analysis of DCE-MRI curve shape patterns in knees of active and inactive juvenile idiopathic arthritis patients. Eur. Radiol. 2014, 24, 1686–1693. [Google Scholar] [CrossRef] [PubMed]
  19. Spalding, S.J.; Kwoh, C.K.; Boudreau, R.; Enama, J.; Lunich, J.; Huber, D.F.; Denes, L.; Hirsch, R. Three-dimensional and thermal surface imaging produces reliable measures of joint shape and temperature: A potential tool for quantifying arthritis. Arthritis Res. Ther. 2008, 10, R10. [Google Scholar] [CrossRef] [PubMed] [Green Version]
  20. Lerkvaleekul, B.; Jaovisidha, S.; Sungkarat, W.; Chitrapazt, N.; Fuangfa, P.; Ruangchaijatuporn, T.; Vilaiyuk, S. The comparisons between thermography and ultrasonography with physical examination for wrist joint assessment in juvenile idiopathic arthritis. Physiol. Meas. 2017, 38, 691–700. [Google Scholar] [CrossRef]
  21. Hawley, D.; Offiah, A.C.; Burke, D. PP10. Evaluation of skin temperature using liquid crystal and infrared thermometers in children attending specialist paediatric rheumatology clinics. Rheumatology 2015, 54. [Google Scholar] [CrossRef] [Green Version]
  22. Alkali, A.H.; Saatchi, R.; Elphick, H.; Burke, D. Thermal image processing for real-time non-contact respiration rate monitoring. IET Circuits Devices Syst. 2017, 11, 142–148. [Google Scholar] [CrossRef]
  23. Owen, R.; Ramlakhan, S.; Saatchi, R.; Burke, D. Development of a high-resolution infrared thermographic imaging method as a diagnostic tool for acute undifferentiated limp in young children. Med. Boil. Eng. 2017, 56, 1115–1125. [Google Scholar] [CrossRef] [Green Version]
  24. De Salis, A.F.; Saatchi, R.; Dimitri, P. Evaluation of high resolution thermal imaging to determine the effect of vertebral fractures on associated skin surface temperature in children with osteogenesis imperfecta. Med. Boil. Eng. 2018, 56, 1633–1643. [Google Scholar] [CrossRef]
  25. Borojevic, N.; Kolaric, D.; Grazio, S.; Grubisic, F.; Antonini, S.; Alelexandra, I. Thermography hand temperature distribution in rheumatoid arthritis and osteoarthritis. Period. Biol. 2011, 113, 445–448. [Google Scholar]
  26. Gabrhel, J.; Popracova, Z.; Tauchmannova, H.; Chvojka, Z. The connection of thermographic and musculoskeletal ultrasound examinations of the syndrome of painful knee. Rheumatologica 2012, 26, 1–21. [Google Scholar]
  27. Ilowite, N.T.; A Walco, G.; Pochaczevsky, R. Assessment of pain in patients with juvenile rheumatoid arthritis: Relation between pain intensity and degree of joint inflammation. Ann. Rheum. Dis. 1992, 51, 343–346. [Google Scholar] [CrossRef] [Green Version]
  28. Sanchez, B.M.; Lesch, M.; Brammer, D.; Bove, S.E.; Thiel, M.; Kilgore, K.S. Use of a portable thermal imaging unit as a rapid, quantitative method of evaluating inflammation and experimental arthritis. J. Pharmacol. Toxicol. Methods 2008, 57, 169–175. [Google Scholar] [CrossRef]
  29. Brenner, M.; Braun, C.; Oster, M.; Gulko, P.S. Thermal signature analysis as a novel method for evaluating inflammatory arthritis activity. Ann. Rheum. Dis. 2005, 65, 306–311. [Google Scholar] [CrossRef] [Green Version]
  30. De Silva, M.; Kyle, V.; Hazleman, B.; Salisbury, R.; Thomas, P.P.; Wraight, P. Assessment of inflammation in the rheumatoid knee joint: Correlation between clinical, radioisotopic, and thermographic methods. Ann. Rheum. Dis. 1986, 45, 277–280. [Google Scholar] [CrossRef] [Green Version]
  31. Salisbury, R.S.; Parr, G.; De Silva, M.; Hazleman, B.L.; Page-Thomas, D.P. Heat distribution over normal and abnormal joints: Thermal pattern and quantification. Ann. Rheum. Dis. 1983, 42, 494–499. [Google Scholar] [CrossRef] [Green Version]
  32. Lasanen, R.; Piippo-Savolainen, E.; Remes-Pakarinen, T.; Kröger, L.; Heikkilä, A.; Julkunen, P.; Karhu, J.; Töyräs, J. Thermal imaging in screening of joint inflammation and rheumatoid arthritis in children. Physiol. Meas. 2015, 36, 273–282. [Google Scholar] [CrossRef]
  33. Snekhalatha, U.; Rajalakshmi, T.; Gopikrishnan, M.; Gupta, N. Computer-based automated analysis of X-ray and thermal imaging of knee region in evaluation of rheumatoid arthritis. Proc. Inst. Mech. Eng. Part H J. Eng. Med. 2017, 231, 1178–1187. [Google Scholar] [CrossRef]
  34. Jin, C.; Yang, Y.; Xue, Z.; Liu, K.; Liu, J. Automated analysis method for screening knee osteoarthritis using medical infrared thermography. J. Med. Biol. Eng. 2013, 33, 471–477. [Google Scholar] [CrossRef]
  35. Pincus, T. In the clinic. Rheumatoid arthritis. Ann. Intern. Med. 2010, 153, ITC1-15. [Google Scholar] [CrossRef]
  36. E Petty, R.; Southwood, T.R.; Manners, P.; Baum, J.; Glass, D.N.; Goldenberg, J.; He, X.; Maldonado-Cocco, J.; Orozco-Alcala, J.; Prieur, A.-M.; et al. International League of Associations for Rheumatology classification of juvenile idiopathic arthritis: Second revision, Edmonton, 2001. J. Rheumatol. 2004, 31, 390–392. [Google Scholar]
  37. Foster, H.E.; Jandial, S. pGALS–paediatric Gait Arms Legs and Spine: A simple examination of the musculoskeletal system. Pediatr. Rheumatol. 2013, 11, 44. [Google Scholar] [CrossRef] [Green Version]
  38. Lewis, J.P. Fast template matching. In Proceedings of the Vision Interface 95, Canadian Image Processing and Pattern Recognition Society, Quebec City, QC, Canada, 15–19 May 1995; pp. 120–123. Available online: http://scribblethink.org/Work/nvisionInterface/vi95_lewis.pdf (accessed on 24 October 2019).
  39. Munsayac, F.E.T.; Alonzo, L.M.B.; Lindo, D.E.G.; Baldovino, R.G.; Bugtai, N.T. Implementation of a normalized cross-correlation coefficient-based template matching algorithm in number system conversion. In Proceedings of the IEEE 9th International Conference on Humanoid, Nanotechnology, Information Technology, Communication and Control, Environment and Management (HNICEM), Manila, Philippines, 1–3 December 2017. Corpus 39411265. [Google Scholar] [CrossRef]
  40. Yap, B.W.; Sim, C.H. Comparisons of various types of normality tests. J. Stat. Comput. Simul. 2011, 81, 2141–2155. [Google Scholar] [CrossRef]
  41. Shapiro, S.S.; Wilk, M.B. An analysis of variance test for normality (complete samples). Biometrika 1965, 52, 591–611. [Google Scholar] [CrossRef]
  42. Ward, O.; Nwaizu, H.; Saatchi, R.; Ramlakhan, S.; Hawley, D. P36 Does thermal imaging correlate with musculoskeletal examination in the identification of inflamed joints in children and young people with juvenile idiopathic arthritis? A prospective diagnostic accuracy study. Rheumatology 2018, 57, 038. [Google Scholar] [CrossRef] [Green Version]
  43. Reed, C.; Saatchi, R.; Burke, D.; Ramlakhan, S. Infrared thermal imaging as a screening tool for paediatric wrist fractures. Med. Boil. Eng. 2020, 1–15. [Google Scholar] [CrossRef]
  44. Colebatch-Bourn, A.N.; Edwards, C.J.; Ramos, P.C.; D’Agostino, M.-A.; Hemke, R.; Jousse-Joulin, S.; Maas, M.; Martini, A.; Naredo, E.; Østergaard, M.; et al. EULAR-PReS points to consider for the use of imaging in the diagnosis and management of juvenile idiopathic arthritis in clinical practice. Ann. Rheum. Dis. 2015, 74, 1946–1957. [Google Scholar] [CrossRef]
  45. Kim, K.H.; Kim, D.S. Juvenile idiopathic arthritis: Diagnosis and differential diagnosis. Korean J. Pediatr. 2010, 53, 931–935. [Google Scholar] [CrossRef] [Green Version]
  46. Manzoni, S.M.; Malattia, C.; Lanni, S.; Ravelli, A. Advances and challenges in imaging in juvenile idiopathic arthritis. Nat. Rev. Rheumatol. 2012, 8, 329–336. [Google Scholar] [CrossRef]
  47. Jangjit, S.; Ketcham, M. A New Wavelet Denoising Method for Noise Threshold. Eng. J. 2017, 21, 141–155. [Google Scholar] [CrossRef] [Green Version]
  48. Saatchi, R.; Gibson, C.; Rowe, J.W.K.; Allan, E.M. Adaptive multiresolution analysis based evoked potential filtering. IEE Proc. Sci. Meas. Technol. 1997, 144, 149–155. [Google Scholar] [CrossRef] [Green Version]
  49. Ouahabi, A.; Castanié, F. Signal and image multiresolution analysis. In Ebook; ISTE: London, UK; Hoboken, NJ, USA, 2012. [Google Scholar]
  50. Rabbani, H.; Nezafat, R.; Gazor, S. Wavelet-Domain Medical Image Denoising Using Bivariate Laplacian Mixture Model. IEEE Trans. Biomed. Eng. 2009, 56, 2826–2837. [Google Scholar] [CrossRef]
  51. Starck, J.-L.; Candes, E.; Donoho, D. The curvelet transform for image denoising. IEEE Trans. Image Process. 2002, 11, 670–684. [Google Scholar] [CrossRef] [Green Version]
  52. Po, D.D.Y.; Do, M.N. Directional multiscale modeling of images using the contourlet transform. IEEE Trans. Image Process. 2006, 15, 1610–1620. [Google Scholar] [CrossRef] [Green Version]
Figure 1. A thermal image indicating the manner in which the region of interest (ROI) was selected from the front of the knee. The white line from the center of the circle indicates the height of the ROI. The numerical values on the right-hand side of the figure (i.e., the temperature bar) are temperature values in °C.
Technologies 08 00030 g001
Figure 2. Stages to crop and extract the knee ROI from the thermal images: (a) selected ROI (the numerical values on the right-hand side of the figure, i.e., the temperature bar, are temperature values in °C), (b) the binary mask of the ROI, (c) delineated ROI and (d) extracted ROI.
Technologies 08 00030 g002
Figure 3. A visual image showing the cropped knee regions and areas under them used to obtain the common reference region.
Technologies 08 00030 g003
Figure 4. The stages in extracting the ROIs in visual images (the horizontal and vertical axes represent pixel number): (a,b), right and left knees; (c,d), reference regions from right and left knees, respectively; (e) common reference.
Technologies 08 00030 g004
Figure 5. Box plots of temperatures for the knees with and without active inflammation in Group I.
Technologies 08 00030 g005
Figure 6. Thermal image for Participant 5. The region of interest is contained within the shown square box, and the actual region of interest is as illustrated in Figure 2a. (a) Left knee; (b) Right knee. The numerical values on the right-hand side of the figures (i.e., the temperature bar) are temperature values in °C.
Technologies 08 00030 g006
Figure 7. Thermal image for Participant 9′s knees. The numerical values on the right-hand side of the figure, i.e., the temperature bar, are temperature values in °C.
Technologies 08 00030 g007
Figure 8. Plot of temperatures for Group 2′s knees and their common reference.
Technologies 08 00030 g008
Figure 9. Boxplots of the knees’ temperatures and their common reference for Group II.
Technologies 08 00030 g009
Table 1. Participant demographic information (std is standard deviation).
ParameterDetails
Mean age (standard deviation) (years)11.2 (std: 2.3)
SexMale: 9 (std: 45%), Female: 11 (std: 55%)
Clinician assessment at time of thermal imaging
  • Eight participants had one knee with active arthritis.
  • Eight participants had both knees with active arthritis.
  • Four participants did not have active knee arthritis.
Medication for the 16 participants with active knee arthritis at the time of examination
  • Systemic immunosuppression (n = 8)
  • Course of oral steroid (n = 1)
  • Systemic immunosuppression + ibuprofen (n = 1)
  • Regular ibuprofen (n = 2)
  • Regular naproxen (n = 1)
  • No medication (n = 3)
Table 2. Participants’ clinical assessment information.
ParticipantJIA DiagnosisKnee SideClinical Assessment
Abnormal WarmthSwollenRestricted Movement
1Extended Oligoarticular:RightNoNoNo
LeftYesYesYes
2Polyarticular:RightNoYesNo
LeftNoYesNo
3Oligoarticular:RightYesYesYes
LeftNoNoNo
4Polyarticular:RightNoNoNo
LeftNoNoNo
5Oligoarticular:RightYesYesYes
LeftNoNoNo
6Extended Oligoarticular:RightYesYesYes
LeftNoNoNo
7Extended Oligoarticular:RightYesYesYes
LeftYesYesYes
8Oligoarticular:RightYesYesYes
LeftYesYesYes
9Extended Oligoarticular:RightNoNoNo
LeftNoYesYes
10Oligoarticular:RightNoYesNo
LeftNoNoNo
11Oligoarticular:RightNoNoNo
LeftYesYesYes
12Oligoarticular:RightNoNoNo
LeftNoYesNo
13Polyarticular:RightNoNoNo
LeftNoNoNo
14Extended Oligoarticular:RightYesNoNo
LeftYesNoNo
15Oligoarticular:RightYesYesYes
LeftYesNoNo
16Oligoarticular:RightYesYesNo
LeftYesYesNo
17Oligoarticular:RightYesYesYes
LeftYesYesYes
18Oligoarticular:RightNoNoNo
LeftNoNoNo
19Polyarticular:RightYesYesYes
LeftYesYesYes
20Oligoarticular:RightNoNoNo
LeftNoNoNo
Table 3. Summary of results for participants (P) for Group I. Absolute temperature difference, ATD; percentage temperature difference, PTD.
PTemperature Obtained from
Thermal Imaging (TI) (°C)
TI Based Assessment of the Knees’ ROIsClinician Assessment of the KneesCorrespondence between the Knee Identified by TI as Warmer and the Knee Identified by the Clinician with Active Inflammation
Left KneeRight KneeWarmer KneeATD (°C)PTDKnee with Abnormal WarmthKnee with Mobility RestrictionKnee with Active Inflammation
133.6732.89Left0.782.34LeftLeftLeftYes
330.1831.17Right0.993.23RightRightRightYes
532.1731.97Left0.200.62RightRightRightNo
630.4630.90Right0.441.43RightRightRightYes
929.6130.60Right0.993.29NeitherLeftLeftNo
1030.2030.45Right0.250.82NeitherNeitherRightYes
1132.6128.78Left3.8312.48LeftLeftLeftYes
1231.4331.16Left0.270.86NeitherNeitherLeftYes
Mean
Standard deviation
0.97
1.20
3.13
3.92
Table 4. Comparison of knee temperatures for Group I.
ParticipantKnee Temperatures Obtained Using Thermal Imaging (°C)
Knee with Active InflammationKnee without Active Inflammation
133.6732.89
331.1730.18
532.1731.97
630.9030.46
930.6029.61
1030.4530.20
1132.6128.78
1231.4331.16
Median
Minimum
Maximum
31.30
30.45
33.67
30.33
28.78
32.89
Mean
Standard deviation
31.63
1.11
30.66
1.31
Interquartile range1.641.67
Table 5. Summary temperature analysis results for Group II.
ParticipantMean Temperature by Thermal Imaging (°C)ATD (°C)PTD
Left KneeRight KneeCommon Reference
228.3428.4728.330.130.46
732.2333.1429.210.912.78
830.1630.8129.350.652.12
1431.5631.3330.030.230.72
1533.1732.8231.350.351.05
1632.6832.9031.610.230.69
1730.9031.1629.420.260.84
1932.5632.8130.890.250.77
Mean
Standard deviation
31.45
1.61
31.68
1.59
30.02
1.16
0.38
0.27
1.18
0.82
Median
Minimum
Maximum
31.90
28.34
33.17
32.07
28.47
33.14
29.73
28.33
31.61
0.26
0.13
0.91
0.81
0.46
2.78
Interquartile range2.091.881.840.270.88
Table 6. Statistical tests to compare differences in the mean knee temperatures for Group II.
TestNormality Test
Shapiro–Wilk Test;
(Confidence Interval, 95%)
Test of Significance in Difference (Paired t-Test;
Confidence Interval, 95%)
WpOutcomepOutcome
Left knee versus reference0.9580.872Normal0.002Significant
Right knee versus reference0.8380.081Normal0.003Significant
Left knee versus right knee0.9470.762Normal0.160Not significant
Table 7. Knee temperatures for participants in Group III.
ParticipantMean Temperature by Thermal Imaging (°C)ATD (°C)PTD
Left KneeRight Knee
431.9031.870.030.09
1330.3830.280.100.33
1832.4032.180.230.70
2031.6131.760.150.48
Mean
Standard deviation
31.57
0.86
31.52
0.85
0.13
0.08
0.40
0.26
Table 8. Comparisons of the means and standard deviations of the ATD and PTD in Groups I, II and III (the parentheses contain the standard deviations).
MeasureMeans and Standard Deviations for GroupsRatios of ATD and PTD
IIIIIIGroups I and IIIGroup II and III
ATD0.97 (1.20)0.38 (0.27)0.13 (0.08)0.97/0.13 = 7.50.38/0.13 = 2.9
PTD3.13 (3.92)1.18 (0.82)0.40 (0.26)3.13/0.40 = 7.81.18/0.40 = 3.0
Table 9. Correspondence of thermal, visual and clinical assessments.
ParticipantKnee Identified with Active Inflammation by ClinicianKnee Identified Warmer by Thermal ImagingKnee with Larger Colour Difference against the Common ReferenceCorrespondence of Colour Analysis and Thermal ImagingCorrespondence of Colour Analysis and Clinical Assessment
Group I (one knee with active inflammation)
1LeftLeftLeftYesYes
3RightRightRightYesYes
5RightLeftLeftYesNo
6RightRightLeftNoNo
9LeftRightLeftNoYes
10RightRightRightYesYes
11LeftLeftRightNoNo
12LeftLeftLeftYesYes
Group II (both knees with active inflammation)
2BothRightRightYes-
7BothRightRightYes-
8BothRightRightYes-
14BothLeftLeftYes-
15BothLeftLeftYes-
16BothRightRightYes-
17BothRightRightYes-
19BothLeftLeftYes-
Group III (neither knee with active inflammation)
4NoneLeftRightNo-
13NoneLeftLeftYes-
18NoneLeftLeftYes-
20NoneRightRightYes-

