1. Introduction
An ability to quantify the quality of a video transmitted over wireless computer networks is important in evaluating the networks’ operation and performance. Two interrelated parameter groupings characterize wirelessly transmitted video quality. A grouping is related to the traffic and can be characterized by packet transmission delay, jitter and loss. These traffic measures can be accommodated as part of a quality of service (QoS) assessment [
1,
2]. The second grouping indicates the effects of noise and associated distortion on the images making up a video. These directly influence the user’s perception of the video and can be accommodated as part of the quality of experience (QoE) assessment [
3,
4]. The overall quality of the received video can be quantified by combining the QoS and QoE measures [
5,
6,
7].
QoS parameters (delay, jitter and packet loss) can be measured using traffic monitoring tools. Subjective QoE measures are acquired by allocating scores provided by the users under controlled laboratory conditions. Users are provided with the test video and are asked to assess and score it by considering a set of predefined indicators of quality [
8,
9]. The Video Quality Expert Group (VQEG) [
7] has recommendations for conducting subjective video quality tests. These are categorized into a single video stimulus that the viewers are shown either a single video at a time or double stimuli that the viewers are shown two videos, i.e., the original and test videos, simultaneously on a split-screen environment. This approach however has some shortcomings as it needs specialized software for the video player and interpretation of the scores and careful selection of the reviewers to provide a representative evaluation.
The limitations of subjective video evaluation tests could be mitigated by objective QoE tests. These tests can be either full-reference, no reference or reduced reference, depending on the approach [
8,
10]. In a full-reference test, a frame-by-frame comparison of the reference (original or transmitted) and test (received or distorted) videos is performed. In a no reference video quality evaluation, quality is assessed based on the extracted features that characterize the image quality. The selection of appropriate test features can greatly affect the reliability of the assessment. A reduced reference video quality evaluation is a hybrid between the full- and no reference methods whereby representative features from the reference video are extracted and compared to the corresponding features in the test video. These features can be spatial and motion information.
Prior to reviewing the related studies in the next section, a brief description of the main QoS and QoE measures used in this study is provided to make the article more complete. QoS was determined by measuring packet delay, jitter and percentage packet loss ratio. Delay is the time a packet takes to reach its destination from its source. Jitter is the magnitude of the variations in the delay. Percentage packet loss ratio (%PLR) is the ratio of the number of packets lost during transmission (due to for example noise) over the total number of packets transmitted, multiplied by 100.
In this study a full-reference QoE measurement was adapted. QoE measures were peak signal-to-noise (PSNR), structural similarity index measurement (SSIM) and image difference (ID). PSNR in dB is determined by [
11,
12].
where
MPP = 2
n − 1 is the maximum possible pixel value of the image and
n is the number of bits used to represent each sample, e.g., when
n is 8 bits per sample,
MPP = 255. Larger values of PSNR signify a smaller distortion and thus a higher video quality.
MSE is the mean square error between images X and Y determined by:
where
m and
n represent the image dimensions and
i,
j represent a pixel’s location on the image.
The structural similarity index (SSIM) for measuring image quality for image windows (
x and
y) of the same dimension from an image is determined by [
11,
13]:
where
and
are the means of the pixel values within the measurement windows
x and
y respectively,
and
are the pixels’ variances,
is the covariance of the pixels within the
x and
y windows. The variables
c1 and
c2 stabilize the division with weak a denominator. They are defined as
and
where the dynamic range
and
n is the number of bits per pixel. The factors
k1 and
k2 are by default 0.01 and 0.03. SSIM takes a value of 0 to 1 with values closer to 1 indicating a higher similarity.
Image difference (ID) is a measure of overall pixel-to-pixel differences between two images. It can be determined in different ways, but in this study it was obtained from the histogram of pixel values of the images being compared and using Euclidean distance to determine the histograms’ overall difference. As the processing in this study was on grey images, the pixel values ranged from 0 to 255. The difference between the two histograms was determined by using Euclidian distance as:
where
FXi and
FYi are the occurrence frequencies of a pixel with value
i associated with images X and Y respectively. An ID value of zero indicates identical images.
Video quality evaluation using MSE, PSNR or SSIM has been reported previously but combining them with the traffic measures (delay, jitter and percentage packet loss ratio (%PLR)) needed further development [
14,
15,
16,
17]. This study achieved this goal by devising a modular fuzzy logic system consisting of three fuzzy inference systems (FIS). These systems processed and combined the values of delay, jitter and %PPR with PSNR, SSIM and ID and indicated the overall received video quality. A FIS uses fuzzy logic concepts to map its numerical input values through a reasoning process to its output. FIS is an effective mean of analysing computer network data [
18,
19]. The structure of a FIS is shown in
Figure 1.
The numerical inputs to the FIS are fuzzified by a set of membership functions that indicate the degree (a value between 0 and 1) that an input belongs to a predefined fuzzy set. The knowledgebase contains the information about the process (in this study relationships between the inputs delay, jitter, %PLR, PSNR, SSIM and ID with the output that indicates the quality of the video. The inference engine performs reasoning by comparing the input values with the domain knowledge coded in the knowledgebase by a series of IF-THEN rules to indicate the output. De-fuzzification is a process whereby the outcomes of the rules are combined to produce an aggregated membership function from which the FIS output is determined [
20].
2. Related Studies
QoE has been previously measured using PSNR [
21] and SSIM [
22]. A study showed that the PSNR is more sensitive to additive Gaussian noise than the SSIM [
23]. SSIM and PSNR mainly differ on their degree of sensitivity to image degradations. PSNR is one of the most commonly used objective measures but it often has been critiqued for providing results that are not fully consistent with subjective quality assessments [
1]. However, its ease of implementation and interpretation make it valuable [
24].
Objective video quality assessment methods can reduce the cost and time of video evaluation [
25]. A video assessment method based on delay, jitter, PLR and bandwidth found QoS/QoE was closely related to video quality degradation [
26]. A method that processed delay, jitter, packet loss rate and bandwidth to determine four types of video quality degradations was reported [
1]. They analysed the impact of different levels of video degradation.
A model based on a random neural network (RNN) was proposed to assess the impact of different media access control-level parameters on video QoE in IEEE 802.11n wireless networks [
25]. In their study subjective tests were performed to correlate MAC-level parameters such as queue size, aggregation, traffic load and bit error rate with the user’s perception of video. The proposed RNN based approach estimated the impact of these parameters on the video QoE. RNN was trained with a subjective dataset to estimate QoE. Their results showed objective and subjective QoE were related. However, their study did not investigate the influence of traffic parameters such as delay, jitter and packet loss ratio.
A study proposed a QoE prediction mechanism for streaming videos [
8]. It evaluated quality degradation due to perceptual video presentation impairment, playback stalling events and instantaneous interactions between them. Their experimental results were close to a subjective QoE test method. A video QoE evaluation method that synchronized the reference and distorted videos to avoid an erroneous match was reported and was validated with a subjective video database [
24]. Video streaming services in radio-over-fibre (RoF) networks were studied [
27]. The sensitivity of the QoE measure was investigated and their results indicated that packet delay affected video quality less than jitter.
When frames are lost during transmission, the order of frames sent with those received no longer matches. The resulting mismatch in the frame sequence numbers results in inaccuracies when comparing the original and received frames to establish video quality [
24,
28]. Another limitation of current objective QoE methods is that they typically rely on peak signal to noise ratio (PSNR), structural similarity index (SSIM) or video quality metric (VQM), which do not always provide consistent assessment [
1,
9,
26,
29]. Therefore, in our study, a further video quality measurement parameter called image distance (ID) was included.
When dealing with wireless computer networks where interference and other contextual factors affect network services, QoS assessment on its own may be insufficient [
27]. Thus, the performance evaluation of lossy wireless networks needs to take into account not only the physical network characteristics (QoS) but also how these affect the end-user application (QoE). Thus integrating QoS and QoE as is achieved in our study is valuable. A number of image and video quality assessment methods were reported in [
30]. In our study we have compared the developed method against [
31] as it was closest to the approach we followed.
The features of this study are (details of each part are explained in the following sections):
Frame losses meant that frame arrival and transmission would not match correctly. Labelling each frame dealt with the issue of correct pairing of transmitted (original) and received (distorted) frames and thus improved the QoS/QoE evaluations.
Computational demand on processing was reduced through inclusion of systematic sampling of the images. This resulted in a subset of received that represented the overall video to be processed.
The sensitivity of measuring image distortion was improved through a new method called image partitioning. This enabled localized distortions to be more precisely represented.
Traffic parameters (delay, jitter and %PLR) that quantified QoS and were successfully combined with image distortion measures (PSNR, SSIM and ID) that quantified QoE to produce a signal measure of received video quality.
These evaluations were performed using a modularized structure that consisted of three separate fuzzy inference systems. This modularization improved transparency in operation and made future modifications easier.
Subjective video quality evaluations tests to determine mean opinion score (MOS) were performed by enrolling 25 participants. The results were compared with the fuzzy logic approach.
The devised methods were compared video quality assessment reported in [
31] that uses an approach referred to as the spatial efficient entropic differencing for quality assessment (SpEED-QA) model. It computes perceptually relevant image/video quality features by relying on the local spatial operations on image frames and frame differences.
3. Methodology
3.1. Wireless Network Set Up
The wireless network set up used in the study is shown in
Figure 2.
It incorporated two wireless Cisco© Access Points (APs) AIR-AP1852 (Cisco, place of origin: China) that have four external dual-band antennae. Cisco© Catalyst 3560 (Cisco, place of origin: China) switch connected via 1 Gigabit Ethernet (GE) the APs and the network emulator (NetEm), installed on a laptop computer acting as a server. The arrangement established point-to-point protocol (PPP) link between the PC-1 and PC-2. NetEm was situated in between the PPP connections to allow the traffic parameters, i.e., delay, jitter and %PLR to be controlled and thus drive the network toward different transmission quality. The control provided a mean of creating transmission environments for good, medium and poor video qualities. The video was sent over a PPP link such that the traffic from PC-1 transmitted to PC-2 through NetEm server [
32]. The selected video was a Big Buck Bunny [
33] clip, duration 90 seconds and consisting of 1350 frames. The video format was MPEG-2, all encoded using H.264. The frame pixel resolution was 1280 pixels × 720 pixels.
The video was streamed from PC-1 to PC-2 using VideoLAN Client (VLC) media player with the UDP/RTP (user datagram protocol/real-time transport protocol). This allowed time-stamp and sequence number features in RTP for actual end-to-end delay and %PLR measurements to be used. Through the NetEm software, traffic delay, jitter and %PLR were increased in three stages during the transmission. In the first stage, these parameters had a lower range of values, increasing to larger values in the third stage. The QoS, QoE and overall quality of video were measured during each stage. Wireshark was used to capture video streaming traffic packets between PC-1 and PC-2 that allowed delay, jitter and %PLR to be determined.
To develop the FIS knowledgebase that determined QoS, the transmission bounds needed to be defined. For the video streaming application, Good QoS (i.e., QoS > 67%) corresponds to delays less than 150 ms, jitters less than 10 ms and packet loss ratios less than 1%. Medium QoS (i.e., 33% < QoS 67%) corresponds to 150 < delay < 400 ms, 10 < jitter < 20 ms and 1% < packet loss ratio < 2%. Low QoS (i.e., QoS < 33%) corresponds to delay >400 ms, jitter >20 ms and packet loss ratio >2% [
18].
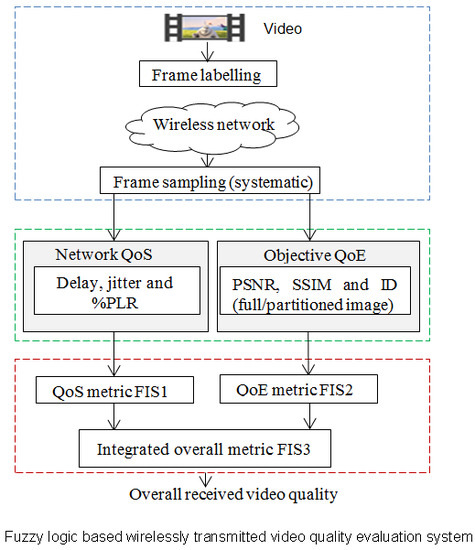
3.2. Mechanism Determining Video Quality
The stages in determining the received video quality are shown in
Figure 3.
Three similarly structured fuzzy inference systems (FIS) performed the required evaluation processes as described in this section. Although the complete video quality evaluation could have been achieved using a single FIS, three separate FIS models were adapted to allow for a modular structure, thus making the design and implementation easier and its operation more transparent.
The first FIS (FIS1) processed the traffic parameters (delay, jitter and %PLR) to indicate QoS. The second FIS (FIS2) processed PSNR, SSIM and ID to indicate QoE. The third FIS (FIS3) combined the outputs from FIS1 and 2 to provide the overall received video quality. The details of the tasks to develop these FIS structures are explained next.
(a) Each transmitted image was labelled by software with an image serial number, starting with 1 and sequentially increasing to the last image. Two very small identical labels were used. The labels were inserted on the top left and right corners of each transmitted image. Its repetition on two corners was to provide an alternative label in case one label became unreadable due to distortion by noise. The labelling was required to allow the received images to be compared with the corresponding transmitted images.
Systematic sampling (a process whereby an image is chosen from the video at a predefined interval) was applied to the received images to reduce their number and thus the processing requirement. The time interval between the selected images was 1 second, i.e., an image was selected every second. This resulted in the reduction of images from 1350 (original number) to 90 (i.e., 1 image from every 15 images was selected). The selected images were compared with the corresponding transmitted images by using the inserted labels.
(b-i) Traffic parameters (packet delay, jitter and %PLR) were measured for the received packets and were processed by FIS1 to determine the network QoS (the development of FIS is explained in a later part).
(b-ii) PSNR, SSIM and ID were determined for the selected received images and their corresponding transmitted (original) images. These were processed by FIS2 the operation of which is explained later. This operation was repeated for the full and petitioned images (the partitioning process is described in
Section 3.4). In order to set up the knowledgebase for the FIS2 that determined QoE, QoE bound needed to be defined. For the video streaming application, good QoE (i.e., QoE > 67%) corresponded to PSNR more than 35, SSIM more than 0.95 and ID less than 0.33. medium QoE (i.e., 33% < QoE ≤ 67%) corresponded to medium QoE parameters (i.e., 25 < PSNR < 35, 0.88 < SSIM ≤ 0.95 and 0.33 ≤ ID < 0.66). Low QoE (i.e., QoE 33%) corresponded to PSNR < 25, SSIM ≤ 0.88 and ID ≥ 0.66. These boundaries conform to the values for PSNR and SSIM in previous studies [
12,
13,
17,
18,
34].
(c) The QoS and QoE values determined from steps (b-i) and (b-ii) were combined in FIS3 to obtain the overall video quality.
3.3. Implementation of FIS1
QoS was determined using FIS1 that received delay, jitter and %PLR. Three membership functions were used to represent each of the three traffic inputs and three membership functions represented the FIS1 output. Nine rules were coded into the FIS1 knowledgebase using a series of If-Then rules. The rules are outlined in
Table 1.
The type of membership function for the input and output for FIS1 was Gaussian as it provided flexibility to represent the measurements. The membership functions’ ranges were chosen based on the International Telecommunication Union (ITU) recommendations for video transmission parameters delay, jitter and %PLR as shown in
Figure 4 [
18]. The membership functions shown in blue, red and green colours represent fuzzy sets of low, medium and high QoS respectively for the parameters considered. Each fuzzy rule was applied to the associated membership functions and the rules’ consequences were mapped to the associated output membership functions. The output membership functions were aggregated and the centroid approach was used to perform de-fuzzification that in turn provided the output of FIS1.
3.4. Implementation of FIS2
FIS2 processed the values for PSNR, SSIM and ID obtained from the transmitted and received images and provided a value between 0 and 1 for QoE. QoE measurements were performed in two approaches. In the first approach, PSNR, SSIM and ID were determined from the whole image. In the second approach, each image was partitioned into four equal parts (top-left, top-right, bottom-left and bottom right) and the values PSNR, SSIM and ID for each part were separately determined and for PSNR and SSIM the smallest and for ID the largest value amongst the four partitions were selected. Four partitions were chosen as a compromise between a higher sensitivity in localizing distortions (that requires a larger number of partitions) and a reduction in overall image distortion estimation (that requires a smaller number of partitions). The approach was aimed at providing greater sensitivity as compared to processing the image intact. The effectiveness of these two approaches in determining QoE was compared. The justification for partitioning the images was to explore whether localized distortions could be better identified and represented.
The inputs to the FIS2, i.e., the PSNR, SSIM and ID were fuzzified using three Gaussian membership functions referred to as low, medium and high. There are shown in blue, red and green in
Figure 5. The output was defuzzified by three membership functions that represented low, medium and high QoE. These membership functions are shown in
Figure 5. The ID results were normalized between 0 and 1 by identifying the highest and lowest values.
The knowledgebase for FIS2 had eleven rules as shown in
Table 2. They mapped the inputs to FIS2 to its output and indicated QoE in form of degrees of memberships belonging to high, medium and low. The rules conformed to the previous related studies [
13,
17,
21,
34,
35].
3.5. Implementation of FIS3
FIS3 combined the QoS and QoE values determined from FIS1 and FIS2 to indicate the overall quality of the received video. The output was in the range of 0 (lowest quality) to 5 (highest quality). The QoS and QoE values were fuzzified using three Gaussian membership functions referred to as low, medium and high. These are shown in blue, red and green plots in
Figure 6.
Five rules were coded in the FIS3 knowledge base. These are shown in
Table 3. These mapped the two inputs to the overall video quality in the form of high, medium and low.
4. Results and Discussion
Figure 7 shows a typical transmitted image with its serial number shown as labels on its top left and right corners.
The PSNR, SSIM and ID were measured for the transmitted and received video images identified through systematic sampling. In some images the distortion only was localized to a specific part of the image. As PSNR, SSIM and ID consider the overall effect of the distortion, localized distortions can become less precisely represented.
Figure 8a,b show the transmitted and received (distorted) images at time 65 seconds. The distortion is visible at the bottom edge of the received image. The PSNR and SSIM from the complete (intact) image were 36.08 dB and 0.999 respectively and ID was 0.48.
The PSNR, SSIM and ID values for each partition were calculated and the minimum values for PSNR and SSIM and the maximum value for ID amongst the four partitions were selected. These represented the worse possible scenarios. The values of PSNR, SSIM and ID for a full image and its partitioned versions are provided in
Table 4. Partitions 1 to 4 represent top left, top right, bottom left and bottom right parts of the image respectively. For
Figure 9, the selected PSNR, SSIM and ID were 28.13 dB, 0.977 and 0.60 respectively.
Figure 10a–c show the traffic measurement plots for delay, jitter and %PLR respectively.
Figure 10d shows the QoS determined by FIS1 for the video UDP/RTP traffic. The increase in delay, jitter and %PLR was facilitated by the NetEm software, which facilitated degradation in QoS. At the beginning of the transmission, QoS was high at 90% until time 7 seconds where QoS decreased to 62% due to an increase in %PLR (
Figure 10c). Curve fitting (4th degree polynomial) was used to indicate the trends for the measures. QoS changed based on the changes in the delay, jitter and %PLR and as defined by the membership functions in
Figure 4. The values correspond to 0%–34% for low QoS, 35%–65% for medium QoS and 66%–100% for high QoS.
Figure 11,
Figure 12 and
Figure 13 show PSNR, SSIM and ID comparing received images (following systematic sampling) with their counter-parts transmitted images. For each figure, (a) is for the full image and (b) for the partitioned image methods.
The PSNR and SSIM were at their peaks at the start of the transmission and they reduced as the magnitudes of the traffic parameters (delay, jitter and %PLR) were increased by using the NetEm software. The ID was close to zero at the beginning of the transmission as received images were very similar to those transmitted but by increasing network parameters delay, jitter and %PLR, the ID increased correspondingly. For evaluations that used complete (not partitioned) images, the results for PSNR, and SSIM were partially related to QoS but at time 80 seconds PSNR and SSIM were high and QoS at the time was low. However, for the evaluations that used partitioned images, PSNR and SSIM values were related to the determined QoS. Even toward the end of transmission between time 80–90 seconds, for the partitioned image approach, PSNR and SSIM had similar behaviour to QoS values. The ID in both cases (i.e., the full image and partitioned image evaluation approaches) was close. In addition, the behaviour of ID was also related to determine QoS. According to the results, the partitioned image approach was more effective in representing the quality of images than the approach that used whole images.
Figure 14a,b shows plots for QoE determined by FIS2 for the full and partitioned images respectively. The partitioned image method represented the video quality more precisely as
Figure 14b relates to the QoS plots in
Figure 10 more closely.
In order to demonstrate the manner the QoS and QoE values related to typical images with various levels of distortions, a number of images and their measurements are provided in
Figure 15. The values were provided for the evaluations that were based on full and partitioned images. The range of both QoS and QoE from 0 (lowest quality) to 1 (highest quality). The partitioning of images into four parts had improved quantification of image distortion and thus more precisely represented the QoE. To illustrate this point,
Figure 15a has a small distortion. The QoE obtained from the full and partitioned images were 0.78 and 0.77 respectively. In
Figure 15d, the image was severely distorted. The QoE obtained from the full image was 0.70 while the QoE obtained for the partitioned image was 0.17 signifying a higher sensitivity for the partitioned method.
Figure 16 shows a plot for the overall video quality assessed by FIS3 using the image partitioning method. Scores 1 to 5 represent lowest to highest quality for the received video respectively.
The quality of the received video was highest during the first 5 seconds and reduced to its lowest toward the end of transmission. This trend correlated well with QoS, QoE and their associated parameters thus indicating the approach had correctly performed the evaluation.
In order to further demonstrate the effectiveness of the devised FIS based video quality evaluation system, a subjective test involving 25 participants was organized whereby they, after watching the transmitted (original) video, scored each received image from 1 (lowest quality) to 5 (highest quality). The duration of the video was 90 seconds, corresponding to 90 images. The distorted video was initially shown to each participant. As scoring of the individual images while the video was being played was not practical, its individual images were shown sequentially using windows photo viewers tool, and once the scoring of an image was achieved, the next image was displayed. The scores where averaged and the resulting mean opinion score (MOS) is shown in
Figure 17. The scoring was based on ITU-T Recommendation P.800 [
25]. This opinion score allocates values from bad to excellent by mapping the quantitative MOS as excellent (5), good (4), fair (3), poor (2) and bad (1). A comparison of
Figure 16 (from FIS3, objective test) and 17 (MOS, subjective test) show that they had a similar quality trend over time. There were however few differences, for example from 80 to 90 seconds, the subjective test indicated video quality from 1.4 to 2.2, which was higher than the objective test that indicated video quality close to 1. These differences were related to variations in the participants’ perceptions of the quality of the individual images.
In order to have an independent comparison of the results from this study, a recently reported image and video quality assessment reported in [
31] was chosen. The authors in that study used a video quality assessment that was termed as the spatial efficient entropic differencing quality assessment (SpEED-QA). This assessment method is an efficient natural scene statistics-based model that applies local entropic differencing between the tests and reference data in the spatial domain [
31]. They reported that SpEED-QA had a highly competitive performance against other objective image video quality assessment methods. SpEED-QA was calculated by first determining the conditional block entropies of the reference and distorted images. The differences between the entropies of the corresponding blocks were then obtained and averaged for all blocks [
31]. A single scale (SPDss) and multiscale version of SpEED were reported in [
31].
Figure 18 shows the plot SPDss measure for the video used in our study. The multiscale plot looked similar to the single scale and thus is not shown.
The red graph through the plot shows its trend obtained by a 4
th order polynomial. A relationship can be observed when comparing the trends in
Figure 18 and those in
Figure 14b (i.e., FIS2 output that was generated from PSNR, SSIM and ID) and the overall video quality obtained by FIS3 (that integrated PSNR, SSIM and ID with delay, jitter and %PLR) shown in
Figure 16. In
Figure 14b and
Figure 16, larger values represent higher quality but in
Figure 18 lowest values represent higher quality, thus, the trends are inverted. In
Figure 14b and
Figure 16, the images corresponding to times at 30 and 59 seconds had very low quality as indicated by a drop in the plot. The corresponding images in
Figure 18 had also low quality as indicated by a large increase in the plot. The images corresponding to the time between 85 and 90 seconds had the lowest quality in
Figure 16. These images provided the lowest QoS as indicated in
Figure 10d. However, the corresponding images when assessed using SPSss did not have the lowest quality. This signifies an advantage of the FIS method reported in this paper that integrates QoE and QoS to provide an overall measure.
In order to further compare SPDss and FIS methods, the values of PSNR, SSIM, ID, SPDss, FIS2 output and FIS3 output are tabulated in
Table 5 for images corresponding to 1 s and then every 10 s.
Figure 19a,b shows plots of FIS3 output (overall video quality) and SPDss against PSNR respectively. PSNR was used as it was a more sensitive measure for qualifying video quality as compared with SSIM and ID. FIS3 shows a closer correlation to PSNR than SPDss. The correlation is indicated in the figures by the coefficient of determination (R
2) obtained from the best fit through the data points. The values of R
2 were 0.945 and 0.623 for
Figure 19a,b respectively. R
2 indicates the proportionate amount of variation in FIS3 output and SPDss in response to PSNR. Larger values of R
2 explain a greater variability in the linear regression model.
Figure 19c shows a plot of FIS3 output against SPDss. The two were closely related at high quality images. For very low quality images, FIST3 graded them as 1 but SPDss had different measures for them (i.e., SPDss values = 30, 40 and 50) therefore the relationship between the two methods for these images was not as obvious as for the higher quality images.
The described results were for a typical video chosen carefully to be a good representative from the points of richness of its contents and variability of information in successive frames. This video had also been used in a number of other related studies due to its suitability. The evaluations however could be further extended to considering multiple videos.
In this study systematic sampling was used, however a more traffic and video content aware sampling method might make the process more optimal thus further reducing the computational load and might improve the evaluation accuracy. In this study a video was wirelessly transmitted, however different multimedia applications have their own specific QoS and QoE requirements. These requirements need to be adapted into the knowledgebase of the FIS for quality of their transmission to be determined.
This study devised and evaluated a modular fuzzy logic system to assess the quality of video transmitted over a wireless network. Developments in this area can help both the network users and network service providers and assist in improving multimedia communication. The merits of the proposed approach were:
Modular design in determining QoS, QoE and combining the two measures to a single video quality value. This modular approach made the evaluations more transparent in operation and possible future updates easier to realize.
The use of FIS enabled mapping of the traffic parameters (delay, jitter and packet loss ratio) to QoS and similarly mapping of user’s perception (based on peak signal to noise ratio, structural similarity index and image difference) to QoE to be carried in an effective and flexible manner.
Adaptation of image partitioning proved valuable in determining QoE and made its calculation more accurate.
Inclusion of a subjective test to obtain MOS provided a further demonstration of the method’s efficacy.


