1. Introduction
For a product operating under variable conditions, a variable stress-strain response is observed in every point of the product [
1]. If either high loads or raised temperature occur during the operation of the product, then the yield strength of the material could be exceeded and a non-linear stress-strain response can be expected [
1,
2,
3]. When the stress-strain response of a loaded product is simulated by, for example, the finite element method, or damage predictions are performed for such a product, results of uniaxial cyclic tests are usually required to determine the parameters of either the material or the damage model [
4]. However, modest fluctuations of the parameter values can considerably affect the stress-strain simulations and damage predictions [
5]. Hence, it is important to avoid any external influences during the experimental part of the procedure. The dissipated energy, as a measure of the damage, can also be determined from the experimental results of the uniaxial cyclic tests [
6].
Uniaxial cyclic tests can be carried out on either electro-mechanical or servo-hydraulic test rigs, which provide an experimental information on the cyclic properties of the material under investigation. Cyclic tests can consist of loads with constant amplitudes, a stepwise form of loads, or a series of loads with random amplitudes [
7,
8]. Round or flat specimens can be used for such tests, having either a standard or a non-standard form. The expected operating range of the material should be covered in the cyclic tests; for example, if a sheet-metal will be exposed to an equivalent strain of 1.5% during the operation, the cyclic curve should describe the stress-strain relation for such a range. This includes both positive and negative strains. If a different behaviour is expected in tension and compression, the determination of the cyclic stress-strain curve on the whole range is even more important. However, especially for flat, non-standard specimens, it is difficult to reach beyond the critical buckling force without buckling of the specimen, which typically occurs at fairly small values of strain.
An anti-buckling support can, therefore, be attached to the test rig which prevents the buckling of the specimen [
9,
10,
11,
12]. In turn, friction between the specimen and the anti-buckling support occurs, which then affects the measured stress signal on the test rig. To evaluate the influence of friction, a friction sensor can be placed under the anti-buckling support; the friction force is, then, measured throughout the cyclic test, as depicted in
Figure 1. For the details of this method, the reader is referred to [
13]. Here, we present the application of the method to an incremental step test and a test with variable amplitudes.
2. Materials and Methods
Two materials were subjected to cyclic tests during this research, an aluminium alloy (AlMgSi0.5) and a biodegradable polylactide (PLA). Details on the materials can be found in [
14,
15]. The aluminium alloy AlMgSi0.5 has been widely used, especially in the automotive industry, as it enables extrusions of complex shapes due to good formative properties (i.e., high deformability) [
16]. PLA have also been extensively used in various fields, from food packaging to interior design in the automotive industry. Due to their biocompatibility and biodegradability, which have led to applications in medical science and biotechnology, polylactides have been of significant research interest [
15]. The PLA tested during this study is typically used for 3D printing.
A 100 kN MTS test rig was used to perform the cyclic tests (
Figure 2). First, incremental cyclic tests between 0.001 mm/mm and 0.015 mm/mm of strain were performed and, then, variable load histories were applied to the flat non-standard specimens of 2 mm thickness and 30 mm gauge length for the Al alloy and 3 mm thickness and 30 mm gauge length for the PLA. An anti-buckling support was mounted to prevent the buckling of the specimens. It was placed on the friction sensors (
Figure 1). The friction force between the specimen and the anti-buckling support was measured throughout the tests.
The friction force measurements converted into stress due to friction
were calculated as
where
F,
,
a, and
b represent the force measured at the test rig, the friction coefficient between the PTFE foil and the specimen, the thickness, and the width of the specimen, respectively.
Afterwards, the signals from the test rig and the friction sensor were correlated as
where
stands for the delay between the measured stress at the test rig and measured stress due to the friction force. The friction influence was subtracted from the measured stress signal.
3. Results
Flat specimens of both materials (
Figure 1) were subjected to the loading histories presented in
Figure 2.
The stress due to the friction is depicted in
Figure 3 for the incremental step tests and in
Figure 4 for the variable amplitude histories.
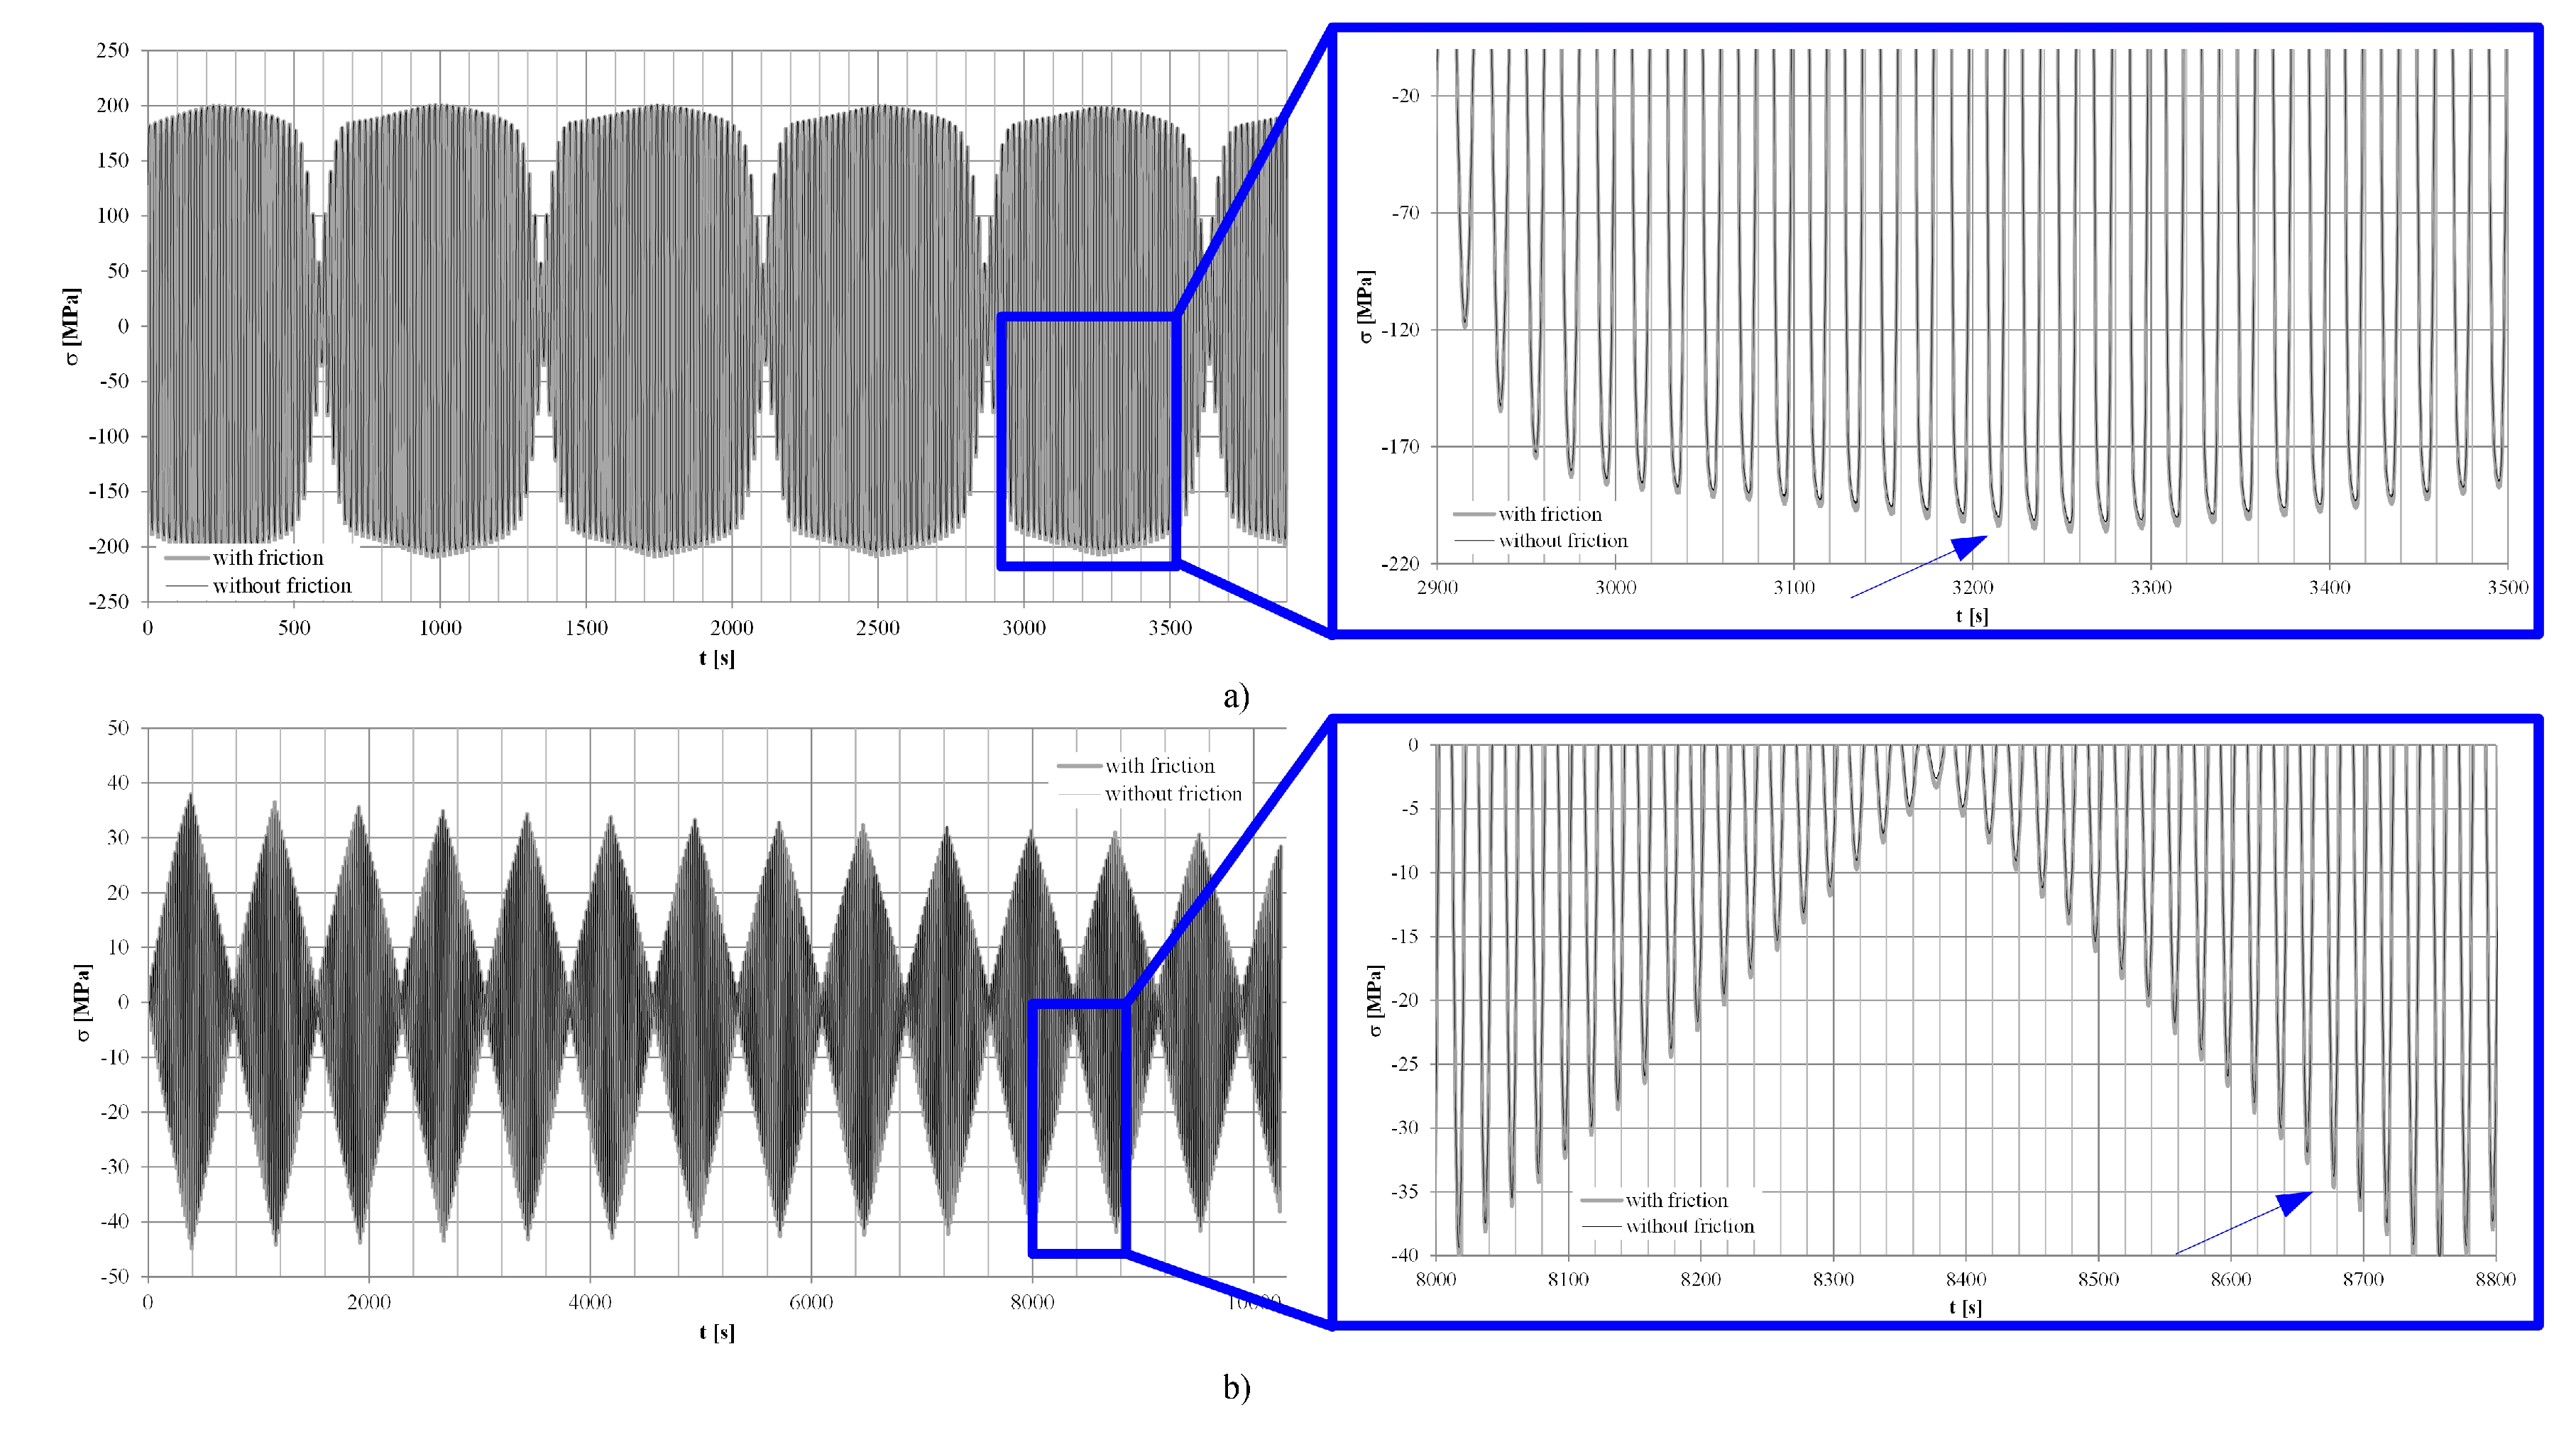
The differences in measured and corrected signals are shown in
Figure 5 for the incremental step tests and in
Figure 6 for the variable amplitude histories.
Finally, the stress-strain responses are depicted in
Figure 7 for the incremental step tests and in
Figure 8 for the variable amplitude histories.
4. Discussion
Initially, it can be seen (in
Figure 3 and
Figure 4) that the stress due to friction reached up to 5 MPa in the case of the aluminium alloy and up to 4 MPa in the case of the PLA. Although the friction influence was not considerable, its evaluation is crucial to assure that the true stress-strain response of the material was measured without the consideration of the environmental influences at the test. A closer look at the friction influence can be observed from
Figure 9: It corresponds to the incremental step test times of the Al alloy AlMgSi0.5 between 3200–3260 s (also enlarged in
Figure 5a). It can be noticed that an increasing occurrence of the stress due to the friction depended on the stress signal when it crossed the zero value. This is marked with the dotted thin vertical lines in
Figure 9a. Furthermore, the stress due to friction consisted of static and dynamic parts. The dynamic parts reached their maximum at compressive reversal points, marked with the dotted thick vertical lines in
Figure 9a. At the reversal points, the coefficient of friction changed from dynamic to static; therefore, an increase of the stress due to the friction was observed before it started decreasing, during the tensile part of the loading. The increase of the stress due to friction after the compressive reversal point is shown in
Figure 9a, above the horizontal dotted line. The same course of events was detected also in the case of the PLA.
Although it could be argued that the absolute values of stress change due to friction were small, a noticeable difference in the plot of the stress-strain paths was already obtained (
Figure 9b). In the case of the PLA, 1.5 MPa was averagely observed at the reversal points, representing up to 3% of the maximal obtained absolute stress values observed in the test (
Figure 5,
Figure 6,
Figure 7 and
Figure 8). For the aluminium alloy, a noticeable difference between the cyclic curves can be noticed due to the ductile stress-strain response, although the absolute values of the stress due to friction were not considerable (
Figure 7 and
Figure 8). The values of the friction force were low, due to the PTFE foil placed between the specimen and the anti-buckling support. For other values of the friction coefficient, other values of the stress due to friction would have been observed; that is, if a foil made of another material was placed between the anti-buckling support and the specimen, or if the specimen was directly placed onto to the anti-buckling support. Hence, it is important to measure the values of the friction force throughout the test to ensure that the observed stress values indeed originate from the material response.
During the incremental step test, the critical buckling force was already exceeded during the first load amplitude of 0.001 mm/mm. This can be assumed, as the friction force was detected throughout the test (
Figure 5). Similarly, for small random cycles, the critical buckling force of the specimen was exceeded. This can be seen for variable loading of the aluminium alloy, at around 500 s in
Figure 4, where the friction force rose above 1 MPa, although strain amplitudes of less than 0.005 mm/mm were applied to the specimen. Negative force, which can be detected on the friction sensor, is a consequence of the initial mounting of the anti-buckling support. Namely, the anti-buckling support is mounted onto the test rig using a set of springs, so that the anti-buckling support cannot freely move along the specimen during the test. As the mounting of the springs can cause an initial force on the friction sensor before calibration, a negative force on the sensor can be detected if the anti-buckling support is dragged away from the friction sensor by the specimen during the tensile part of the loading.
Dissipated energy is often used as a measure for fatigue damage predictions. For an accurate determination of the dissipated energy, it is therefore crucial to consider only the stress-strain response of the material; otherwise, erroneous damage predictions could be expected. Especially for ductile metals with a lower elastic modulus, such as the aluminium alloy AlMgSi0.5, the measurement of the friction force during the cyclic tests is important, as the stress contribution due to the friction force compared to the absolute stress value observed at the test rig is higher than that of ductile materials with a higher elastic modulus such as, for example, steel. Elastic energy can also be used for fatigue damage predictions of brittle materials, such as PLA. Even in this case, it is important to acknowledge the stress values of the material response only, as erroneous damage predictions may be obtained otherwise.


