Article

Mapping Acoustic Frictional Properties of Self-Lubricating Epoxy-Coated Bearing Steel with Acoustic Emissions during Friction Test

by
Venkatasubramanian Krishnamoorthy
1,
Ashvita Anitha John
2,
Shubrajit Bhaumik
2,* and
Viorel Paleu
3
1
Department of Electronics and Communication Engineering, Amrita School of Engineering, Amrita Vishwa Vidyapeetham, Vengal, Chennai 601103, India
2
Tribology and Interactive Surfaces Research Laboratory (TRISUL), Department of Mechanical Engineering, Amrita School of Engineering, Amrita Vishwa Vidyapeetham, Vengal, Chennai 601103, India
3
Mechanical Engineering, Mechatronics and Robotics Department (I.M.M.R.), “Gheorghe Asachi” Technical University of Iași, 43 Prof. Dimitrie Mangeron Blvd, 700050 Iași, Romania
*
Author to whom correspondence should be addressed.
Technologies 2024, 12(3), 30; https://doi.org/10.3390/technologies12030030
Submission received: 17 December 2023 / Revised: 8 February 2024 / Accepted: 21 February 2024 / Published: 24 February 2024
(This article belongs to the Section Manufacturing Technology)

Abstract

:
This work investigates the stick–slip phenomenon during sliding motion between solid lubricant-impregnated epoxy polymer-coated steel bars and AISI 52,100 steel balls. An acoustic sensor detected the stick–slip phenomenon during the tribo-pair interaction. The wear characteristics of the workpiece coated with different epoxy coatings were observed and scrutinized. The RMS values of the acoustic sensor were correlated with the frictional coefficient to develop a standard based on the acoustic sensor, leading to the detection of the stick–slip phenomenon. As per the findings, the acoustic waveform remained relatively similar to the friction coefficient observed during the study and can be used effectively in detecting the stick–slip phenomenon between steel and polymer interaction. This work will be highly beneficial in industrial and automotive applications with a significant interaction of polymer and steel surfaces.

1. Introduction

The application of polymers is crucial in tribology research due to their dynamic contact, including adhesion and deformation between the surfaces [1]. Stick–slip is an intermittent motion that consists of a stationary phase and a sliding phase and occurs in equipment such as microdrives [2], geoscience [3], dental [4], and mechanical systems [5]. Stick–slip motion is known for its tendency to cause increased wear in polymer materials [6]. The efficient and safe operation of high-value and complex equipment is crucial for energy and resource conservation. The need for complete in-operation sensing and faster data interpretation has led to advanced tools being necessary for assessing machine status and detecting degradation earlier [7]. Effective condition monitoring techniques are essential for efficient and reliable operation. Choosing reliable maintenance strategies minimizes system failure and enhances machine performance [8]. Offline techniques, like visual or high-end microscope devices, require disassembly and reassembly, causing time loss and potential damage. For decades, tribo-sensing and condition monitoring have been utilized in various industries. However, it was not until the 1990s that artificial intelligence (AI) techniques were introduced, resulting in significant advancements in signal manipulation [9], lubricant technology [10,11,12,13], composites [14,15], etc. Today, the resurgence of AI and machine learning (ML) has sparked new research on using ML for intelligent fault detection and diagnosis. The numerical modeling of interfaces, combined with tribo-sensing, which monitors wear, friction, and lubrication in tribological systems using sensors, is leading the way toward tribology digitalization in the future [16]. There are two methods for monitoring wear: direct and indirect [17]. The direct method involves optical and electrical measurements. For example, a scanning electron microscope is used in the optical technique to analyze wear scar topology [18]. The indirect technique includes monitoring wear through techniques such as acoustic emission (AE), vibrations [19], and electrostatic sensors [20]. AE is a widely used non-destructive technique that requires only minimal machine installation. Acoustic emission (AE) systems detect minor material changes and wear events, allowing for crack growth, slip, and debris accumulation analysis. Sensors integrated with machine learning algorithms minimize the requirement for offline inspection and continuous wear progression monitoring [21,22].
Many studies have previously used acoustic signals to monitor the wear of grinding wheels [23,24,25,26], ball-on-flat sliding contact [27], stick–slip [28], bearings [29], gearboxes [30], mill-grinding tools [31], and tools [32]. AE data extraction methods include fast Fourier transforms (FFT) [24], short-time Fourier transforms (STFT) [25], wavelet transform (WT) [26], amplitude [28], AE count [33], spectral kurtosis [29], and root mean square (RMS) [34], which are used to correlate tribological parameters with acoustic signals. RMS is the most often used AE parameter to correlate wear and friction with the acoustic signal [35,36]. The amplitude of instantaneous RMS varies with COF and is influenced by applied stress, velocity, and sliding component mechanical properties, which may also be directly correlated with wear volume and wear rate [37,38]. Acoustic emission has been widely applied in many tribo systems, for example, acoustic emission has been used to monitor wear in self-lubricating composite bearing liners used in aerospace systems [39]. Geng et.al. [37] correlated the acoustic emission signal parameters, such as power, RMS amplitude, mean frequency, and energy, with tribological parameters under dry sliding conditions and reported that AE frequency reflected the wear behavior with high intensity. Additionally, from the AE signal, the extension of the frequency crest appears to be linked to increased wear. Twardowski et. al. [40] studied the prediction of tool wear using acoustic emission signals and machine learning techniques. Based on AE signals, the decision tree approach was utilized to evaluate the milling cutter’s degree of wear and the estimated tool condition error was <6%. Taura et.al. [41] studied the stick–slip motion between a steel plate and brass ball under sliding conditions using the AE signal and correlated it with the tribological parameters at various speeds and reported that AE signals were dependent on sliding speeds and increased during the slip. Additionally, they noted that the signals were proportional to the level of friction. Shanbhag et.al. [42] studied an AE-based technique for the condition monitoring of hydraulic cylinders to detect multiple component faults, which involved bandpass filtering, and reported that AE-based condition monitoring was effective in detecting fluid leakage stages and bearing and piston rod seal degradation. Hase et al. [43] investigated the wear state of material under sliding friction conditions using a pin-on-disk-type sliding friction tester in the presence of an electric current using the acoustic emission frequency spectrum. Maia et al. [44] investigated the wear of an AlCrN-coated and uncoated cemented carbide cutting tool during the turning of hardened AISI 4340 steel using acoustic emission and found that the tool wear and tool wear mechanism was correlated with the acoustic emission signal spectrum using the power spectrum density method and auto-covariance method.
This work aims to detect the presence of the stick–slip phenomenon in the interaction between solid lubricant-reinforced polymer-coated steel (LY556) and plain steel under sliding conditions at different speeds. The usage of such a technique would highly be beneficial for applications such as coated spline shafts and tie-rods in automobiles where there is an interaction between a polymer coating and steel. To the best of the authors’ knowledge, no work has been reported on detecting the stick–slip phenomenon of a semi-liquid cured LY556 epoxy coating on bearing steel (EN31) using an acoustic emission technique. LY556 is a bisphenol-A type of phenolic resin that is widely used for coating applications due to its superior thermo-mechanical properties, excellent adhesion, chemical inertness, and wear resistivity [45]. These phenolic resins are present in various sliding applications where human access is challenging, and detecting sliding wear poses difficulty through conventional friction graphs. Moreover, it is easier to identify friction in the absence of lubricants, as sound tends to be more pronounced in dry conditions. However, in situations where the coatings incorporate solid lubricants, detecting acoustics and correlating them with the generated coefficient of friction (COF) becomes a challenging task.
The primary objective of this work was to determine the correlation between the acoustic signal produced during friction between a mating pair of a self-lubricating epoxy coating and a steel surface. The work is centered on absorbing the sound waves produced during the tribo-test of a self-lubricating epoxy coating and mapping them in correlation with the COF. The root mean square (RMS) of the acoustic signal was correlated with the coefficient of friction generated during the tribo-pair interaction. The average acoustic amplitude of all the samples at different speeds was interconnected with the average coefficient of friction. The present work shows that AE emissions can be used effectively to understand the frictional properties of coated surfaces.

2. Experiments

2.1. Materials

Epoxy polymer (Araldite LY 556) cured with hardener (Aradur HY 951) was used as the base coating material on EN 8 steel rectangular-shaped bars (50 mm × 20 mm × 10 mm). EN31 steel balls (Φ12.7 mm) were used as the counterpart in a tribology test. The average hardness of the as-received bars was 88.667 ± 1.1547 HRB. The steel bars were coated with the cured epoxy. The cured epoxy coating was also reinforced with micro-sized solid lubricants in various weight percentages (graphite, hexagonal boron nitride, and talc). The solid lubricants graphite, hexagonal boron nitride, and talc have been chosen due to their lubricating properties [46,47,48]. 2-Ethoxyethanol and toluene were dispersed evenly the coating on the steel bars. All materials were bought from local vendors in Chennai, India. Table 1 shows the compositions of the EN 8 and EN 31 steels used in this work.

2.2. Coating the Steel Bars with Self-Lubricating Coatings

A hybrid solid self-lubricating coating containing three different solid lubricants, namely graphite, hexagonal boron nitride, and talc, in an epoxy matrix (LY556) was prepared. Kadhim et al. [49] added solid lubricants (ceramic carbide filler, 5%, 10%, 15%) by weight percentage in a bisphenol A-based epoxy matrix and investigated their tribological properties. In this work, too, solid lubricants with different weight percentages (5, 10, 7.5, 15 wt%) were added and dispersed ultrasonically for 10 min. Epoxy resin was hydroxylated with 10 wt% of 2-ethoxyethanol and mixed with 10 wt% of toluene. Table 2 shows the contents of different solid lubricants in each coating. A curing agent was mixed with the above epoxy mixture at a ratio of 100:10 at 50 rpm. To obtain a homogenous mixture, the slurry mixture was mixed using a mechanical stirrer for 30 min. A dip-coating process was utilized to apply the coating on the surface of the substrate (EN8 steel bars). The EN8 steel bars were dipped twice for 5 s, taken out to drain the excess coating, and spread over the surface of the substrate. The coated samples were cured at room temperature for 3 days and at 60 °C for 120 min. The average thickness of the coatings was found to be 19.66 ± 3 µm. Figure 1 shows the different kinds of coatings used in the present work.

2.3. Measuring the Schallamach Waves and Wear

A reciprocating tribometer (make: Magnum Engineers, Bengaluru, India, model No. RCP01) was used to determine the sliding wear of the coated bars. Each test was conducted for 60 min at spindle speeds of 1 Hz, 2 Hz, 3 Hz, and 4 Hz with 10 N loads and a constant stroke length of 15 mm at room temperature. A sound sensor (make: SeedStudio Groove, Chennai, India) was mounted on the base plate near the coated substrate to track the acoustic emission, which was later used for analysis. Table 3 shows the experimental conditions for this present work. The experiments were conducted twice, and the average COF and specific wear rate are reported in this present work. Figure 2 shows the schematic and experimental setup used in the present work.

2.4. Absorbance of Sound during the Tribo Test Using an Acoustic Sensor

During the experiment, a sound sensor was utilized to capture the acoustic signal caused by friction and wear. The sensor has a sensitivity of −60~−56 dBV/Pa, operates at 5 V, and can detect converted acoustic signals in the range of 0 to 5 V, digitally varying from 0 to 1023. The acoustic sensor has an inbuilt audio amplifier based on the LM386 by Texas Instruments, Dallas, TX, USA. The microphone output was connected to the audio amplifier circuit, as shown in Figure 3.
In the amplifier circuit, pins 1 and 8 were left open to use a default gain of 20. This gain was good enough to capture the sound of the 2 metals making contact with one another. Any gain higher than this introduced unnecessary noise or amplified the ambient noise.
A 100 µF capacitor between pin 7 and the ground was used to prevent any power supply noise from being amplified. In the circuit (Figure 3), a 100 nF capacitor was used for filtering out high-frequency noise, and a 1000 µF capacitor was used to filter and smoothen out ripples. The audio circuit was powered, and the output was fed to a spectrum analyzer. A variable input sinusoid with a frequency varying between 20 Hz and 20 KHz was fed, and the device was found to have a total harmonic distortion (THD) of 1.7%. For the given application, this THD was a good number to start with.
The acoustic sensor was connected to an Arduino microcontroller using an inbuilt 10-bit analog-to-digital converter (ADC) and powered using an onboard 5 V supply. The experiment was carried out for an hour, and the digital output of the ADC was converted to analog voltage using Equation (1).
A n a l o g   V o l t a g e   V = D i g i t a l   V a l u e × 5 1023
where 5 V is the reference voltage provided to the ADC, and since it was a 10-bit ADC, the resolution of the ADC was 210 = 1024.
Before the test, the acoustic sensor was switched on for one minute. This was carried out to capture the baseline noise, including other electrical appliances running in the environment, people walking nearby, and other miscellaneous sounds produced near the testing setup. The connectivity between the acoustic sensor and the Arduino is shown in Figure 4a. The data from the Arduino were sent to a PC via a USB port and read at a 9600 baud rate. To estimate the error induced by the ambient noise, the ambient noise was recorded for 60 s (Figure 4b), and the results indicate no significant noise level from the surroundings. The post-processing of the acoustic signal insured that the influence of the noise was completely removed from the acquired frictional noise.

2.5. Preprocessing the Data

To reduce the influence of ambient noise, the mean of the first minute of data was subtracted from the entire 60 min of experimental data. This ensured that only the noise generated by friction was recorded by the microphone. Once the mean was subtracted, the sensor values were normalized to bring it to the same scale as that of the coefficient of friction 0 to 1, This was carried out by dividing the sensor values by the maximum of the sensor value. Normalization was carried out to compare the levels of the COF and the acoustic sensor mapped, i.e., the maximum, the minimum, and the range of COF vs. the maximum of the acoustic sensor. Based on this, a mapping between the COF and the acoustic sensor’s value was generated to standardize the acoustic sensor’s value in terms of the COF.
N o r m a l i z e d   s e n s o r   v a l u e = s e n s o r   v a l u e   m a x i m u m   s e n s o r   v a l u e

2.6. Surface Characterization of the Coated Specimen

The width of the wear scar on the coated surface was measured using an optical microscope (make: Olympus, Tokyo, Japan, model: BX53M). The surface morphology and surface roughness of the worn surface were analyzed using a non-contact surface roughness tester (make: Taylor Hobson, model: Talysurf CCI Lite, Leicester, UK). The specific wear rate of the coated bars was calculated using the Archard equation [50].
S p e c i f i c   w e a r   r a t e = V o l u m e t r i c   l o s s S l i d i n g   d i s t a n c e × N o r m a l   L o a d

3. Results and Discussion

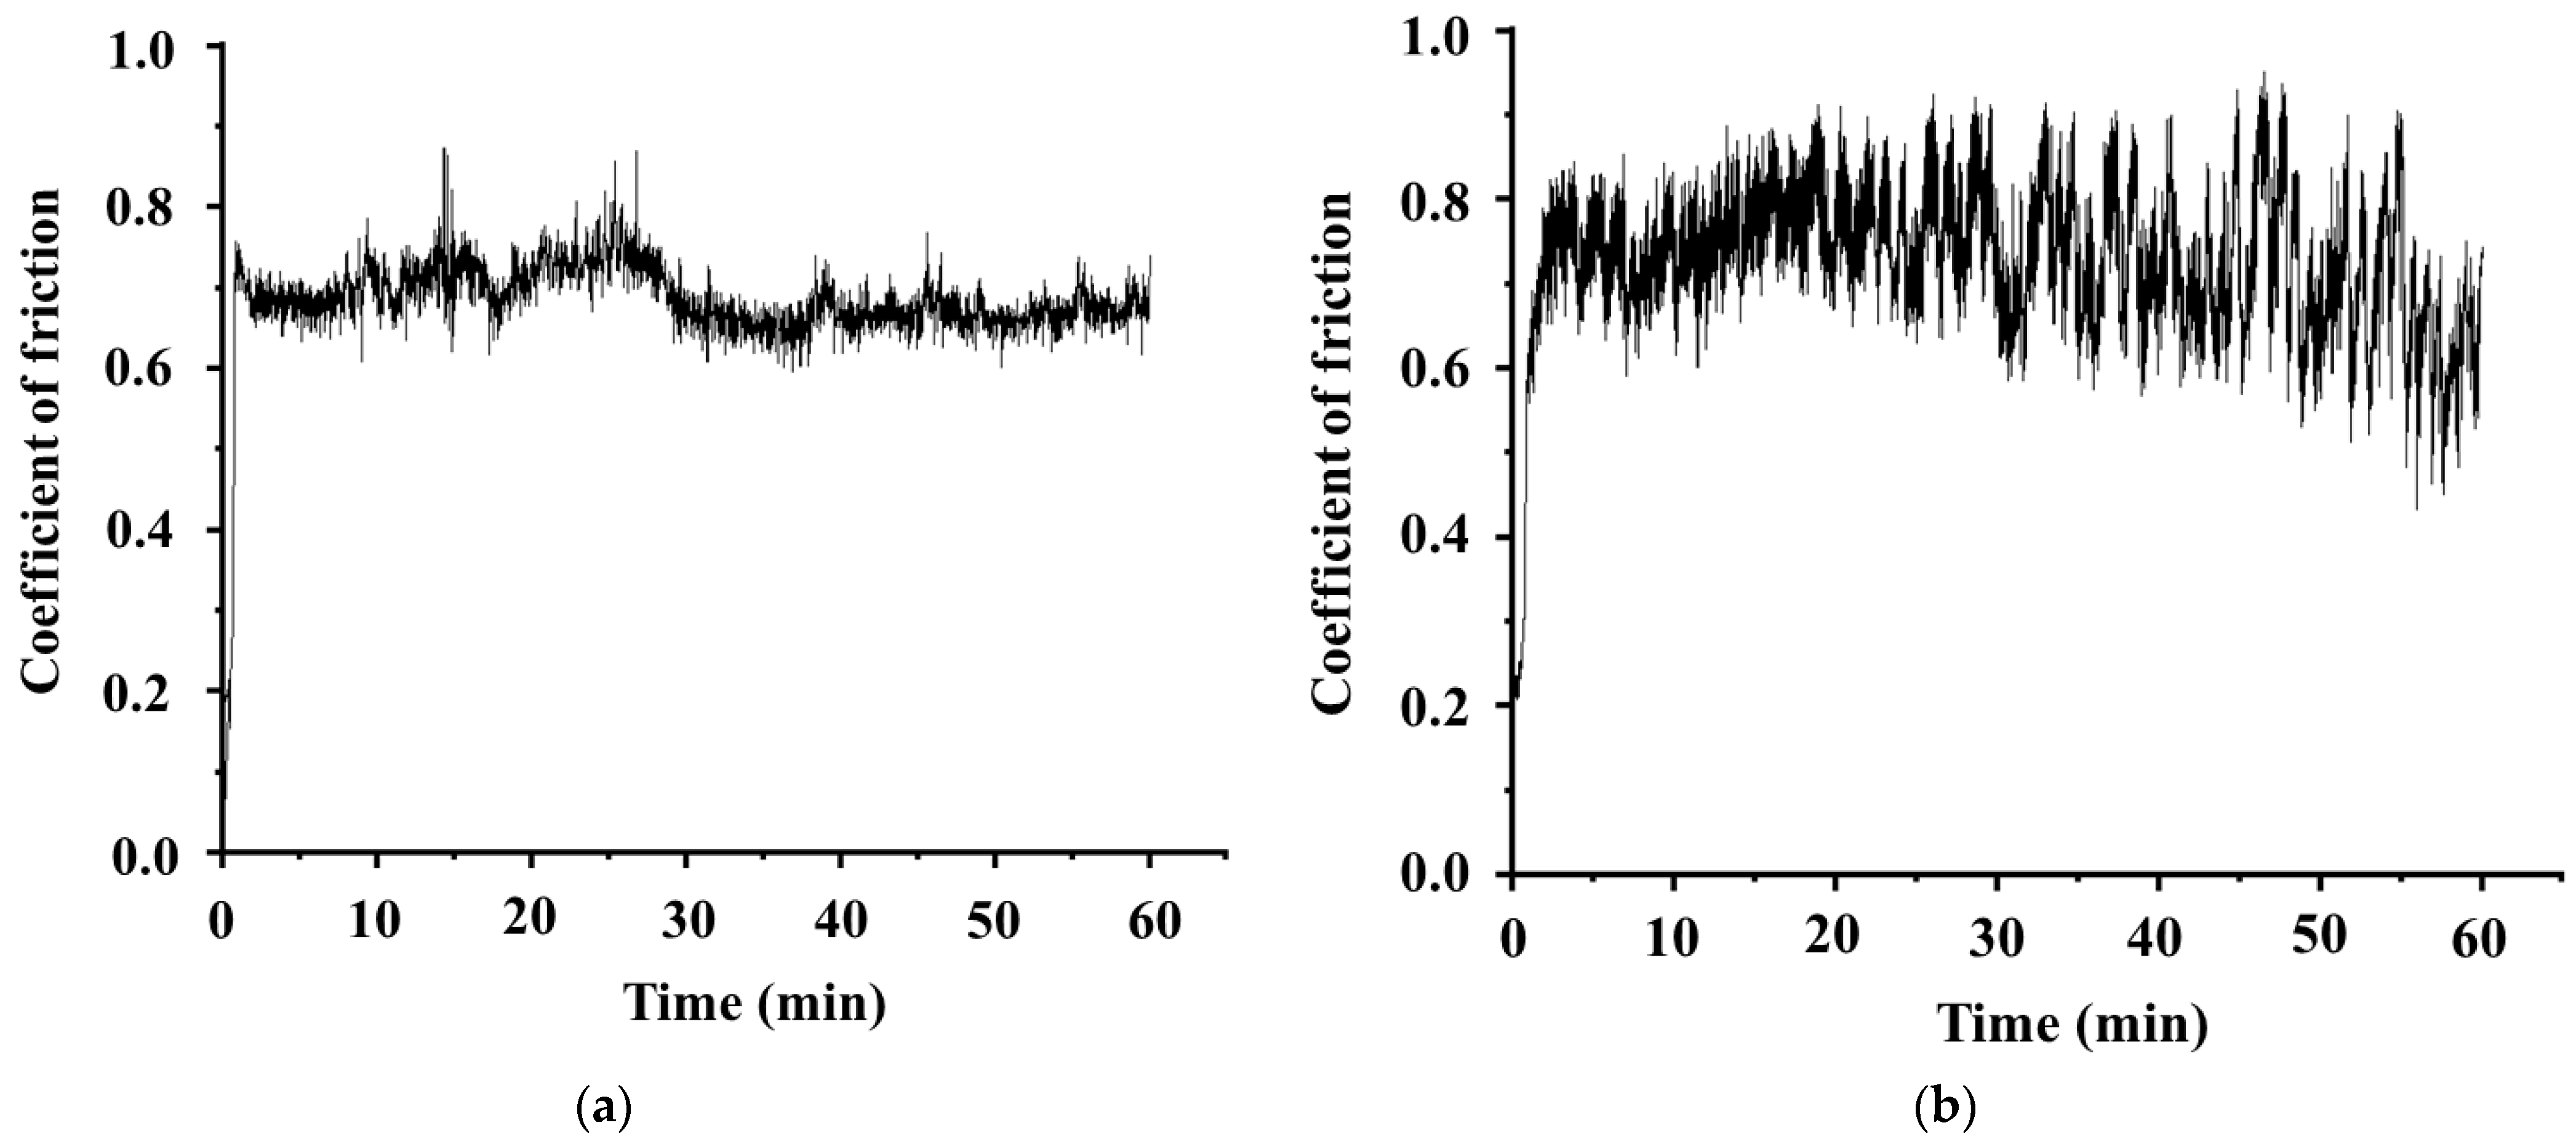
3.1. Measuring Coefficient of Friction and Stick–Slip Using a Reciprocating Tribometer

Figure 5 shows the coefficient of friction variation for the obtained results with a 10 N load at four different spindle speeds: 1 Hz, 2 Hz, 3 Hz, and 4 Hz. The steel ball against the polymer-coated flat surface exhibited sudden crests and troughs in the COF variation, indicating the presence of the stick–slip phenomenon at the Hertzian contact. Similar observations of crests and troughs due to the stick–slip phenomena were reported earlier [51].
The variation in the COF was due to the composition of the coating and also the sliding speed of the steel ball. It was reported earlier that when a polymer slides on steel, there is a high chance of the stick–slip phenomenon [52]. Similarly, in the present work, the adhesion (stick) of the ball onto the surface of the polymer coating led to a sudden increase in the static coefficient of friction (Figure 5). When stress reached the critical value, the ball slid, resulting in a kinetic coefficient of friction. The highest points shown in Figure 5 indicate the maximum static friction coefficient (µs), and the lowest points indicate the kinetic coefficient (µk) for the duration. The stick–slip phenomenon was analyzed for each sample, and the amplitude of the stick–slip (Table 4) was calculated using Equation (4) [28]
A m p l i t u d e   o f   s t i c k   s l i p ,   µ * = µ s µ k 2
where µ s is the maximum static coefficent of friction read during the test, and µ k is the minimum kinetic coefficent of friction read during the test.
In Table 4, it can be seen that C3 exhibited the maximum amplitude of stick–slip, followed by C2, C1, and C4, respectively. Careful observation of the data generated during the tribo-test indicates that the maximum frictional force (11.2936 N) generated in the case of the C3 sample was higher than the applied load (10 N). This indicates that the sample experienced more stick–slip phenomenon during the process, which resulted in high wear and deep grooves, as indicated in Section 3.4. It should be noted that the COFs exhibited by C3 and C4 were lower than those of C1 and C2, which may have been due to the several non-contact positions between the two mating pairs (steel ball and the coating) due to deep grooves. Also, the friction tended to reduce at higher speeds. The design of experiments (DOE) protocol was not adhered to in this study, as the primary objective was to assess the feasibility of a cost-effective solution utilizing an Arduino microcontroller equipped with a built-in 10-bit analog-to-digital converter (ADC) and an acoustic sensor. The aim was to capture the acoustic signals generated in self-lubricating coatings with varying concentrations of solid lubricants. Furthermore, the study sought to establish a correlation between the recorded acoustic signals and the friction coefficient throughout the intricate processes of friction and wear.

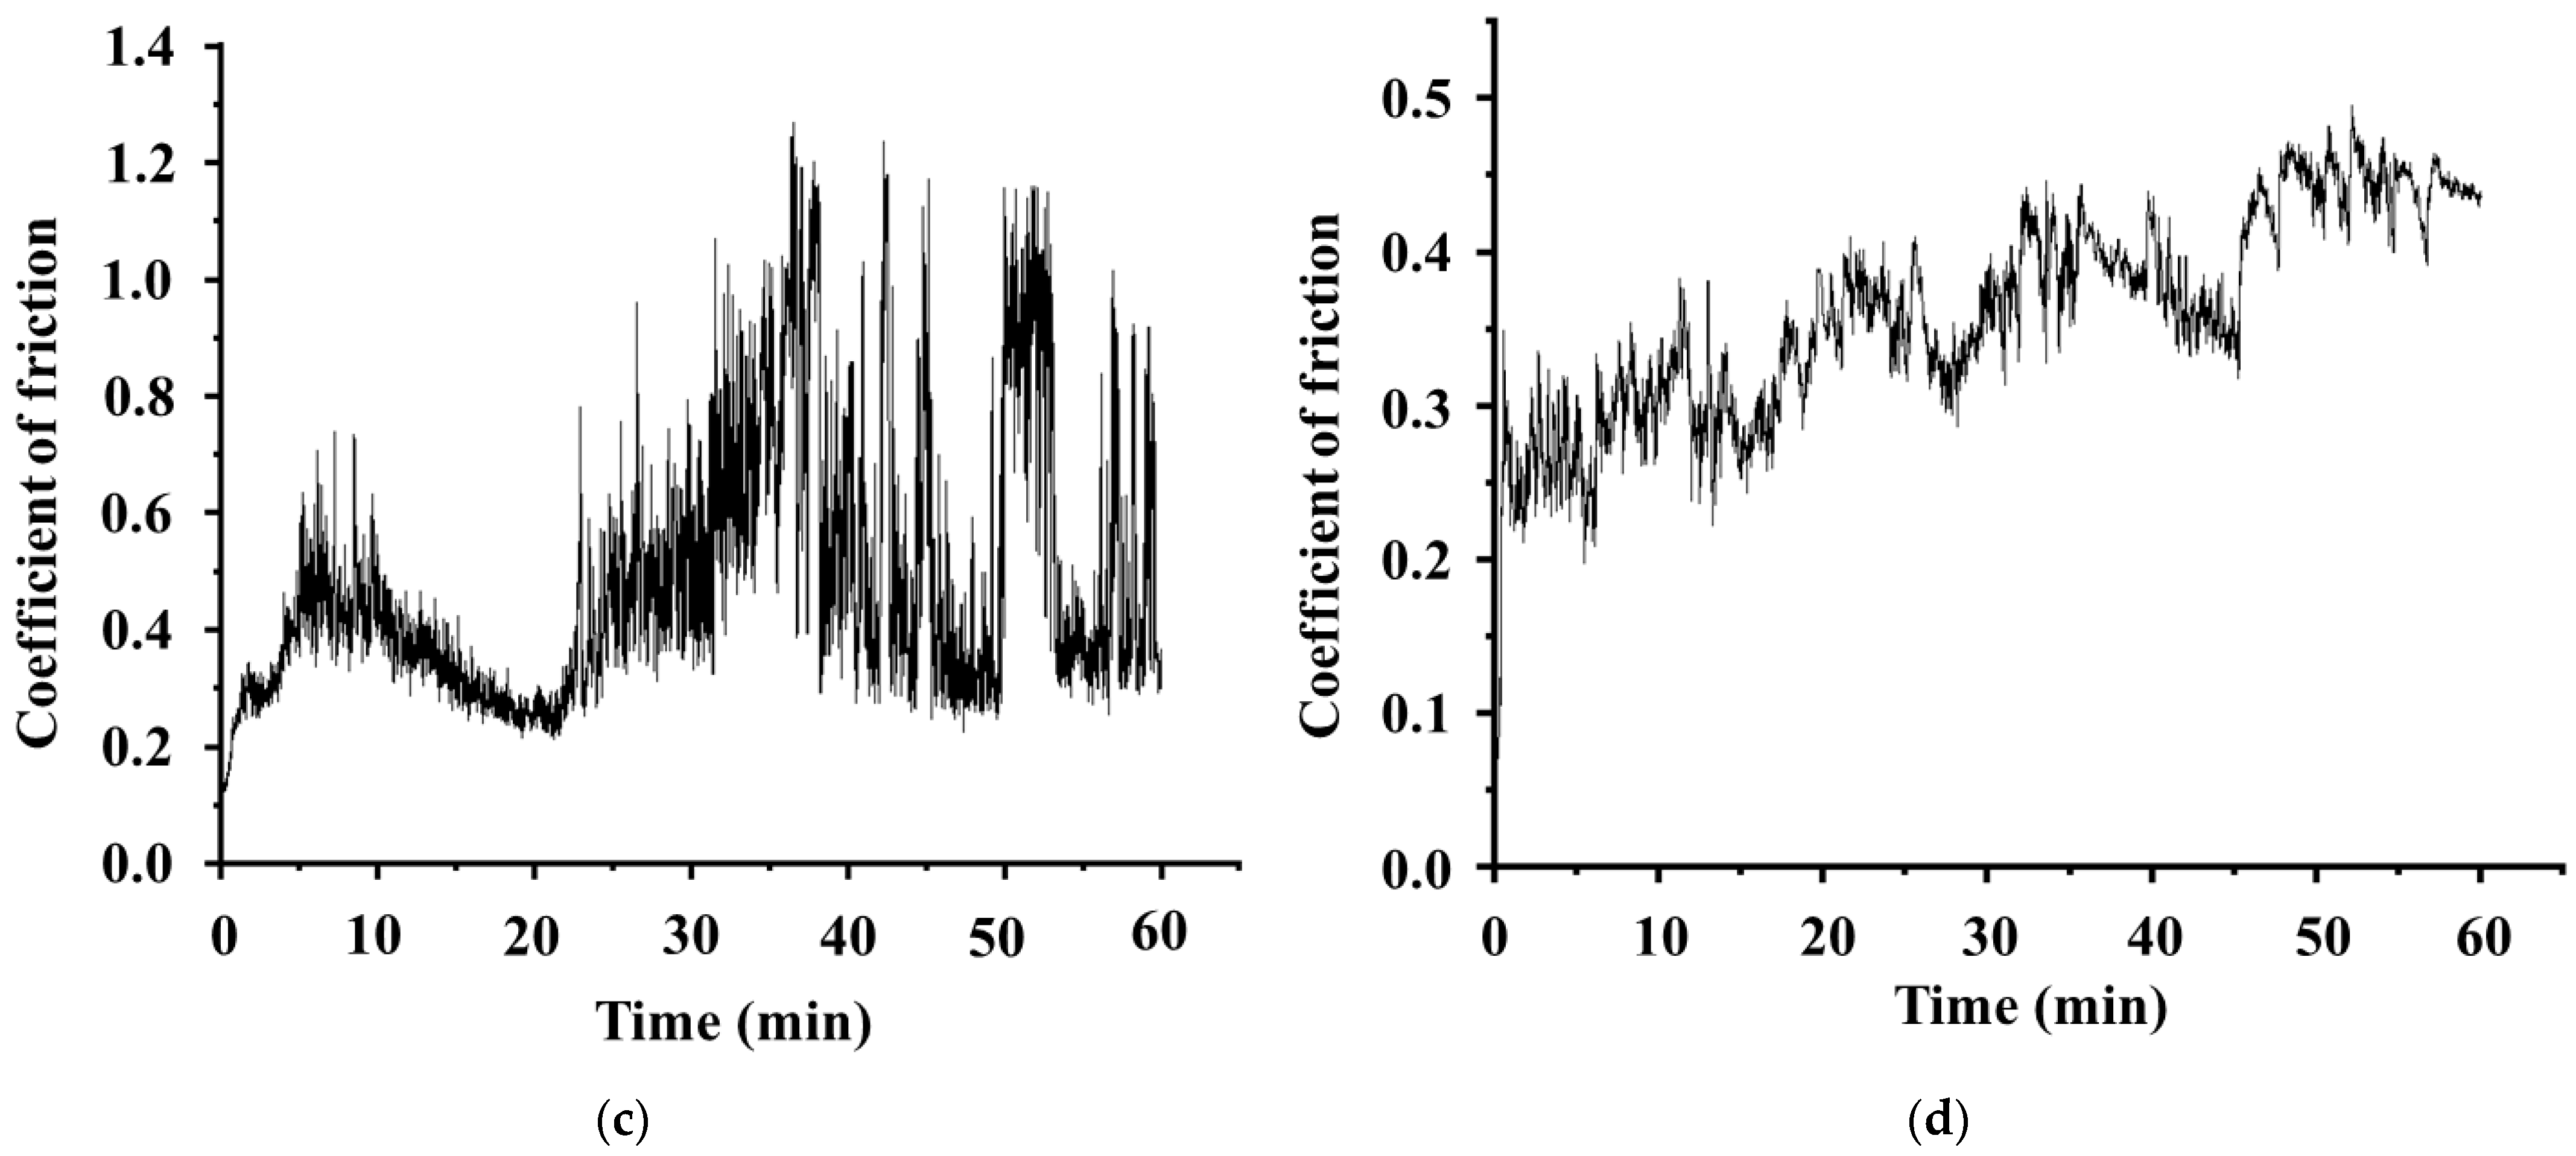
3.2. Absorbance of Acoustic Emissions during the Tribo-Test and Correlation with the Coefficient of Friction

Figure 6a presents a comparative analysis between the average amplitude generated from the acoustic output and the average COF of all four samples obtained during the tribo-testing. Notably, C2 exhibited the highest COF during the tribo-pair interaction, followed by C1. This can be due to the presence of solid lubricants reinforced in the epoxy, particularly with a high concentration of talc. Simultaneously, the same sample, C2, concurrently recorded the maximum average voltage amplitude, followed by C1. Likewise, C3 followed C1 with the third highest COF and corresponding average voltage amplitude, while C4 exhibited the lowest COF and, consequently, the minimum average voltage amplitude. Thus, from Figure 6a, it is evident that the average voltage amplitude and average COF values can be easily correlated.
Figure 6b shows the specific wear rate of all samples with a 10 N load and at four different spindle speeds: 1 Hz, 2 Hz, 3 Hz, and 4 Hz. C3 exhibited a more specific wear rate of 1.89823 ×   10 5 ± 7.95595 ×   10 7 mm3/Nm and a notably lower average amplitude and COF. The reason for the high wear of C3 was its composition of the solid lubricant, which does not contain graphite, which is an excellent solid lubricant. C4 exhibited the second maximum wear rate of 1.41288 ×   10 5 ± 4.55309 ×   10 7 mm3/Nm but generated a lower noise level, leading to the lower average voltage amplitude of the sample. Despite C1’s low wear rate of 9.10743 ×   10 6 ± 2.4282 ×   10 6 mm3/Nm, it generated a higher COF and high average voltage amplitude. Sample C2 exhibited a specific wear rate of 1.2073 ×   10 5 ± 2.12514 ×   10 6 mm3/Nm and produced very high noise and amplitude, which could be due to the high interaction of the mating pairs at a low speed (2 Hz). Thus, it can be seen that the composition of the epoxy coating played a major role in controlling the friction.
The average thickness of the coatings was found to be 19.66 ± 3 µm. In certain instances, certain coatings experienced complete abrasion, suggesting an interaction between the metallic pairs involved. The progression of the acoustic signals in cases C3 and C4 indicates direct metal-to-metal contact. The pronounced fluctuations and increased intensity observed in these cases serve as clear evidence of this interaction. It can be seen that the stick–slip phenomenon of C3 is more evident than in the rest of the samples. On the other hand, keeping all external environments and processes under control, it can be seen that the acoustic emission followed the trend of the coefficient of friction values. These observations significantly strengthen the case for accepting acoustic emission as an efficient tool in monitoring friction.

3.3. Mapping the Coefficient of Friction with Acoustic Emissions during Tribo Test

In Figure 7, it can be seen that the acoustic sensor’s output was consistent with the COF, particularly for samples C2 and C4 (Figure 7c,d,g,h). Although the acoustic sensor’s range and COF values varied, the acoustic sensor exhibited the same pattern as the COF in almost all the samples. During the experiment, it was also observed that the variation in the acoustic sensor output of C1 in one of its experiments did not follow the exact variation in the COF (Figure 7a), possibly due to the lower amplitude of the stick–slip, while in the second experiment, the trend was exactly followed again (Figure 7b). Figure 7c,d shows the result of the COF correlation with the AE at 10 N and 2 Hz for sample C2. The variation in the COF is consistent with the amplitude. In Figure 7c, it can be seen that the crests and falls of the COF coincide with the AE from the 35th to the 50th min of the experiment. Similarly, in Figure 7d, the crests and falls of the CoF and AE coincide from 15 min 30 s to 17 min 30 s. Figure 7e,f shows the result of the COF correlation with the AE at 10 N and 3 Hz for C3. The rise and fall of the acoustic signals is similar to that of the COF. Furthermore, the AE output indicates sharp-edged crests with high amplitude whenever there is a stick–slip crest and fall in the COF graph. Figure 7g,h shows the result of the COF correlation with the AE at 10 N and 4 Hz for sample C4. Similar to the other samples, the variation in the COF consistently follows the sensor’s output voltage.
Figure 7 exhibits that the acoustic signal followed the stick–slip phenomenon observed in the trend of the COF. Particularly for C2 and C4, the acoustic signal was synchronized with the COF signal. This synchronization could not be observed for C1 due to the use of highly complex solid lubricants (Table 2). This, in turn, significantly reduced stick–slip and wear and tear (Figure 6b). The flatness in the acoustic sensor in Figure 7a is also due to the averaging effect of the resistor-capacitive components in the acoustic sensor’s amplifier circuit. The slight delays observed in the acoustic signals’ trends are due to the sensor picking up sound from a small distance from the sample’s test bed. The microphone’s amplifier circuit has capacitive elements, which caused the sensor output to have a discharge time that exceeded the consecutive stick–slip duration of the acoustic sensor. This resulted in the sensor averaging the next stick–slip phenomenon with the previous stage instead of distinctly tracing the stick–slip individually. Figure 8 clearly illustrates this phenomenon.

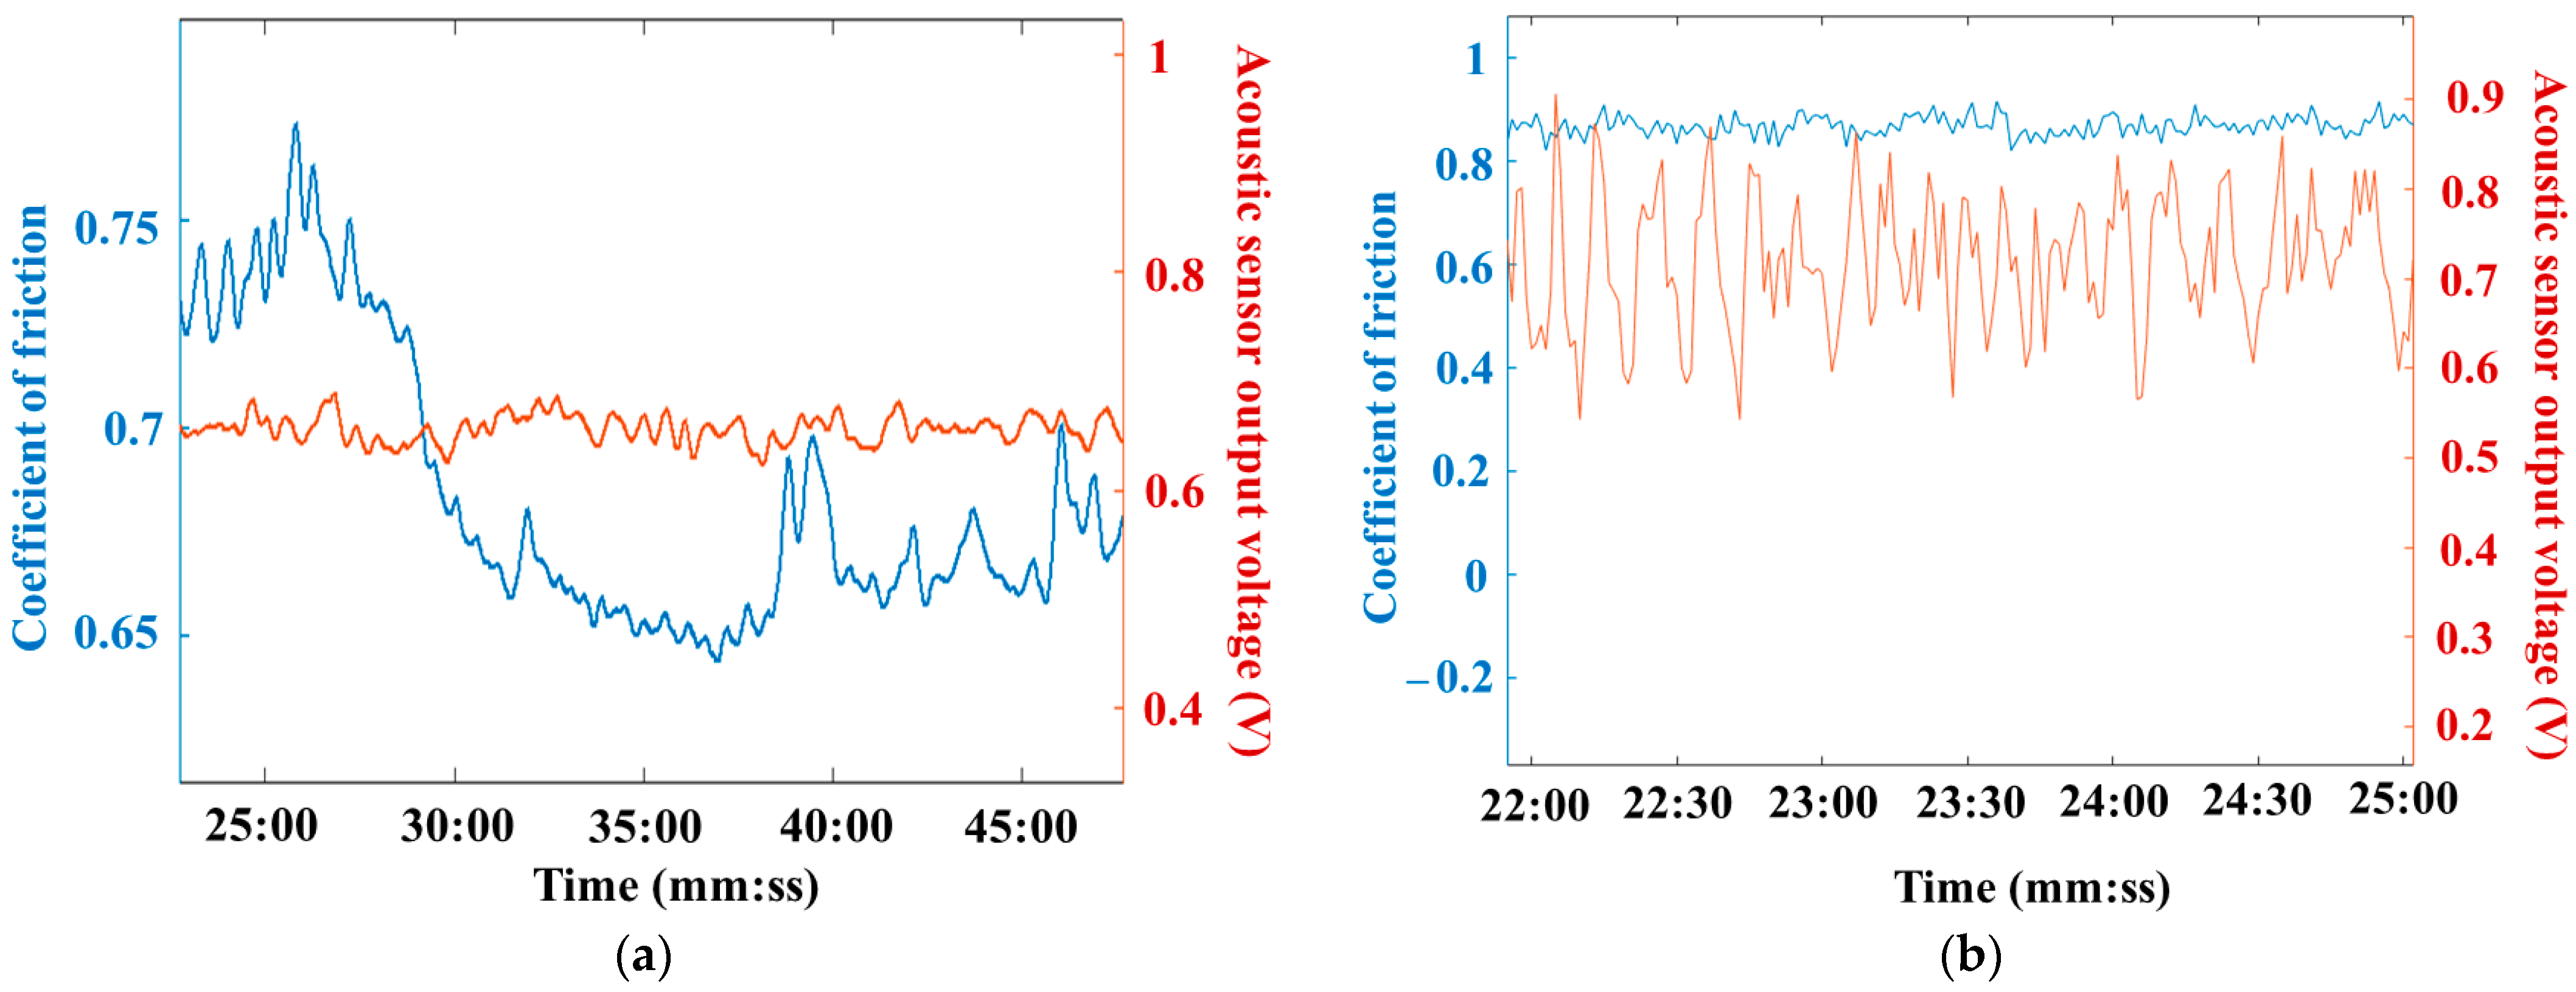
3.4. Analyzing the Surfaces of the Coated Samples and Co-Relating the Surface Features with Acoustic Emissions

The surfaces of the coatings were analyzed using an optical microscope and a three-dimensional profilometer (Figure 9). A well-known fact is the formation of Schallamach waves during the interaction of an elastomer with a hard surface [53]. As observed from the images, Schallamach waves were prominent in C1 (Figure 9b), but as the speed increased, the Schallamach waves seemed to decrease. Similar results of the formation of fewer Schallamach waves at a low speed were reported earlier [54]. Thus, the present results are in line with previously reported works. The formation of irregular surfaces due to the Schallamach waves hindered the performance of acoustic sensors, and thus, the acoustics and COF results of C1 are slightly deviated from each other. Therefore, the AE emissions do not follow the trend of the COF. Thus, this deviation is a strong point of detection for surface irregularities. The average amplitudes of samples C3 and C4 when the tribo-tests were running at a high speed were found to be lower than those of C1 and C2. However, the reading average amplitude of C2 was higher than C1, which is due to the presence of the different additives, which control the friction. The coefficient of friction of C2 was also more than that of C1, and therefore, the amplitude of the acoustic emission was also higher in C2 than C1.

4. Conclusions

The authors of this paper investigated the ability of an acoustic sensor to detect the stick–slip phenomenon of polymer coating steel under sliding conditions with a 10 N load at 1 Hz, 2 Hz, 3 Hz, and 4 Hz spindle speeds.
  • The presence of the stick–slip phenomenon was confirmed by analyzing the variation in the coefficient of friction during tribo-pair interaction. The amplitude of the stick–slip of C3 was high, and it was observed that C3 generated a 11.29 N maximum friction force under a 10 N applied load and showed high amplitudes of stick–slip, a high wear rate, and deep grooves.
  • The average amplitude of the acoustic signal was compared with the average value of the coefficient of friction. The amplitude of acoustic emission followed the trend of the coefficient of friction.
  • The coefficient of friction was mapped with the acoustic sensor output voltage. The variation in the coefficient of friction followed the trend of the acoustic sensor output voltage, particularly C2 and C4.
  • Schallamach waves were observed during the surface morphology analysis. The C1 under low speed showed a higher Schallamach wave presence, which obstructed the performance of the acoustic sensor, and thus the correlation between the variation in the coefficient of friction and the acoustic signal did not follow the trend.
  • Even though the acoustic signal was capable of mapping the frictional coefficient, a few drawbacks listed below still remain.
  • Although the acoustic sensor’s trend was similar to the COF, it lacked resolution due to the averaging effect of the electronic components. The averaging effect can be reduced by fine-tuning the values to suit the quick response needed to exhibit the same trend as the COF.
  • A second issue that limits the use of the acoustic sensor is that the experimental set-up was not in a sound-insulated environment. An acoustic sensor with high sensitivity can capture every sound due to friction/wear and tear for such applications. On the contrary, in a non-insulated (acoustic) environment, the sensor may pick up noises from other operating machines or environmental sounds that could occur during the experiment.
Considering the observations listed above, it can be seen that acoustic sensors are quite capable of mapping the acoustic emissions and frictional properties of epoxy coatings effectively; however, it is important to have a controlled environment so that the ambient noises do not affect the results.

Author Contributions

Conceptualization, S.B. and V.P.; Data curation, V.K., A.A.J. and S.B.; Formal analysis, S.B. and V.P.; Investigation, S.B.; Methodology, V.K., A.A.J. and S.B.; Project administration, S.B.; Resources, V.K. and S.B.; Software, V.K.; Supervision, S.B.; Validation, V.K. and S.B.; Visualization, V.P.; Writing—original draft, V.K., A.A.J. and S.B.; Writing—review & editing, V.K., S.B. and V.P. All authors have read and agreed to the published version of the manuscript.

Funding

This research received no external funding.

Institutional Review Board Statement

Not applicable.

Informed Consent Statement

Not applicable.

Data Availability Statement

Data is contained within the article.

Conflicts of Interest

The authors declare no conflict of interest.

References

  1. Myshkin, N.; Kovalev, A. Adhesion and Surface Forces in Polymer Tribology—A Review. Friction 2018, 6, 143–155. [Google Scholar] [CrossRef]
  2. Nguyen, X.H.; Nguyen, H.A. Investigation of influences of fabrication tolerances on operational characteristics of piezo-actuated stick-slip micro-drives. Facta Univ. Ser. Mech. Eng. 2022, 20, 109–126. [Google Scholar] [CrossRef]
  3. Nguyen, T.T.T.; Doanh, T.; Le Bot, A.; Dalmas, D. High-Temporal-Resolution Quasideterministic Dynamics of Granular Stick-Slip. Sci. Rep. 2021, 11, 2902. [Google Scholar] [CrossRef] [PubMed]
  4. Sanahuja, S.; Upadhyay, R.; Briesen, H.; Chen, J. Spectral Analysis of the Stick-Slip Phenomenon in “Oral” Tribological Texture Evaluation. J. Texture Stud. 2017, 48, 318–334. [Google Scholar] [CrossRef]
  5. Xun, C.; Dai, H.; Wang, Y. Dynamic Analysis of Gear Pairs with the Effects of Stick-Slip. J. Vibroeng. 2023, 25, 792–810. [Google Scholar] [CrossRef]
  6. Viswanathan, K.; Sundaram, N.K. Distinct Stick-Slip Modes in Adhesive Polymer Interfaces. Wear 2017, 376–377, 1271–1278. [Google Scholar] [CrossRef]
  7. Lu, P.; Powrie, H.E.; Wood, R.J.K.; Harvey, T.J.; Harris, N.R. Early Wear Detection and Its Significance for Condition Monitoring. Tribol. Int. 2021, 159, 106946. [Google Scholar] [CrossRef]
  8. Kamble, S.N.; Rajiv, B. Significance of Risk Priority Number in Machine Condition Monitoring. Mater. Today Proc. 2021, 50, 1930–1935. [Google Scholar] [CrossRef]
  9. Alshorman, O.; Irfan, M.; Saad, N.; Zhen, D.; Haider, N.; Glowacz, A.; Alshorman, A. A Review of Artificial Intelligence Methods for Condition Monitoring and Fault Diagnosis of Rolling Element Bearings for Induction Motor. Shock. Vib. 2020, 2020, 8843759. [Google Scholar] [CrossRef]
  10. Rosenkranz, A.; Marian, M.; Profito, F.J.; Aragon, N.; Shah, R. The Use of Artificial Intelligence in Tribology—A Perspective. Lubricants 2021, 9, 2. [Google Scholar] [CrossRef]
  11. Marian, M.; Tremmel, S. Current Trends and Applications of Machine Learning in Tribology—A Review. Lubricants 2021, 9, 86. [Google Scholar] [CrossRef]
  12. Bhaumik, S.; Kamaraj, M. Artificial Neural Network and Multi-Criterion Decision Making Approach of Designing a Blend of Biodegradable Lubricants and Investigating Its Tribological Properties. Proc. Inst. Mech. Eng. J. J. Eng. Tribol. 2021, 235, 1575–1589. [Google Scholar] [CrossRef]
  13. Bhaumik, S.; Pathak, S.D.; Dey, S.; Datta, S. Artificial Intelligence Based Design of Multiple Friction Modifiers Dispersed Castor Oil and Evaluating Its Tribological Properties. Tribol. Int. 2019, 140, 105813. [Google Scholar] [CrossRef]
  14. Aydin, F. The Investigation of the Effect of Particle Size on Wear Performance of AA7075/Al2O3 Composites Using Statistical Analysis and Different Machine Learning Methods. Adv. Powder Technol. 2021, 32, 445–463. [Google Scholar] [CrossRef]
  15. Hasan, M.S.; Kordijazi, A.; Rohatgi, P.K.; Nosonovsky, M. Triboinformatics Approach for Friction and Wear Prediction of Al-Graphite Composites Using Machine Learning Methods. J. Tribol. 2022, 144, 011701. [Google Scholar] [CrossRef]
  16. Prost, J.; Cihak-Bayr, U.; Adina Neacşu, I.; Grundtner, R.; Pirker, F.; Vorlaufer, G. Semi-Supervised Classification of the State of Operation in Self-Lubricating Journal Bearings Using a Random Forest Classifier. Lubricants 2021, 9, 50. [Google Scholar] [CrossRef]
  17. Deshpande, P.; Pandiyan, V.; Meylan, B.; Wasmer, K. Acoustic Emission and Machine Learning Based Classification of Wear Generated Using a Pin-on-Disc Tribometer Equipped with a Digital Holographic Microscope. Wear 2021, 476, 203622. [Google Scholar] [CrossRef]
  18. Zhu, Y.; Qu, H.; Luo, M.; He, C.; Qu, J. Dry Friction and Wear Properties of Several Hard Coating Combinations. Wear 2020, 456–457, 203352. [Google Scholar] [CrossRef]
  19. Gomes, M.C.; Brito, L.C.; Bacci da Silva, M.; Viana Duarte, M.A. Tool Wear Monitoring in Micromilling Using Support Vector Machine with Vibration and Sound Sensors. Precis. Eng. 2021, 67, 137–151. [Google Scholar] [CrossRef]
  20. Yan, Y.; Hu, Y.; Wang, L.; Qian, X.; Zhang, W.; Reda, K.; Wu, J.; Zheng, G. Electrostatic Sensors—Their Principles and Applications. Measurement 2021, 169, 108506. [Google Scholar] [CrossRef]
  21. Chacón, J.L.F.; de Barrena, T.F.; García, A.; de Buruaga, M.S.; Badiola, X.; Vicente, J. A Novel Machine Learning-based Methodology for Tool Wear Prediction Using Acoustic Emission Signals. Sensors 2021, 21, 5984. [Google Scholar] [CrossRef] [PubMed]
  22. Pandiyan, V.; Prost, J.; Vorlaufer, G.; Varga, M.; Wasmer, K. Identification of Abnormal Tribological Regimes Using a Microphone and Semi-Supervised Machine-Learning Algorithm. Friction 2022, 10, 583–596. [Google Scholar] [CrossRef]
  23. Arun, A.; Rameshkumar, K.; Unnikrishnan, D.; Sumesh, A. Tool Condition Monitoring Of Cylindrical Grinding Process Using Acoustic Emission Sensor. Mater. Today Proc. 2018, 5, 11888–11899. [Google Scholar] [CrossRef]
  24. Shen, C.H. Acoustic Emission Based Grinding Wheel Wear Monitoring: Signal Processing and Feature Extraction. Appl. Acoust. 2022, 196, 108863. [Google Scholar] [CrossRef]
  25. Lopes, W.N.; Junior, P.O.C.; Aguiar, P.R.; Alexandre, F.A.; Dotto, F.R.L.; Sérgio Da Silva, P.; Bianchi, E.C. An Efficient Short-Time Fourier Transform Algorithm for Grinding Wheel Condition Monitoring through Acoustic Emission. Int. J. Adv. Manuf. Technol. 2021, 113, 585–603. [Google Scholar] [CrossRef]
  26. Shivith, K.; Rameshkumar, K. AE Signature Analysis Using Continuous and Discrete Wavelet Transforms to Predict Grinding Wheel Conditions. IOP Conf. Ser. Mater. Sci. Eng. 2021, 1045, 012034. [Google Scholar] [CrossRef]
  27. Filippov, A.V.; Tarasov, S.Y.; Fortuna, S.V.; Podgornykh, O.A.; Shamarin, N.N.; Vorontsov, A.V. Wear, Vibration and Acoustic Emission Characterization of Sliding Friction Processes of Coarse-Grained and Ultrafine-Grained Copper. Wear 2019, 424–425, 78–88. [Google Scholar] [CrossRef]
  28. Babici, L.M.; Tudor, A.; Romeu, J. Stick-Slip Phenomena and Acoustic Emission in the Hertzian Linear Contact. Appl. Sci. 2022, 12, 9527. [Google Scholar] [CrossRef]
  29. Renhart, P.; Maier, M.; Strablegg, C.; Summer, F.; Grün, F.; Eder, A. Monitoring Tribological Events by Acoustic Emission Measurements for Bearing Contacts. Lubricants 2021, 9, 109. [Google Scholar] [CrossRef]
  30. Rameshkumar, K.; Sriram, R.; Saimurugan, M.; Krishnakumar, P. Establishing Statistical Correlation between Sensor Signature Features and Lubricant Solid Particle Contamination in a Spur Gearbox. IEEE Access 2022, 10, 106230–106247. [Google Scholar] [CrossRef]
  31. Huang, W.; Li, Y.; Wu, X.; Shen, J. The Wear Detection of Mill-Grinding Tool Based on Acoustic Emission Sensor. Int. J. Adv. Manuf. Technol. 2023, 124, 4121–4130. [Google Scholar] [CrossRef]
  32. Leng, S.; Wang, Z.; Min, T.; Dai, Z.; Chen, G. Detection of Tool Wear in Drilling CFRP/TC4 Stacks by Acoustic Emission. J. Vib. Eng. Technol. 2020, 8, 463–470. [Google Scholar] [CrossRef]
  33. Choe, C.; Chen, C.; Nagao, S.; Suganuma, K. Real-Time Acoustic Emission Monitoring of Wear-out Failure in Sic Power Electronic Devices during Power Cycling Tests. IEEE Trans. Power Electron. 2021, 36, 4420–4428. [Google Scholar] [CrossRef]
  34. Feng, P.; Borghesani, P.; Smith, W.A.; Randall, R.B.; Peng, Z. A Review on the Relationships between Acoustic Emission, Friction and Wear in Mechanical Systems. Appl. Mech. Rev. 2020, 72, 020801. [Google Scholar] [CrossRef]
  35. Zuo, L.; Zuo, D.; Zhu, Y.; Wang, H. Acoustic Emission Analysis for Tool Wear State during Friction Stir Joining of SiCp/Al Composite. Int. J. Adv. Manuf. Technol. 2018, 99, 1361–1368. [Google Scholar] [CrossRef]
  36. Yin, Y.; Huang, W.; Liu, X.; Liu, Y.; Wang, Z.; Fan, W.; Hu, S. Analysis of the Dynamic Friction of a Gas Face Seal Based on Acoustic Emissions. Tribol. Lett. 2018, 66, 85. [Google Scholar] [CrossRef]
  37. Geng, Z.; Puhan, D.; Reddyhoff, T. Using Acoustic Emission to Characterize Friction and Wear in Dry Sliding Steel Contacts. Tribol. Int. 2019, 134, 394–407. [Google Scholar] [CrossRef]
  38. Yin, Y.; Hu, S.; Huang, W.; Liu, X.; Liu, Y.; Wang, Z. A Bi-Gaussian Acoustic Emission Model for Sliding Friction. IOP Conf. Ser. Mater. Sci. Eng. 2019, 686, 012026. [Google Scholar] [CrossRef]
  39. Revill, P.; Clarke, A.; Pullin, R.; Dennis, G. Acoustic Emission Monitoring of Wear in Aerospace Self-Lubricating Bearing Liner Materials. Wear 2021, 486–487, 204012. [Google Scholar] [CrossRef]
  40. Twardowski, P.; Tabaszewski, M.; Wiciak-Pikuła, M.; Felusiak-Czyryca, A. Identification of Tool Wear Using Acoustic Emission Signal and Machine Learning Methods. Precis. Eng. 2021, 72, 738–744. [Google Scholar] [CrossRef]
  41. Taura, H.; Nakayama, K. Behavior of Acoustic Emissions at the Onset of Sliding Friction. Tribol. Int. 2018, 123, 155–160. [Google Scholar] [CrossRef]
  42. Shanbhag, V.V.; Meyer, T.J.J.; Caspers, L.W.; Schlanbusch, R. Defining acoustic emission-based condition monitoring indicators for monitoring piston rod seal and bearing wear in hydraulic cylinders. Int. J. Adv. Manuf. Technol. 2021, 115, 2729–2746. [Google Scholar] [CrossRef]
  43. Hase, A.; Mishina, H. Identification and Evaluation of Wear Phenomena under Electric Current by Using an Acoustic Emission Technique. Tribol. Int. 2018, 127, 372–378. [Google Scholar] [CrossRef]
  44. Maia, L.H.A.; Abrao, A.M.; Vasconcelos, W.L.; Sales, W.F.; Machado, A.R. A New Approach for Detection of Wear Mechanisms and Determination of Tool Life in Turning Using Acoustic Emission. Tribol. Int. 2015, 92, 519–532. [Google Scholar] [CrossRef]
  45. Baig, M.M.A.; Samad, M.A. Epoxy\epoxy Composite\epoxy Hybrid Composite Coatings for Tribological Applications—A Review. Polymers 2021, 13, 179. [Google Scholar] [CrossRef] [PubMed]
  46. Vikram, K.; Bhaumik, S.; Pramanik, S. Effect of Graphite on Tribological and Mechanical Properties of PA6/5GF Composites. J. Therm. Anal. Calorim. 2023, 148, 3341–3355. [Google Scholar] [CrossRef]
  47. Vikram, K.; Pramanik, S.; Bhaumik, S. Effect of Hexagonal Boron Nitride on Structural, Mechanical, and Tribological Behavior of Polyamide 6/Glass Fibers (5 Wt%) Hybrid Nanocomposites. Iran. Polym. J. 2023. [Google Scholar] [CrossRef]
  48. de Castro, V.V.; dos Santos, L.M.; Antonini, L.M.; Schroeder, R.M.; Mattedi, S.; Souza, K.S.; Pereira, M.B.; Einloft, S.; dos Santos, C.A.; de Fraga Malfatti, C. Water-Based Lubricant Containing Protic Ionic Liquids and Talc Lubricant Particles: Wear and Corrosion Analysis. Wear 2023, 518–519, 204633. [Google Scholar] [CrossRef]
  49. Kadhim, M.J.; Kamal, H.M.; Majeed, A.H. The Tribological Behaviour of Epoxy Matrix Composite Reinforced by Ceramic Carbides. J. Adv. Res. Fluid. Mech. Therm. Sci. 2020, 70, 76–88. [Google Scholar] [CrossRef]
  50. Bhaumik, S.; Mukherjee, M.; Sarkar, P.; Nayek, A.; Paleu, V. Microstructural and Wear Properties of Annealed Medium Carbon Steel Plate (EN8) Cladded with Martensitic Stainless Steel (AISI410). Metals 2020, 10, 958. [Google Scholar] [CrossRef]
  51. Yahiaoui, M.; Chabert, F.; Paris, J.Y.; Nassiet, V.; Denape, J. Friction, Acoustic Emission, and Wear Mechanisms of a PEKK Polymer. Tribol. Int. 2019, 132, 154–164. [Google Scholar] [CrossRef]
  52. Dong, C.; Yuan, C.; Bai, X.; Qin, H.; Yan, X. Investigating Relationship between Deformation Behaviours and Stick-Slip Phenomena of Polymer Material. Wear 2017, 376–377, 1333–1338. [Google Scholar] [CrossRef]
  53. Stachowiak, G.W.; Batchelor, A.W. Engineering Tribology; Elsevier: Amsterdam, The Netherlands, 2014; ISBN 978-0-12-397047-3. [Google Scholar]
  54. Persson, B.N.J. Elastic Instabilities at a Sliding Interface. Phys. Rev. B Condens. Matter Mater. Phys. 2001, 63, 7. [Google Scholar] [CrossRef]
Figure 1. Coated bars before test: (a) C1, (b) C2, (c) C3, (d) C4.
Technologies 12 00030 g001
Figure 2. (a) Schematic diagram of reciprocating wear test rig; (b) experimental setup.
Technologies 12 00030 g002
Figure 3. LM386 mono audio amplifier circuit.
Technologies 12 00030 g003
Figure 4. (a) Illustration of microphone placement and the connectivity between the Acoustic sensor and the Arduino microcontroller. (b) Ambient noise recorded by the sensor before the test.
Technologies 12 00030 g004
Figure 5. Coefficient of variation over the time. (a) C1-10N, 1 Hz; (b) C2-10N, 2 Hz; (c) C3-10N, 3 Hz; (d) C4-10N, 4 Hz.
Technologies 12 00030 g005aTechnologies 12 00030 g005b
Figure 6. (a) Comparison of average amplitude with average COF; (b) specific wear rate of coated samples.
Technologies 12 00030 g006
Figure 7. Comparison of the evolution of acoustic sensor output (RMS value) with friction coefficient values at prominent stick–slip regions: (a,b) C1; (c,d) C2; (e,f) C3; (g,h) C4.
Technologies 12 00030 g007aTechnologies 12 00030 g007b
Figure 8. Illustration of the discharge time of the capacitors in the acoustic sensor amplifier and filter circuit introducing the averaging/smoothening effect of the stick–slip phenomenon.
Technologies 12 00030 g008
Figure 9. Optical microscopy and three-dimensional profilometer images of the worn surface of the coating of the bars with 10 N: (a,b) C1, 4 Hz; (c,d) C2, 1 Hz; (e,f) C3, 2 Hz; (g,h) C4, 3 Hz.
Technologies 12 00030 g009aTechnologies 12 00030 g009b
Table 1. Composition of EN 8 bars and EN 31 balls.
Material composition values of EN8 steel bar:
CMnSiSP
0.440%0.569%0.176%0.027%0.080%-
Material composition values of EN31 steel ball:
CMnSiSPCr
0.928%0.323%0.186%0.006%0.019%1.494%
Table 2. Compositions of the coatings.
CoatingGraphite (wt%)hBN (wt%)Talc (wt%)Total
Additives (wt%)
C1157.51537.5
C2551525
C307.51017.5
C4150520
Table 3. The experimental conditions for the bars considered during data generation.
SampleFrequency (Hz)Load (N)Stroke Length (mm)
C111015
C22
C33
C44
Table 4. Amplitude of the stick–slip.
SamplesMaximum Frictional Force Generated during the Tribo Test (N) µ s µ k µ *
C17.83320.87300.59570.1386
C28.85020.95120.43230.2594
C311.29361.26940.21160.5289
C44.52410.49580.22210.1368
Disclaimer/Publisher’s Note: The statements, opinions and data contained in all publications are solely those of the individual author(s) and contributor(s) and not of MDPI and/or the editor(s). MDPI and/or the editor(s) disclaim responsibility for any injury to people or property resulting from any ideas, methods, instructions or products referred to in the content.

