Communication

Exploiting PlanetScope Imagery for Volcanic Deposits Mapping

1
Istituto Nazionale Geofisica e Vulcanologia, Sezione di Catania-Osservatorio Etneo, Piazza Roma 2, 95125 Catania, Italy
2
Dipartimento di Scienze della Terra e del Mare (DiSTeM), Università degli Studi di Palermo, Via Archirafi 22, 90123 Palermo, Italy
3
Dipartimento di Scienze Biologiche, Geologiche e Ambientali, Alma Mater Studiorum, Università di Bologna, Piazza Porta San Donato 1, 40126 Bologna, Italy
*
Author to whom correspondence should be addressed.
Technologies 2024, 12(2), 25; https://doi.org/10.3390/technologies12020025
Submission received: 28 November 2023 / Revised: 25 January 2024 / Accepted: 2 February 2024 / Published: 8 February 2024
(This article belongs to the Special Issue Image and Signal Processing)

Abstract

:
During explosive eruptions, tephra fallout represents one of the main volcanic hazards and can be extremely dangerous for air traffic, infrastructures, and human health. Here, we present a new technique aimed at identifying the area covered by tephra after an explosive event, based on processing PlanetScope imagery. We estimate the mean reflectance values of the visible (RGB) and near infrared (NIR) bands, analyzing pre- and post-eruptive data in specific areas and introducing a new index, which we call the ‘Tephra Fallout Index (TFI)’. We use the Google Earth Engine computing platform and define a threshold for the TFI of different eruptive events to distinguish the areas affected by the tephra fallout and quantify the surface coverage density. We apply our technique to the eruptive events occurring in 2021 at Mt. Etna (Italy), which mainly involved the eastern flank of the volcano, sometimes two or three times within a day, making field surveys difficult. Whenever possible, we compare our results with field data and find an optimal match. This work could have important implications for the identification and quantification of short-term volcanic hazard assessments in near real-time during a volcanic eruption, but also for the mapping of other hazardous events worldwide.

1. Introduction

Volcanic eruptions close to inhabited areas represent a major natural hazard due to lava flows, tephra fallout, mudflows, toxic gasses, and other phenomena that can be triggered during volcanic activity. Explosive eruptions can prove extremely dangerous for air traffic, causing severe damage to aircraft jet engines, obscuring the windscreen and landing lights, and resulting in other damaging effects [1,2]. These eruptions also pose risks to agriculture, roof stability, and human health [3,4]. Indeed, fine ash is associated with long-term health effects, such as silicosis and chronic pulmonary diseases [5]. For the characterization of explosive eruptions and their hazards, field investigations of tephra deposits constitute the first and, today, an essential step. Tephra samples are collected in the field and then analyzed in the laboratory to evaluate the main features of the eruptive event (e.g., total mass, total grain-size distribution, etc.). The volume of volcanic products can be mapped with field measurements by multiplying the covered area, which can be determined with a good precision, and estimating the average thickness or mass on square meter. Furthermore, tephra could be cleaned up or carried away by the action of the winds, making a rapid analysis necessary. In addition, field activities could also be impractical in some contexts and prove risky for volcanologists in proximal areas. Indeed, volcanoes are often located in remote areas, and they are generally inaccessible during eruption and for extended periods after the eruptive event ends, and their products can be scattered or dispersed over regional or global scales. Moreover, depending on the eruption, tephra deposits can cover larger areas, some of them very difficult to sample in one or two days. The values of mass (kg/m2) are in general calculated and used to draw an isomass map of the tephra deposit. Isomass maps and isopach maps (distribution of mass/area and tephra thickness) are necessary to estimate erupted mass or volume [6,7,8], whereas the distribution of largest clasts (depicted in isopleth maps) is typically used to estimate column height and wind speed [9]. These parameters are important for evaluating the areas that may be affected by volcanic ash and forecasting regions that should be avoided by aircraft (e.g., [10]). Dedicated empirical and analytical models are generally used to determine the plume height, erupted mass, initial grain-size distribution, mass eruption rate, and duration. Many numerical models are currently available to reproduce the dispersion and fallout processes, and they have been successfully applied to several recent eruptions [11,12,13,14,15,16,17,18,19,20]. However, it is well-known that the reduction of uncertainty in model outcomes cannot be done without integrating observational data coming from an advanced monitoring system [21,22]. Radar, cameras, and infrasound sensors constitute valuable tools for monitoring active or potentially active volcanoes and have recently been used for forecasting volcanic ash transport and dispersion during an eruption, facilitating real-time management of volcanic hazards [23,24,25,26]. In particular, these instruments have been used to directly estimate the mass eruption rate (MER) in near real-time and determine the eruptive column height [27,28,29,30,31]. However, these pioneering applications are either not operational or limited to a few of the world’s best-monitored volcanoes (e.g., Etna volcano, Italy). In recent years, satellite detection techniques have been investigated. The use of remote sensing techniques aimed at analyzing the tephra deposit is essential to have a more rapid response during a volcanic crisis. It is necessary since emergency responders and government agencies need to make fast decisions that should be based on accurate forecasts of tephra dispersal and assessments of the expected impact. By differencing successive digital topographies, deposit thickness can be mapped, but this method is limited by the availability of topographic data of the surface underneath the volcanic deposit of interest, and such measurements are difficult, if not impossible, to be made retrospectively [32]. Moreover, this method can only be used if deposit thickness is more than 1 m, making it impractical for tephra fallout arising from a single episode of lava fountain because of the high measurement error, which is equal to 1 m [33].
The technological advancements and increasing availability of high-resolution satellite imagery offer new possibilities for mapping volcanic deposits related to a single eruptive event. Spatial resolution is one of the main limitations in deposit mapping, together with the revisit time of satellites, particularly in rapidly evolving situations. The constant improvements in satellite sensors over the years allowed us to achieve, with the launch of the PlanetScope microsatellite constellation, very high spatial resolution (~3 m) images, with a daily temporal cadence.
In this work, we present a new method to identify the fallout deposits related to individual eruptive episodes in near real-time, exploiting the low cost and high spatial resolution PlanetScope imagery. Near-real-time tephra mapping is of primary importance since it could help field volcanologists in faster sampling and provide a synoptic view of the areas affected by volcanic deposits where sampling is not possible. The programming codes were developed on the Google Earth Engine computing platform (GEE) considering the variations in measured reflectance with and without fallout in urban paved areas. To test the method, we chose Mt. Etna volcano as a case study.
During 2021–2023, Mt. Etna produced more than 60 lava fountains characterized by persistent tephra fallout, which often affected the same portion of the volcano, sometimes two or three times within a day. The extremely high frequency of these explosive events made field surveys difficult, since sampling soon after each eruptive event is fundamental. Moreover, at Etna, field surveys are carried out in certain areas based on simulations, which can differ from the real tephra deposit if the eruption has different eruption source parameters. As an example, the column height may change during the course of an eruptive event, depending on the eruption style, and this reflects on the area affected by the tephra fallout. Indeed, models that consider a constant column height for an entire eruptive event will provide greater impacted areas than those that include decreasing column heights [34].

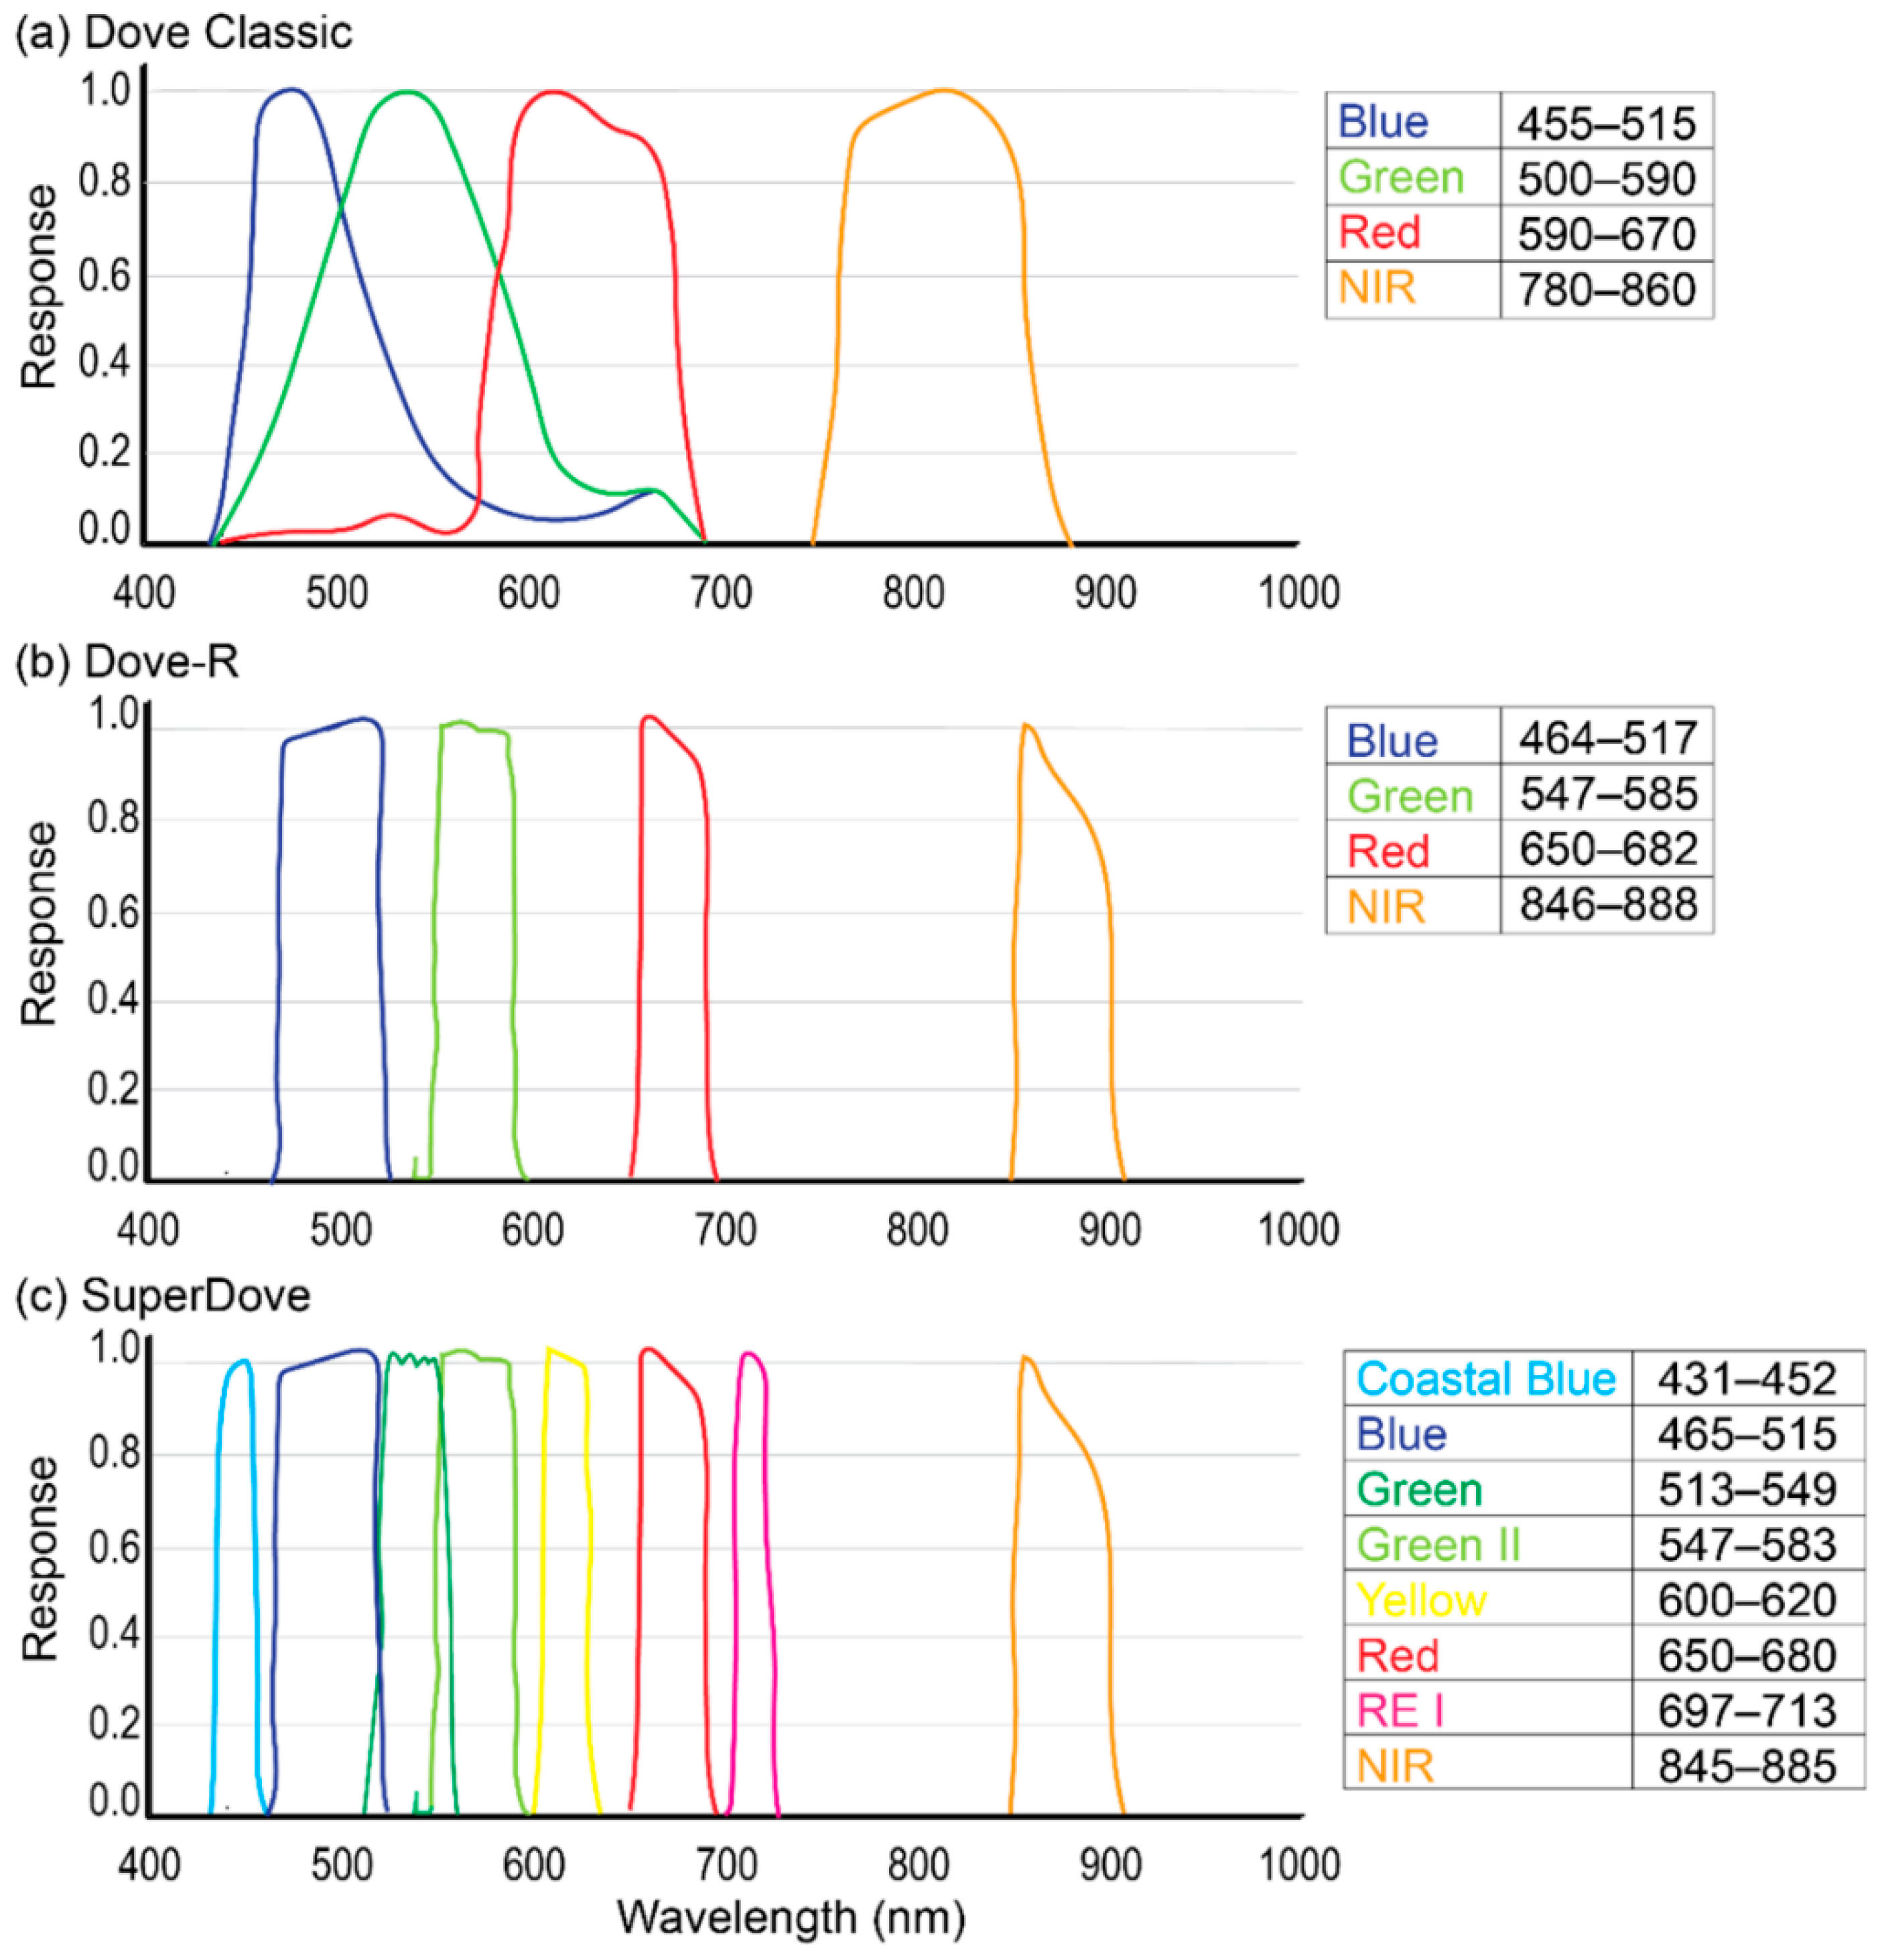
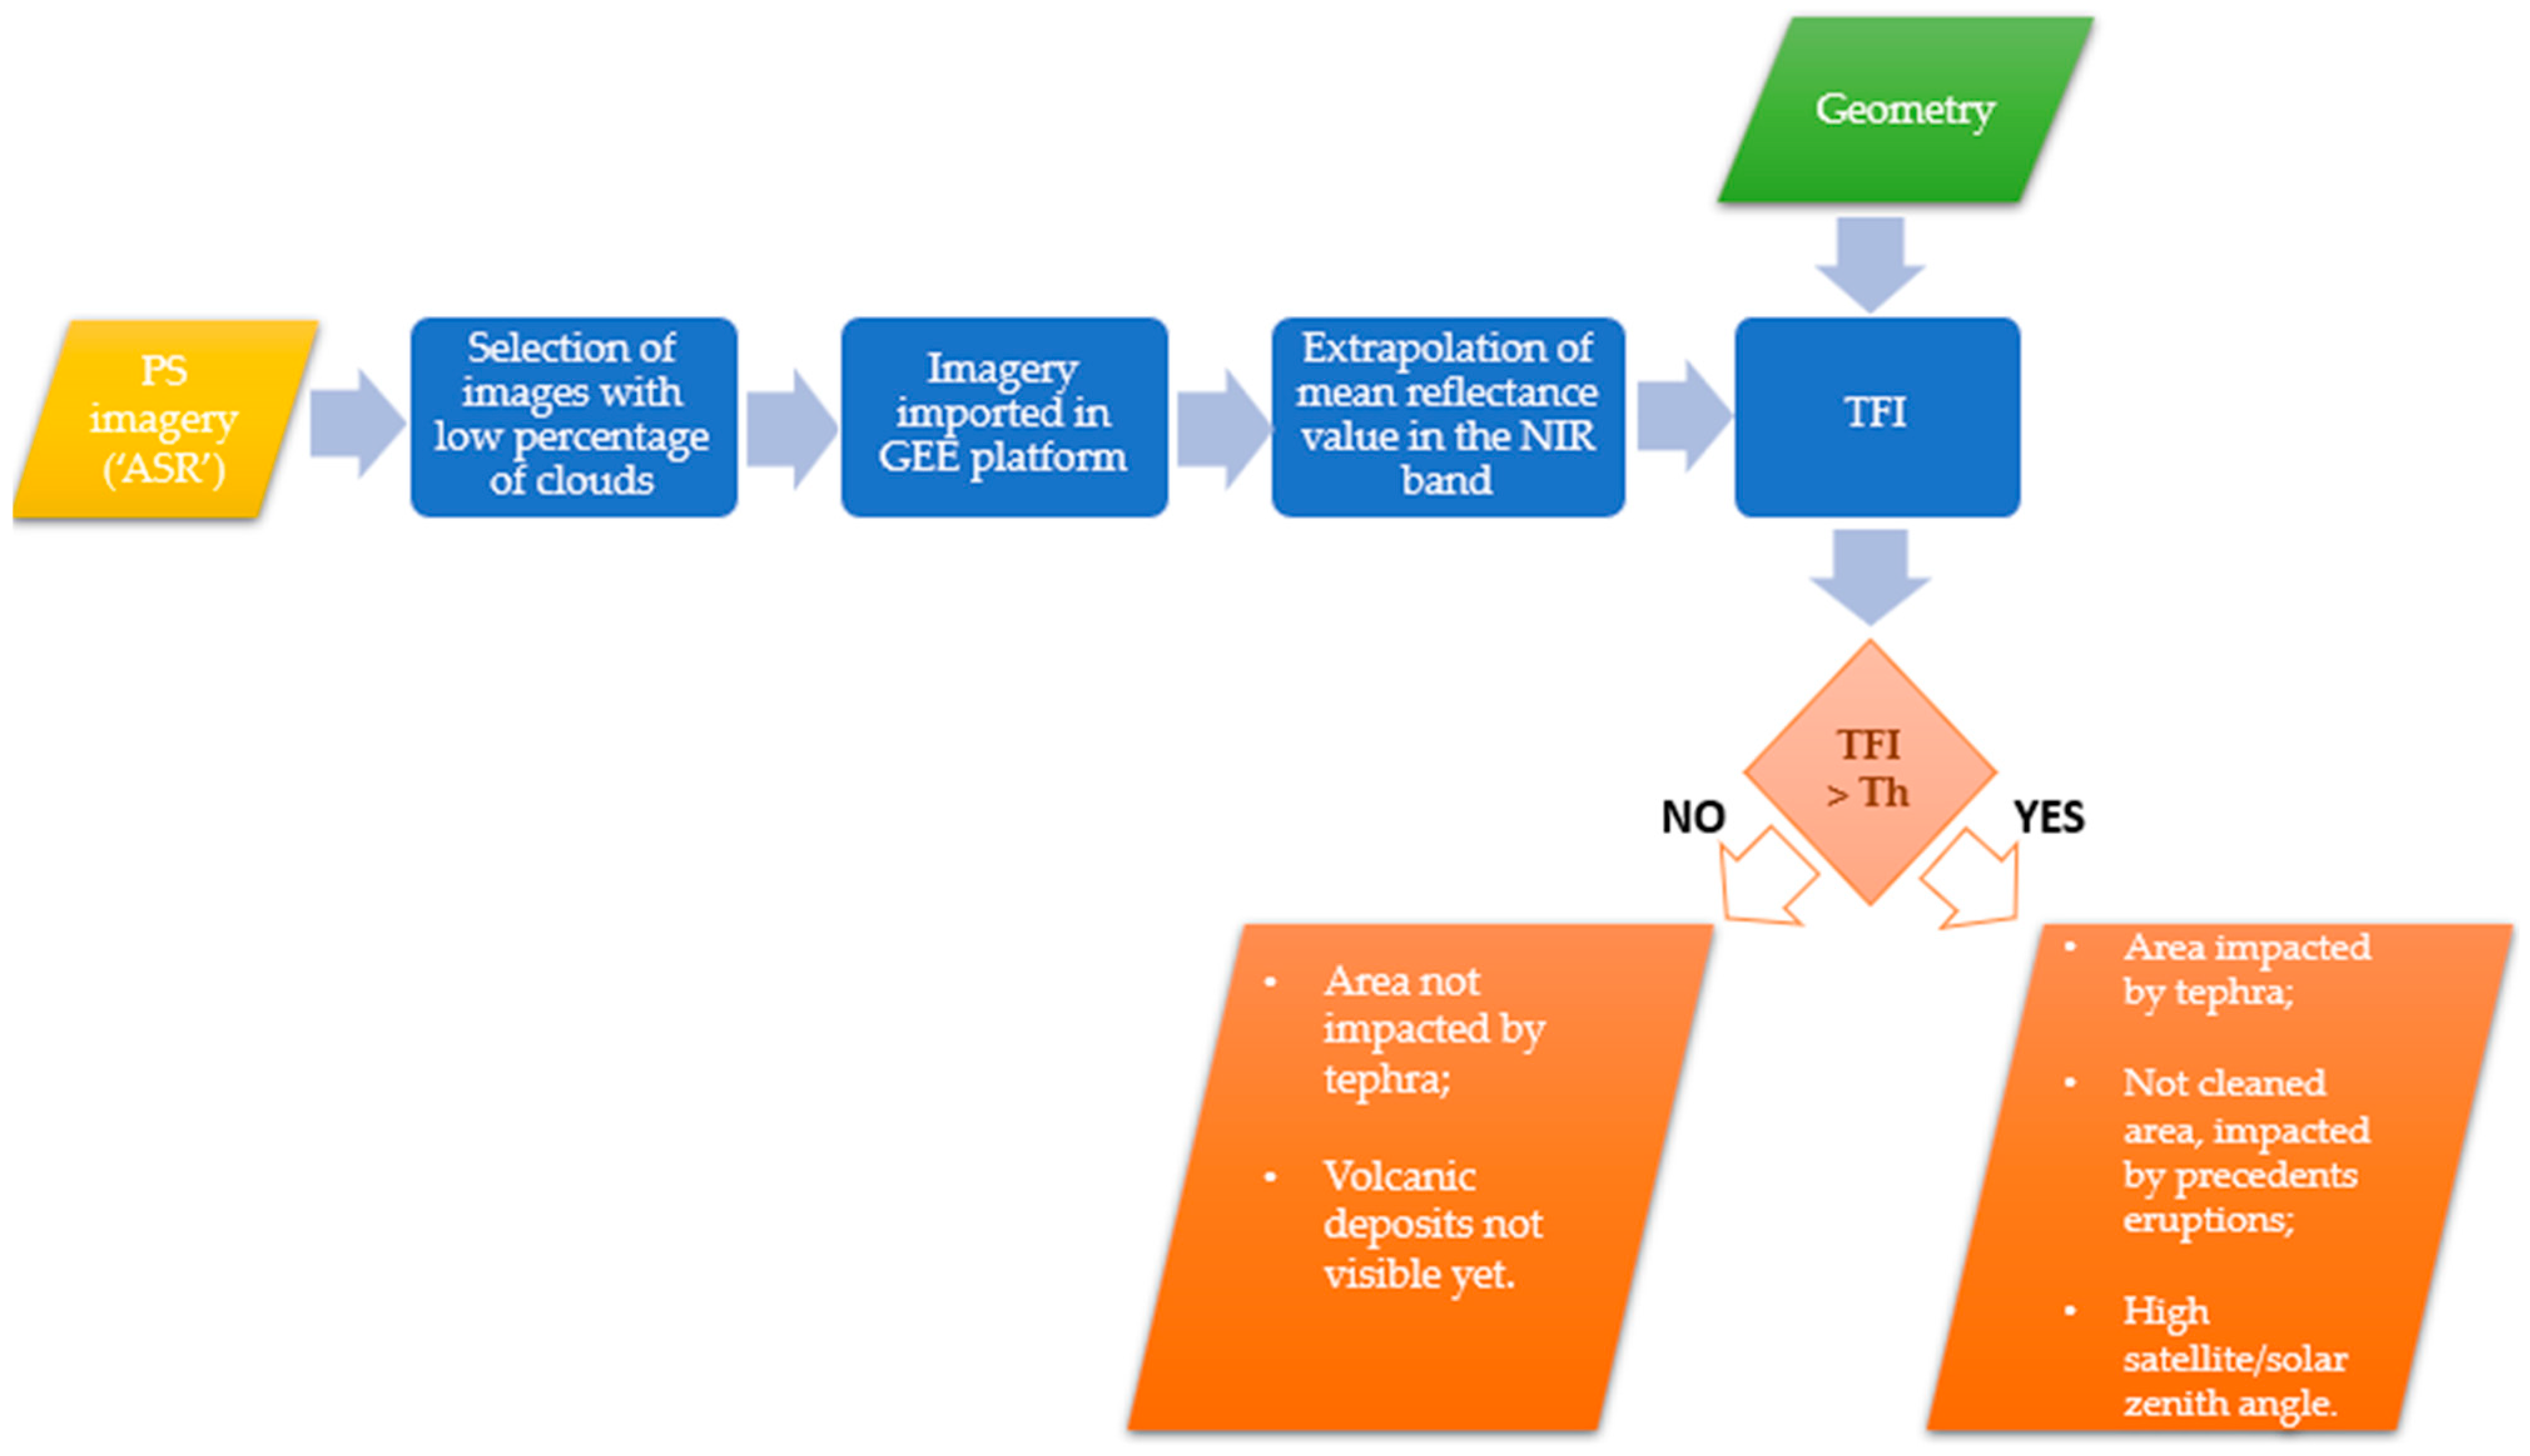
2. Materials and Methods

The techniques currently used to identify fallout deposits can prove extremely time-consuming and are unsuitable for the study of individual eruptive episodes with near-real-time results. Technological advancements and the increasing availability of high-resolution satellite imagery have recently offered new possibilities for mapping volcanic deposits related to an individual eruptive event. PlanetScope satellite imagery (PS), operated by Planet Labs Inc., is acquired from a constellation of over 180 microsatellites (‘CubeSat’ or ‘Doves’), roughly 10 × 10 × 30 cm in size (i.e., three-unit or 3U CubeSats), orbiting at an altitude of ~400 km. The constellation consists of multiple launches of groups (‘flocks’) of single satellites from 2014 to 2022, allowing on-orbit capability to improve steadily, with technology improvements being implemented at a rapid pace. The first available image dates to July 2014, acquired by the first generation of PlanetScope satellites (known as ‘Dove Classic’ or ‘PS 2’). The second generation of PlanetScope satellites (‘Dove-R’ or ‘PS2.SD’) has been in operation since November 2018, having sensor characteristics which allow excellent spectral resolution. The third and latest generation of PlanetScope satellites (known as ‘SuperDove’ or ‘PSB.SD’) is currently in orbit, providing a limited number of images with 8 separate spectral bands since 2022.
Figure 1 shows the three generations of PlanetScope imagery with related spectral bands and wavelengths, including the spectral response curves.
The main feature of PlanetScope imagery lies in its high spatial resolution (~3 m) and daily image capture rate for each point on the Earth’s surface. These characteristics, together with the policy of free access to data for study or research purposes, make PlanetScope imagery ideal for monitoring volcanic activity, as well as for studying other dynamic geophysical phenomena [36]. Several PlanetScope data products with different processing levels are available; in this work we used the orthorectified ‘Analytic Surface Reflectance’ data products with four spectral bands (RGB NIR). In addition to orthorectification, radiometric corrections are applied to correct for any sensor artifacts and transform the data to scaled at-sensor radiance.
The methodology introduced to process PlanetScope imagery is illustrated in the flowchart of Figure 2.
Firstly, PlanetScope satellite imagery in the ‘Analytic Surface Reflectance’ format was downloaded as GeoTiff and imported on the cloud-based geospatial analytic Google Earth Engine (GEE) platform, selecting those images without volcanic plume (which in general cover a large area) and with a low percentage of weather clouds (less than 25%), since clouds could alter or mask, together with other factors (e.g., snow, solar zenith angle, satellite zenith angle), the reflectance value of the ground. Among those images, we performed our computations considering only selected geometries not affected by any clouds. GEE allows users to import their own imagery and manage and process enormous volumes of data, making its use ideal for this study. Geometries, thus provided as input (Figure 2), were chosen, possibly with a progressively greater distance from the source area and localized in different points of the volcano flanks in order to analyze a larger area. We picked out quite large, paved zones, without vegetation, to distinguish the volcanic deposit. Moreover, we chose similar areas, both in terms of surface composition and texture, to have an effective comparison in terms of emissivity. For each image, we also took into account the satellite zenith angle and the solar zenith angle, available from the image properties. The objective of the proposed method was to find any variations between the pre- and post-eruptive reflectance values in the selected geometries, exploiting the different ways that different materials exhibit (in this case tephra and cement) to reflect light.
We expected to find higher variations in the average value of the NIR band after the occurrence of explosive events characterized by intense tephra fallout since this band is particularly sensitive to materials and their texture [37].
In order to magnify the temporal variations potentially observed in the NIR band, we introduced a new index, which we called the Tephra Fallout Index (TFI) to be computed for selected paved areas. This index is the result of the average as a percentage between the NIR band mean value of the date before and after the eruptive event considering those days not affected by any fallout, defined as follows:
T F I = |   R N I R e ( R N I R p d + R N I R f d ) / 2   | ( R N I R p d + R N I R f d ) / 2   × 100
where, once a geometry is defined, R N I R e is the mean reflectance value in the NIR band of the date considered, i.e., the day of eruption; R N I R p d is the mean reflectance value in the NIR band of the date prior to the eruptive event; and R N I R f d is the mean reflectance value in the NIR band for the first acquisition in the days following the eruption. All these physical quantities are computed in the selected geometry. Eventually, the methodology aims to identify a threshold (Th) for the TFI in order to spatially define those areas affected by the presence of tephra fallout. The threshold value is a dynamic limit, which we defined by observing the minimum value in each investigated area, and so it can differ between one eruptive event and another. It is, therefore, necessary to analyze the values of the same day or the day following the eruption, depending on the time of passage of the satellite and based on the quality of the image, which must be free from snow and clouds in the examined area. It is worth noting that days too distant from the eruption need to be taken with caution since the volcanic material could have been cleaned up or carried away by the action of the winds. To obtain a spatially coherent threshold value for the TFI, it is essential to consider the same pre-eruption date and post-eruption date in the whole area investigated. Moreover, the TFI value is affected by the absolute radiometric uncertainty of the PlanetScope sensor, which should be quantified on a case-by-case basis.

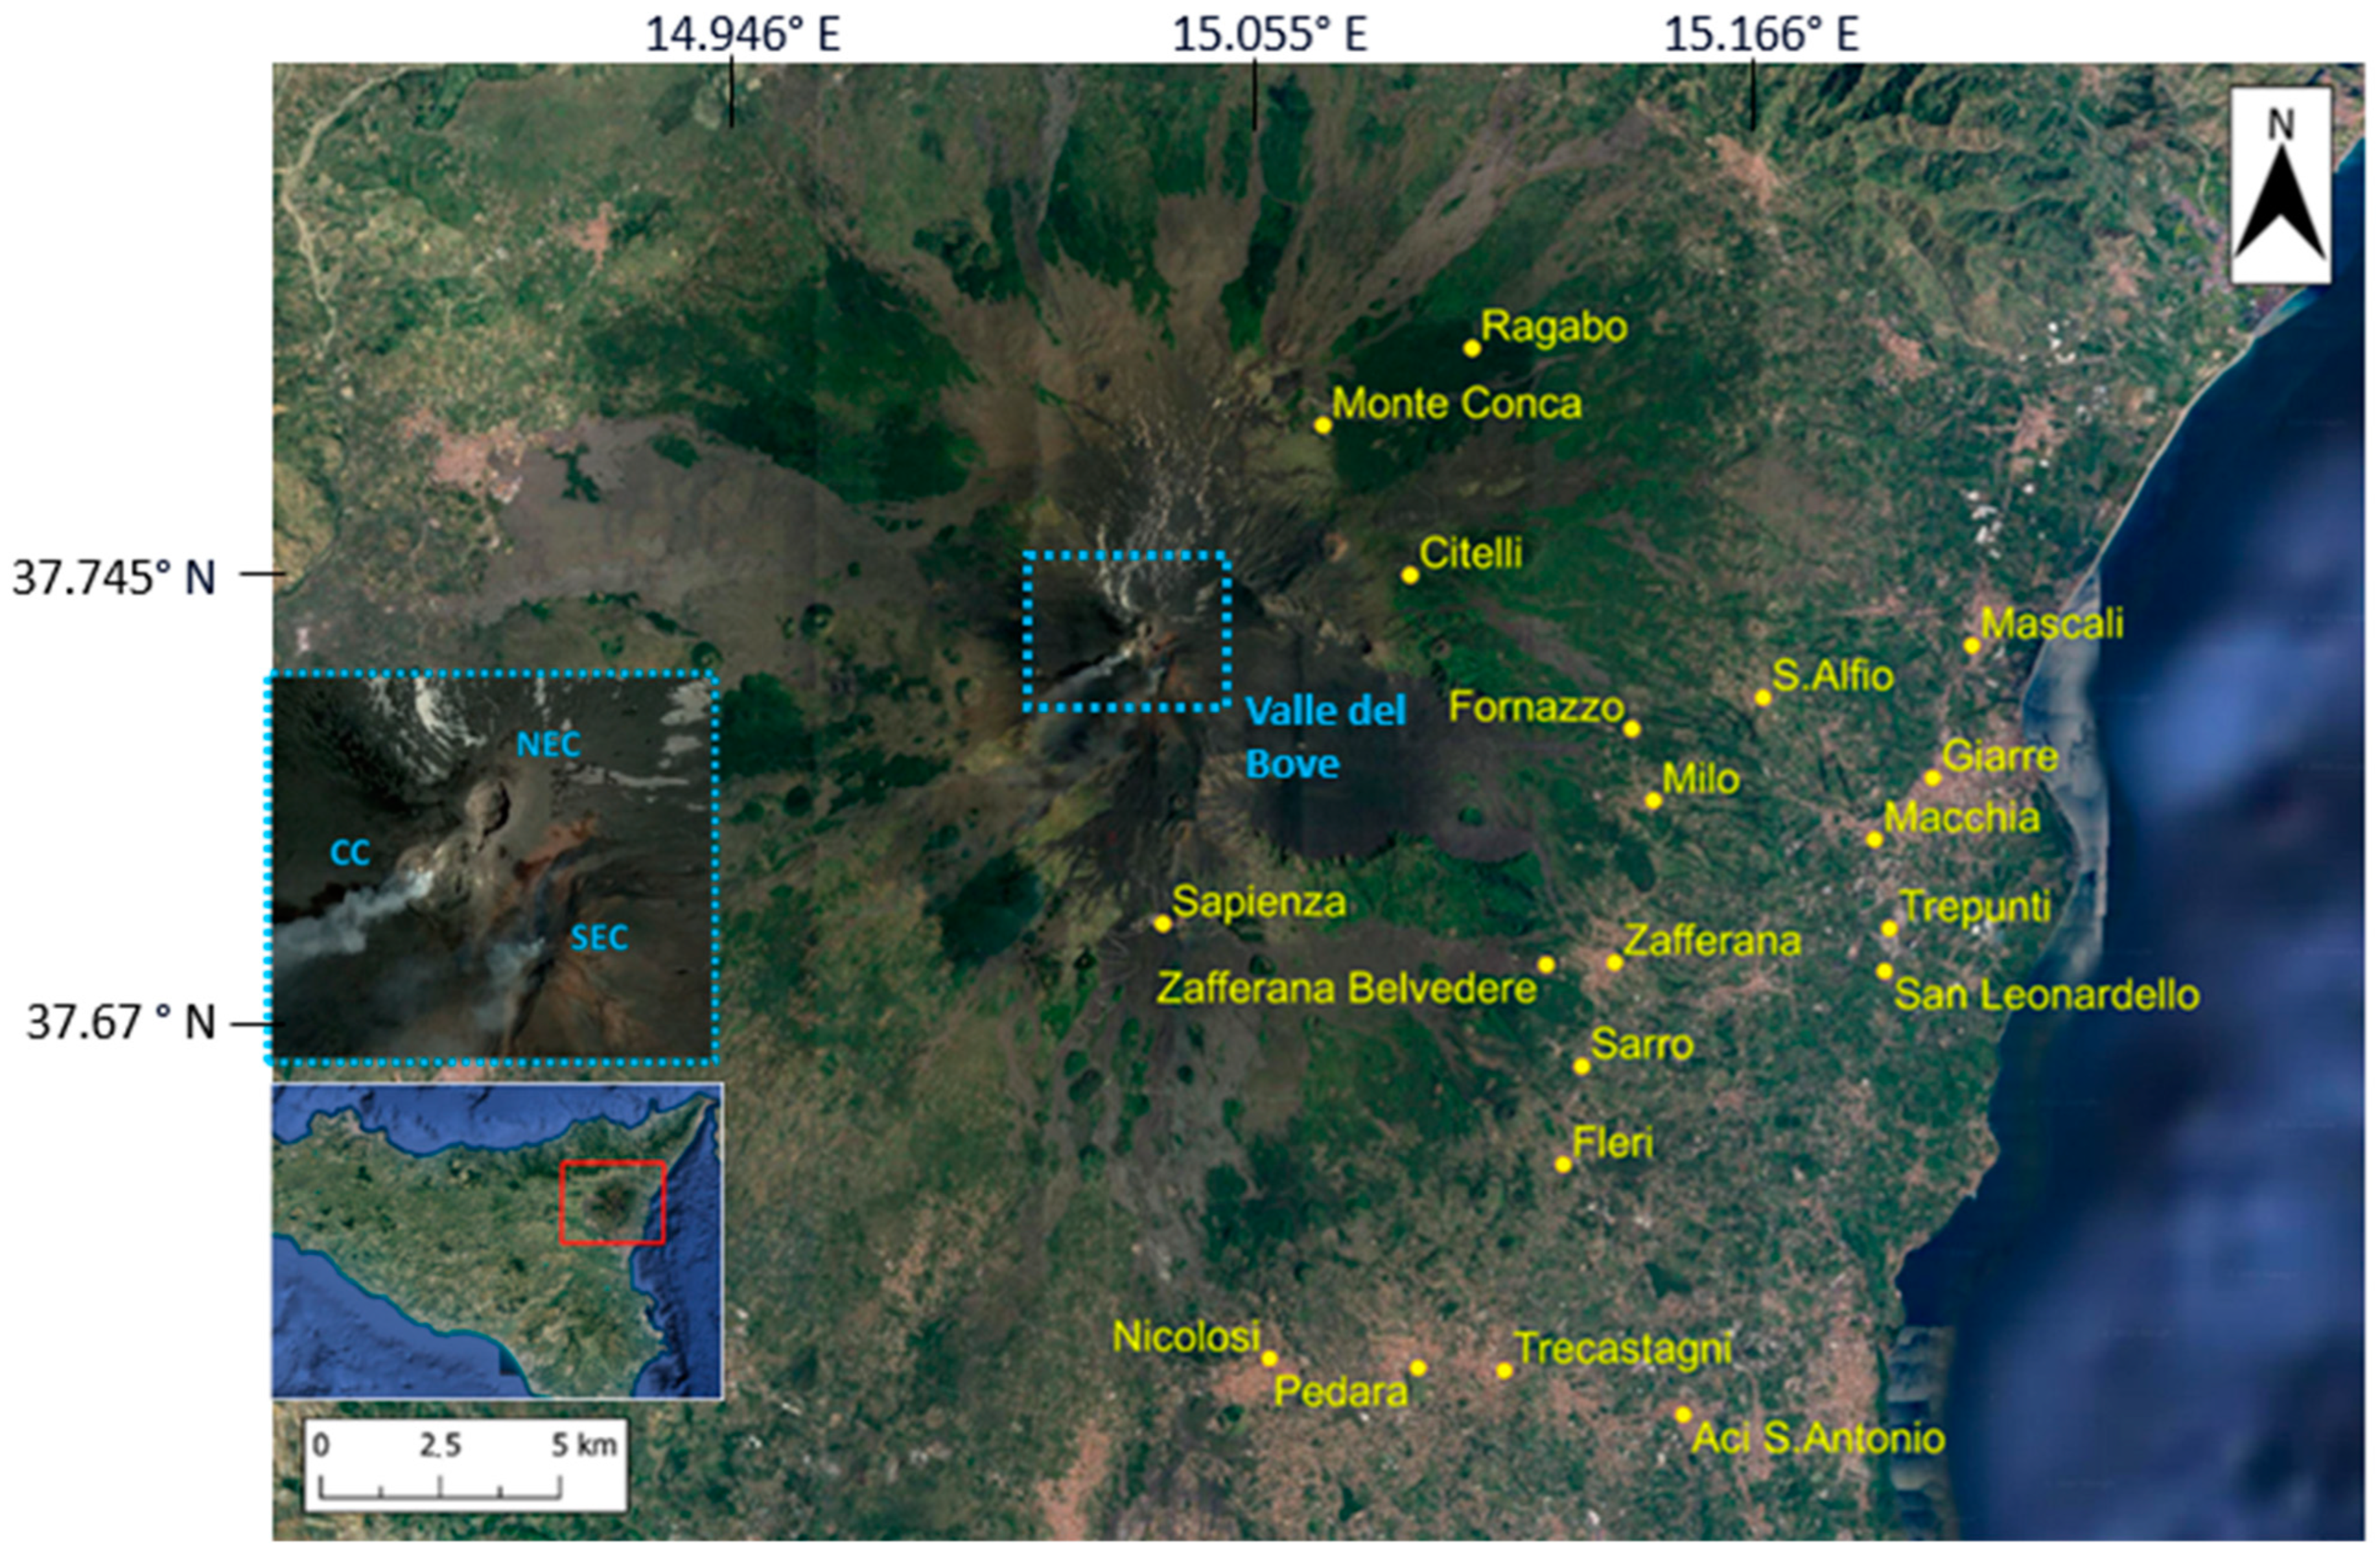
3. Case Study: Mt. Etna 2021–2022 Paroxysmal Eruptions

Mount Etna has a persistent activity characterized by degassing and explosive phenomena at its four summit craters, Voragine (VOR), Bocca Nuova (BN), North-East Crater (NEC) and South-East Crater (SEC), as well as by frequent flank eruptions [38,39,40]. Since 1989, the volcanic activity has mostly taken place at SEC, which has produced several eruptions involving multiple eruptive episodes, defined as ‘episodic’ eruptions [41,42], characterized by long-lived episodic activity (e.g., [43]). Each episode lasts a few hours and is characterized by explosive activity ranging from powerful Strombolian activity to lava fountaining [44]. Usually, violent Strombolian activity produces both weak plumes that last from hours to months and eruptive columns up to 15 km a.s.l., along with associated tephra falls extending several tens of kilometers from the vent [45,46], often accompanied by short-lasting lava overflows from the crater rim [45]. Several paroxysms have occurred at the summit craters over the last decades. Between 2011 and 2013, more than 50 eruptions of this type were recorded from the SEC [47]. In 2015, the paroxysmal episodes at the Voragine crater generated an eruptive column up to 15 km a.s.l., defined as a sub-Plinian eruption. In this type of eruption, the contribution in terms of tephra can be very significant, producing considerable volumes [48,49,50]. In 2019, several Strombolian and effusive eruptions affected the South-East Crater, which then renewed activity in the spring of 2020, with Strombolian activity leading to four major episodes in December of the same year.
For this study, we consider the eruptions that occurred in 2021, when the SEC was affected by several paroxysmal episodes [47,51], often more times within a day. We also benefited from numerous ground-based data useful to validate our satellite-based results. Between February and April 2021, 17 paroxysms occurred, the last one being the longest of the entire series (540 min). During these episodes, the eruptive column reached up to 11 km a.s.l., leading to the dispersion of ashes and lapilli up to hundreds of km from the point of emission, as well as to the fall of bombs coarser than 15 cm at more than 7 km away and lava flows that affected the Valle del Bove and the southern flank of the volcano [52]. After a break of about one month, the paroxysmal activity resumed on the night between 18 and 19 May and continued until the end of 2021, with interspersed episodes of inactivity, concluding in February 2022 with two very violent explosive events on 10 and 21 February.
We analyzed about one hundred PlanetScope images from February to October 2021 (available in the Supplementary Material), considering the villages located on the north-east, east, south-east, and south flanks of the volcano (Figure 3), which were the most affected by tephra fallout in 2021. Areas adjacent to the summit craters of Etna and more distal areas were chosen to have an overall view of the distribution of the tephra deposit.
We selected those images that were not influenced by the volcanic plume passage and had a low percentage of clouds, since clouds could alter or mask the reflectance value of the ground. We imported the images in the GEE platform. In the case of cloudy images, we only considered locations where the area of interest had no clouds. The same reasoning was applied to the areas covered by snow, focusing mainly on the areas located on the north-east flank of the volcano due to their altitude, which could alter the reflectance value too. The chosen PlanetScope images were uploaded to Google Drive and imported individually in the “Assets” section of Google Earth Engine, to which the platform is connected. Since the analyzed area includes about 400 km2, multiple PlanetScope images were often processed for a single date. Thus, we defined a geometry for each paved area of interest in a specific village and calculated the mean reflectance value in the NIR band and the Tephra Fallout Index.
As we can see from Figure 4, showing pictures of Piazza del Duomo (Giarre), as an example of a paved area we analyzed, before and after the eruptive event of 7 March 2021, the reflectance of the square changes with respect to both the color and the texture of the fallout. The two pictures shown in Figure 4 are exemplificative of this study, since the square changes its appearance and its reflectance significantly when entirely covered by the tephra. Moreover, we chose specific areas based on the INGV-OE bulletins (www.ct.ingv.it; accessed on 22 November 2023), which also report field data for some villages. Other examples of selected areas are the parking in front of Rifugio Citelli, Rifugio Sapienza, and Monte Conca or the one in front of the Hotel Belvedere (Zafferana Etnea).

4. Results

We found a general decrease in the reflectance values and high values of the TFI in correspondence with the eruptive episodes. Taking the paved area in Nicolosi as an example, after the eruptive episode of 20 June 2021, there is a variation in the TFI from ~0.05 (5%) (considering the day before and after the eruption) to 0.13 (13%) (in correspondence with the eruption) (Figure 5).
Figure 5 shows the TFI normalized between 0 and 1 for Nicolosi, Giarre, and Sapienza. We observed higher values in correspondence with the days of eruption or the following day (Figure 5), expecting a higher surface coverage density here as well.
In the Nicolosi TFI time series it can be observed how all the days affected by the eruptive activity (in red) exhibit normalized TFI values above ~0.3, while the others are below this value. Some exceptions to this rule are due to high solar zenith angles, the lack of cloud-free satellite data on the immediately preceding or succeding day with respect to the eruption, or proximity to the eruption date. Indeed, days too distant from the eruption need to be considered with caution, since the volcanic material could have been cleaned up or carried away by the action of the winds. As an example, on 28 March and 8 April, two high values of TFI occur in correspondence with high values of solar zenith angle (about 40 degrees), higher than the same values found in the other images (30 degrees).
As for the Giarre TFI time series, we observed that the days affected by the eruptive activity are above ~0.5, while the others are below this value. In addition, in this case, on 1 April, we found a high value of TFI in correspondence with a high solar zenith angle (about 40 degrees).
In the Rifugio Sapienza TFI time series we observed how all the days affected by the eruptive activity (in red) are above ~0.6, while the others are below this value. Again, on 28 March and 9 April, two high TFI values are characterized by a solar zenith angle of approximately 40 degrees. Moreover, from Figure 5, we can see that the eruption that occurred on 17 June also impacted the following date (18 June), characterized by a slightly lower value in comparison, which could represent the presence of volcanic tephra deposit not yet cleaned.
To estimate the accuracy of the TFI calculation, we verified the absolute radiometric uncertainty in the ASR images acquired on Mt. Etna during 2021. From the technical note on the quality assessment for PlanetScope (DOVE) provided by ESA (https://earth.esa.int/eogateway/search?text=planetscop; accessed on 22 November 2023), we found that the biggest uncertainty for the NIR band in the two-stripe ‘Dove Classic’ (δ) is of 6.5%, which leads to 2 × δ ≈ 13% of uncertainty in the TFI values.
After temporal coherence on each area analyzed was verified, we verified spatial coherence too, creating normalized TFI maps for each eruption and reporting all the analyzed areas. For a more targeted analysis, various data were cross-referenced to have a visual comparison. The data were obtained from the INGV-OE bulletins (www.ct.ingv.it; accessed on 22 November 2023) and from the SEVIRI satellite sensor available on the Eumetview platform (https://view.eumetsat.int/; accessed on 22 November 2023), which allows the visualization of the dispersion of volcanic clouds from 2020 to the present, providing updates every 15 min through the volcanic ash RGB product, where the ash is represented in red color. From the Eumetview platform, the main direction of the volcanic plume can be observed, and the areas that could have been involved are immediately noticed. The best view of the plume from the satellite was selected, considering the time of the eruption, as well as any changes in its direction. By cross-referencing the information from PlanetScope imagery with that from SEVIRI, we were able to extrapolate a threshold to distinguish the presence of volcanic tephra in a certain area, rather than in another for the same eruptive event.
Three lava fountains that occurred at Mt Etna are detailed below, reporting for each eruption the TFI value calculated on each paved area (reported in brackets). For each geometry, we made a punctual calculation of the index and compared the result with the other areas where the same pre- and post- eruptive dates are available. Indeed, the TFI value is not reported on the map for the villages covered by clouds or snow or cut off in one or both satellite PS image.
On the map inset, the corresponding RGB product retrieved from Eumetview and used to draw the volcanic plume profile is shown. The delimitation of the plume profile helps to immediately visualize the areas potentially involved, considering that there may not be a direct match between the volcanic cloud and the volcanic deposit on the ground.

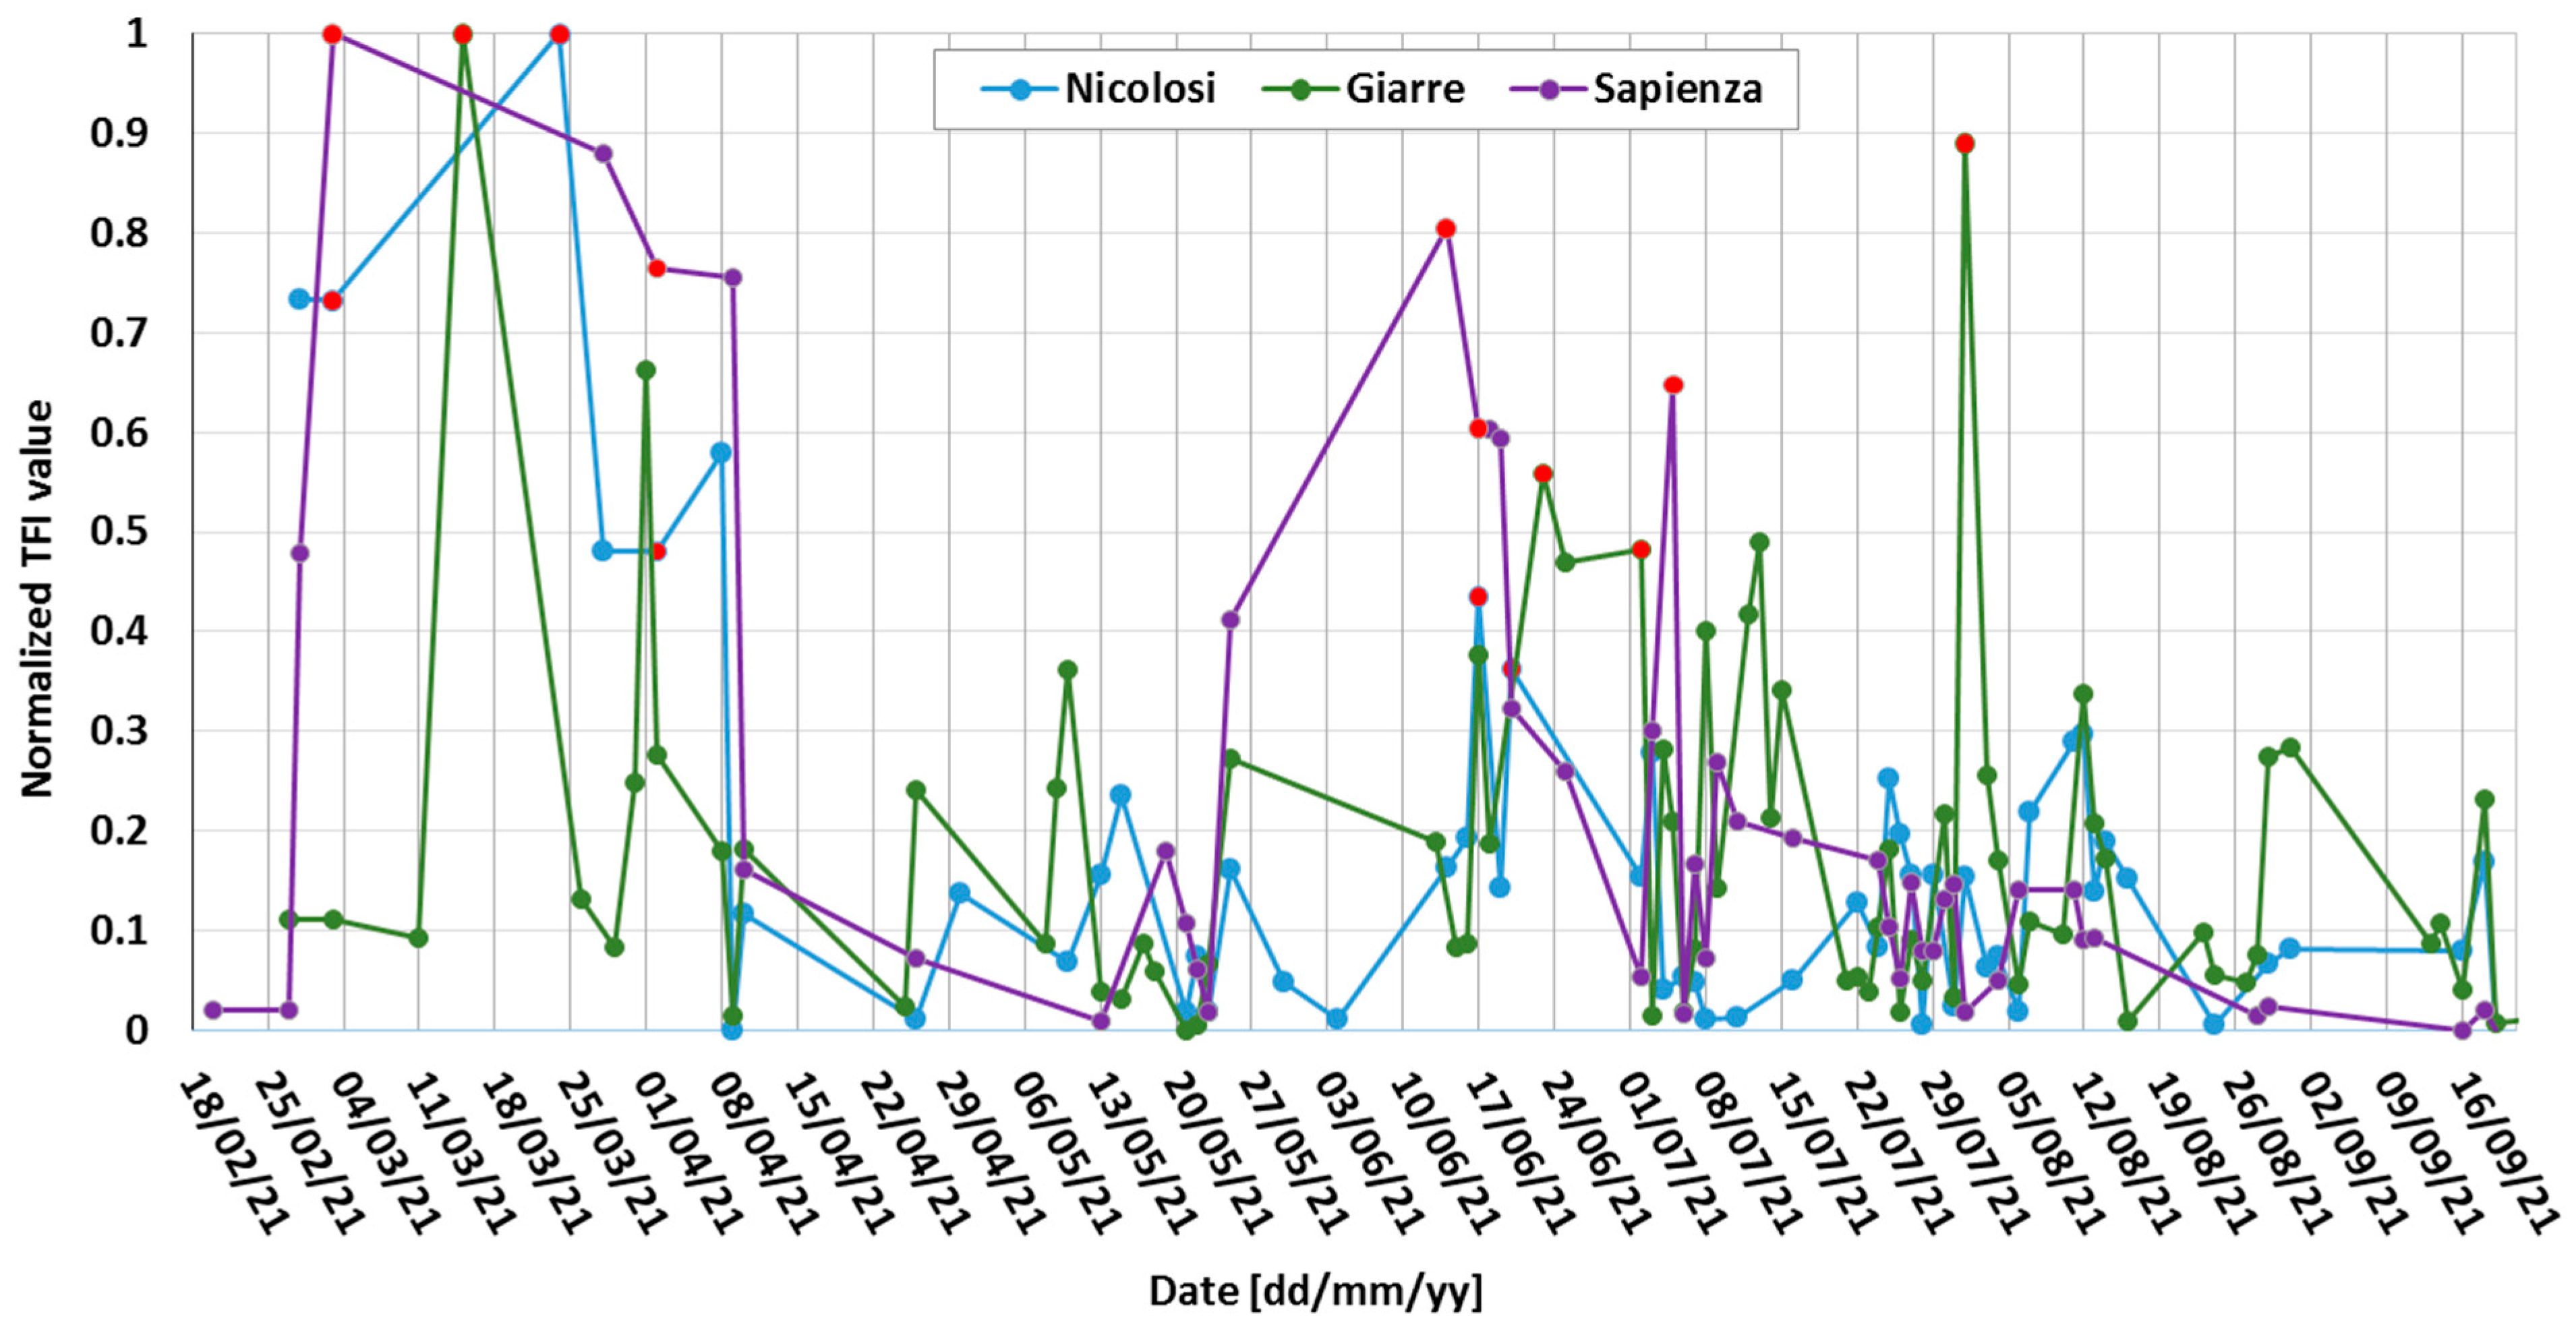
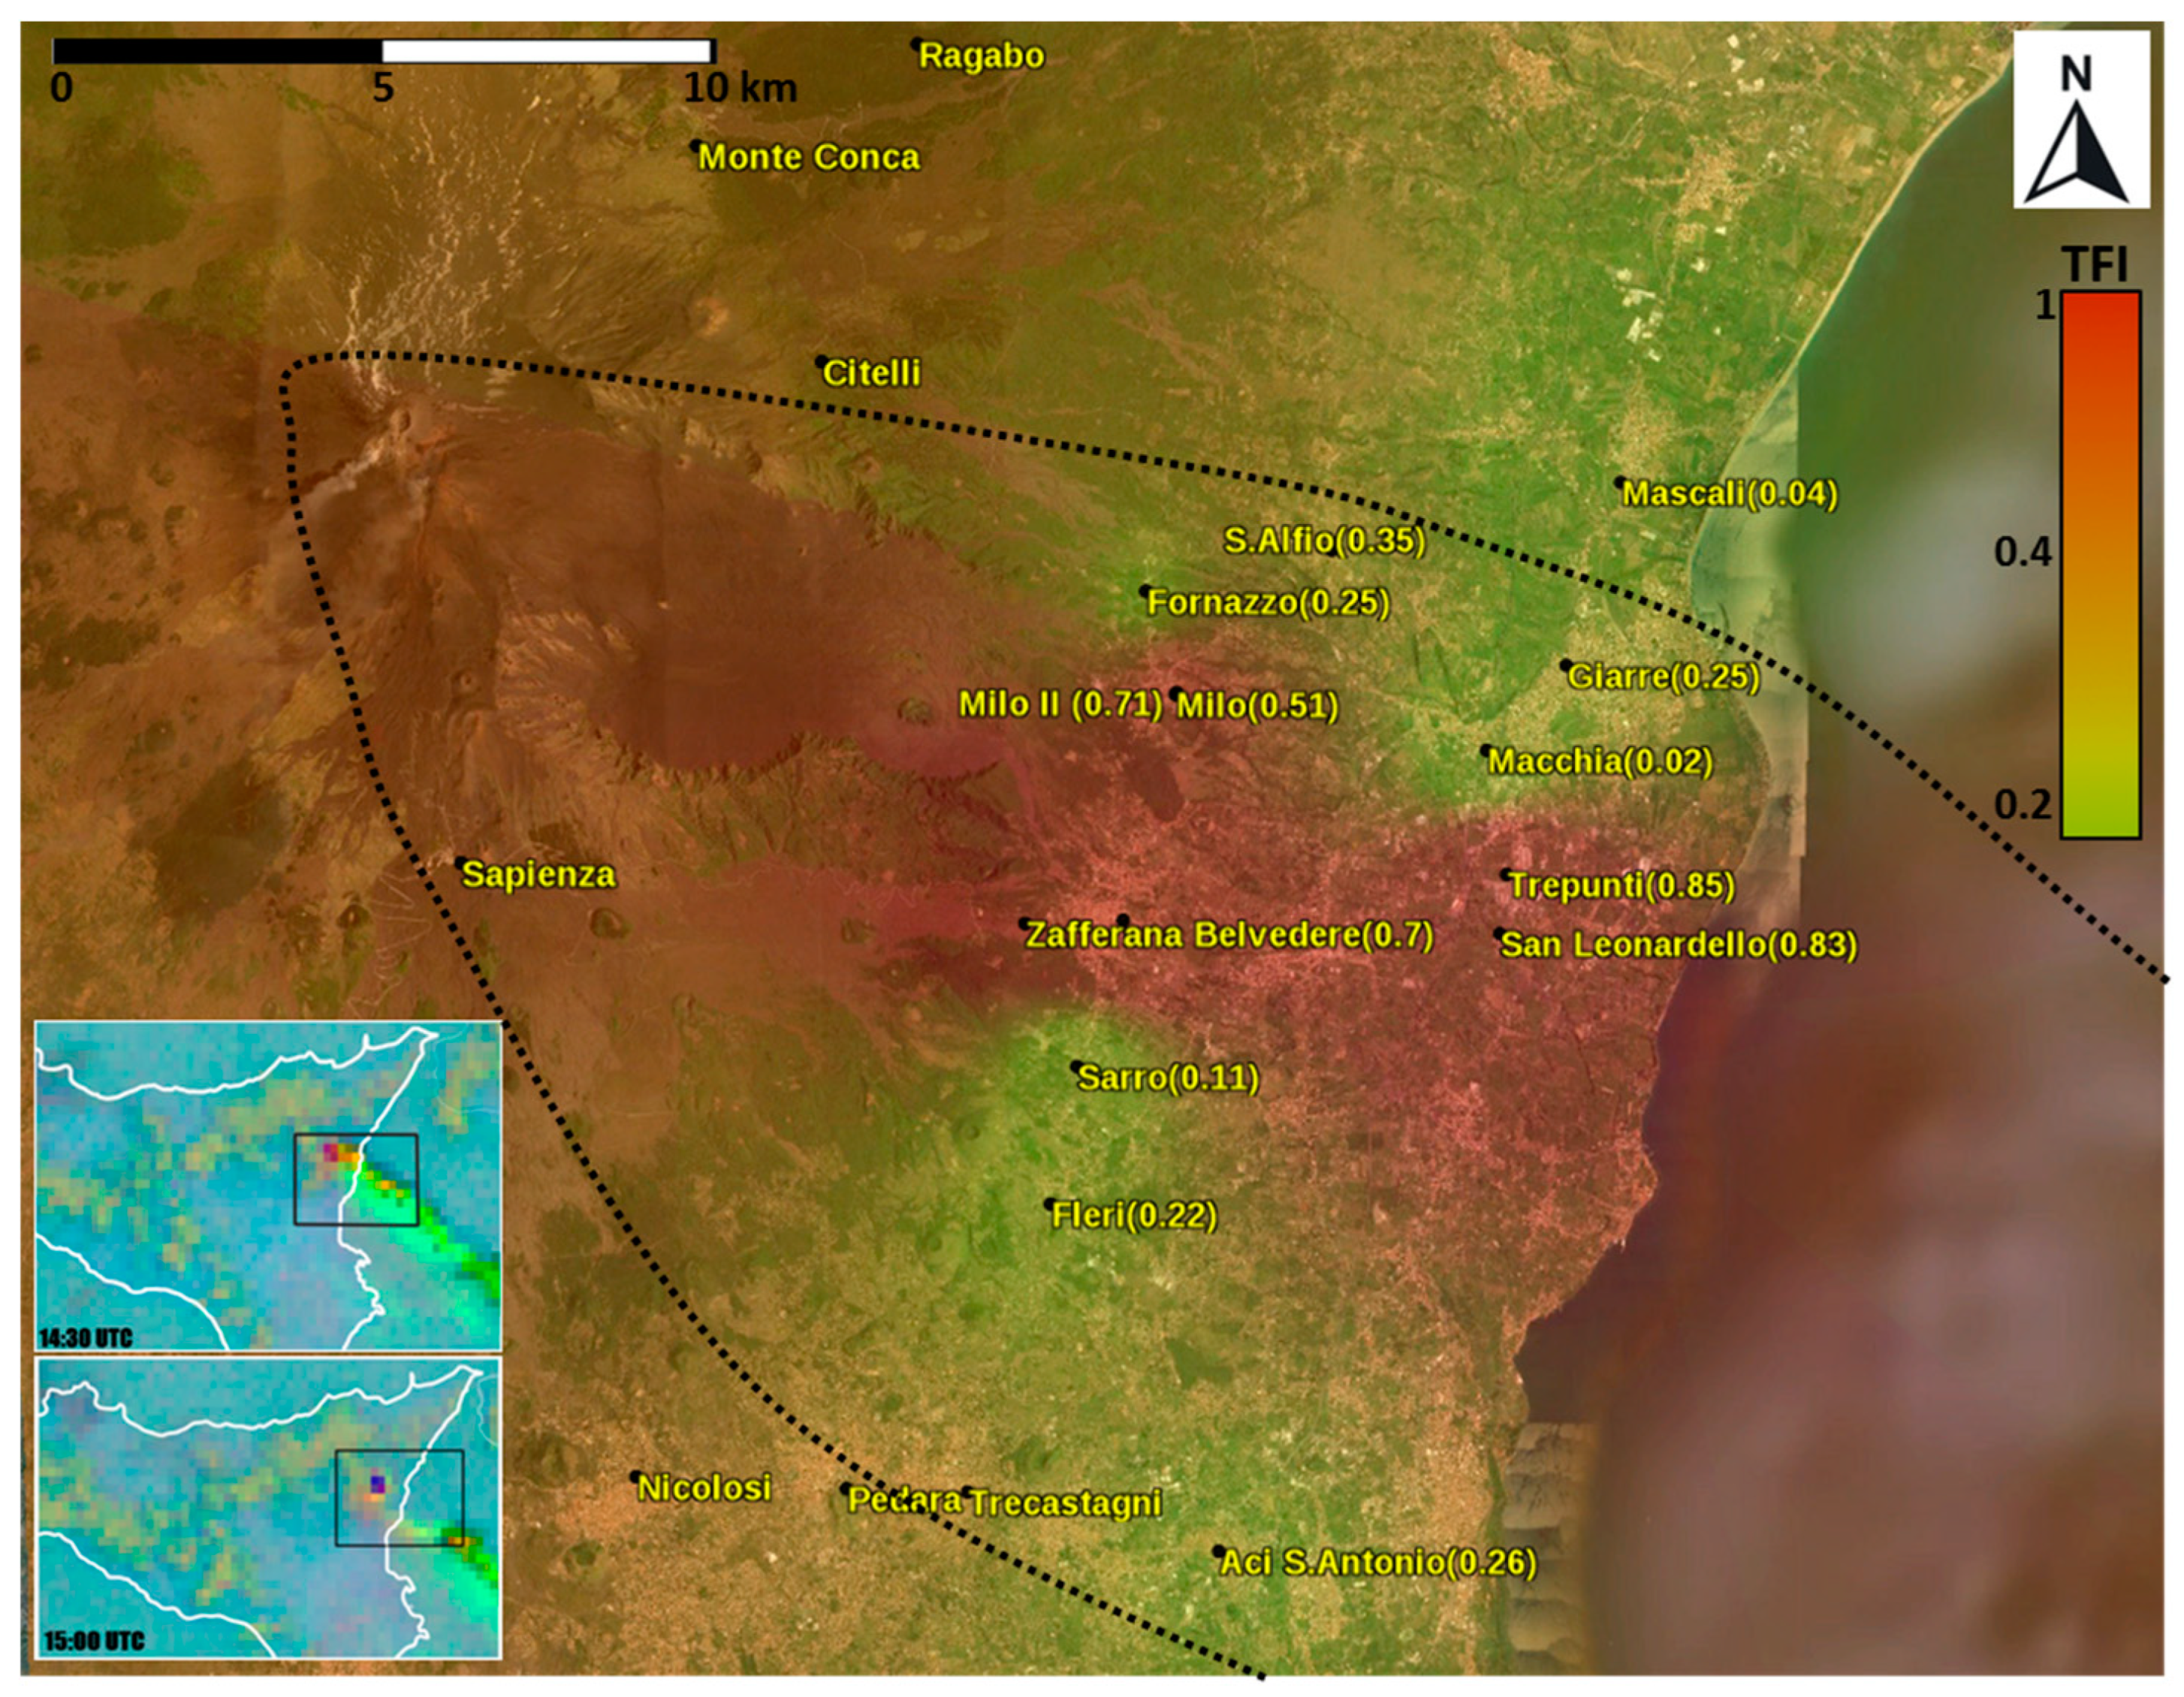
4.1. 2 March 2021 Paroxysmal Eruption

During an eruptive event, even if short-lived, conditions may vary in terms of wind direction and speed, and this will inevitably affect the ash fallout. Figure 6 reports the TFI results for the eruption that occurred on 2 March 2021. On this date, at 10:45 UTC, weak Strombolian activity started at the SEC. This activity increased from 11:34 UTC with a consequent emission of tephra, and at 12:24 UTC, the Strombolian activity suddenly changed to a lava fountain, producing an eruptive column that reached a height of approximately 9000 m from the top of the volcano [23,53] and ended at 14:50 UTC. The volcanic cloud dispersed on the southern slope of the volcano causing ash and lapilli fallout in the villages of Nicolosi, Aci Sant’Antonio, Pedara, and finally in Catania. The lava fountain activity at the SEC ceased in the afternoon. The total volume of the erupted material on 2 March is equal to 1.03 × 10⁶ m3 [47]. The density map reporting the normalized TFI values related to the eruption is compared with the corresponding ash RGB products calculated from SEVIRI and available on Eumetview (Figure 6). In this example, two different frames are reported to highlight the change in the direction of the plume, thus increasing the area involved by the plume passage (dashed black line). To study this eruption, the image of 3 March 2021 was taken into consideration for the TFI calculation, as the eruption occurred in the afternoon.
Reporting the data related to the eruption on 2 March 2021 (Figure 6), we found higher normalized TFI values (shown in red on the map) in the geometries located at the middle of the volcanic plume profile, with still appreciable values in the south. From the observation of the ash RGB products it is possible to notice that the ash (in red-orange) changes direction from 14:30 UTC to 15:00 UTC, involving these two areas and confirming the success of our method. Here, the visual comparison with data from SEVIRI is particularly important to verify the quality of our results, allowing us to better constrain the areas affected by the tephra fallout, since the plume does not follow a clear direction. In this example, it is not possible to define a threshold to distinguish the areas affected by the tephra fallout because of missing data in the northern part of Etna, which is not involved in the ash fallout.

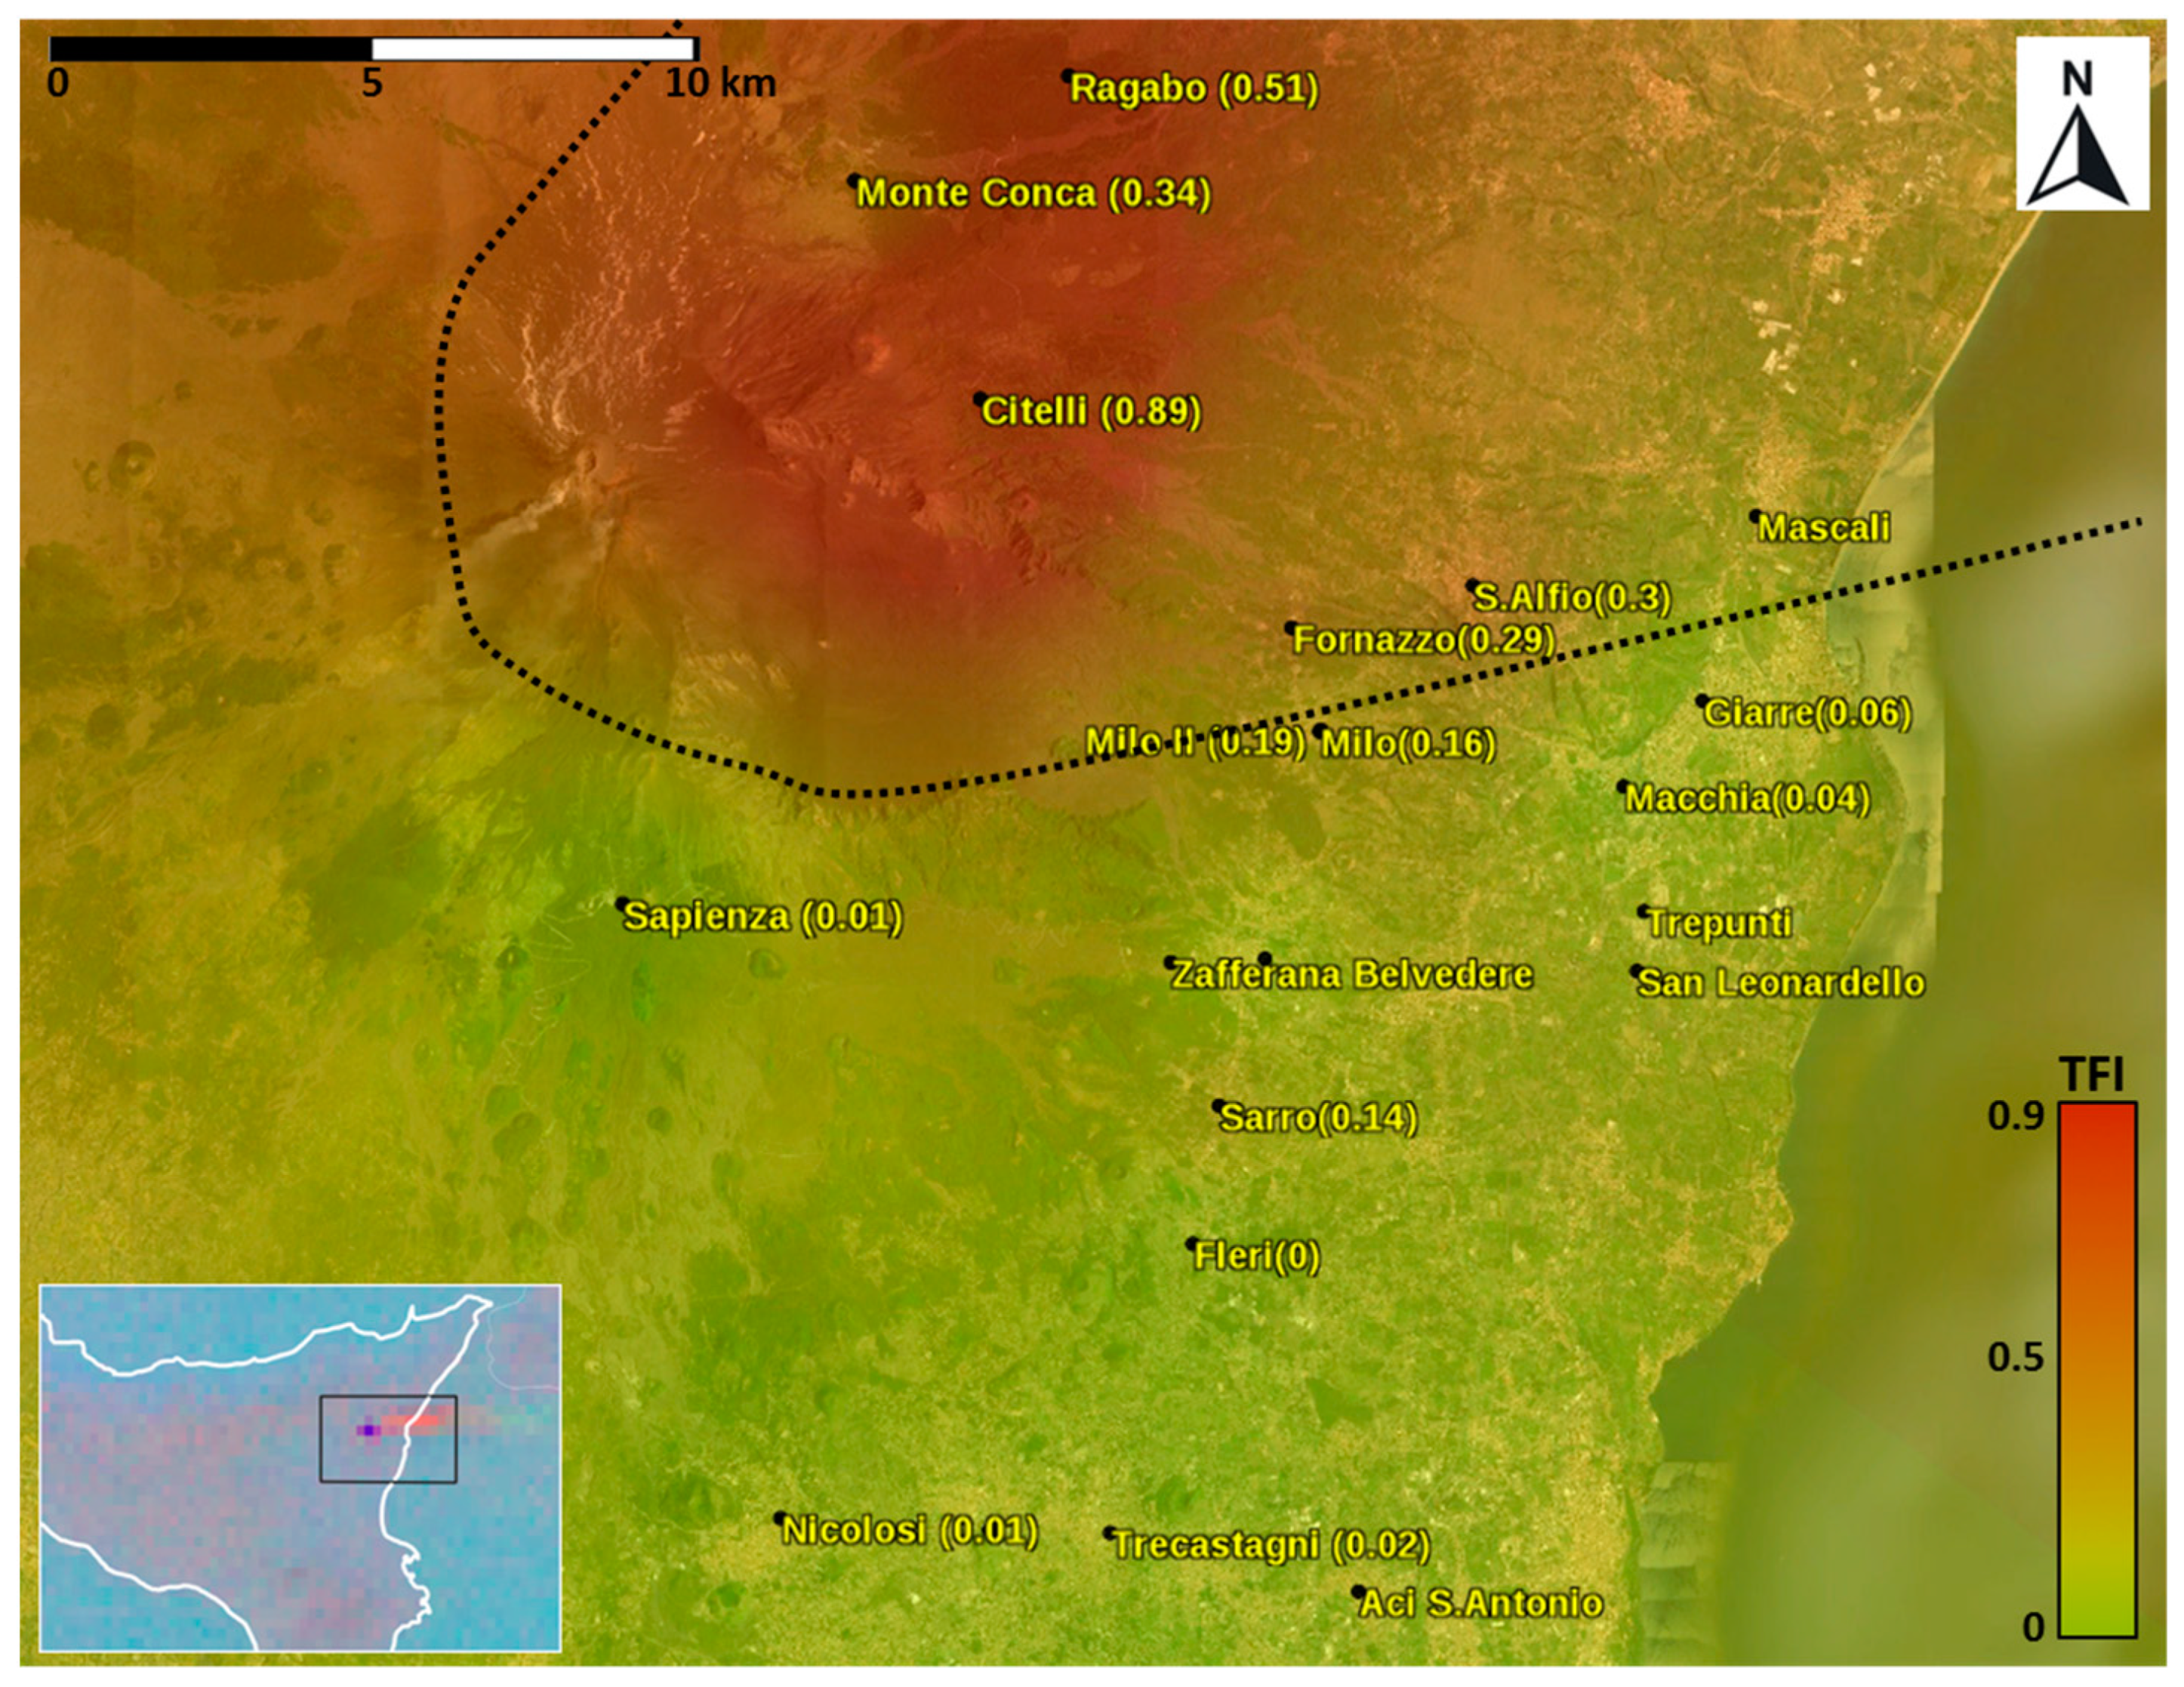
4.2. 22 May 2021 Paroxysmal Eruption

A resumption of Strombolian activity was registered at the SEC on 19 May, after more than a month of inactivity. On 22 May 2021 at 08:14 UTC, sporadic intra-crater explosions were observed and, after about an hour, the explosive activity increased, with weak ash emissions, dispersing rapidly. The activity increased again in the early evening hours, accompanied by abundant emission of tephra. After having recorded a further increase in Strombolian activity, it evolved to a lava fountain at 20:27 UTC [47], and the emitted products dispersed in the ENE direction. This eruptive phase ended at 22:08 UTC with the formation of two lava overflows, fed by the crater, one dispersing in the SW direction and the other in the E direction. A few hours after the end of the lava fountain, starting from 01:51 UTC, a new resumption of explosive activity was observed at the SEC, with abundant emission of ash, which dispersed in the E direction. This phase continued until approximately 02:03 UTC, then moved on to discontinuous explosions with weak emissions of ash, which quickly dispersed. The total volume of material emitted by this eruption, with a maximum height of the eruptive column of approximately 8 km, is equal to 0.87 × 10⁶ m3 [47].
The density map reporting the normalized TFI values related to the eruption that occurred on 22 May 2021 is reported in Figure 7, along with the corresponding ash RGB product calculated from the SEVIRI sensor on the same date by Eumetview. To study this eruption, the image of 23 May 2021 was taken into consideration, as the eruption occurred overnight.
From Figure 7, it can be observed that the villages affected by the passage of the ash cloud have a higher normalized TFI value than the other areas, ranging from 0.29 (Fornazzo) to 0.89 (Citelli), whereas the other paved areas show values from 0.19 (Milo) to 0 (Fleri). In the north-east area, we therefore find the highest values, confirming the direction of the dispersion of the products emitted, as reported in the bulletin on the INGV-OE website related to that day. Among the localities affected by the passage of the volcanic cloud, Fornazzo is the one which presents a lower percentage, constituting the threshold limit value for this eruption among the areas on which the calculation could be performed.

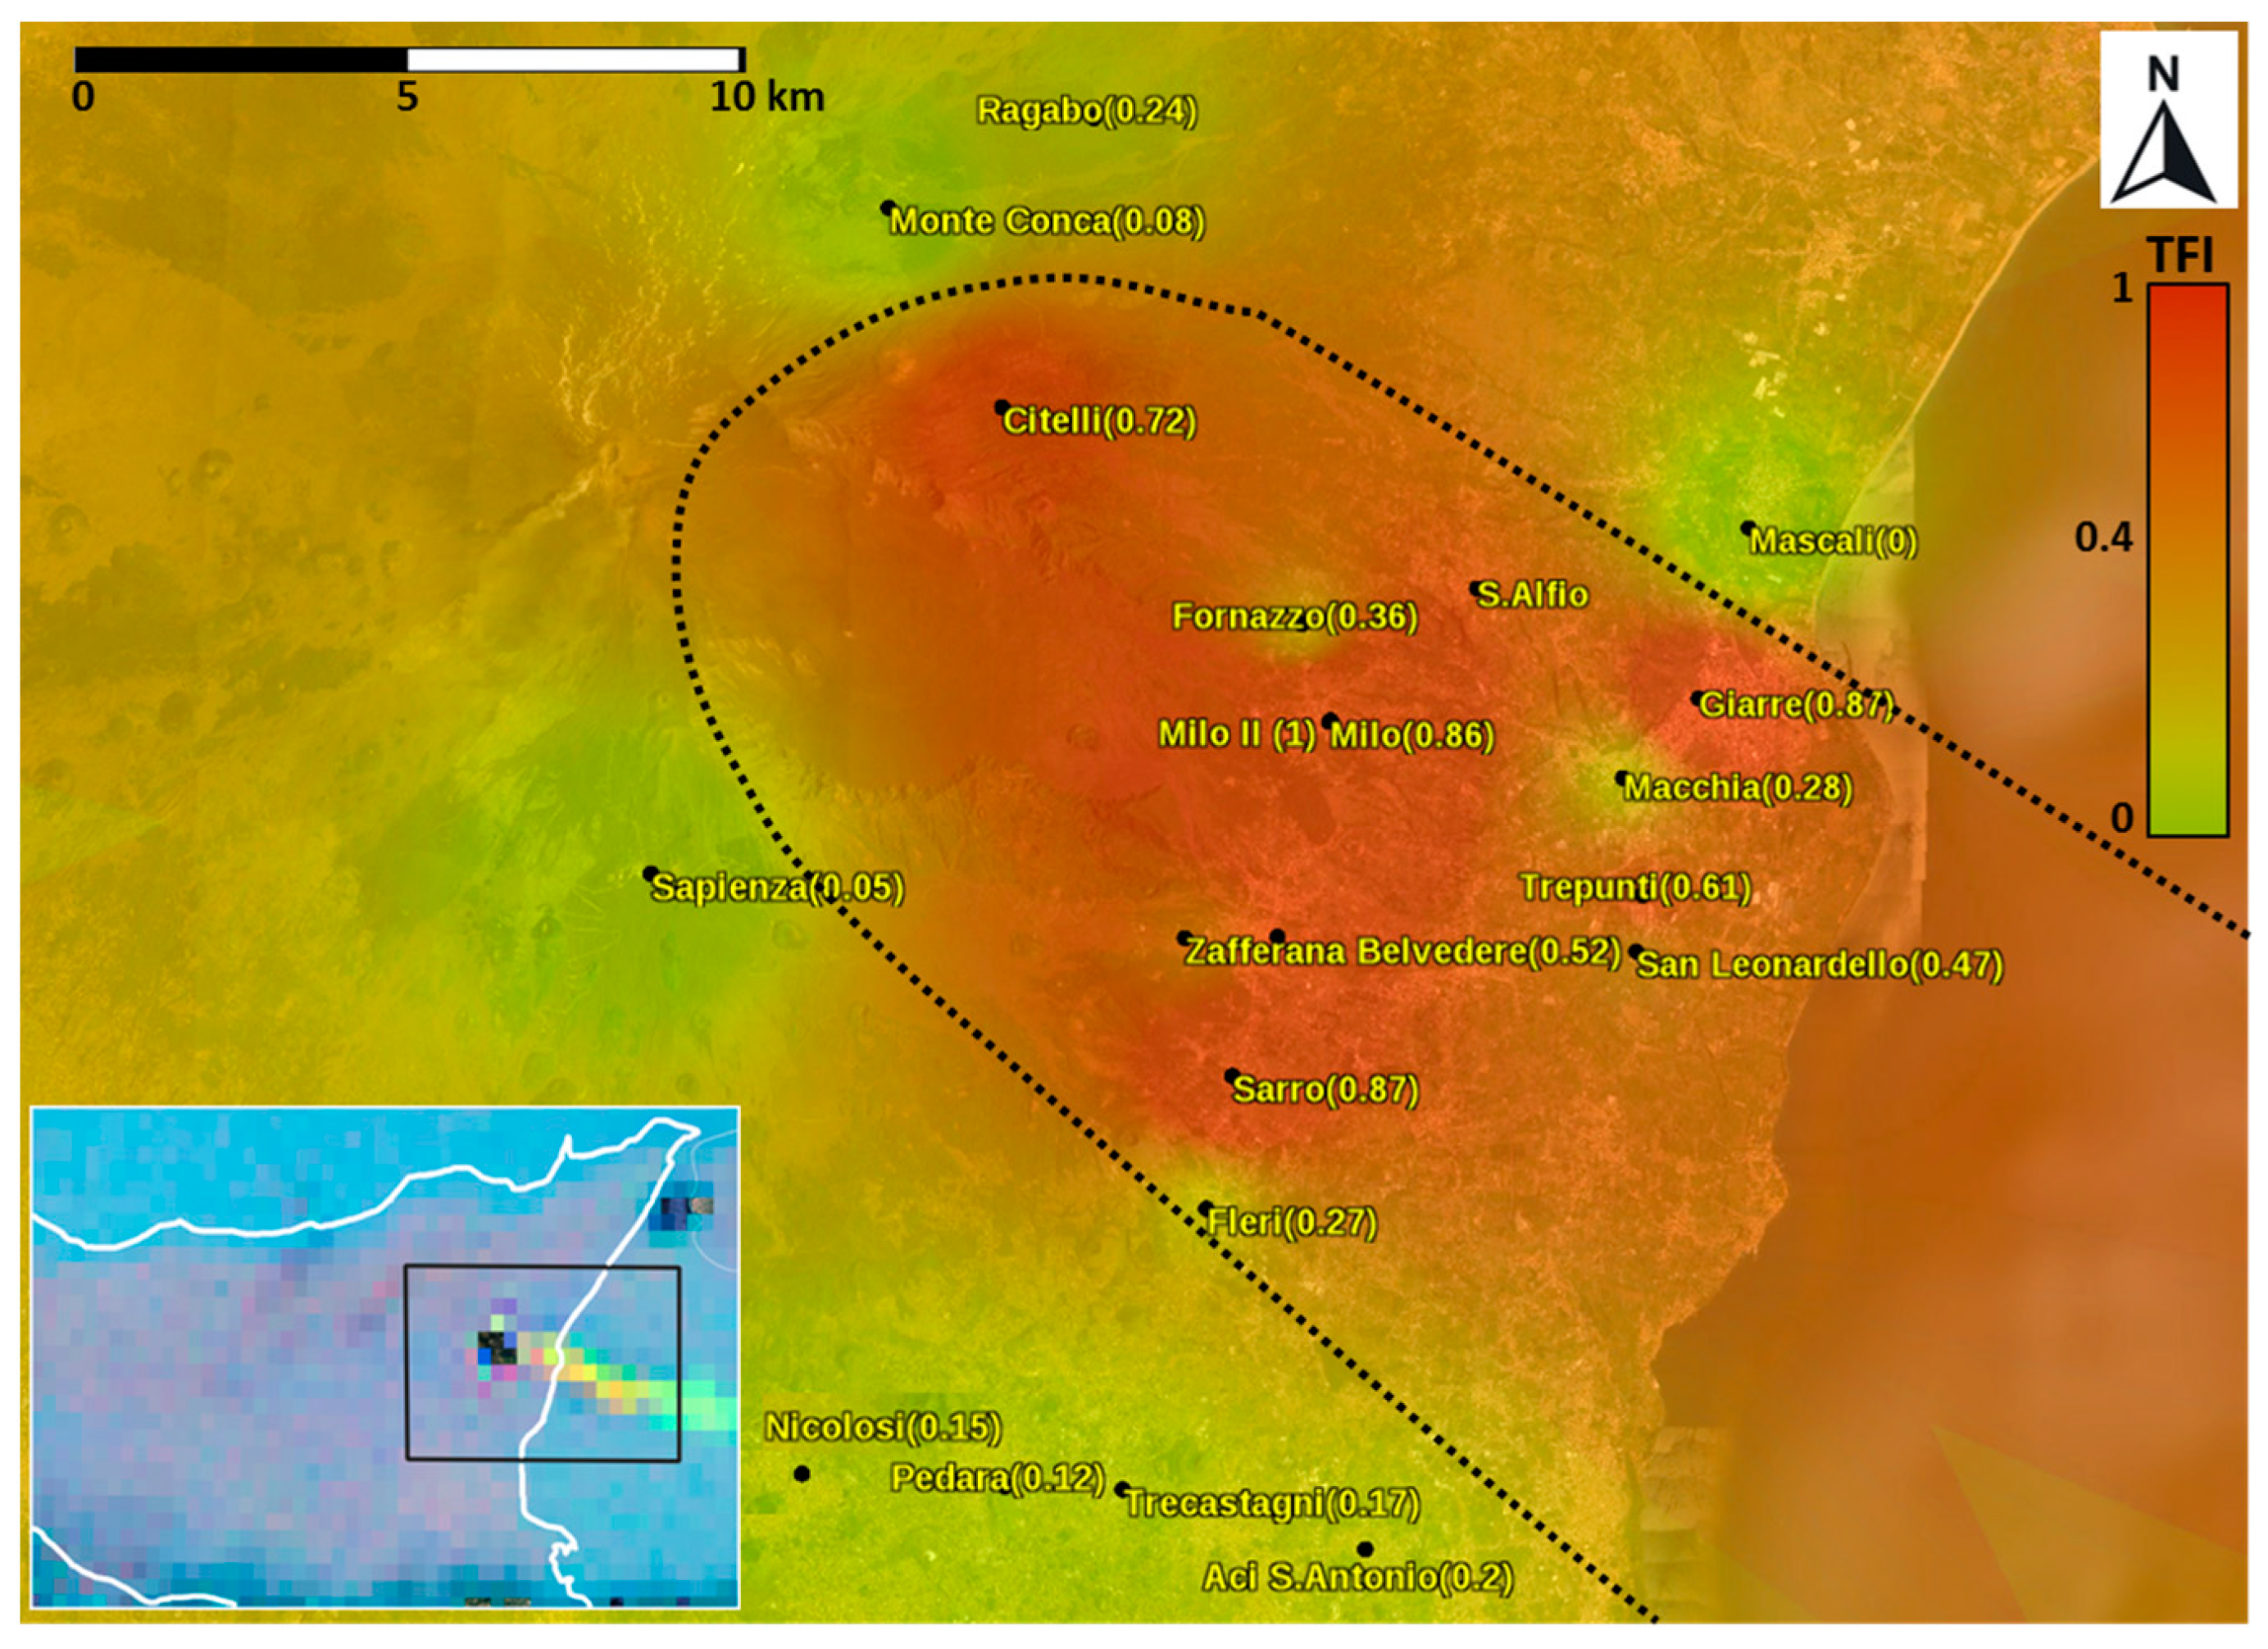
4.3. 1 July 2021 Paroxysmal Eruptions

During the week of the 1 July, three episodes of lava fountaining occurred at the SEC, with the formation of eruptive columns, which reached heights varying from a minimum of 5 km to a maximum of 10 km a.s.l. (8 km in the case of the 1 July). The activity started as Strombolian at 22:40 UTC to evolve to lava fountain activity at 22:50 UTC, finishing at 00:27 UTC [47]. All lava fountains were accompanied by lava overflows southwestward. The tephra fallout on this date affected the eastern/south-eastern sector of the volcano. The total volume of material emitted by the eruption is equal to 0.91 × 10⁶ m3 [47]. To study this eruption, the image of 2 July 2021 was taken into consideration for the calculation, as the eruption occurred overnight (Figure 8).
Figure 8 reports the density TFI map after the eruption occurred on the 1 July 2021, with the corresponding ash RGB product calculated from a satellite image of Etna dated 1 July 2021 by Eumetview. From Figure 8, it is possible to observe that the villages affected by the passage of the ash cloud have a higher normalized TFI value compared to the other areas, with values up to 1. On the other hand, the areas which do not seem to have been affected by the tephra fallout show lower values, with a minimum value of 0. We also found a quite high value in the Ragabo area, which is probably due to the accumulation of tephra coming from different episodes, since this area is not usually cleaned. In the example above, we can define a threshold based on the lowest value present within the delimited area affected by the passage of the volcanic plume. It can be represented by the value of 0.27, corresponding to Fleri.

5. Discussion and Conclusions

Satellite remote sensing techniques constitute a valuable tool for volcano monitoring, and their use, aimed at analyzing the tephra deposits, is fundamental for achieving a more rapid response during a volcanic crisis. This is particularly important, considering the fact that field surveys can be impractical in certain contexts, representing a source of risk for operators.
In this work we identify, for the first time, the volcanic deposit related to individual eruptive events in near real-time by processing PlanetScope satellite imagery, which offers high spatial resolution and a daily revisit time for each point on the Earth’s surface.
Since tephra deposits alter the spectral signature of the reflectance detected by satellite, for eruptions having sufficient data in terms of image quality, PlanetScope imagery allows for the evaluation of the areas in which the tephra fallout took place. Hence, the introduction of a new index, which we call the Tephra Fallout Index (TFI), maps the areas involved by the tephra fallout and quantifies the related surface coverage density.
We applied our technique to Mt. Etna (Italy), which, during 2021, was affected by recurring eruptive events. Whenever possible, we compared our results with field data available on the bulletins on the INGV-OE website and found an optimal agreement. Some areas were specifically chosen for their presence on the bulletins to have easier feedback on the areas where the tephra fallout occurred. Higher TFI values were observed in temporal correspondence with the same day or the following day of the eruption (depending on the time of satellite’s passage with respect to the eruption time) and in spatial correspondence with the area below the volcanic plume observed by the SEVIRI sensor. The normalized TFI maps provide a surprising spatial coherence that is in agreement with the satellite observations of the volcanic plume. Moreover, after comparing the TFI values with field measurements, we could observe that they provide interesting information about the surface coverage density of the fallout deposit.
We also identified a threshold to distinguish areas affected by tephra deposits. The threshold value is a dynamic limit, given by the observation of the minimum value in each investigated area, and thus, it differs between one eruptive event and another. Moreover, the TFI is affected by a certain percentage of uncertainty (in our case 13%), due to the absolute radiometric uncertainty on the NIR band.
It is worth considering that while some eruptions produce volcanic deposits visible only after a few days, due to the accumulation of multiple deposits, for others, the tephra deposit may not have been cleaned up and remains observable for a while. Thus, the fact of not knowing whether an area was cleaned or not after an eruption constitutes a limit for this analysis. This problem is greater in cases where it is not possible to study the eruption immediately after its occurrence due to the timing of the satellite passage compared to the eruption itself or in case where no dates are available for calculation (if several eruptive events occurred in the previous or following days).
Since the introduced method is based on satellite optical data analysis, it is affected by cloud covering, which can alter, together with other factors, such as the snow, the solar zenith angle, and the satellite zenith angle, the reflectance values measured at the satellite sensors. For this reason, we discarded the areas affected by cloud or snow cover, with a consequent lack of data in some areas, and we identified as anomalous the data with high satellite or solar zenith angle. Anyway, the fast growth of satellites in orbit and their integration with other satellite data, such as synthetic aperture radar (SAR) satellite instruments, could solve this problem since they are not adversely impacted by cloud, rain (partially) or ash cover, or time of day [54]. Our methodology could indeed integrate multispectral imagery with data coming from high spatial resolution X-band SAR imagery, using sources such as the ICEYE constellation with 27 active satellites or Capella Space with 9 active satellites.
Furthermore, a future aspiration is to obtain a shorter revisit time in the passage of satellites and, therefore, a greater number of data available. In this regard, several studies have highlighted a positive trend in the last ten years regarding the launch of satellite sensors and their use for volcano monitoring [55]. As for PlanetScope microsatellites, their number and quality have been increasing at a rapid pace. This growth, starting from 2022 with the advent of the third generation of PlanetScope satellites, has led to the acquisition of multispectral images with eight separate spectral bands which could prove to be the key for future studies.
Future improvements will include punctual ground-based validation, including the use of disdrometers (e.g., [56,57,58]) to investigate the relationship between the thickness of the deposit and the TFI values. Indeed, TFI supplies information about the ash coverage density, expecting higher TFI values in the areas covered mostly by tephra, and lower values where the coverage is rarefied, but not with regards to the deposit thickness.
Considering the limitations described above, this work could have important implications not only for the identification and the quantification of short-term volcanic hazard assessments in near real-time during a volcanic eruption but also for the mapping of other hazardous events worldwide.

Supplementary Materials

The following supporting information can be downloaded at: https://www.mdpi.com/article/10.3390/technologies12020025/s1, The list of the Planetscope images analyzed in this study is provided as the Geometries.xlsx file, with a sheet for each selected geometry.

Author Contributions

Conceptualization, G.G.; methodology, M.D. and G.G.; validation, S.S. and F.L.; formal analysis, M.D., G.G. and S.S.; investigation, M.D., G.G., S.S. and F.L.; resources, G.G.; data curation, S.S., M.D. and F.L.; writing—original draft preparation, M.D., G.G., S.S. and F.L.; writing—review and editing, M.D. and G.G.; visualization, M.D. and G.G.; supervision, G.G., S.S. and F.L.; funding acquisition, G.G. All authors have read and agreed to the published version of the manuscript.

Funding

This work was supported by the INGV project Pianeta Dinamico (CUP D53J19000170001) funded by MUR (“Fondo finalizzato al rilancio degli investimenti delle amministrazioni centrali dello Stato e allo sviluppo del Paese”, legge 145/2018), Volcanological Theme SAFARI (An Artificial Intelligence-based StrAtegy For volcAno hazaRd monItoring from space).

Institutional Review Board Statement

Not applicable.

Informed Consent Statement

Not applicable.

Data Availability Statement

The PlanetScope imagery used in this work was provided by Planet Labs through their Education and Research Program. The datasets generated during this study are available from the corresponding author on reasonable request.

Acknowledgments

The authors gratefully thank the Planet and the Education and Research program (https://www.planet.com/markets/education-and-research/; accessed on 22 November 2023) for providing the PlanetScope images to this study and acknowledge EUMETSAT (www.eumetsat.int; accessed on 22 November 2023) for providing ash RGB products. We would like to thank the INGV-MUR “Working Earth-VT_SAFARI-2023-25” project. The English style was corrected by Stephan Conway.

Conflicts of Interest

The authors declare no conflicts of interest.

References

  1. Casadevall, T.J. Volcanic ash and aviation safety: Proceedings of the first international symposium on volcanic ash and aviation safety. US Geol. Surv. Bull. 1994, 2047, 1–450. [Google Scholar]
  2. Miller, T.P.; Casadevall, T.J. Volcanic ash hazards to aviation. In Encyclopedia of Volcanoes; Sigurdsson, H., Houghton, B.F., McNutt, S.R., Rymer, H., Stix, J., Eds.; Academic Press: San Diego, CA, USA, 2000; pp. 915–930. [Google Scholar]
  3. Andronico, D.; Del Carlo, P. PM10 measurements in urban settlements after lava fountain episodes at Mt. Etna, Italy: Pilot test to assess volcanic ash hazard to human health. Nat. Hazards Earth Syst. Sci. 2016, 16, 29–40. [Google Scholar] [CrossRef]
  4. Horwell, C.J.; Sargent, P.; Andronico, D.; Castro, L.; Tomatis, M.; Hillman, S.E.; Michnowicz, S.A.; Fubini, B. The iron-catalysed surface reactivity and health-pertinent physical characteristics of explosive volcanic ash from Mt. Etna, Italy. J. Appl. Volcanol. 2017, 6, 12. [Google Scholar] [CrossRef]
  5. Horwell, C.J.; Baxter, P.J. The respiratory health hazards of volcanic ash: A review for volcanic risk mitigation. Bull. Volcanol. 2006, 69, 1–24. [Google Scholar] [CrossRef]
  6. Pyle, D.M. The thickness, volume and grainsize of tephra fall deposits. Bull. Volcanol. 1989, 51, 1–15. [Google Scholar] [CrossRef]
  7. Fierstein, J.; Nathenson, M. Another look at the calculation of fallout tephra volumes. Bull. Volcanol. 1992, 54, 156–167. [Google Scholar] [CrossRef]
  8. Bonadonna, C.; Houghton, B.F. Total grain-size distribution and volume of tephra-fall deposits. Bull. Volcanol. 2005, 67, 441–456. [Google Scholar] [CrossRef]
  9. Carey, S.; Sparks, R.S.J. Quantitative models of the fallout and dispersal of tephra from volcanic eruption columns. Bull. Volcanol. 1986, 48, 109–125. [Google Scholar] [CrossRef]
  10. Tupper, A.; Textor, M.; Herzog, A.; Graf, F.; Richards, S. Tall clouds from small eruptions: The sensitivity of eruption height and fine ash content to tropospheric instability. Nat. Hazards 2009, 51, 375–401. [Google Scholar] [CrossRef]
  11. Suzuki, T. A theoretical model for dispersion of tephra. In Arc Volcanism, Physics and Tectonics; Shimozuru, D., Yokoyama, I., Eds.; Terra Scientific: Tokyo, Japan, 1983; pp. 95–113. [Google Scholar]
  12. Armienti, P.; Macedonio, G.; Pareschi, M.T. A numerical model for simulation of tephra transport and deposition: Applications to 18 May 1980, Mount St. Helens eruption. J. Geophys. Res. 1988, 93, 6463–6476. [Google Scholar] [CrossRef]
  13. Bursik, M.; Sparks, R.S.J.; Gilbert, J.S.; Carey, S. Sedimentation of tephra by volcanic plumes: I. Theory and its comparison with a study of the Fogo A plinian deposit, Sao Miguel (Azores). Bull. Volcanol. 1992, 54, 329–344. [Google Scholar] [CrossRef]
  14. Heffter, J.L.; Stunder, B.J.B. Volcanic ash forecast transport and dispersion (VAFTAD) model. Weather Forecast. 1993, 8, 533–541. [Google Scholar] [CrossRef]
  15. Searcy, C.; Dean, K.; Stringer, W. PUFF: A high resolution volcanic ash tracking model. J. Volcanol. Geotherm. Res. 1998, 80, 1–16. [Google Scholar] [CrossRef]
  16. Hurst, A.W.; Turner, R. Performance of the program ASHFALL for forecasting ashfall during the 1995 and 1996 eruptions of Ruapehu volcano. N. Z. J. Geol. Geophys. 1999, 42, 615–622. [Google Scholar] [CrossRef]
  17. Koyaguchi, T.; Ohno, M. Reconstruction of Eruption Column Dynamics on the Basis of Grain Size of Tephra Fall Deposits: 1. Methods. J. Geophys. Res. 2001, 106, 6499–6512. [Google Scholar] [CrossRef]
  18. Bonadonna, C.; Macedonio, G.; Sparks, R.S.J. Numerical modelling of tephra fallout associated with dome collapses and Vulcanian explosions: Application to hazard assessment on Montserrat. Geol. Soc. Lond. Mem. 2002, 21, 517–537. [Google Scholar] [CrossRef]
  19. Bonadonna, C.; Philips, J.C. Sedimentation from strong volcanic plumes. J. Geophys. Res. 2003, 108, 2340–2368. [Google Scholar] [CrossRef]
  20. Bonadonna, C.; Philips, J.C.; Houghton, B.F. Modeling tephra sedimentation from a Rapehau weak plume eruption. J. Geophys. Res. 2005, 110, B08209. [Google Scholar] [CrossRef]
  21. Bonadonna, C.; Folch, A.; Loughlin, S.; Puempel, H. Future developments in modelling and monitoring of volcanic ash clouds: Outcomes from the first IAVCEI-WMO workshop on Ash Dispersal Forecast and Civil Aviation. Bull. Volcanol. 2012, 74, 1–10. [Google Scholar] [CrossRef]
  22. Folch, A. A review of tephra transport and dispersal models: Evolution, current status, and future perspectives. J. Volcanol. Geotherm. Res. 2012, 235–236, 96–115. [Google Scholar] [CrossRef]
  23. Scollo, S.; Prestifilippo, M.; Bonadonna, C.; Cioni, R.; Corradini, S.; Degruyter, W.; Rossi, E.; Silvestri, M.; Biale, E.; Carparelli, G.; et al. Near-Real-Time Tephra Fallout Assessment at Mt. Etna, Italy. Remote Sens. 2019, 11, 2987. [Google Scholar] [CrossRef]
  24. Beckett, F.; Witham, C.; Leadbetter, S.; Crocker, R.; Webster, H.; Hort, M.C.; Jones, A.; Devenish, B.; Thomson, D. Atmospheric Dispersion Modelling at the London VAAC: A Review of Developments since the 2010 Eyjafjallajökull Volcano Ash Cloud. Atmosphere 2020, 11, 352. [Google Scholar] [CrossRef]
  25. Dioguardi, F.; Beckett, F.; Dürig, T.; Stevenson, J.A. The impact of eruption source parameter uncertainties on ash dispersion forecasts during explosive volcanic eruptions. J. Geophys. Res. Atmos. 2020, 125, e2020JD032717. [Google Scholar] [CrossRef]
  26. Mastin, L.G.; Pavolonis, M.; Engwell, S.; Clarkson, R.; Witham, C.; Brock, G.; Lisk, I.; Guffanti, M.; Tupper, A.; Schneider, D.; et al. Progress in protecting air travel from volcanic ash clouds. Bull. Volcanol. 2022, 84, 9. [Google Scholar] [CrossRef]
  27. Bear-Crozier, A.; Pouget, S.; Bursik, M.; Jansons, E.; Denman, J.; Tupper, A.; Rustowicz, R. Automated detection and measurement of volcanic cloud growth: Towards a robust estimate of mass flux, mass loading and eruption duration. Nat. Hazards 2020, 101, 1–38. [Google Scholar] [CrossRef]
  28. Freret-Lorgeril, V.; Bonadonna, C.; Corradini, S.; Guerrieri, L.; Lemus, J.; Donnadieu, F.; Scollo, S.; Gurioli, L.; Rossi, E. Tephra characterization and multi-disciplinary determination of Eruptive Source Parameters of a weak paroxysm at Mount Etna (Italy). J. Volcanol. Geotherm. Res. 2021, 421, 10743. [Google Scholar] [CrossRef]
  29. Mereu, L.; Scollo, S.; Bonadonna, C.; Donnadieu, F.; Freret Lorgeril, V.; Marzano, F.S. Ground-based remote sensing and uncertainty analysis of the mass eruption rate associated with the 3–5 December 2015 paroxysm of Mt. Etna. In Proceedings of the EGU General Assembly 2022, Vienna, Austria, 23–27 May 2022. EGU22-9221. [Google Scholar] [CrossRef]
  30. Mereu, L.; Scollo, S.; Garcia, A.; Sandri, L.; Bonadonna, C.; Marzano, F.S. A New Radar-Based Statistical Model to Quantify Mass Eruption Rate of Volcanic Plumes. Geophys. Lett. 2023, 50, e2022GL100596. [Google Scholar] [CrossRef]
  31. Calvari, S.; Bonaccorso, A.; Ganci, G. Anatomy of a Paroxysmal Lava Fountain at Etna Volcano: The Case of the 12 March 2021, Episode. Remote Sens. 2021, 13, 3052. [Google Scholar] [CrossRef]
  32. Slatcher, N.; James, M.R.; Calvari, S.; Ganci, G.; Browning, J. Quantifying Effusion Rates at Active Volcanoes through Integrated Time-Lapse Laser Scanning and Photography. Remote Sens. 2015, 7, 14967–14987. [Google Scholar] [CrossRef]
  33. Ganci, G.; Cappello, A.; Bilotta, G.; Herault, A.; Zago, V.; Del Negro, C. Mapping Volcanic Deposits of the 2011–2015 Etna Eruptive Events Using Satellite Remote Sensing. Front. Earth Sci. 2015, 6, 83. [Google Scholar] [CrossRef]
  34. Scollo, S.; Boselli, A.; Coltelli, M.; Leto, G.; Pisani, G.; Prestifilippo, M.; Spinelli, N.; Wang, X. Volcanic ash concentration during the 12 August 2011 Etna eruption. Geophys. Res. Lett. 2015, 42, 2634–2641. [Google Scholar] [CrossRef]
  35. Frazier, A.; Hemingway, B.L. A Technical Review of Planet Smallsat Data: Practical Considerations for Processing and Using PlanetScope Imagery. Remote Sens. 2021, 13, 1390. [Google Scholar] [CrossRef]
  36. Aldeghi, A.; Carn, S.; Rudiger, E.-W.; Groppelli, G. Volcano Monitoring from Space Using High-Cadence Planet CubeSat Images Applied to Fuego Volcano, Guatemala. Remote Sens. 2019, 11, 2151. [Google Scholar] [CrossRef]
  37. Salamati, N.; Fredembach, C.; Süsstrunk, S. Material Classification Using Color and NIR Images. In Proceedings of the IS&T/SID 17th Color Imaging Conference (CIC) 2009, Albuquerque, NM, USA, 11–13 November 2009. [Google Scholar]
  38. Zuccarello, F.; Bilotta, G.; Ganci, G.; Proietti, C.; Cappello, A. Assessing impending hazards from summit eruptions: The new probabilistic map for lava flow inundation at Mt. Etna. Sci. Rep. 2023, 13, 19543. [Google Scholar] [CrossRef] [PubMed]
  39. Del Negro, C.; Cappello, A.; Bilotta, G.; Ganci, G.; Hérault, A.; Zago, V. Living at the edge of an active volcano: Risk from lava flows on Mt. Etna. GSA Bull. 2019, 132, 1615–1625. [Google Scholar] [CrossRef]
  40. Palano, M.; Viccaro, M.; Zuccarello, F.; Gresta, S. Magma transport and storage at Mt. Etna (Italy): A review of geodetic and petrological data for the 2002–03, 2004 and 2006 eruptions. J. Volcanol. Geotherm. Res. 2017, 347, 149–164. [Google Scholar] [CrossRef]
  41. Andronico, D.; Corsaro, R.A. Lava Fountains during the Episodic Eruption of South-East Crater (Mt. Etna), 2000: Insights into Magma-Gas Dynamics within the Shallow Volcano Plumbing System. Bull. Volcanol. 2011, 73, 1165–1178. [Google Scholar] [CrossRef]
  42. Andronico, D.; Cannata, A.; Di Grazia, G.; Ferrari, F. The 1986–2021 paroxysmal episodes at the summit craters of Mt. Etna: Insights into volcano dynamics and hazard. Earth-Sci. Rev. 2021, 220, 103686. [Google Scholar]
  43. Parfitt, E.A.; Wilson, L. The 1983-86 Pu′u ‘O’o Eruption of Kilauea Volcano, Hawaii: A Study of dike Geometry and Eruption Mechanisms for a Long-Lived Eruption. J. Volcanol. Geotherm. Res. 1994, 59, 179–205. [Google Scholar] [CrossRef]
  44. Allard, P.; Burton, M.; Muré, F. Spectroscopic evidence for a lava fountain driven by previously accumulated magmatic gas. Nature 2005, 433, 407–410. [Google Scholar] [CrossRef]
  45. Alparone, S.; Cannata, A.; Gresta, S. Time variation of spectral and wavefield features of volcanic tremor at Mt. Etna (January June 1999). J. Volcanol. Geotherm. Res. 2007, 161, 318–332. [Google Scholar] [CrossRef]
  46. Scollo, S.; Prestifilippo, M.; Pecora, E.; Corradini, S.; Merucci, L.; Spata, G.; Coltelli, M. Eruption column height estimation of the 2011–2013 Etna lava fountains. Ann. Geophys. 2014, 57, 1–5. [Google Scholar] [CrossRef]
  47. Calvari, S.; Nunnari, G. Comparison between Automated and Manual Detection of Lava Fountains from Fixed Monitoring Thermal Cameras at Etna Volcano, Italy. Remote Sens. 2022, 14, 2392. [Google Scholar] [CrossRef]
  48. Wadge, G.; Walker, G.P.L.; Guest, J.E. The output of the Etna volcano. Nature 1975, 255, 385–387. [Google Scholar] [CrossRef]
  49. Guest, J.E. Styles of eruption and flow morphology on Mt. Etna. Mem. Soc. Geol. Ital. 1982, 23, 49–73. [Google Scholar]
  50. Romano, R.; Sturiale, C. The historical eruptions of Mt Etna (Volcanological data). Mem. Soc. Geol. It. 1982, 23, 75–97. [Google Scholar]
  51. Ganci, G.; Bilotta, G.; Zuccarello, F.; Calvari, S.; Cappello, A. A Multi-Sensor Satellite Approach to Characterize the Volcanic Deposits Emitted during Etna’s Lava Fountaining: The 2020–2022 Study Case. Remote Sens. 2023, 15, 916. [Google Scholar] [CrossRef]
  52. Marchese, F.; Filizzola, C.; Lacava, T.; Falconieri, A.; Faruolo, M.; Genzano, N.; Mazzeo, G.; Pietrapertosa, C.; Pergola, N.; Tramutoli, V.; et al. Mt. Etna Paroxysms of February–April 2021 Monitored and Quantified through a Multi-Platform Satellite Observing System. Remote Sens. 2021, 13, 3074. [Google Scholar] [CrossRef]
  53. Corradini, S.; Guerrieri, L.; Lombardo, V.; Merucci, L.; Musacchio, M.; Prestifilippo, M.; Scollo, S.; Silvestri, M.; Spata, G.; Stelitano, D. Proximal monitoring of the 2011-2015 Etna lava fountains using MSG-SEVIRI data. Geosciences 2018, 8, 140. [Google Scholar] [CrossRef]
  54. Plank, S. Rapid Damage Assessment by Means of Multi-Temporal SAR—A Comprehensive Review and Outlook to Sentinel-1. Remote Sens. 2014, 6, 4870–4906. [Google Scholar] [CrossRef]
  55. Ramsey, M.S.; Harris, A.J.L. Volcanology 2020: How will thermal remote sensing of volcanic surface activity evolve over the next decade? J. Volcanol. Geotherm. Res. 2013, 249, 217–233. [Google Scholar] [CrossRef]
  56. Scollo, S.; Coltelli, M.; Prodi, F.; Folegani, M.; Natali, S. Terminal settling velocity measurements of volcanic ash during the 2002–2003 Etna eruption by an X-band microwave rain gauge disdrometer. Geophys. Res. Lett. 2005, 32, L10302. [Google Scholar] [CrossRef]
  57. Bonadonna, C.; Genco, R.; Gouhier, M.; Pistolesi, M.; Cioni, R.; Alfano, F.; Hoskuldsson, A.; Ripepe, M. Tephra sedimentation during the 2010 Eyjafjallajökull eruption (Iceland) from deposit, radar, and satellite observations. J. Geophys. Res. 2011, 116, B12202. [Google Scholar] [CrossRef]
  58. Kozono, T.; Iguchi, M.; Miwa, T.; Miki, D. Characteristics of tephra fall from eruptions at Sakurajima volcano, revealed by optical disdrometer measurements. Bull. Volcanol. 2019, 81, 41. [Google Scholar] [CrossRef]
Figure 1. Spectral responses for PlanetScope: (a) Dove Classic ‘PS2’, (b) Dove-R ‘PS2.SD’, and (c) SuperDove ‘PSB.SD’ sensors (from [35]).
Technologies 12 00025 g001
Figure 2. Flowchart with the main steps of the methodology: PlanetScope PS imagery (in ASR—analytic surface reflectance format) and selected geometries represent the data input; blue rectangles report the main processing steps (where GEE stands for Google Earth Engine and TFI includes the Tephra Fallout Index computation), while orange parallelograms are the possible outputs to highlight areas impacted by tephra fallout depending on the TFI values with respect to the selected threshold, Th.
Technologies 12 00025 g002
Figure 3. Google map of Mt. Etna, where the localization of the analyzed areas and villages located on the north-east, east, south-east, and south flanks of Mount Etna is reported. In the bottom left inset, the map of Sicily with the Etna volcano framed in red is reported, and in the top inset, there is a zoom on the Summit Craters.
Technologies 12 00025 g003
Figure 4. Piazza del Duomo (Giarre) before (a) and after (b) the paroxysmal event on 7 March 2021 (courtesy of T. Caggegi). On the left inset the satellite view of Mt. Etna is depicted, with Giarre highlighted in yellow.
Technologies 12 00025 g004
Figure 5. Normalized TFI values related to a square in Nicolosi (900 m2 surface area, blue dotted line), Piazza del Duomo, Giarre (2600 m2 surface area, green dotted line), and the parking area next to Rifugio Sapienza (14,250 m2 surface area, purple dotted line). The days affected by eruptive episodes are highlighted with red dots: (i) Nicolosi: 28/02/2021, 3/03/2021, 24/03/2021, 2/04/2021, 17/06/2021, 20/06/2021; (ii) Giarre: 15/03/2021, 23/06/2021, 2/07/2021, 1/08/2021; (iii) Sapienza: 3/03/2021, 2/04/2021, 14/06/2021, 17/06/2021, 5/07/2021.
Technologies 12 00025 g005
Figure 6. Density TFI map related to the 2 March 2021 eruption, integrated in a GIS. The profile of the volcanic plume is shown (dashed black line), and all the selected geometries are reported in yellow, with the name of the corresponding village and the respective normalized TFI value in brackets. On the left insets are reported the ash RGB products calculated on the same date at 14:30 UTC and at 15:00 UTC.
Technologies 12 00025 g006
Figure 7. Density TFI map related to 22 May 2021 eruption integrated in a GIS. The profile of the volcanic plume is shown (dashed black line), and all the selected geometries are reported in yellow, with the name of the corresponding village and the respective normalized TFI value in brackets. On the left inset, the ash RGB product calculated at 21:45 UTC on the same date is reported.
Technologies 12 00025 g007
Figure 8. Density TFI map related to the 1 July 2021 eruption, integrated in a GIS. The profile of the volcanic plume is shown (dashed black line) and all the selected geometries are reported in yellow, with the name of the corresponding village and the respective normalized TFI value in brackets. On the left insets, the ash RGB product calculated at 23:45 UTC on the same date is reported.
Technologies 12 00025 g008
Disclaimer/Publisher’s Note: The statements, opinions and data contained in all publications are solely those of the individual author(s) and contributor(s) and not of MDPI and/or the editor(s). MDPI and/or the editor(s) disclaim responsibility for any injury to people or property resulting from any ideas, methods, instructions or products referred to in the content.

