Article

Graph Learning and Deep Neural Network Ensemble for Supporting Cognitive Decline Assessment

Computer Science Department, Technical University of Cluj-Napoca, Memorandumului 28, 400114 Cluj-Napoca, Romania
*
Author to whom correspondence should be addressed.
Technologies 2024, 12(1), 3; https://doi.org/10.3390/technologies12010003
Submission received: 21 November 2023 / Revised: 11 December 2023 / Accepted: 23 December 2023 / Published: 24 December 2023
(This article belongs to the Section Assistive Technologies)

Abstract

:
Cognitive decline represents a significant public health concern due to its severe implications on memory and general health. Early detection is crucial to initiate timely interventions and improve patient outcomes. However, traditional diagnosis methods often rely on personal interpretations or biases, may not detect the early stages of cognitive decline, or involve invasive screening procedures; thus, there is a growing interest in developing non-invasive methods benefiting also from the technological advances. Wearable devices and Internet of Things sensors can monitor various aspects of daily life together with health parameters and can provide valuable data regarding people’s behavior. In this paper, we propose a technical solution that can be useful for potentially supporting cognitive decline assessment in early stages, by employing advanced machine learning techniques for detecting higher activity fragmentation based on daily activity monitoring using wearable devices. Our approach also considers data coming from wellbeing assessment questionnaires that can offer other important insights about a monitored person. We use deep neural network models to capture complex, non-linear relationships in the daily activities data and graph learning for the structural wellbeing information in the questionnaire answers. The proposed solution is evaluated in a simulated environment on a large synthetic dataset, the results showing that our approach can offer an alternative as a support for early detection of cognitive decline during patient-assessment processes.

Graphical Abstract

1. Introduction

Worldwide, the progressive degradation of cognitive capabilities, known as cognitive decline, poses an alarming health issue due to its detrimental effects on an individual’s thinking, memory, and overall wellness [1]. This phenomenon, frequently linked to neurodegenerative disorders such as Alzheimer’s disease (AD), is a significant contributor to global mortality rates [2]. Given the rising life expectancy and aging population, the incidence of these conditions is projected to increase, thereby augmenting the current healthcare challenges [3]. The early identification of cognitive decline is of critical importance for the administration of timely therapeutic interventions, potentially slowing its progression [4]. Traditional diagnostic approaches, however, have significant limitations. First, they often involve a battery of neuropsychological tests that require substantial time and expertise to administer, posing challenges in terms of accessibility and scalability [5]. In many low-resource areas with a shortage of trained professionals, these comprehensive assessments may not be feasible or widely available, leading to a disparity in the early detection of cognitive decline [6]. Second, these assessments often rely heavily on subjective data obtained from the patient’s self-report or the caregiver’s observation [7]. The validity of such data can be influenced by various factors, including the patient’s mood, educational background, and socio-cultural context [8]. This subjectivity introduces a potential bias and variability in the results, which could lead to inconsistencies in the diagnosis [9]. Finally, traditional methods often fail to detect the early-stage changes of cognitive decline, resulting in late-stage diagnosis when irreversible brain damage has already occurred [10]. The insensitivity of conventional assessments to subtle cognitive changes can delay the initiation of interventions that might slow the progression of cognitive decline, underscoring the need for more sensitive and early detection methods [4].
Recently, the advent of wearable technology and Internet of Things sensors has transformed the landscape of healthcare, enabling remote monitoring of various physiological parameters and offering an opportunity to gather continuous, objective, and real-time data about an individual’s health status [11]. Machine learning (ML) has shown great promise in cognitive decline detection, with several predominant trends surfacing in the field [12]. Supervised ML models, such as Support Vector Machines (SVMs) and Random Forrest (RF), have been proposed to be used for classifying patients into healthy and cognitively impaired groups, based on features extracted from cognitive test results and other health-related data [13]. At the same time, unsupervised learning, specifically clustering algorithms, has been proposed to identify patterns or groupings in the data that may correspond to different stages or types of cognitive impairment [14]. Another emerging trend in the ML domain is the use of deep learning techniques, such as convolutional neural networks (CNNs) or recurrent neural networks (RNNs), which can automatically learn and extract features from raw data [15]. These models have shown good results in detecting cognitive decline from data, including images, speech, and physiological parameters captured with wearable devices [16]. Moreover, recent studies have shown that daily activity fragmentation can be potentially used for cognitive decline detection in early stages and can offer an alternative strategy for cognitive decline assessment [17]. These studies underline the importance of constructing daily activity patterns that can be formed by analyzing a person’s total activity, active intervals, or fragmentation windows over a long period. This can be achieved by integrating wearable-device monitoring with ML techniques.
In this context, this paper proposes a novel approach that can support assessment processes for cognitive-decline detection. The main scientific contributions of the proposed solution are:
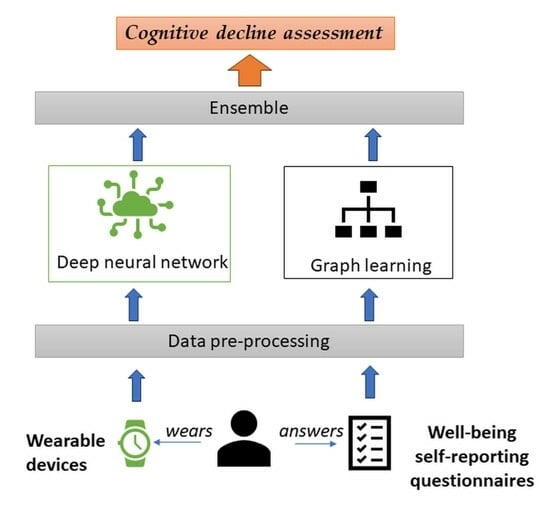
  • a deep neural network technique that uses a CNN model to analyze objective activity data coming from wearable devices (fitness trackers, smart watches, smart patches, etc.), with a focus on daily activity fragmentation.
  • a graph learning (GL) technique that captures structural insights from subjective self-reporting activities (through wellbeing assessment questionnaires) to offer a better understanding of symptoms associated with cognitive decline using Node2Vec embeddings and K-means clustering.
  • an ensemble technique to aggregate the outputs of both models based on the Softmax function.
The novelty of the proposed approach is given by the synergistic use of CNNs and GL for cognitive-decline detection, together with the fusion of objective and subjective data. While CNNs are suitable for handling and interpreting large volumes of unstructured data coming from sensors, GL offers a more complex approach to representing and analyzing the interconnected data from self-reporting activities. The proposed method is a potential non-invasive alternative to traditional diagnostic procedures, which could help in the early detection of cognitive-decline assessment. Moreover, it paves the way toward proactive health management and improved outcomes for patients with cognitive decline. To our knowledge, this is one of the first research attempts to combine deep learning, GL, real-time monitored data, and offline subjective wellbeing information with the goal of providing a unified decision regarding a patient’s risk of cognitive decline.
The rest of the paper is organized as follows: Section 2 presents a study of the state-of-the-art approaches in the related research areas; Section 3 describes the methods developed; Section 4 shows the evaluation results; and Section 5 concludes the paper and presents future work.

2. Related Work

Recent research studies have analyzed the usage of different ML methods to potentially detect or assess cognitive decline [18,19]. The methodologies vary from traditional ML approaches to advanced deep learning models, using different types of data, including genetic data, neuroimaging data, neuropsychological assessments, and, more recently, data from wearable devices [20]. In a study published by Gomes et al. [21], the potential of ML algorithms to predict cognitive and functional decline in individuals aged 75 and older using routine laboratory tests was analyzed. The study applied RF, SVM, and XGBoost algorithms, identifying 20 key laboratory variables as predictors. The findings indicated that routine blood tests, when analyzed with ML models, may forecast cognitive and functional impairments in the older population. The RF model proved to have the highest accuracy. One of the most common approaches from the literature is to use neuroimaging data, especially brain magnetic resonance imaging (MRI) or positron emission tomography (PET) scans, which provide an in-depth view of the structural and functional aspects of the brain [22]. Zhou et al. [23] used an SVM approach for detecting cognitive decline using structural MRI data, demonstrating its effectiveness in dealing with high-dimensional data. In another study, Liu et al. [24] applied a multi-kernel SVM on multimodal neuroimaging data for the prediction of mild cognitive impairment (MCI), achieving a more comprehensive understanding of cognitive-decline progression. Shi et al. [25] presented the generative adversarial network constrained multiple-loss autoencoder framework with the aim of accurately delineating individual brain atrophy patterns for MCI. It showed good performance in image reconstruction and outperformed the traditional t-test model in differentiating patients with MCI from normal controls. Deep learning has emerged as a powerful tool due to its ability to learn hierarchical representations from data automatically [26]. Sarraf et al. [27] utilized CNN for cognitive decline diagnosis using fMRI data, highlighting the potential of deep learning for neuroimaging analysis. In a similar approach, [28], the authors proposed an optimized deep CNN (DCNN) model for early-stage cognitive-decline prediction. Their model, enhanced by the grasshopper optimization algorithm, optimally chooses the weight and activation function of the DCNN, which is a novel approach in the context of cognitive-decline detection. Diaz and Rodriguez’s study [29] explored the use of ML algorithms for early detection and classification of MCI utilizing gene-expression data and employing various ML algorithms, including linear regression, decision trees, naïve Bayes, and deep learning, to differentiate between patients with cognitive problems and healthy patients. The deep learning algorithm featured 80% accuracy in identifying early-stage MCI, outperforming the other models.
When using wearable data as input, Jeon et al. [30] proposed a novel method for the early diagnosis of MCI through gait analysis, bypassing the limitations of conventional diagnostic methods. Using walking-activity data captured with wearable devices, an ensemble model composed of RF, AdaBoost, and Gradient Boosting Decision Tree was applied, showing promising capabilities. Particularly, the model achieved higher accuracy when applied to complex dual-task walking data, suggesting the utility of gait analysis in the early detection of cognitive-decline disorders. The authors of [31] described a method to predict outcomes of cognitive-function assessments, namely the mini-mental state examination and Montreal Cognitive Assessment (MoCA), in outpatients with epilepsy. The workflow involved a combination of the RF algorithm and the redundancy analysis algorithm to select the optimal predictive model.
Lin et al. [32] showed a novel framework for MCI diagnosis, which combined CNNs and GL, where the latter could be utilized to capture non-linear relationships among subjects represented as nodes in population graphs. These graphs combined information from individual assessments. The unified network effectively extracted high-level anatomical features using DenseNet and leveraged GCNs for multi-class classification of MCI subjects and cognitively normal subjects. The approach highlighted the significance of GL in enhancing classification accuracy for potential diagnosis. However, the authors did not use monitored data from sensors and based the solution on datasets with patient cognitive-evaluation results. Tang et al. [33] introduced an innovative augmented graph-embedding framework, leveraging the brain’s structural network data (MRI) for more effective MCI-stage classification. It used a multimodal augmentation that demonstrated significant improvements over traditional methods, underscoring the potential of graph-embedding techniques in enhancing diagnostic accuracy for cognitive impairments; however, it was entirely based on MRI data. Another study by Xu et al. [34] introduced the multiple-graph Gaussian embedding model, a novel deep learning method for early cognitive-decline detection using magnetoencephalography data. It effectively maps high-dimensional brain networks into a low-dimensional space, using these embeddings for ML-based cognitive-decline progression prediction. It demonstrated high accuracy in identifying MCI-related brain network changes, but it did not use monitored data or wellbeing contextual dimensions. Lei et al. [35] presented a novel multi-scale enhanced graph convolutional network for early detection of MCI. Integrating structural and functional brain data with demographic information, such as gender and age, multiple graph layers’ outputs were concatenated to perform disease detection. The approach demonstrated superior MCI detection, achieving 90.39% accuracy.
Despite these advances, the cognitive-decline assessment process is still an important and complex research problem due to the unstructured and complex nature of healthcare data, especially regarding cognitive data [36]. A significant drawback of existing methods is that they concentrated on data that has a grid-like format. Most of the approaches focused on image analysis (MRI, CT, etc.), while some of them integrated demographic data. Hence, the current study aimed to utilize and integrate patient-activities data with self-reporting information as input for an ensemble of CNN and GL techniques to better capture the complexity and heterogeneity of cognitive decline and provide support to decision-makers. Moreover, traditional methods often focus either on objective data, like activity tracking from wearables, or on subjective data from questionnaires. Each approach, on its own, tends to provide a partial picture of a patient’s health. The use of CNNs to analyze activity sensor data is a common approach in the field of wearable technology, due to their ability to discover complex patterns in data. On the other hand, using graph-based methods to analyze questionnaire data is less common. This technique allows for a more nuanced understanding of a patient’s mental and emotional state. By combining CNNs and graph-based methods, a more complex view of a patient’s cognitive health can be provided. The CNNs analyze physical activities, while the graph-based methods offer insights into their mental and emotional wellbeing. This integration of CNNs and graph-based leads to a more accurate and holistic understanding of cognitive health.

3. Materials and Methods

A summary of the proposed solution ML architecture is presented in Figure 1, and in the following subsections, each step is presented in detail.
The input data for the ML models undergoes a structured processing workflow before being fed to the algorithms. We used two types of data, activity data recorded by wearable devices and assessment data coming from wellbeing questionnaires. The assessment data is used to produce graph embeddings. Passing this data through a K-means clustering algorithm enables the identification of patterns in patients’ responses. The labeled monitored activity data are integrated into a CNN model to uncover inherent patterns in patients’ daily activities. The overall approach aims to facilitate the detection of cognitive issues by analyzing correlations and anomalies in the response patterns.
In the final stage of the solution, the results from the analyses are synthesized to present the conclusive result that can potentially support the cognitive-evaluation activities. The CNN process’s objective data from wearable devices identify patterns that indicate physical aspects of cognitive health. Concurrently, the GL model analyzes subjective wellbeing data, providing insights into the mental and emotional state of individuals. These two streams of data are then merged, using a weighted combination approach, where both sets of results contribute to the final assessment. The ensemble operates on a foundational principle that uses the SOFTMAX function [37] to aggregate the probabilistic outputs of both models. The SOFTMAX function is particularly suited for this task, due to its ability to convert raw model outputs into normalized probabilities, which are conducive to comparison and aggregation. In instances where both the CNN and the GL methods agree, the ensemble mechanism takes this consensus as a strong indicator of the result’s reliability and, subsequently, designates this prediction as the final classification. When the predictions from CNN and the GL diverge, the ensemble mechanism employs a weighted decision strategy. This method assumes that the higher the model’s standalone accuracy in one case, the greater its influence should be in the final prediction output when there is a conflict.

3.1. Deep Neural Network Technique

CNN has been used as a deep learning model to be integrated into the proposed solution to identify early indicators of cognitive impairment. CNNs are well suited for time-series analysis because, unlike conventional ML models, they naturally possess the capacity to analyze structured grid data. Because of their convolutional layers and inherent structure, CNNs may detect certain patterns in data. This is especially useful for spotting minute changes in a patient’s behavior patterns that might signal the beginning of cognitive problems. Once discovered, these localized patterns can be used as vital biomarkers to identify individuals who may be at risk of developing certain affections.
We started with a sequential structure to make sure that data would flow through the levels linearly and cohesively. The pooling layers condensed the information, covering only the most apparent traits suggestive of cognitive changes, while the convolutional layers worked to find patterns in the data. The final classification layer was calibrated to distinguish data partitioned into two categories: healthy and with risk of cognitive decline. Thus, the final output of the CNN, correlated with the activity recordings, is the classification assigned to the patient, based on the patient’s exhibited activity patterns. Details of the CNN model architecture are illustrated in Figure 2.
In the data-cleaning stage, for the recorded activities dataset, duplicate entries were first resolved. Then, outliers were identified which, in our dataset, were anomalous activity readings that could stem from sensor errors, data generation glitches, or genuine, but rare behavioral patterns. Their management is intricate in labeled activity datasets: while they might introduce inaccuracies, they can also spotlight rare behavioral cues that potentially hint at cognitive issues. The outlier detection encompassed strategies like spotting activities with atypical durations or those occurring at unusual times. Clear errors, like activities logged multiple times within a minute, were discarded. Conversely, for plausible outliers, values were adjusted to more typical bounds, rather than outright removal.
To implement and optimize these CNN models, we utilized the Keras library, a powerful tool in deep learning development. Keras is a high-level neural networks API (Application Programming Interface), written in Python and capable of running on top of TensorFlow. It was developed with a focus on enabling fast experimentation and prototyping through user friendliness, modularity, and extensibility, and it was considered a suitable tool for the project’s requirements.
These features were chosen for their relevance to daily activities and behavioral patterns, which are key indicators of cognitive health. The full set of features extracted directly from cleaned data included the number of activities per day and the duration of each activity (see Table 1). We added a composite feature, an encoded multi-dimensional activity array, consisting of the activity label, its starting and ending times, and its duration.
Wearable devices, continuously monitoring and tracking the wearer’s activity throughout the day, generate a timestamped record of sensor activations or pattern identifications. The dataset was initially segmented into daily activity periods. We reasoned that changes in an individual’s daily routine could be a potential indicator of cognitive decline. For instance, a person might start waking up later, spending less time active, or changing their usual activity patterns. To capture this information, we calculated the number of total active hours per day based on sensor data that describe moderately active or highly active bouts. To capture a more comprehensive view of a subject’s daily activity, we included the total number of minutes spent actively each day as an additional feature. This is especially valuable, as it aggregates activity over an entire day, offering a holistic view of the subject’s activity level. This is crucial for our approach, as sustained levels of physical or cognitive activity could be indicative of a person’s cognitive health. The active-hours feature quantifies the cumulative duration of high-energy activities an individual engages in throughout the day. Rather than being a continuous period, these active hours may be fragmented across multiple intervals of heightened activity. The total is calculated by summing up the durations of all such high-energy activities. These activities may range from mundane tasks like showering, to more demanding activities like exercising. Observing these active activities offers valuable insights into an individual’s daily routine and lifestyle. Changes in the frequency, duration, or intensity of these activities may signal shifts in an individual’s physical health or cognitive function.
While the raw sensor data provide a granular view of the wearer’s activity, they might not convey the broader patterns of behavior. One feature that was integrated into our datasets was the average number of activities per day. This feature gave us an idea of the wearer’s average level of activity. Similarly, the standard deviation of total activity duration per day captured the variability in daily activity.
The activity fragmentation feature refers to the frequency and discontinuity of physical activity bouts throughout the day. We also included in the features set the average fragmentation over the entire monitoring period. High activity fragmentation indicates more frequent but shorter bouts of activity, whereas low activity fragmentation implies fewer but longer bouts of activity. This is particularly relevant in studies relating to cognitive decline, dementia, or AD. These conditions often lead to changes in daily routines, including sleep and activity patterns. People with cognitive impairment may have more fragmented activity patterns, frequently transitioning between periods of activity and rest throughout the day. This can be due to various factors such as fatigue, confusion, or difficulties in planning and completing tasks. To compute activity fragmentation, we first needed to define an activity bout and, in our case, an activity bout could be defined as a period during which the wearer’s activity level exceeds a certain threshold. Once these bouts were identified, we computed the activity fragmentation as the reciprocal of the mean bout length. This meant that more fragmented activity patterns, with shorter but more frequent bouts of activity, would result in a higher activity fragmentation score. The equation is depicted below, where Di represents the duration of the i bout, and n represents the total number of active bouts.
a c t i v i t y _ f r a g m e n t a t i o n = 1 1 n i = 1 n D i
Analyzing activity fragmentation can provide valuable insights into an individual’s daily routines and lifestyle. For instance, a sudden increase in activity fragmentation might indicate a disruption in the individual’s routine, and it could potentially serve as an early warning sign of cognitive impairment.
Before training, the dataset was divided into subsets: 80% for training, 10% for validation, and 10% for testing. The training set enables the model to learn the underlying patterns, while the validation set acts as a measure of the model’s generalization capabilities in real-world scenarios. This split helps mitigate the risk of overfitting, ensuring a robust model. Ultimately, the testing phase of the algorithm offers insights corresponding to the predictive accuracy of the algorithm and its potential for generalization across varied scenarios.
In the training phase of our model, a critical focus was on discerning significant patterns from the dataset that indicate cognitive health status. Our neural network, through its analysis, effectively identified correlations between daily activity metrics, such as variations in the Daily Activity Count and Multi-dimensional Activity Encoding, and potential cognitive decline. The model scrutinized changes in Total Active Hours and Average Daily Activity Count, recognizing these as possible indicators of altered cognitive states. Additionally, it paid close attention to the variability and fragmentation in daily activities, understanding that irregular patterns and disrupted rhythms in Daily Activity Duration Variability and Activity Fragmentation could signal cognitive challenges. These insights, derived from a thorough examination of the data, were instrumental in forming the basis of the model’s decision-making process.

3.2. Graph Learning Technique

Graph embeddings in GL approaches are representations of nodes and edges in a graph as vectors in a continuous vector space. They convert a graph’s relational and structural information into numerical vectors. These embeddings aim to represent the proprieties of nodes and edges in a graph and are generated using ML algorithms. A few benefits of using graph embeddings and GL are:
  • Reducing the dimensionality: In certain scenarios, graphs can be large and complex, being difficult to evaluate. Graph embeddings solve this issue by reducing the dimensionality of the graph while keeping the essential features.
  • Feature Leaning: Graph embeddings capture the inherent features and relationships between nodes and edges. This representation can be used for numerous downstream tasks, including node classification, link prediction, and graph clustering.
  • Integration with ML Models: GL offers a way to use traditional ML algorithms on graphs. After the graph is represented as vectors, tasks such as classification, regression, and clustering can be easily achieved by using classic techniques.
In our case, the graph embeddings encode essential relationships between the wellbeing self-assessment questionnaire scores. Each patient is represented as an individual node within the graph, while each node is unique to a patient (see Figure 3); indirect connections exist between them via shared relationships with other nodes (assessments and questions).
Edges in the graph are established based on the relationships between nodes. First, edges connect the nodes for creating the correlations between a user and an associated assessment type (profile, medication intake, mood/wellbeing, cognition, bodily discomfort). This edge is weighted according to the assessment’s overall score, which reflects how well the user performed on the entire assessment. The other edges indicate a link between a user and a specific assessment question, being weighted with the score for that question. A secondary connection forms between two or more patients when they engage with the same assessment or answer identical questions. Consequently, even if there is no direct edge linking two patient nodes, they can still be interconnected through these shared assessment or question nodes.
The most important steps in the GL algorithm are the following:
  • Random Walks Generation: generate random walks in the graph, a series of nodes.
  • Skip-gram Model Training: generate meaningful node embeddings, predict neighboring nodes, and capture the local and global structures of the network.
  • Embedding Extraction: extract node embeddings.
Techniques such as K-means clustering can be used to group nodes that exhibit similarities in the data. K-means clustering is a popular unsupervised ML algorithm that divides n observations into k clusters. Each observation is assigned to the cluster with the closest mean, which serves as a prototype for the cluster. Acting as an unsupervised learning algorithm, K-means does not rely on labeled data; instead, it identifies patterns and structures in the data. For our implementation, the task of K-means clustering is to group nodes that have similar embeddings, based on their relational and structural proprieties. The algorithm works by iteratively assigning each node to the cluster that has the mean vector closest to the node’s embedding. The process is repeated until convergence.
In the data-cleaning stage of the wellbeing assessment dataset, several transformations were performed to ensure data integrity and compatibility with the proposed solution pipeline. The first transformation handles the removal of any incomplete assessment to ensure a complete set of assessments. Moreover, to prepare the data for graph-based analysis, we recalibrated the total score for each assessment set. We re-scaled the individual question values to fall within the interval [1, 100], and the total scores for each assessment were set to the range interval [5, 500]. This rescaling was not arbitrary, but rather a calibrated move to align with the revised question-scoring system, thereby ensuring uniformity and comparability across data points. To focus on the most current representation of a patient’s state, we considered only the latest completed assessment set for each user. This decision aligns with our objective to capture the most recent state and, therefore, the most relevant information concerning a patient’s condition. The wellbeing assessment data set contains a single, comprehensive assessment set for each user. This set includes the user’s unique ID and scores from four different cognitive assessments, as well as the individual scores for every question within those assessments. In total, each assessment set comprises 25 distinct input features. The user ID serves as a unique identifier, while the four separate assessment scores represent performance across a range of cognitive tasks. Each assessment score is calculated by summing the scores of its individual questions.
The CNN model, designed to analyze data from wearable devices, is adept at identifying nuanced patterns in daily activity metrics. For instance, it can detect significant changes in ‘Daily Activity Count’ or ‘Total Active Hours’, which may indicate shifts in physical or cognitive health. Similarly, the ‘Activity Fragmentation’ and ‘Daily Activity Duration Variability’ are analyzed to spot irregularities in routine, a potential early marker of cognitive decline. The GL component complements this by analyzing self-reported wellbeing data, encapsulated as graph embeddings. This method brings to light complex patterns in the subjective data, such as changes in reported mood or cognition, which are crucial for understanding the overall cognitive state.

4. Evaluation Results

In the domain of healthcare research, the accessibility of data is frequently constrained due to the confidential nature of information related to patients. Legal frameworks focusing on privacy, such as the General Data Protection Regulation (GDPR), impose further limitations on the unhindered exchange of medical information for research endeavors [38]. In this context, synthetic data emerge as a pivotal solution, facilitating datasets that accurately mirror actual data without infringing upon individual privacy [39]. One of the highlighted advantages is that synthetic data allow for more flexible and ethical research.
In our approach the methodology for generating synthetic data has been meticulously calibrated to emulate authentic patient behaviors, substantiating the extrapolation of our findings to real-world situations. At the same time, the data-processing pipeline has been designed with adaptability in mind, capable of accommodating real-world data, should they become available. This ensures that our approach can be used for hypothesis testing in controlled environments, but at the same time can be a viable solution for real-world applications.
The design of the Self-Reporting Well-Being Questionnaire’ was carried out by studying similar self-reporting methods from the literature. The assessment dataset regarding data from the Self-Reporting Well-Being questionnaires is organized in a structured format, consisting of multiple records, each representing one of the 500 participants. Each record in the dataset contains answers to questions from five specialized categories, thus rendering a quintuple of data points per record. The categories are extracted from literature wellbeing questionnaires: profile, medication intake, mood/wellbeing, cognition, and bodily discomfort. To ensure uniformity in evaluation, we employ a standardized scoring system. Each question can only receive one of five possible scores: 0, 25, 50, 75, or 100. The shape of the data can be visualized as a structured matrix, where each row represents a unique patient and each column corresponds to a specific attribute or question. There are individual columns for each of the five tailored questions per category, and potentially additional columns to represent each identified class of patients: healthy and with risk of cognitive decline.
Initially, the embeddings, which encapsulate underlying node interdependencies, are extracted and transformed into two-dimensional representations through Principal Component Analysis (PCA). This dimensionality reduction technique condenses the high-dimensional embeddings into a format that can be effectively visualized and analyzed. Subsequently, the reduced embeddings undergo a K-means clustering procedure, an unsupervised learning technique, that categorizes similar nodes into distinct groups or clusters. This clustering approach effectively identifies nodes that share common relationships, enabling the identification of meaningful patterns within the graph. The GL technique is implemented using Node2Vec [40].
The focus of this analysis is to generate the distribution of nodes in the two-dimensional space. The representation provides an intuitive depiction of the inherent structure within the network, highlighting connections and relationships that might not be immediately apparent in the raw data. Figure 4 shows the clusters generated by the proposed technique. The purple clusters represent healthy individuals, while the yellow clusters represent patients with cognitive-decline risk. The clear separation of clusters with minimal overlap suggests that the Node2Vec embeddings effectively captured the underlying structures and relationships in the data. This indicates that the embeddings likely contain meaningful information relevant to the health status of individuals, which K-means clustering can distinguish. Also, the distinct grouping of the purple and yellow data points implies that there are discernible patterns in the data.
By applying Node2Vec GL to the patient dataset, we obtained a significant level of accuracy in clustering patients into the appropriate health categories. Upon analysis, it was determined that approximately 82% of the data points were correctly classified into their respective clusters. The clear demarcation of clusters in the reduced dimensional space affirms the robustness of the embeddings in encapsulating the key features that are indicative of each health condition.
The process of classifying a data point into one of distinct clusters is useful for the predictive mechanism employed by the CNN. Each cluster is assigned a specific label, serving as a categorical reference. In the process of generating data that emulate the behavior and structure of a wearable device (fitness tracker or smartwatch) activity observations, we employed a sequential process in which we simulated activity readings for 6 months for 500 patients. Each activity reading will contain the type of activity identified by the wearable, its start and end time, and the duration. Data were crafted in such a way that noise and missing data points were added to the raw dataset, to validate the subsequent processing steps. While our analytical framework is based on data with significant inherent bias, the data-acquisition phase leverages findings from extant research. Thus, we were able to label the patients based on their randomly generated behaviors. We delineated the patients into two classes: healthy and at risk of cognitive decline. The activity data model is specifically designed for comprehensive analysis and ML applications. The central component of this model is a record that stores a wide array of patient activities (see Figure 5).
Each row in this table has a unique ID, linking it to a specific patient. Temporal analysis is made possible by the categorical distinctions provided by the kind of activity, which is covered by the Activity attribute, which can be one of the following: Lunch, Sleeping, Breakfast, Grooming, Leaving, Showering, Spare-Time/TV, Snack, Toileting, Exercise. The start-time and end-time depict the beginning and ending of each action chronologically. The healthy-status attribute not only indicates if a patient is initially labeled as healthy but also provides insights into more serious conditions. It shows whether a patient has been formally evaluated with cognitive decline. The inclusion of daily fragmentation in the data model enriches the activity-centric dataset. Within this framework, fragmentation serves as a quantitative metric, potentially highlighting individuals who might display erratic behaviors or routine disruptions. Each data point, marked with a specific date, facilitates monitoring of day-to-day shifts in fragmentation. This variability is quantitatively encapsulated by the fragmentation metric itself, offering insights into the regularity of an individual’s daily activities.
In assessing the performance of our ML model, we utilized several key metrics for a comprehensive analysis. Precision measures the accuracy of the model, indicating the proportion of correctly identified cases among all cases predicted as positive for a specific class. The recall metric assesses the model’s ability to correctly identify actual cases of a condition, reflecting the proportion of actual positive cases that were accurately identified by the model. The F1-score provides a balance between precision and recall, offering a singular metric that encapsulates both aspects for a more comprehensive view of the model’s performance, which is especially useful in imbalanced datasets. Accuracy represents the overall effectiveness of the model, denoting the proportion of all predictions, both positive and negative, that the model accurately identified.
The Keras library was used for the model’s architecture. We started with a sequential structure to make sure that data would flow through the levels linearly and cohesively. The pooling layers condensed the information, covering only the most apparent traits suggestive of cognitive changes, while the convolutional layers worked to find patterns in the data. In GL evaluation for healthcare data, node classification measures the embeddings’ ability to predict node labels accurately. High accuracy indicates effective capture of key features and relationships in the graph, which are essential for reliable predictions in patient categorization. Through visual inspection, not only is the embeddings fidelity confirmed, but the interpretability is also enhanced, enabling healthcare professionals to derive meaningful insights.
The integration of the two models was accomplished using the SOFTMAX function. This function is particularly useful in classification tasks for converting model output logits into a probability distribution. We employed SOFTMAX to effectively assemble and balance the outputs of both CNN and GL models. This was done by either averaging the probabilities or using a weighted sum based on each model’s confidence levels.
The precision for identifying healthy individuals is at 100%, and the recall is at 100%, suggesting a high reliability in predicting and correctly identifying healthy individuals (Table 2). The model showcases a good precision of 80% and a high recall of 90% when dealing with patients who pose risks for cognitive decline. The F1-score for the same category stands at 81%, indicating a well-balanced prediction.

5. Conclusions

In this paper, we introduced an approach for potentially providing support to cognitive-decline assessment processes, which combines deep learning algorithms with graph-learning techniques. Our method leverages dual data streams: detailed metrics from wearable devices and comprehensive wellbeing assessment questionnaires. The wearable devices provide continuous, real-time physiological and activity data, while the wellbeing assessments offer in-depth, subjective insights into a patient’s cognitive state. By integrating these heterogeneous data sources, our system gains a polyvalent view of a patient’s condition. Our experimental results demonstrate the effectiveness of this integrated approach in precisely providing support for cognitive-decline assessment. In future work, we plan to validate our system with real-world data, a critical step to confirm its applicability and reliability in everyday settings. We also aim to refine our model through rigorous fine-tuning, focusing on improving its precision and predictive power, thereby making it a more robust tool in the potential detection of cognitive-decline assessment processes. Also, the integration of additional complex feature vectors, such as typing patterns, gestures on mobile devices, motion tracking, and speech recognition, presents an opportunity to enhance the robustness and accuracy of our model. Typing and gesture patterns on mobile devices can offer insights into fine motor skills and cognitive processing speed, which are critical indicators of cognitive health. Motion tracking can provide detailed information about a patient’s gait and physical-activity levels, which are known to correlate with cognitive functions. Speech recognition can analyze speech patterns, fluency, and language usage, offering valuable data points for assessing cognitive abilities. These advanced feature vectors may provide a more holistic view of a patient’s cognitive health, thus enhancing the predictive power of the system.

Author Contributions

Conceptualization: T.C., A.R. and G.A.; methodology: I.A., A.R. and G.A.; software: A.R. and G.A.; validation: A.R. and G.A.; formal analysis: T.C. and I.A.; investigation: A.R.; resources: T.C.; data curation: G.A.; writing-original draft preparation: T.C., I.A., A.R. and G.A.; writing—review and editing: T.C. and I.A.; visualization: I.A. All authors have read and agreed to the published version of the manuscript.

Funding

This research was funded by one grant of the Romanian National Authority for Scientific Research and Innovation, CCCDI–UEFISCDI and of the AAL Programme, with co- funding from the European Union’s Horizon 2020 research and innovation program project number AAL264/2021 engAGE within PNCDI III.

Informed Consent Statement

Not applicable.

Data Availability Statement

Data is contained within the article.

Conflicts of Interest

The authors declare no conflicts of interest.

References

  1. Pais, R.; Ruano, L.; Carvalho, O.P.; Barros, H. Global Cognitive Impairment Prevalence and Incidence in Community Dwelling Older Adults—A Systematic Review. Geriatrics 2020, 5, 84. [Google Scholar] [CrossRef] [PubMed]
  2. Alzheimer’s Association. 2020 Alzheimer’s Disease Facts and Figures; Wiley: New York, NY, USA, 2020. [Google Scholar]
  3. Garg, D.; Gupta, A.; Agarwal, A.; Mishra, B.; Srivastava, M.V.P.; Basheer, A.; Vishnu, V.Y. Latest Trends in Outcome Measures in Dementia and Mild Cognitive Impairment Trials. Brain Sci. 2022, 12, 922. [Google Scholar] [CrossRef] [PubMed]
  4. Sabbagh, M.N.; Boada, M.; Borson, S.; Chilukuri, M.; Doraiswamy, P.M.; Dubois, B.; Ingram, J.; Iwata, A.; Porsteinsson, A.P.; Possin, K.L.; et al. Rationale for Early Diagnosis of Mild Cognitive Impairment (MCI) supported by Emerging Digital Technologies. J. Prev. Alzheimer’s Dis. 2020, 7, 158–164. [Google Scholar] [CrossRef] [PubMed]
  5. Cullen, B.; O’Neill, B.; Evans, J.J.; Coen, R.F.; Lawlor, B.A. A review of screening tests for cognitive impairment. J. Neurol. Neurosurg. Psychiatry 2007, 78, 790–799. [Google Scholar] [CrossRef] [PubMed]
  6. World Health Organization. Mental Health Atlas. 2017. Available online: https://www.who.int/mental_health/evidence/atlas/mental_health_atlas_2017/en/ (accessed on 15 November 2023).
  7. van Harten, A.C.; Mielke, M.M.; Swenson-Dravis, D.M.; Hagen, C.E.; Edwards, K.K.; Roberts, R.O.; Geda, Y.E.; Knopman, D.S.; Petersen, R.C. Subjective cognitive decline and risk of MCI: The Mayo Clinic Study of Aging. Neurology 2018, 91, e300–e312. [Google Scholar] [CrossRef] [PubMed]
  8. McCollum, L.; Karlawish, J. Cognitive Impairment Evaluation and Management. Med. Clin. N. Am. 2020, 104, 807–825. [Google Scholar] [CrossRef]
  9. Edmonds, E.C.; Delano-Wood, L.; Clark, L.R.; Jak, A.J.; Nation, D.A.; McDonald, C.R.; Libon, D.J.; Au, R.; Galasko, D.; Salmon, D.P.; et al. Susceptibility of the conventional criteria for mild cognitive impairment to false-positive diagnostic errors. Alzheimer’s Dement. 2015, 11, 415–424. [Google Scholar] [CrossRef]
  10. Lim, Y.Y.; Kong, J.; Maruff, P.; Jaeger, J.; Huang, E.; Ratti, E. Longitudinal Cognitive Decline in Patients with Mild Cognitive Impairment or Dementia Due to Alzheimer’s Disease. J. Prev. Alzheimer’s Dis. 2022, 9, 178–183. [Google Scholar] [CrossRef]
  11. Ahamed, F.; Shahrestani, S.; Cheung, H. Internet of Things and Machine Learning for Healthy Ageing: Identifying the Early Signs of Dementia. Sensors 2020, 20, 6031. [Google Scholar] [CrossRef]
  12. Zhou, Q.; Wang, J.; Yu, X.; Wang, S.; Zhang, Y. A Survey of Deep Learning for Alzheimer’s Disease. Mach. Learn. Knowl. Extr. 2023, 5, 611–668. [Google Scholar] [CrossRef]
  13. Moradi, E.; Pepe, A.; Gaser, C.; Huttunen, H.; Tohka, J.; Alzheimer’s Disease Neuroimaging Initiative. Machine learning framework for early MRI-based Alzheimer’s conversion prediction in MCI subjects. NeuroImage 2015, 104, 398–412. [Google Scholar] [CrossRef] [PubMed]
  14. Alashwal, H.; El Halaby, M.; Crouse, J.J.; Abdalla, A.; Moustafa, A.A. The Application of Unsupervised Clustering Methods to Alzheimer’s Disease. Front. Comput. Neurosci. 2019, 13, 31. [Google Scholar] [CrossRef] [PubMed]
  15. Taherdoost, H. Deep Learning and Neural Networks: Decision-Making Implications. Symmetry 2023, 15, 1723. [Google Scholar] [CrossRef]
  16. Lee, G.; Nho, K.; Kang, B.; Sohn, K.A.; Kim, D.; Alzheimer’s Disease Neuroimaging Initiative. Predicting Alzheimer’s disease progression using multi-modal deep learning approach. Sci. Rep. 2019, 9, 1952. [Google Scholar] [CrossRef] [PubMed]
  17. Wanigatunga, A.; Liu, F.; Wang, H.; Urbanek, J.; An, Y.; Simonsick, E.; Resnick, S.; Schrack, J. Daily Physical Activity Patterns: A Window on Cognitive Decline in the Baltimore Longitudinal Study of Aging (BLSA). Innov. Aging 2021, 5 (Suppl. S1), 443–444. [Google Scholar] [CrossRef]
  18. Shukla, A.; Tiwari, R.; Tiwari, S. Review on Alzheimer Disease Detection Methods: Automatic Pipelines and Machine Learning Techniques. Sci 2023, 5, 13. [Google Scholar] [CrossRef]
  19. Muhammed Niyas, K.P.; Thiyagarajan, P. A systematic review on early prediction of Mild cognitive impairment to alzheimers using machine learning algorithms. Int. J. Intell. Netw. 2023, 4, 74–88. [Google Scholar] [CrossRef]
  20. Javed, A.R.; Saadia, A.; Mughal, H.; Gadekallu, T.R.; Rizwan, M.; Maddikunta, P.K.R.; Mahmud, M.; Liyanage, M.; Hussain, A. Artificial Intelligence for Cognitive Health Assessment: State-of-the-Art, Open Challenges and Future Directions. Cogn. Comput. 2023, 15, 1767–1812. [Google Scholar] [CrossRef]
  21. Gomes, K.B.; Pereira, R.G.; Braga, A.A.; Guimarães, H.C.; Resende, E.d.P.F.; Teixeira, A.L.; Barbosa, M.T.; Junior, W.M.; Carvalho, M.d.G.; Caramelli, P. Machine Learning-Based Routine Laboratory Tests Predict One-Year Cognitive and Functional Decline in a Population Aged 75+ Years. Brain Sci. 2023, 13, 690. [Google Scholar] [CrossRef]
  22. Chiu, S.-I.; Fan, L.-Y.; Lin, C.-H.; Chen, T.-F.; Lim, W.S.; Jang, J.-S.R.; Chiu, M.-J. Machine Learning-Based Classification of Subjective Cognitive Decline, Mild Cognitive Impairment, and Alzheimer’s Dementia Using Neuroimage and Plasma Biomarkers. ACS Chem. Neurosci. 2022, 13, 3263–3270. [Google Scholar] [CrossRef]
  23. Zhou, T.; Thung, K.H.; Liu, M.; Shi, F.; Zhang, C.; Shen, D. Multi-modal latent space inducing ensemble SVM classifier for early dementia diagnosis with neuroimaging data. Med. Image Anal. 2020, 60, 101630. [Google Scholar] [CrossRef] [PubMed]
  24. Liu, S.; Liu, S.; Cai, W.; Che, H.; Pujol, S.; Kikinis, R.; Feng, D.; Fulham, M.J. Multimodal neuroimaging feature learning for multiclass diagnosis of Alzheimer’s disease. IEEE Trans. Biomed. Eng. 2015, 62, 1132–1140. [Google Scholar] [CrossRef] [PubMed]
  25. Shi, R.; Sheng, C.; Jin, S.; Zhang, Q.; Zhang, S.; Zhang, L.; Ding, C.; Wang, L.; Wang, L.; Han, Y.; et al. Generative adversarial network constrained multiple loss autoencoder: A deep learning-based individual atrophy detection for Alzheimer’s disease and mild cognitive impairment. Hum. Brain Mapp. 2023, 44, 1129–1146. [Google Scholar] [CrossRef]
  26. Taye, M.M. Understanding of Machine Learning with Deep Learning: Architectures, Workflow, Applications and Future Directions. Computers 2023, 12, 91. [Google Scholar] [CrossRef]
  27. Sarraf, S.; DeSouza, D.D.; Anderson, J.; Tofighi, G.; Alzheimer’s Disease Neuroimaging Initiative. DeepAD: Alzheimer Disease Classification via Deep Convolutional Neural Networks using MRI and fMRI. bioRxiv 2017. [Google Scholar] [CrossRef]
  28. Stalin Babu, G.; Rao, S.N.T.; Rao, R.R. Alzheimer’s Disease Prediction via Optimized Deep Learning Framework. In Proceedings of the Second International Conference on Advances in Computer Engineering and Communication Systems, Singapore, 23 January 2022. [Google Scholar]
  29. Diaz, V.; Rodriguez, G. Machine Learning for Detection of Cognitive Impairment. Acta Polytech. Hung. 2022, 19, 195–213. [Google Scholar] [CrossRef]
  30. Jeon, Y.; Kang, J.; Kim, B.C.; Lee, K.H.; Song, J.-I.; Gwak, J. Early Alzheimer’s Disease Diagnosis Using Wearable Sensors and Multilevel Gait Assessment: A Machine Learning Ensemble Approach. IEEE Sens. J. 2023, 23, 10041–10053. [Google Scholar] [CrossRef]
  31. Lin, F.; Han, J.; Xue, T.; Lin, J.; Chen, S.; Zhu, C.; Lin, H.; Chen, X.; Lin, W.; Huang, H. Predicting cognitive impairment in outpatients with epilepsy using machine learning techniques. Sci. Rep. 2021, 11, 20002. [Google Scholar] [CrossRef]
  32. Lin, L.; Xiong, M.; Zhang, G.; Kang, W.; Sun, S.; Wu, S.; Initiative Alzheimer’s Disease Neuroimaging. A Convolutional Neural Network and Graph Convolutional Network Based Framework for AD Classification. Sensors 2023, 23, 1914. [Google Scholar] [CrossRef]
  33. Tang, H.; Guo, L.; Dennis, E.; Thompson, P.M.; Huang, H.; Ajilore, O.; Leow, A.D.; Zhan, L. Classifying Stages of Mild Cognitive Impairment via Augmented Graph Embedding. In Multimodal Brain Image Analysis and Mathematical Foundations of Computational Anatomy; Zhu, D., Yan, J., Huang, H., Shen, L., Thompson, P.M., Westin, C.-F., Pennec, X., Joshi, S., Nielsen, M., Fletcher, T., et al., Eds.; Springer International Publishing: Berlin/Heidelberg, Germany, 2019; pp. 30–38. [Google Scholar]
  34. Xu, M.; Sanz, D.L.; Garces, P.; Maestu, F.; Li, Q.; Pantazis, D. A Graph Gaussian Embedding Method for Predicting Alzheimer’s Disease Progression with MEG Brain Networks. IEEE Trans. Biomed. Eng. 2021, 68, 1579–1588. [Google Scholar] [CrossRef]
  35. Lei, B.; Zhu, Y.; Yu, S.; Hu, H.; Xu, Y.; Yue, G.; Wang, T.; Zhao, C.; Chen, S.; Yang, P.; et al. Multi-scale enhanced graph convolutional network for mild cognitive impairment detection. Pattern Recognit. 2023, 134, 109106. [Google Scholar] [CrossRef]
  36. Ahmedt-Aristizabal, D.; Armin, M.A.; Denman, S.; Fookes, C.; Petersson, L. Graph-Based Deep Learning for Medical Diagnosis and Analysis: Past, Present and Future. Sensors 2021, 21, 4758. [Google Scholar] [CrossRef] [PubMed]
  37. Holm, A.N.; Wright, D.; Augenstein, I. Revisiting Softmax for Uncertainty Approximation in Text Classification. Information 2023, 14, 420. [Google Scholar] [CrossRef]
  38. Appenzeller, A.; Leitner, M.; Philipp, P.; Krempel, E.; Beyerer, J. Privacy and Utility of Private Synthetic Data for Medical Data Analyses. Appl. Sci. 2022, 12, 12320. [Google Scholar] [CrossRef]
  39. Chen, R.J.; Lu, M.Y.; Chen, T.Y.; Williamson, D.F.K.; Mahmood, F. Synthetic data in machine learning for medicine and healthcare. Nat. Biomed. Eng. 2021, 5, 493–497. [Google Scholar] [CrossRef]
  40. Grover, A.; Leskovec, J. Node2vec: Scalable Feature Learning for Networks. In Proceedings of the 22nd ACM SIGKDD International Conference on Knowledge Discovery and Data Mining (KDD ‘16), San Francisco, CA, USA, 13–17 August 2016; Association for Computing Machinery: New York, NY, USA, 2016; pp. 855–864. [Google Scholar]
Figure 1. Deep learning and graph-embedding architecture.
Technologies 12 00003 g001
Figure 2. Architecture of the CNN model.
Technologies 12 00003 g002
Figure 3. Graph representation of the cognitive-assessment evaluation (red arrow—score for an assessment; blue arrow—score for a question).
Technologies 12 00003 g003
Figure 4. GL clustering results after the dimensionality reduction (patients labeled as healthy are represented with purple; those labeled as with risk of cognitive decline are represented with yellow).
Technologies 12 00003 g004
Figure 5. Activity Data Model representation.
Technologies 12 00003 g005
Table 1. Features used in training the ML models.
FeatureDescription
Daily Activity CountTotal number of activities performed daily. It helps in understanding the general activity level, which can be indicative of changes in physical and cognitive health.
Multi-dimensional Activity EncodingEncoded array with activity type, start and end timestamps, and duration. This provides a detailed view of the patient’s daily routine, allowing the chance to identify any deviations or irregularities that might signal cognitive decline.
Total Active HoursCumulative duration of moderate to high energy expenditure activities in a day. It is an important metric for assessing the physical aspect of cognitive health, as changes in active hours can reflect alterations in energy levels and overall wellness.
Average Daily Activity CountThe mean activity count over the monitoring period, offering insights into the subject’s routine consistency, which is often disrupted in cognitive decline.
Daily Activity Duration VariabilityThe standard deviation of active daily activity durations. High variability can indicate irregular activity patterns, a potential marker of cognitive issues.
Activity FragmentationReciprocal of the mean bout length, indicating the rhythm and continuity of activity bouts. Disrupted activity fragmentation is often associated with cognitive decline, as it reflects challenges in maintaining regular, sustained activities.
Average FragmentationMean activity fragmentation over the entire monitoring span
Table 2. Metrics results values.
MetricHealthyRisk of Cognitive Decline
Precision100%80%
Recall100%90%
F1-Score100%81%
Disclaimer/Publisher’s Note: The statements, opinions and data contained in all publications are solely those of the individual author(s) and contributor(s) and not of MDPI and/or the editor(s). MDPI and/or the editor(s) disclaim responsibility for any injury to people or property resulting from any ideas, methods, instructions or products referred to in the content.

