Systematic Review

Tendency on the Application of Drill-Down Analysis in Scientific Studies: A Systematic Review

by
Victor Hugo Silva-Blancas
1,
José Manuel Álvarez-Alvarado
2,*,
Ana Marcela Herrera-Navarro
1 and
Juvenal Rodríguez-Reséndiz
2,*
1
Facultad de Informática, Universidad Autónoma de Querétaro, Querétaro 76230, Mexico
2
Facultad de Ingeniería, Universidad Autónoma de Querétaro, Querétaro 76010, Mexico
*
Authors to whom correspondence should be addressed.
Technologies 2023, 11(4), 112; https://doi.org/10.3390/technologies11040112
Submission received: 10 July 2023 / Revised: 6 August 2023 / Accepted: 11 August 2023 / Published: 13 August 2023
(This article belongs to the Special Issue Advances in Applications of Intelligently Mining Massive Data)

Abstract

:
With the fact that new server technologies are coming to market, it is necessary to update or create new methodologies for data analysis and exploitation. Applied methodologies go from decision tree categorization to artificial neural networks (ANN) usage, which implement artificial intelligence (AI) for decision making. One of the least used strategies is drill-down analysis (DD), belonging to the decision trees subcategory, which because of not having AI resources has lost interest among researchers. However, its easy implementation makes it a suitable tool for database processing systems. This research has developed a systematic review to understand the prospective of DD analysis on scientific literature in order to establish a knowledge platform and establish if it is convenient to drive it to integration with superior methodologies, as it would be those based on ANN, and produce a better diagnosis in future works. A total of 80 scientific articles were reviewed from 1997 to 2023, showing a high frequency in 2021 and experimental as the predominant methodology. From a total of 100 problems solved, 42% were using the experimental methodology, 34% descriptive, 17% comparative, and just 7% post facto. We detected 14 unsolved problems, from which 50% fall in the experimental area. At the same time, by study type, methodologies included correlation studies, processes, decision trees, plain queries, granularity, and labeling. It was observed that just one work focuses on mathematics, which reduces new knowledge production expectations. Additionally, just one work manifested ANN usage.

1. Introduction

Currently, big computers size’ measure velocity on petaflops where processors manage to use up to 15 cores for command processing [1]. This kind of power opens an opportunity window for hard disks, buses, and dynamic memory design, making software engineering lag behind. The computer industry and its products are still losing pace against this dynamic change because software development is behind hardware [2]. Before this scenario, data warehouse (DW) techniques had allowed new database version development, such as Oracle 19i, whose Transparent Data Encryption technology let sensitive data encryption, which is stored in tables and tablespaces, granting privacy and security to the user where it was not done previously [3]. Process time during encryption administration increases considerably when it only has 32 bit processors or less as a base, so encryption and volume require capable enough hardware to support them. Even so, to improve efficiency on DW, there have been new techniques created such as Deep Reinforcement Learning, which is an agent trained on historical data on storage operations and retrieving [4]. In the case of normalization, there has been a fault of standardization and disconnection between the theoretical environment and practical applications, which has given as a result methodologies that suggest data structure map out, documentation on design, and panels for monitoring [5]. Other techniques that improved the performance of DW are data cube (DC), which is frequently used in On-Line Analytical Processing (OLAP) [6], and the drill-up method, which adds elements to the process line by clustering nodes and edges with similar derivation histories [7]. However, there is also a tendency for the use of DD analysis to make cross-references that focus on patterns and observations in independent sources [8] on data analysis, and the business communications between users are also improved with DD interaction [9].
Between storage technology and mining design, the question surges over the necessity of redesign techniques to exploit all these potentialities. As an answer emerges DD analysis, which has been implemented inside deterministic parameters, although underutilized because of its lack of AI application by not using machine learning (ML) techniques. That is why this research is pursuing the answer to the question of if the lack of ML tool implementation on DD analysis has constituted a limitation for its technological evolution in the scientific literature.
Existing works have shown the use of DD as a support tool for solutions research on data analysis problems. However, under actual circumstances, it has limitations that could be solved if the methodology is improved with ANN modeling implementation, which will be not only an advance in technology terms but a way to exploit new hardware and software resources. Moreover, this investigation proposes a methodology classification that could be used for clarifying the state-of-the-art on DD analysis and helps researchers to introduce in their own works the methodology that will help to reach their objectives.
As a systemic review, it is important to notice that patterns about productivity in scientific journals are discipline-specific, meaning that each one has its own measures and that productivity will raise projection on statistics or outperform in journal impact [10], in this case, depending on DD references. The frequency of DD analysis usage in the scientific literature will determine if it is convenient to improve this technique through the implementation of ANN surpassing limitations that are currently confronted, such as the shortage of knowledge generation.
This manuscript is structured as follows: in Section 2, DD analysis general characteristics are explained along with their contextual theme. Section 3 shows the explanation of the dataset origins and the methodology for experimental work. In Section 4, results of the analysis are presented. In Section 5, a discussion about the findings is elaborated, and in Section 6, conclusions are offered.

2. Theoretical Fundaments

The objective of this investigation is to determine DD analysis from the results perspective of its implementation, using it as a search guide, among other things, concepts of DD (which is the subject of study), overfitting (which is one of its most frequent problems), data mining DM (which uses it as a tool), and deterministic model (whose designs are the most frequently used).
In addition, we also want to retrieve a list of all methodologies used and the results produced both for and against its particular objectives. In this way, we can propose a methodology that generalizes results and suggests solutions that can be justified in the course of experimentation.

2.1. DD Analysis

DD analysis is a deterministic model that helps to provide different data images in reports, schemas, and spreadsheets, which makes it simple and helps to reveal the tendency origin exposed during the study phase [11]. DD analysis applications go from medicine [12] and production [13] to malware detection [14], visualization [15], and data administration [16].
In modern decision panels, it is easy to understand but not to implement because its principal limitation is the DM exploitation, which utilizes models from probabilistic to deterministic and generates some problems, such as recursivity and letting aside base knowledge production. In ML, overfitting occurs when a given model develops very well in the training stage but falls significantly in the test one [17]. Figure 1 shows the overfitting nature with respect to model usage and error retrieved, using optimization as an arbitrary frontier determined by the application model.
Overfitting occurs when the parsimony principle is violated in the use of models or procedures. This is when more than the necessary terms are included or there are more complicated approaches than required. There are two overfitting types [18]:
  • To use a model more flexible than it should be, and
  • To over-represent performance on a dataset.
Models with overfitting tend to memorize all training data, including noise, instead to learn the hidden knowledge inside the data. Some solutions to avoid this problem, according to [19], are:
  • Early-stopping, which prevents the algorithm precision to stop improving after a certain point.
  • Network-reduction, which is about reducing the noise amount when reducing the classification model size.
  • Training-data expansion, which is to improve the training dataset quantity and quality, especially in supervised learning areas.
During ANN utilization, the parameters’ increase demands a great quantity of training data to tune hyper-parameters. To reduce overfitting, even a perfect training must not only be big in size, but include limited dosages of noise.

2.2. Deterministic Models

Deterministic models are those that, when subjected to the same impulse, lack uncertainty. In other words, they can be predicted with certainty and their behavior is evaluated with effectivity or efficacy measures.
Deterministic models are classified in tree programming methods according to [20], which are:
  • Linear programming;
  • Entire mixed linear programming;
  • Algorithms.
Some techniques utilized in linear programming are a variable identification of those that influence the supplies lost, diffuse linear programming to improve the supply chain, and integrate linear programming focused on heuristic aspects. Their limitations are established when all these methods have an objective to maximize earnings or minimize costs. In the case of entire mixed linear programming, it is required that variables have as much of the integer values as no negatives with what it could obtain results on coordination and control for subsequent studies. However, we notice a restriction for two variables when they are integers and there is binary number utilization. In the case of algorithms, these are used due to the complexity existing in production systems and the objective we want to achieve. They are a solution to the problems that cannot be solved by conventional methods or using different types such as multi-objective algorithms or genetics, among others.
The above comes up because DD analysis has been developed and implemented always inside deterministic models, lagging behind when state-of-the-art models are used, such as those supplied by the ANN.

3. Materials and Methods

To conduct the systematic review, it is necessary to adopt a quantitative profile because this process is performed on scientific literature available online with normalized vectors (which we will see ahead). This allows for the retrieval of sizable, quantified, and predictable results, which is what concerns quantitative research.

3.1. Data Source

The used research criterion includes journal articles that are listed in the Journal Citation Reports of those published by IOP, Nature, IEEE, MDPI, and others, whose topics used DD analysis in their particular methodologies or utilized methodologies leading to DM. During the first stage, dataset recollection, articles were grouped by type of work, methodology, and solved and unsolved problems when authors decide to report them. Table 1 shows the recollection criteria.
Based on the Preferred Reporting Items for Systematic Reviews and Meta-Analyses (PRISMA) [21] specifications, on the selection process, 200 works were reviewed, and from them, only 80 were selected as the base. Special emphasis was made on those referring to DD analysis or DM processes on its methodology. The search was focused on data science engines and, in some cases, on engineering related to computer science.
With the aim of facilitating normalization, the dataset was enriched by adding the methodology classification proposed by Khaldi [22], which includes in the experimental design: true experimental when variables can be manipulated, quasi-experimental when variables are manipulated in a controlled environment, and single subject in very punctual cases, which has not been included in this research. In the case of non-experimental design, on which variables cannot be manipulated, it was divided into: descriptive when there is data recollection, comparative when relationships are looked up, correlational when there are possible but not forced relationships, survey when it refers to surveys, and post facto when it focuses on effects and tries to establish causes.

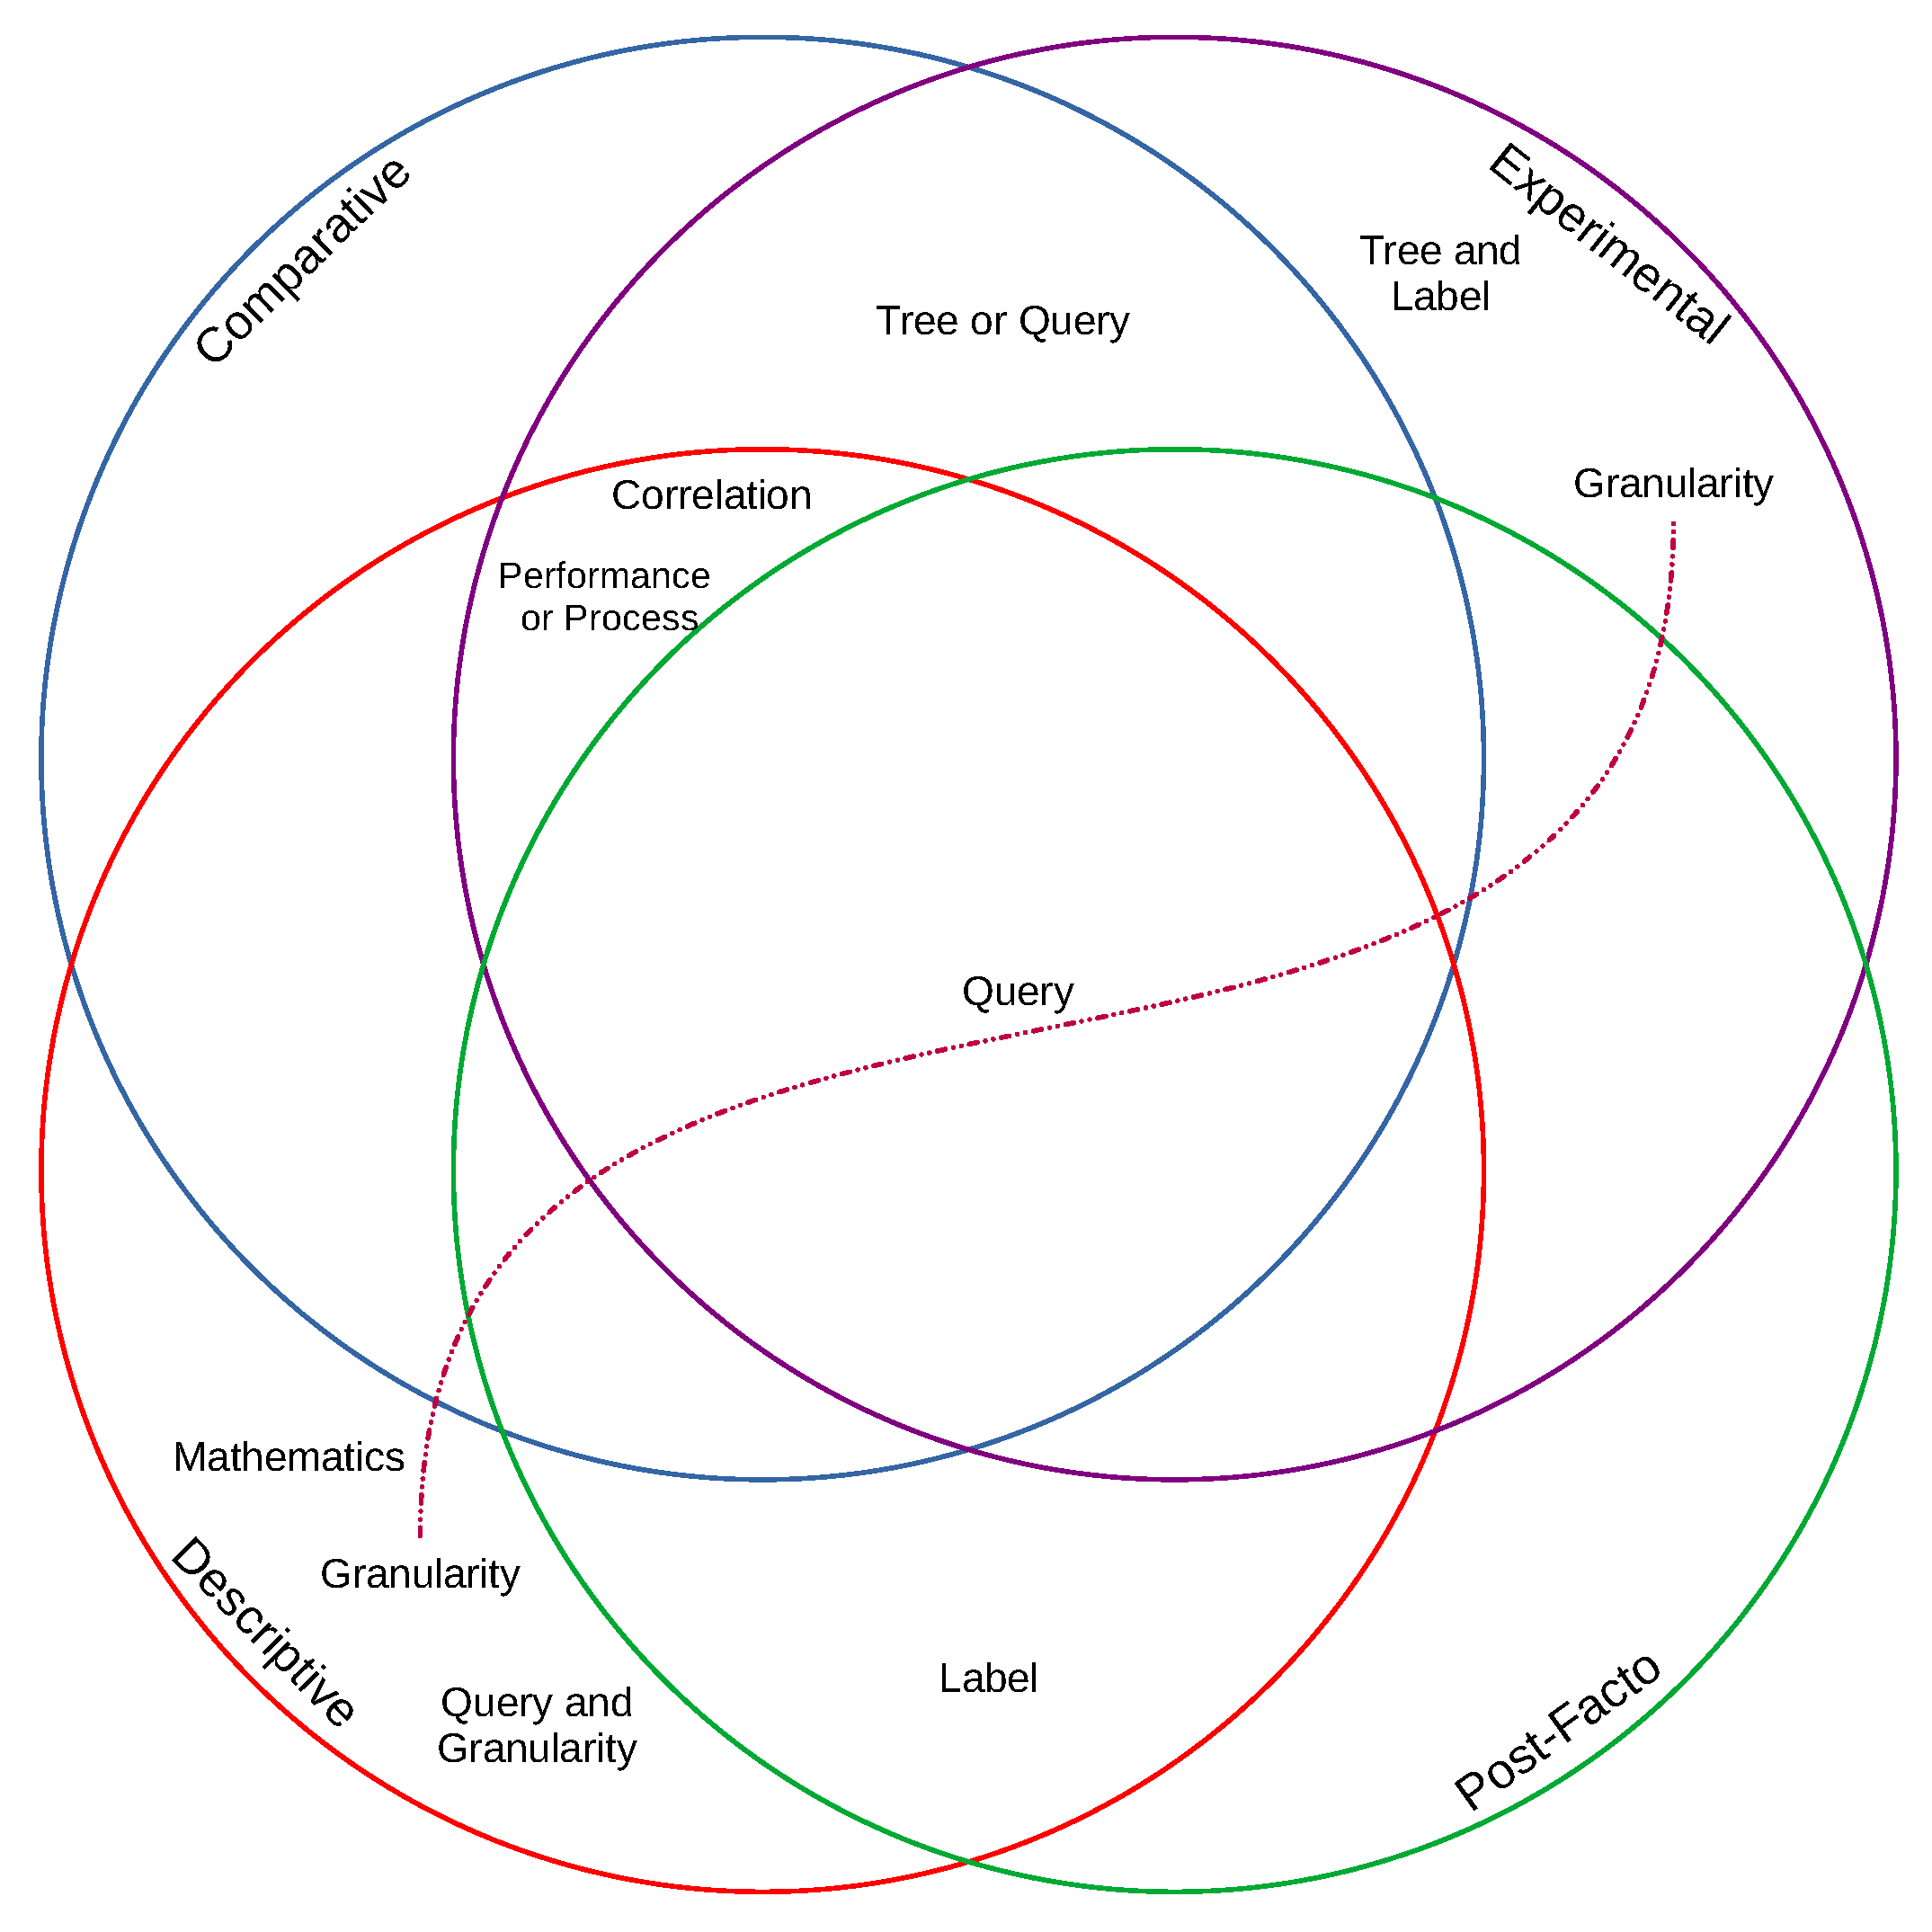
3.2. Works Clustered by Methodology

Already enriched, the dataset was given a procedure to cluster by methodology following the next steps: first, ordering by the recently added methodology attribute; second, ordering by publication year; and third, ordering by methodology approach. Then, it was divided by methodology tables to offer an easier visualization. This procedure will permit categorization by methodology analysis and its inner types, and at the same time, it will avoid the use of a single table. The methodology approach, on column Type, refers either to the type of work, which could be a mathematical analysis, or a process performed. Regarding the referred methodologies type, it will be described next.

3.2.1. Tree

It is inferred that classification trees and regression are used to identify local structures in both big as well as small datasets. Classification trees include models on which dependent variables are categorical, while regression trees are continuous [23].

3.2.2. Query

There are numerous query processing techniques, of which the most popular are those based on aleatory selection, where selection is realized in little samples, which is later extrapolated to the rest of the database [24].

3.2.3. Correlation

Correlation analysis allows users to specify two or more key attributes in a dataset, with the aim of making an analysis by calculating the correlation between each pair of selected columns producing, regularly, a result matrix [25].

3.2.4. Granularity

This is the task of grouping in granules, groups, classes, or clusters from a universe in the process of solving the problem [26].

3.3. Normalizing

To be able to quantitatively shape the research, a normalization was applied by manually vectorizing columns by separating the publication year, methodology, and type, besides the number of problems solved and not solved, as Table 2 shows.

3.4. Variable Definition

To define research variables, it was necessary to look up concepts according to key performance indicators, which are those elements that can measure the achievement procurement [27]. They were adapted to the standard definitions design of ISO-9000, so creating performance indicators could be related with the activity management [28], which are specified in Table 3.
Where:
  • The sum of works will establish the quantity of knowledge around the DD analysis on the scientific community. The denominator is the sum of time defined during the process [29].
  • The modal will indicate the year the technique was more utilized and that it will be compared with the new knowledge stagnation or the absence of ANN techniques.
  • Sum of problems solved and problems not solved will determine the proportionality of the successful method and the causes responsible for its no- usage in subsequent works. In set theory, this is represented by the method, which belongs to the objective searched.

3.5. Dataset and Software

The dataset and process software are found in [30].

4. Results

Below are shown the results obtained from the systemic revision of the scientific literature.

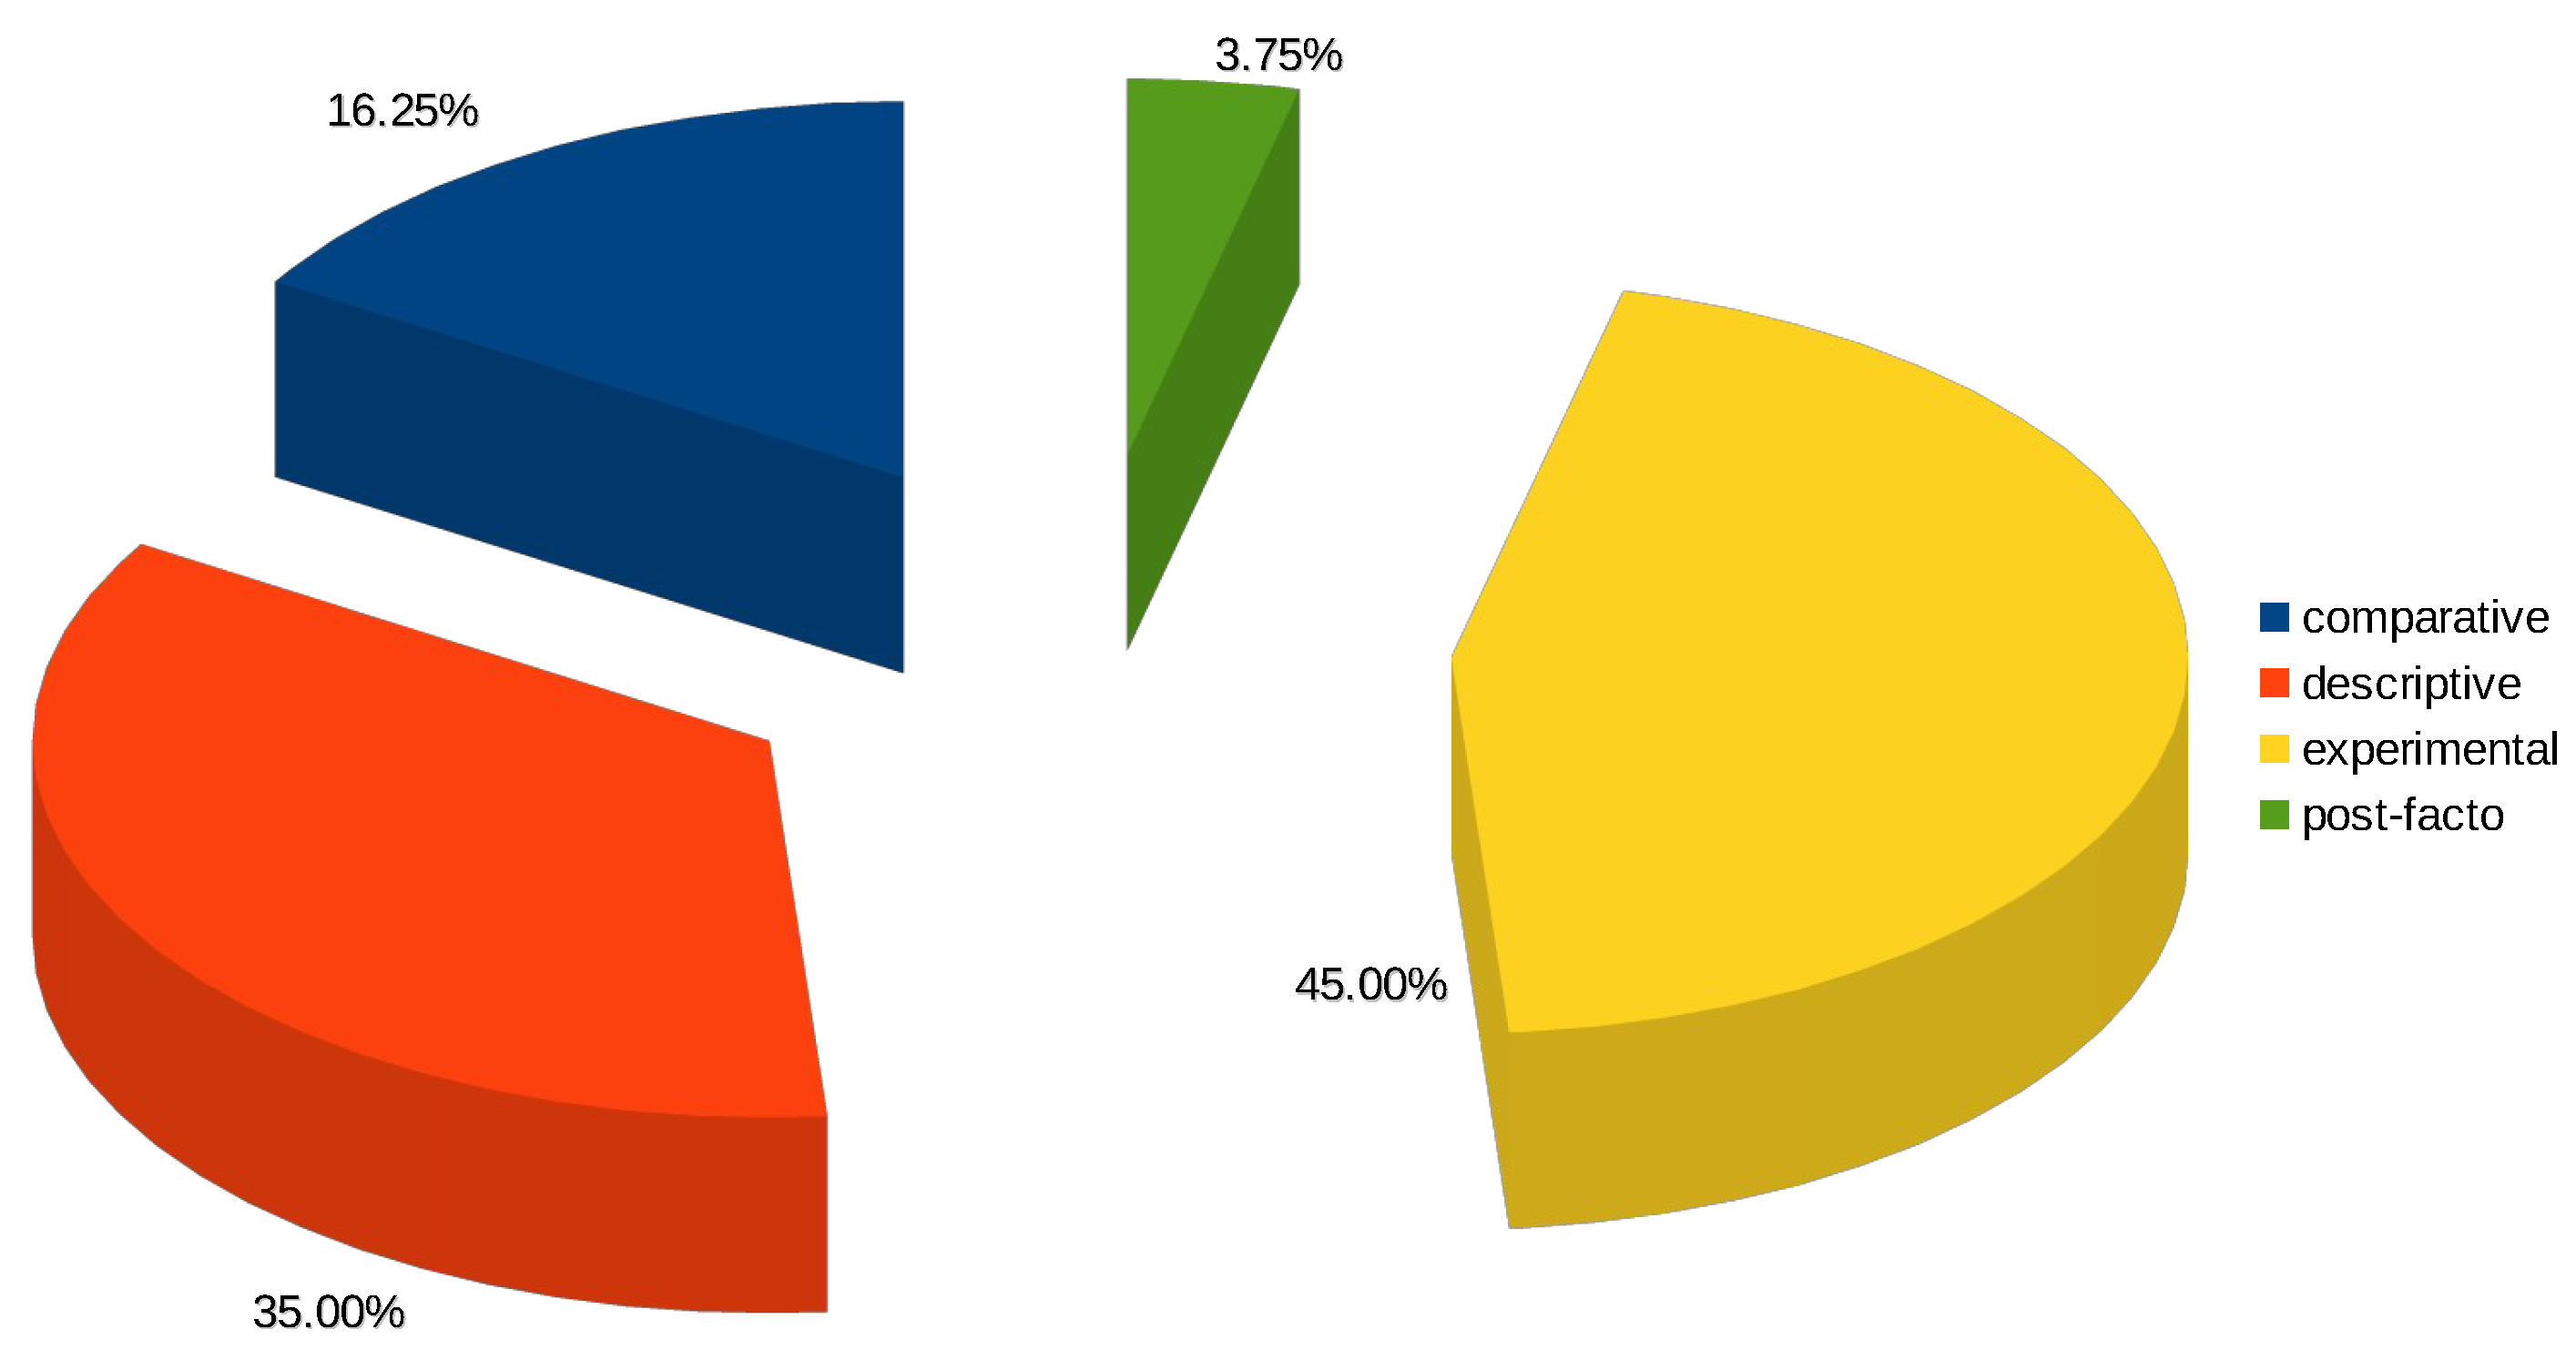
4.1. Data Distribution

Considering that work [31] from 1997 is an extreme value, which was used as an initial reference of the DD analysis implementation over procedural language on SQL (PL/SQL), and starting from 2004 to 2022, the mathematical mean by year was established on 4. Figure 2 shows its growth after the start of 4G communication networks technology and it soaring during the COVID-19 pandemic in 2021, produced by works that were focused on the research caused by this disease.
Normalized and categorized tables are shown next.

4.1.1. Comparative

Those works in which the performance, processes, a correlation on a pair basis, or simple query are compared are shown in Table 4.

4.1.2. Descriptive

All those works that intended to depict data and their relationships are listed in Table 5, sorted by year and analysis type.

4.1.3. Experimental

One of the best ways to reach data science is the experimental approach. Table 6 shows those works that focused on the results, specifically when performance or query were involved.

4.1.4. Post Facto

Table 7 lists those works for which the methodology was looking for effects intending to justify causes. The fact is that so few studies emphasize the lack of theories that are subject to verification.
Once the dataset was processed with the application software, both independent variable and dependent variable incidence were obtained, along with the sum of studies that are related to them. Table 8 shows the results.

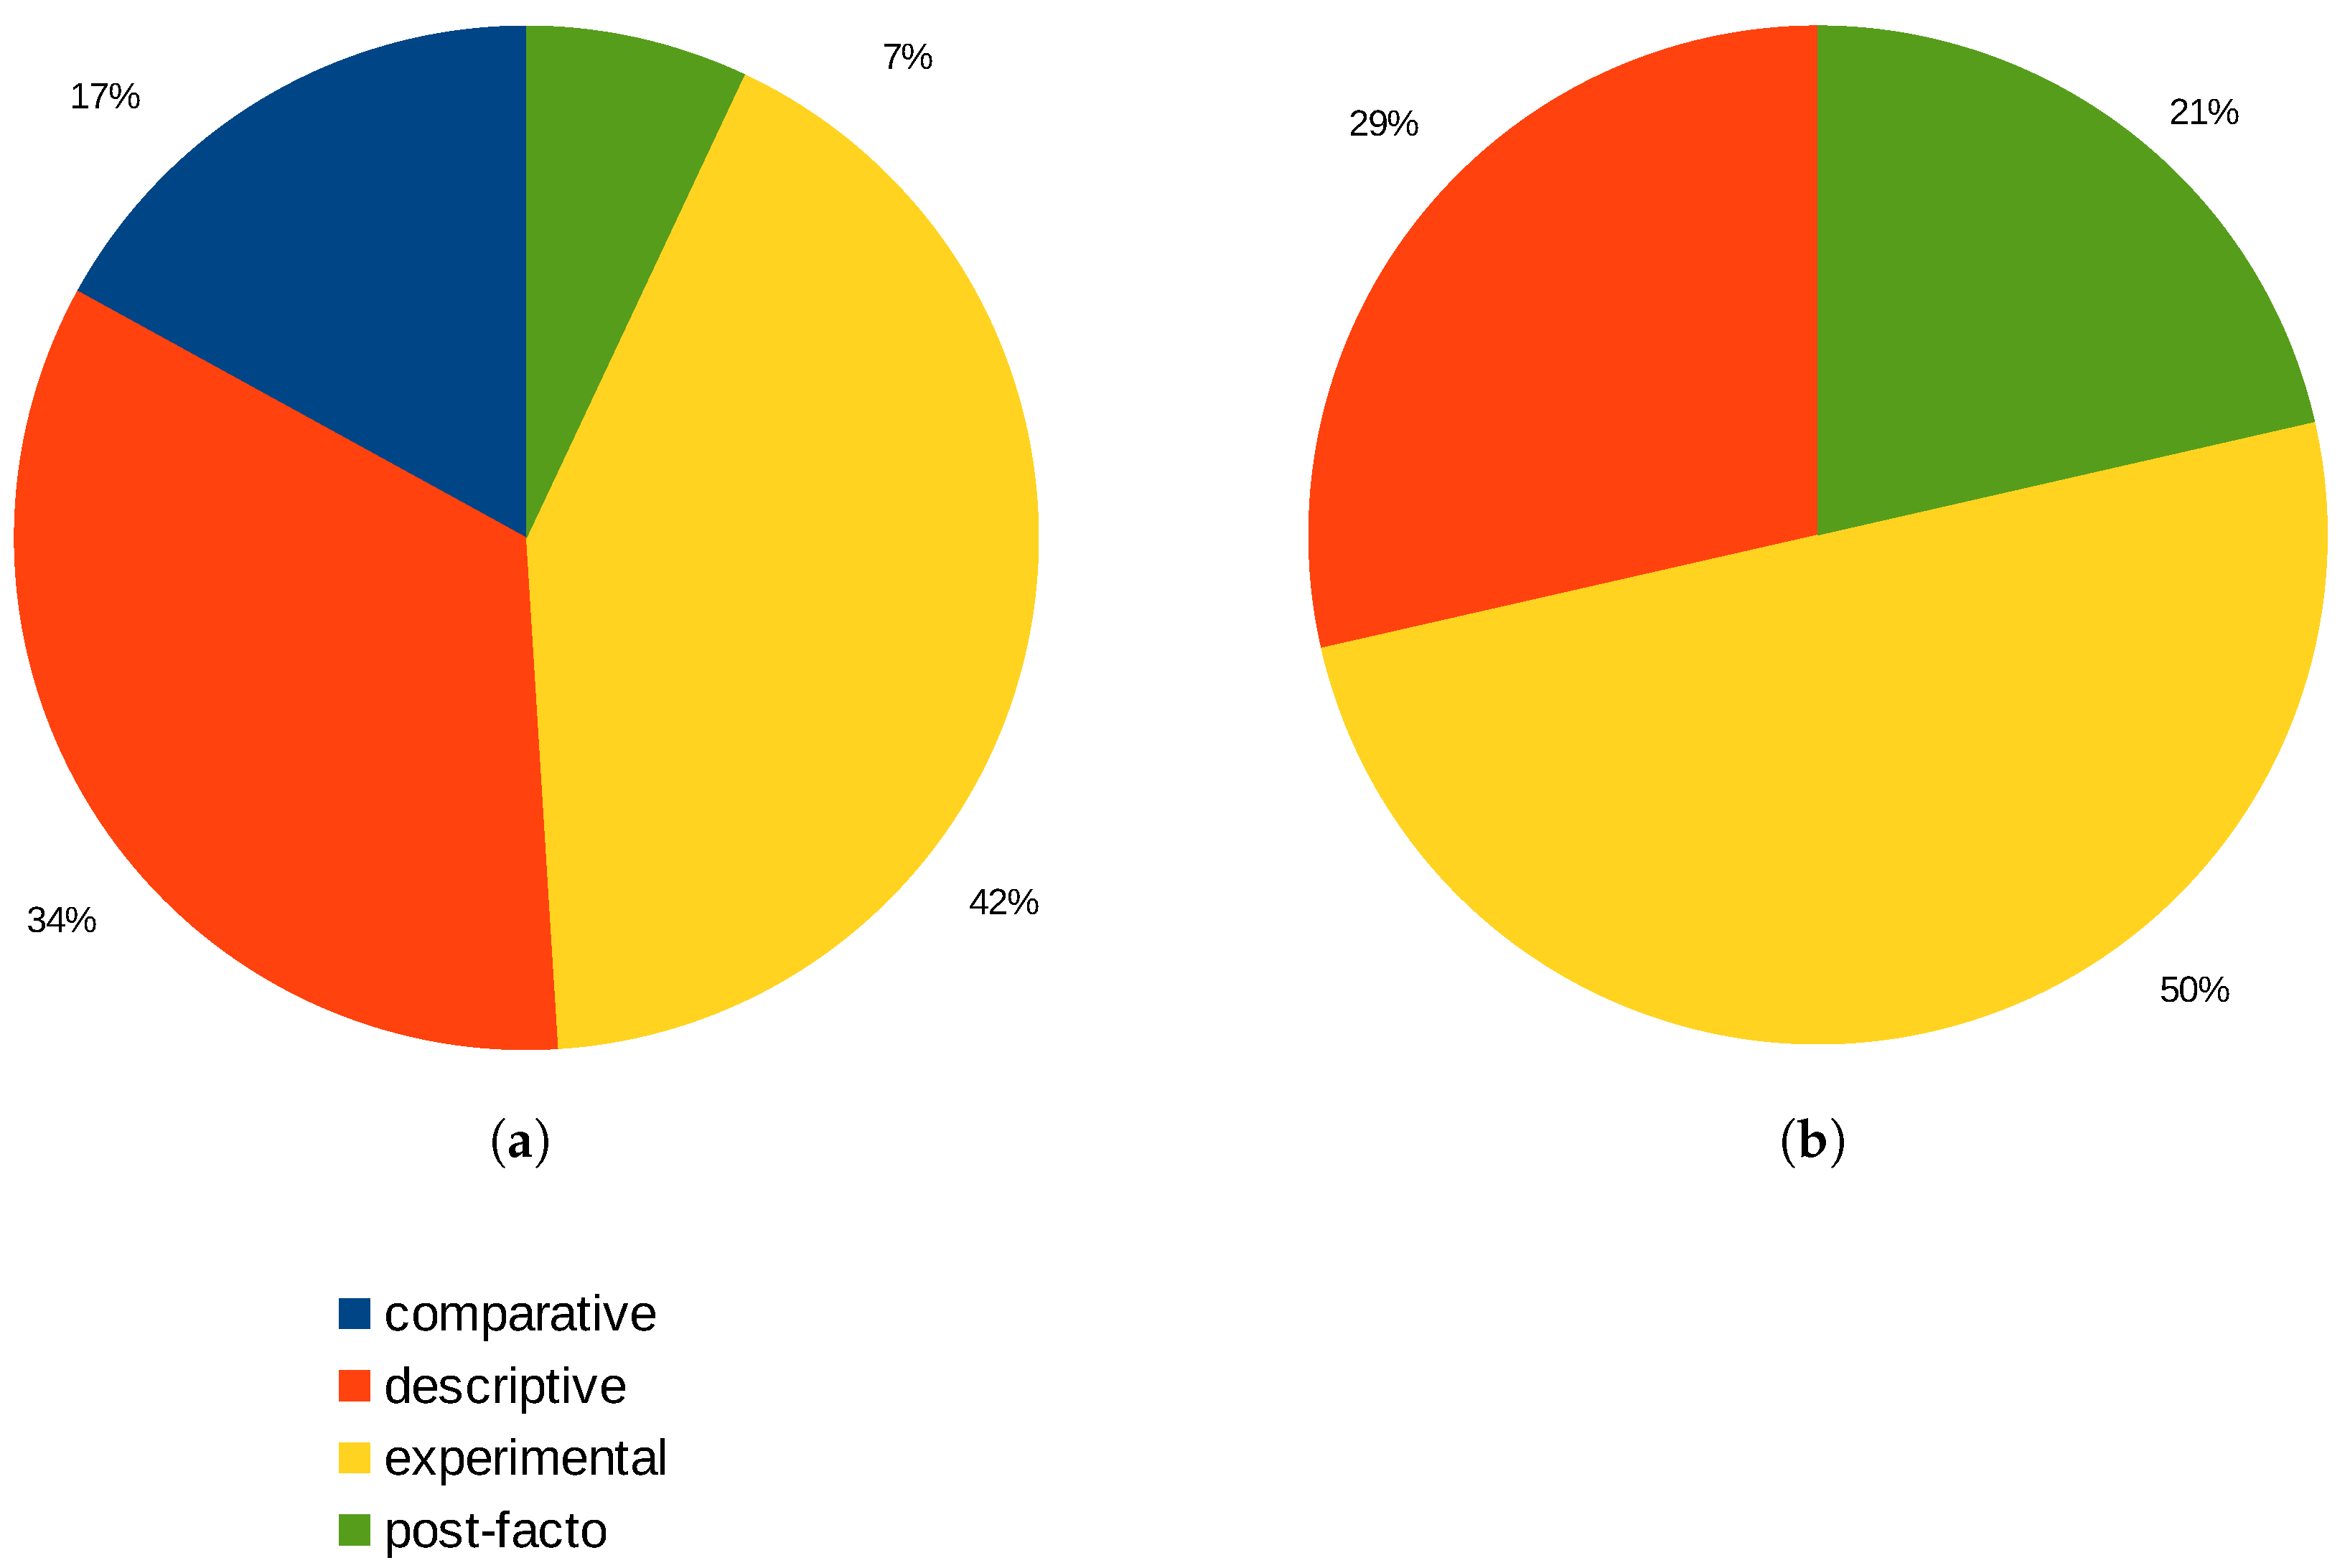
4.2. Problems Solved

Studies that solved a great diversity of problems that are classified by category are described below.

4.2.1. Comparative Methodology

In work [32], the authors presented a range tree that is used to compact and mark out correlation in metadata, which produces improved scalability and adaptiveness. In the case of visualization, it allows researchers to arrange aleatory, while multi-compare groups make possible the comparisons of clustering algorithms and analysis of multidimensional data [15]. Interactively visualizing a sequence of filters and logical combinations produces faster and more efficient workflow [36]. On the verge of analyzing production process data against those obtained through simulation predicts the emergence of the accuracy of outstanding failures [13]. Prototype implementations of expand-ahead drill-down faster [33]. Metric access methods make it possible to understand data organization [35]. While integrating layers on SOA systems, it was realized that the service bus allows a declarative definition of how to react to anomalies and diagnose origins of problems [37]. Graphical statistical methods as well as data mining methods produce knowledge discovery techniques [38]. Human–machine interactive methods perform data mining to make a data classification and relativity analysis [34]. To understand data sub-clustering behavior on adding filters progressively, ref. [40] shows how tendency deviation is attributed to a local change, also named the drill-down fallacy. Post-Study System Usability Questionnaire (PSSUQ), a tool made for testing based on user satisfaction, makes the SOLAP measures possible to complete OLAP visualizations on operations and data [41]. Kitchenham’s technique for selecting and clustering makes it possible to research learning analytics on big data that generally intends to gain learning processes [42]. Hierarchization for data clustering and a hybrid data warehouse model for extraction and analysis solves obstacles in data mining process algorithms, even on a data cube [39].

4.2.2. Descriptive Methodology

For Angryk and Petry [44], mining multi-level knowledge makes it possible to enhance the methodology to apply scientific data mining. Identifying relevant metrics while exploring data cubes helps support the decision-making functions, which are integrated into a commercial OLAP [16]. Substring hole analysis for viewing the coverage of huge datasets identifies coverage holes [47]. Machine learning created to construct structures with tree shapes that interpret dependencies on a KPI allows business analysis to process them, even if they depend on lower-level metrics [48]. Techniques that are based on histograms to reduce sliding windows have proposed one relying on a multi-structure tree [50]. Cross-lateral identification support traffic classification on multilateral and hierarchical identification [56]. The bi-level framework that unifies macroscopic and microscopics measures spam to pinpoint suspicious results on rating datasets used in websites supporting restaurants [57]. The use of non-supervised techniques to discover everyday activities of smart home residents produces automatic identification of such activities [58]. When information flow is grouped into matrix design cells, to identify patterns and instances from the larger network, it flows and another distinguished quantity flows [60]. To create a concise schema design, the grouping data process must adjust to understand the relationship between data sources, so structure design will implement a robust, documented, and updatable architecture [61]. Aggregation represented by UML diagrams and PRR language makes it possible to class diagrams and typology [53]. Describing each column as a rule by format f(a b*n) optimizes problems [63]. An auto-organized map working as an unsupervised learning algorithm to render visualization of multivariate data by producing an initial cluster, and at first only showing representational clusters, makes it possible to show inherited global structure [43]. Application technology on AI makes it possible to highlight production issues and easily analyze information [45]. The use of vector-type methods to validate every DD operation may clarify if such a method is really efficient [46]. The approach to the workflow field by taking a data-centric workflow viewpoint makes it possible only if processes are connected by a record and the system is available to connect processes with different data formats [49]. Using plug-in architecture, which permits module development to return data, allows for the building of websites with sophisticated DD operations [51]. An approach to discover knowledge by the integration of sums and rendering techniques reduces time to search and identify information [52]. A wisdom appreciation of system and job execution reduces code volume, splits data, and leverages open sources for tools [54]. Linear data analysis is much better when a tree map is adapted along with the calendar metaphor and using time as the principal hierarchical attribute [59]. To conduct methods for reproducible science, it is necessary to accumulate tracing by grouping edges and nodes with the same derivation [7]. Designing and developing the design process develops executive information [64]. The OLAP visualization approach with tree-like analysis views generates multidimensional expressions [65]. For the implementation of a new data cube, a hierarchy algorithm is necessary to implement spatial indexing and non-relational techniques [67]. DD view adjusts to perceive noise on data analysis (noise on vibrating mechanical parts), allowing for design optimizations and the ability to study data simulation noise much faster [68]. The development of a tool based on a pie chart benefits the visual analysis of categorical data [55]. To explore data sub-clustering behavior on the learning analytics dashboard, [66] propose a perspective that recommends a profound DD on LAD users. Architecture for solving big data queries on NoSQL depots, which pre-compute results on the granular sector for collections, which are de-grouping, proves model effectivity to apply DD and drill-up queries on extensive experimental evaluations [62].

4.2.3. Experimental Methodology

Sen et al. [77] show that OLAP operations on multidimensional models are possible after adding smaller cuboids partitioned depending on their cardinality. The entropy is maximized when its information principles are used to determine proxy databases [78]. Opinion-mining techniques and visualization tools quantify the opinion of the voters [82]. An analytics solution focused on team metrics allows for visual design and navigation [90]. Regression function and forecasting make possible trend detection [95]. The use of online dynamic queries on data layers establishes correlations, trends, or outlier identifications [96]. We use the MediSyn tool for selecting, connecting, elaborating, exploring, and sharing qualified insights via interactions [12]. Group-by-group aggregation for performance evaluation makes alternatives possible for moving computer object groups [83]. For implementing functionality information, recovery is useful to combine text ranking/searching techniques [69]. In some cases, materialized views from OLAP cubes could be originated from data models on hierarchical and multidimensional definitions [71]. The use of flash memory in energy-efficient environments is possible due to a storage-centric sensor network [73]. Improved complete algorithm Glide for views actualization eliminates data anomalies [74]. On query algorithms, the parallel closed cubes decrease and the number of data blocks increases [75]. The collection of data is made possible due to multi-layered and constraint language based on offline and DD analysis [84]. Shortened response time on performance evaluation is made possible through experimental evaluation on open source software [85]. Running several instances of fixed window sizes is made possible due to an algorithm that supports intense traffic [86]. Tendencies and statistics to perform analysis are made with the help of frameworks supported by event collection and aggregation [89]. Malware inspection on data networks allows for activating or inactivating verification timeout [14]. Effectivity of the space–temporal simulation model provides feedback on geo-spatial data [94]. Perspective on performance and process shows errors that can be produced along manual decision tree trace [97]. Gaussian Alerts of un-reachability incidents level are possible due to the average raw rate of HTTP pings [98]. Reliability performance analysis on large datasets is possible by extracting transaction data with a fast model [99]. Comparison and identification is possible with a hierarchy and pivot visualization breakdown [70]. Education data can be integrated, analyzed, and processed with the Panda application system [80]. Multidimensional analysis tools affect the outline of each function [81]. Citation was designed considering usability and user experience goals fulfilling usability goals of effectiveness, efficiency, and learnability [87]. DW instantiation using a document-oriented system makes it possible to model and cross-model comparison [88]. Efficiency on heavy hitters and frequency queries relies on specific algorithms [91]. The limitations established by tuple shape data can be redefined by OLAP queries [92]. E-learning visual narrative potential could be demonstrated with a narrative approach [93]. Node labeling on the hierarchy tree makes it possible to choose table categories throwing the labeling method [31]. Locating targets is made more accurate by using a distortion algorithm from fisheye design [72]. Feedback texts’ foreground and background models supported by weighting schemes lay the foundations for cluster contrasts [76]. The size of interface elements, including shaping emotions in interface design, can be conducted with the use of concept hierarchies [100]. The algorithm for using a dynamic data structure identifies a Galois Connection with well-defined abstraction and concretization functions [79]. Multi-layer networks as data models make it possible to generate EER diagrams, model flexibility, and model suitability [101].

4.2.4. Post Facto Methodology

Odoni et al. [102] presented Orbis, an extendible environment for DD analysis with multiple notation tasks and versioning that makes it possible for entity recognition, disambiguation, and entity typification. Generation of generic knowledge needs a big set of rules and then searching down the basic one with semantic analysis [103]. Use of a panel that leads introspection to the facilities level makes it possible to identify probable problems and retrieve eight performance indicators visualized in several views, which will enable DD analysis on specific data [104].

4.3. Problems Not Solved

Although the difficulty implies scientific research development and errors and inaccuracies that are frequently attained, not all authors reported failures or narrow circumstances in the process. Those who made it, grouped by category, are listed below.

4.3.1. Descriptive Methodology

In 2018, Jiménez [61] presented that to create a concise schema design, the grouping data process must adjust to understand the relationship between data sources, and such schema must be updated to prevent future problems. The plug-in architecture, which permits developing on server-side modules, does not permit expansion [51]. Development of a tool based on a pie chart is based on a short usability study [55]. Architecture for solving big data queries on NoSQL depots that pre-compute results on the granular sector for collections, which are de-grouping. Notice that proposed architecture was just tested in specific study cases, and it was considered temporal data importance due to its low granularity [62].

4.3.2. Experimental Methodology

Mathrani [96] practiced with dynamic online queries into data layers that show that deployment was not ready to allow for the understanding evaluation during performance. Perspective on performance and process suggest that errors may be produced at data overfitting [97]. In the case of heavy hitters, their algorithms have shown a slight overhead [91]. OLAP query redefinition does not allow one to see a list of problems to solve [92]. Node labeling on the hierarchy tree informs that in the absence of a label, reading must be made on the detail [31]. Concept hierarchies that render a dynamic interface lack mobile applications [100]. Multi-layer networks as data models do not inform the existence of total verification [101].

4.3.3. Post Facto Methodology

Additionally at Orbis, Odoni et al. [102] noticed that multiple notation tasks and versioning do not integrate significance testing statistics, building plug-ins for monitoring and developing support for extra evaluations. The creation of base knowledge sometimes is omitted in the works, although that is an obligatory step to improve the adoption of these techniques [103]. Use of a panel leads introspection to the facilities level, making it possible to identify probable problems. Notice that for better efficiency not all data were included [104].

4.4. Methodologies Application

This section refers to the use given to methodologies in the aforesaid works. Each research, as explained before, has been normalized to be classified within a methodology categorization, which could help in understanding its own nature and being helpful for ease of later studies in the same area. Table 9 shows the results of methodologies classified by category.
For better appreciation, Figure 3 outlines the distribution percentage by category on research studies that applied DD analysis or DM techniques, with some similarities in the analysis approach.
It follows from the above that for each category, a diverse set of techniques were used, which are depicted in Table 10.
The methodology type was not limited to one particular category but was also combined to obtain results suited to each particular objective of the researchers. Figure 4 shows the interrelationships between the category of each methodology and the techniques used. For lack of a third dimension, it had to connect with the dotted line granularity technique used in experimental as much as in descriptive methodologies.
At the end of the day, a general coincidental technique is the use of methodologies for data extraction or query.

4.5. Perspective

At the beginning of this systematic review, the perspective revolved around the application of DD on macro- and micro-economic research, but because of the little material found, it was expected that it will not be enough to back the desired results up; hence, the investigation profile was redefined, focusing more on knowing the work’s frequency and its methodological profile. As a result, it posed its application inside the general investigation that, from there, split by categories and profile by quantity, nor for specificity, with respect to the exploitation of this technique.
Those works collected on the basis of DD analysis have only coincided with the fundamental methodology core, which is the profound data analysis. Each one has focused its own analysis on the resolution of specific problems in the researcher’s selected area. Inside this panorama, Table 4, Table 5, Table 6 and Table 7 show the methodology type and the year the study was made. In the case of the possibility of reproducing the experimentation, with the exception of Wang & Iver [31], which presented the PL/SQL code for a relational database, there were no available codes nor open databases.
At the moment, there are few works on DD focused on this particular topic. Hence, studies on this could be considered emergent technology.
According to the results, there were found slopes over query manipulation and decision tree labeling, whose common factor is data exploitation, leading to efficiency. It turns out interesting to see the scarce amount of methodologies focused on mathematics, circumstances that justify the lack of base knowledge, and as a consequence, the loss of evolutive usability of the DD analysis.

5. Discussion

The lack of DD analysis usage in research works results in the display of biased conclusions. If it is true that deterministic models applied to DD have a set lag behind before the implementation of new AI tools, it must be considered that the rehabilitation of this technique from the application of ANN faces technological advances in software in such a way that it can be reestablished on the scientific as well on the economic research vanguard.
If a combinatory application of the used methodologies in the previous studies is realized, and the lack of knowledge base generation is fixed, a new methodology capable of bringing down the overfitting problem and integrating AI technologies would be obtained, as well as avoiding redundancy problems. New knowledge generation to establish future theories will be a researcher’s responsibility in future application technology works.
It was observed that decision trees and labeled related models drive attention to granularity processes, what is right in the case of conclusive results or those which require streamlining process velocity. However, it is recommended to avoid it because it does not permit specific knowledge generation, just because data grouping may obey the necessity of establishing tendencies and not resolve punctual problems.
Figure 5 displays problems solved and not solved with respect to an applied methodology. The majority of solved problems focused on experimental (42%) and descriptive (34%) methodologies, which infers that researchers exhibit a tendency to establish observation processes or to describe them from the perspective of a third one. Only 17% compare processes with the object to obtain new knowledge, and just 7% focused on data science.
The tendency on works that manifest unsolved problems indicates that 50% had issues during experimentation, 29% on the description of the sample, and 21% on data analysis. This is coincidental with the small interest in the last figure to board such methodology as an objective or that there were affectations on the data process, as it would be in the overfitting case. It was noticed that there were no manifestations of unsolved problems in the case of methodology comparison, which is normal given the fact that comparison is just an observation activity.

6. Conclusions

With respect to the methodologies performed by the analysis of the state-of-the-art, it was proved that, besides finding biases in its methodologies, they have not been empowered by ANN algorithms such as an AI tool. With respect to the application of DD and DD plus ANN, there were no findings of studies that showed the usage of such methodologies.
Most dissected works used DD analysis as a supervision technique and not as a method for producing conclusions. In other words, DD is used as a vehicle for other methodologies and is not as a methodology per se.
Low frequency in the amount of work made by researchers by year demonstrates the pursuit of newer techniques as newfangled rather than the actualization with resources surrounding the technological world and, for that reason, easily available and effective, which only needs new methodologies to be able to compete, as currently is the application, in any technological area of ANN. Something this research has really done is to appreciate the wide application of DD analysis, in all faces data can offer or apply, depending on the point of view.

Author Contributions

Conceptualization, V.H.S.-B. and J.M.Á.-A.; methodology, V.H.S.-B., J.M.Á.-A. and A.M.H.-N.; software, V.H.S.-B.; validation, A.M.H.-N. and J.R.-R.; formal analysis, A.M.H.-N. and J.R.-R.; investigation, V.H.S.-B.; writing—review and editing, V.H.S.-B. and J.M.Á.-A.; visualization, V.H.S.-B.; supervision, A.M.H.-N.; project administration, A.M.H.-N. All authors have read and agreed to the published version of the manuscript.

Funding

This research was funded by Consejo Nacional de Humanidades Ciencias y Tecnología (CONAHCYT), Mexico.

Institutional Review Board Statement

Not applicable.

Informed Consent Statement

Not applicable.

Data Availability Statement

Acknowledgments

This research was done with the help from Autonomus University of Queretaro UAQ.

Conflicts of Interest

The authors declare no conflict of interest.

Abbreviations

The following abbreviations were used:
AIArtificial Intelligence
ANNArtificial Neural Network
DDDrill-Down
DMData Mining
DWData Warehouse
MLMachine Learning
OLAPOnline Analytical Processing

References

  1. IBM. Breaking the Petaflop Barrier. Available online: https://www.ibm.com/ibm/history/ibm100/us/en/icons/petaflopbarrier/ (accessed on 1 July 2023).
  2. Frankenfeld, F. Trends in Computer Hardware and Software. Am. J. Hosp. Pharm. 1993, 50, 707–711. [Google Scholar] [CrossRef] [PubMed]
  3. Oracle. Introduction to Transparent Data Encryption. Available online: https://docs.oracle.com/en/database/oracle/oracle-database/19/asoag/introduction-to-transparent-data-encryption.html#GUID-62AA9447-FDCD-4A4C-B563-32DE04D55952 (accessed on 1 July 2023).
  4. Waubert de Puiseau, C.; Nanfack, D.T.; Tercan, H.; Löbbert-Plattfaut, J.; Meisen, T. Dynamic Storage Location Assignment in Warehouses Using Deep Reinforcement Learning. Technologies 2022, 10, 129. [Google Scholar] [CrossRef]
  5. Biagi, V.; Russo, A. Data Model Design to Support Data-Driven IT Governance Implementation. Technologies 2022, 10, 106. [Google Scholar] [CrossRef]
  6. Morfonios, K.; Konakas, S.; Ioannidis, Y.; Kotsis, N. ROLAP Implementations of the Data Cube. ACM Comput. Surv. 2007, 39, 12-es. [Google Scholar] [CrossRef]
  7. Li, X.; Xu, X.; Malik, T. Interactive provenance summaries for reproducible science. In Proceedings of the 2016 IEEE 12th International Conference on e-Science (e-Science), Baltimore, MD, USA, 23–27 October 2016; pp. 355–360. [Google Scholar] [CrossRef]
  8. Kim, M.; Zimmermann, T.; DeLine, R.; Begel, A. Data Scientists in Software Teams: State of the Art and Challenges. IEEE Trans. Softw. Eng. 2018, 44, 1024–1038. [Google Scholar] [CrossRef]
  9. Popescu, C.C. Improvements in business operations and customer experience through data science and Artificial Intelligence. Proc. Int. Conf. Bus. Excell. 2018, 12, 804–815. [Google Scholar] [CrossRef] [Green Version]
  10. Sunahara, A.S.; Perc, M.; Ribeiro, H.V. Association between productivity and journal impact across disciplines and career age. Phys. Rev. Res. 2021, 3, 033158. [Google Scholar] [CrossRef]
  11. Morris, A. Data Drilling Defined: Drill Down Analysis for Business; Oracle Netsuit: San Mateo, CA, USA, 2021. [Google Scholar]
  12. He, C.; Micallef, L.; He, L.; Peddinti, G.; Aittokallio, T.; Jacucci, G. Characterizing the Quality of Insight by Interactions: A Case Study. IEEE Trans. Vis. Comput. Graph. 2021, 27, 3410–3424. [Google Scholar] [CrossRef]
  13. Nemeth, M.; Borkin, D.; Nemethova, A.; Michalconok, G. Deep drill-down analysis for failures detection in the production line. In Proceedings of the 23rd International Conference on Process Control (PC), Strbske Pleso, Slovakia, 1–4 June 2021; pp. 325–330. [Google Scholar] [CrossRef]
  14. Lee, J.K.; Yang, H.; Park, K.H.; Lee, S.Y.; Choi, S.G. The flow-reduced malware detection system by controlling inactive/active timeout. In Proceedings of the 20th International Conference on Advanced Communication Technology (ICACT), Chuncheon, Republic of Korea, 11–14 February 2018; p. 1. [Google Scholar] [CrossRef]
  15. Lex, A.; Streit, M.; Partl, C.; Kashofer, K.; Schmalstieg, D. Comparative Analysis of Multidimensional, Quantitative Data. IEEE Trans. Vis. Comput. Graph. 2010, 16, 1027–1035. [Google Scholar] [CrossRef]
  16. Cariou, V.; Cubillé, J.; Derquenne, C.; Goutier, S.; Guisnel, F.; Klajnmic, H. Embedded indicators to facilitate the exploration of a data cube. Int. J. Bus. Intell. Data Min. 2009, 4, 329–349. [Google Scholar] [CrossRef]
  17. Analytics Vidhya. Underfitting vs. Overfitting (vs. Best Fitting) in Machine Learning. Available online: https://www.analyticsvidhya.com/blog/2020/02/underfitting-overfitting-best-fitting-machine-learning/ (accessed on 1 July 2023).
  18. Hawkins, D.M. The Problem of Overfitting. J. Chem. Inf. Comput. Sci. 2004, 44, 1–12. [Google Scholar] [CrossRef] [PubMed]
  19. Ying, X. An Overview of Overfitting and its Solutions. J. Phys. Conf. Ser. 2019, 1168, 022022. [Google Scholar] [CrossRef]
  20. Carabalí, G.J.; Rodríguez, S.J.; Cárdena, D.C. Herramientas cuantitativas para la planeación y programación de la producción: Estado del arte. Ing. Ind. Actual. Nuevas Tendencias 2017, 18, 99–114. [Google Scholar]
  21. Page, M.J.; McKenzie, J.E.; Bossuyt, P.M.; Boutron, I.; Hoffmann, T.C.; Mulrow, C.D.; Shamseer, L.; Tetzlaff, J.M.; Akl, E.A.; Brennan, S.E.; et al. The PRISMA 2020 statement: An updated guideline for reporting systematic reviews. BMJ 2021, 372, n71. [Google Scholar] [CrossRef] [PubMed]
  22. Khaldi, K. Quantitative, Qualitative or Mixed Research: Wich Research Paradigm Use? J. Educ. Soc. Res. 2017, 7, 15. [Google Scholar] [CrossRef] [Green Version]
  23. Wilkinson, L. Tree Structured Data Analysis: AID, CHAID and CART. Retrieved Febr. 1992, 1, 2008. [Google Scholar]
  24. Thakare, V.M. Selection of Materialized View Using Query Optimization in Database Management: An Efficient Methodology. Int. J. Manag. Syst. 2010, 2, 116–130. [Google Scholar] [CrossRef]
  25. Cloud Software Group. Correlation Analysis. Available online: https://docs.tibco.com/pub/sfire-dsc/6.5.0/doc/html/TIB_sfire-dsc_user-guide/GUID-E1BE59EB-9CDC-4C2C-9174-C86B1D71BFCA.html (accessed on 1 July 2023).
  26. Chen, G.; Zhong, N.; Yao, Y. A hypergraph model of granular computing. In Proceedings of the IEEE International Conference on Granular Computing, Hangzhou, China, 26–28 August 2008; pp. 130–135. [Google Scholar] [CrossRef]
  27. de Sá Sousa, H.P.; Nunes, V.T.; Cappelli, C.; Guizzardi, R.S.; do Prado Leite, J.C.S. Using Process Indicators to Help the Verification of Goal Fulfillment. ICEIS 2017, 3, 345–352. [Google Scholar]
  28. ISO 9000:2015 Quality Management Systems—Fundamentals and Vocabulary. Available online: https://www.iso.org/obp/ui/#iso:std:iso:9000:ed-4:v1:es (accessed on 1 July 2023).
  29. Mirón Canelo, J.A.; Alonso Sardón, M. Medidas de frecuencia, asociación e impacto en investigación aplicada. Med. Segur. Trab. 2008, 54, 93–102. [Google Scholar] [CrossRef] [Green Version]
  30. GitHub Silva-Blancas, V.H. Systematic Review Software. Available online: https://github.com/victorhugosilvablancas/systematic_review (accessed on 1 July 2023).
  31. Wang, M.; Iyer, B. Efficient roll-up and drill-down analysis in relational database. In Proceedings of the Workshop on Research Issues on Data Mining and Knowledge Discover, Newport Beach, CA, USA, 14–17 August 1997. [Google Scholar]
  32. Feng, Y.; Agrawal, D.; Abbadi, A.E.; Metwally, A. Range cube: Efficient cube computation by exploiting data correlation. In Proceedings of the 20th International Conference on Data Engineering, Boston, MA, USA, 2 April 2004; pp. 658–669. [Google Scholar] [CrossRef]
  33. McGuffin, M.J.; Davison, G.; Balakrishnan, R. Expand-Ahead: A Space-Filling Strategy for Browsing Trees. In Proceedings of the IEEE Symposium on Information Visualization, Austin, TX, USA, 10–12 October 2004; pp. 119–126. [Google Scholar] [CrossRef]
  34. Wang, H.B.; Wang, C.B.; Liu, K.; Meng, B.; Zhou, D.R. VisDM-PC: A visual data mining tool based on parallel coordinate. In Proceedings of the 2004 International Conference on Machine Learning and Cybernetics, Shanghai, China, 26–29 August 2004; pp. 1244–1248. [Google Scholar] [CrossRef]
  35. Vieira, M.R.; Chino, F.J.; Traina, C., Jr.; Traina, A.J. A visual framework to understand similarity queries and explore data in Metric Access Methods. Int. J. Bus. Intell. Data Min. 2010, 5, 370–397. [Google Scholar] [CrossRef] [Green Version]
  36. Geymayer, T.; Lex, A.; Streit, M.; Schmalstieg, D. Visualizing the Effects of Logically Combined Filters. In Proceedings of the 15th International Conference on Information Visualisation, London, UK, 13–15 July 2011; pp. 47–52. [Google Scholar] [CrossRef] [Green Version]
  37. Psiuk, M.; Bujok, T.; Zieliński, K. Enterprise Service Bus Monitoring Framework for SOA Systems. IEEE Trans. Serv. Comput. 2012, 5, 450–466. [Google Scholar] [CrossRef]
  38. Nemeth, M.; Michalconok, G. The initial analysis of failures emerging in production process for further data mining analysis. In Proceedings of the 21st International Conference on Process Control, Strbske Pleso, Slovakia, 6–9 June 2017; pp. 210–215. [Google Scholar] [CrossRef]
  39. Meshjal, R.K. A Hybrid Data Warehouse Model to Improve Mining Algorithms. J. Kufa Math. Comput. 2017, 4, 21–30. [Google Scholar]
  40. Lee, D.J.L.; Dev, H.; Hu, H.; Elmeleegy, H.; Parameswaran, A. Avoiding drill-down fallacies with VisPilot. In Proceedings of the 24th International Conference on Intelligent User Interfaces, Marina del Ray, CA, USA, 16–20 March 2019; pp. 186–196. [Google Scholar] [CrossRef]
  41. Sitanggang, I.; Trisminingsih, R.; Khotimah, H.; Syukur, M. Usability testing of SOLAP for Indonesia agricultural commodity. IOP Conf. Ser. Earth Environ. Sci. 2019, 299, 012054. [Google Scholar] [CrossRef]
  42. Yunita, A.; Santoso, H.; Hasibuan, Z. Research Review on Big Data Usage for Learning Analytics and Educational Data Mining: A Way Forward to Develop an Intelligent Automation System. J. Phys. Conf. Ser. 2021, 1898, 012044. [Google Scholar] [CrossRef]
  43. Johansson, J.; Treloar, R.; Jern, M. Integration of unsupervised clustering, interaction and parallel coordinates for the exploration of large multivariate data. In Proceedings of the Eighth International Conference on Information Visualisation, London, UK, 16–16 July 2004; pp. 52–57. [Google Scholar] [CrossRef]
  44. Angryk, R.A.; Petry, F.E. Mining Multi-Level Associations with Fuzzy Hierarchies. In Proceedings of the 14th IEEE International Conference on Fuzzy Systems, Reno, NV, USA, 25 May 2005; pp. 785–790. [Google Scholar] [CrossRef]
  45. Chang, C.; Chen, R.; Zhuo, Y. The case study for building a data warehouse in semiconductor manufacturing. Int. J. Comput. Appl. Technol. 2005, 24, 195–202. [Google Scholar] [CrossRef]
  46. Zhang, D.; Tang, S.; Yang, D.; Jiang, L. An Effective Drill-Down Paths Pruning Method in OLAP. In Proceedings of the Fuzzy Systems and Knowledge Discovery, Fourth International Conference, Haikou, China, 24–27 August 2007; pp. 649–653. [Google Scholar] [CrossRef]
  47. Adler, Y.; Farchi, E.; Klausner, M.; Pelleg, D.; Raz, O.; Shochat, M.; Ur, S.; Zlotnick, A. Automated substring hole analysis. In Proceedings of the 31st International Conference on Software Engineering, Vancouver, BC, Canada, 16–24 May 2009; pp. 203–206. [Google Scholar] [CrossRef] [Green Version]
  48. Wetzstein, B.; Leitner, P.; Rosenberg, F.; Brandic, I.; Dustdar, S.; Leymann, F. Monitoring and Analyzing Influential Factors of Business Process Performance. In Proceedings of the IEEE International Enterprise Distributed Object Computing Conference, Auckland, New Zealand, 1–4 September 2009; pp. 141–150. [Google Scholar] [CrossRef]
  49. Robinson, A.J.; Rahayu, W.J.; Dillon, T. WAD Workflow System: Data-Centric Workflow System. In Proceedings of the Australian Software Engineering Conference, Gold Coast, QLD, Australia, 14–17 April 2009; pp. 337–344. [Google Scholar] [CrossRef]
  50. Buccafurri, F.; Lax, G. Approximating sliding windows by cyclic tree-like histograms for efficient range queries? Data Knowl. Eng. 2010, 69, 979–997. [Google Scholar] [CrossRef]
  51. Egenland, R.; Wildish, T.; Huang, C. PhEDEx Data Service. J. Phys. Conf. Ser. 2010, 219, 062010. [Google Scholar] [CrossRef]
  52. Fung, C.C.; Thanadechteemapat, W. Discover Information and Knowledge from Websites Using an Integrated Summarization and Visualization Framework. In Proceedings of the Third International Conference on Knowledge Discovery and Data Mining, Phuket, Thailand, 9–10 January 2010; pp. 232–235. [Google Scholar] [CrossRef] [Green Version]
  53. Prat, N.; Comyn-Wattiau, I.; Akoka, J. Combining objects with rules to represent aggregation knowledge in data warehouse and OLAP systems. Data Knowl. Eng. 2011, 70, 732–752. [Google Scholar] [CrossRef] [Green Version]
  54. Klimentov, A.; Nevski, P.; Potekhin, M.; Wenaus, T. The ATLAS PanDA Monitoring System and its Evolution. J. Phys. Conf. Ser. 2011, 331, 072058. [Google Scholar] [CrossRef]
  55. Guimares, R.V.; Soares, A.G.M.; Carneiro, N.J.S.; Meiguins, A.S.; Meiguins, B.S. Design Considerations for Drill-down Charts. In Proceedings of the 15th International Conference on Information Visualisation, London, UK, 13–15 July 2011; pp. 73–79. [Google Scholar] [CrossRef]
  56. Kim, J.-h.; Yoon, S.-H.; Kim, M.-S. Study on traffic classification taxonomy for multilateral and hierarchical traffic classification. In Proceedings of the 14th Asia-Pacific Network Operations and Management Symposium (APNOMS), Seoul, Republic of Korea, 25–27 September 2012; pp. 1–4. [Google Scholar] [CrossRef]
  57. Xie, S.; Hu, Q.; Zhang, J.; Yu, P.S. An effective and economic bi-level approach to ranking and rating spam detection. In Proceedings of the IEEE International Conference on Data Science and Advanced Analytics, Paris, France, 19–21 October 2015; pp. 1–10. [Google Scholar] [CrossRef]
  58. Yin, J.; Zhang, Q.; Karunanithi, M. Unsupervised daily routine and activity discovery in smart homes. In Proceedings of the 37th Annual International Conference of the IEEE Engineering in Medicine and Biology Society, Milan, Italy, 25–29 August 2015; pp. 5497–5500. [Google Scholar] [CrossRef]
  59. de Carvalho, M.B.; Meiguins, B.S.; de Morais, J.M. Temporal Data Visualization Technique Based on Treemap. In Proceedings of the 20th International Conference Information Visualisation (IV), Lisbon, Portugal, 19–22 July 2016; pp. 399–403. [Google Scholar] [CrossRef]
  60. Chen, Y.; Yang, B.; Wang, W. NetFlowMatrix: A visual approach for analysing large NetFlow data. Int. J. Secur. Netw. 2017, 12, 215–229. [Google Scholar] [CrossRef]
  61. Jiménez-Vargas, W. Data Mining Techniques for the Integrated Postsecondary Data System. Available online: https://prcrepository.org/bitstream/handle/20.500.12475/254/WI-18_Articulo%20Final_Wilfredo%20Jimenez.pdf?sequence=1&isAllowed=y (accessed on 1 July 2023).
  62. Franciscus, N.; Ren, X.; Stantic, B. Precomputing architecture for flexible and efficient big data analytics. Vietnam J. Comput. Sci. 2018, 5, 133–142. [Google Scholar] [CrossRef] [Green Version]
  63. Joglekar, M.; Garcia-Molina, H.; Parameswaran, A. Interactive Data Exploration with Smart Drill-Down. IEEE Trans. Knowl. Data Eng. 2019, 31, 46–60. [Google Scholar] [CrossRef]
  64. Putra, A.B.; Mukaromah, S.; Lusiarini, Y.; Rizky, M.I.; Bestari, P.Y. Design and Development Executive Information System Application with Drilldown and What-If Analysis features. J. Phys. Conf. Ser. 2019, 1569, 022050. [Google Scholar] [CrossRef]
  65. Zou, B.; You, J.; Ding, J.; Sun, H. TAVO: A Tree-like Analytical View for OLAP. In Proceedings of the IEEE Pacific Rim Conference on Communications, Computers and Signal Processing, Victoria, BC, Canada, 21–23 August 2019; pp. 1–6. [Google Scholar] [CrossRef]
  66. Shabaninejad, S.; Khosravi, H.; Indulska, M.; Bakharia, A.; Isaias, P. Automated insightful drill-down recommendations for learning analytics dashboards. In Proceedings of the Tenth International Conference on Learning Analytics & Knowledge, Frankfurt, Germany, 23–27 March 2020; pp. 41–46. [Google Scholar] [CrossRef] [Green Version]
  67. Rocha, T.D.M.E.S.; Silva, R.R.; Carneiro, T.G.D.S.; Lima, J.D.C. Spatial data cubes based on shared dimensions and neighbourhood relationship concepts. Int. J. Bus. Inf. Syst. 2021, 37, 308–335. [Google Scholar] [CrossRef]
  68. Splechtna, R.; Gračanin, D.; Todorović, G.; Goja, S.; Bedić, B.; Hauser, H.; Matković, K. Interactive Visual Analysis of Structure-borne Noise Data. IEEE Trans. Vis. Comput. Graph. 2023, 29, 778–787. [Google Scholar] [CrossRef]
  69. Lee, J.; Grossman, D.; Frieder, O.; McCabe, M.C. Integrating structured data and text: A multi-dimensional approach. In Proceedings of the International Conference on Information Technology: Coding and Computing, Las Vegas, NV, USA, 27–29 March 2000; pp. 264–269. [Google Scholar] [CrossRef]
  70. Conklin, N.; Prabhakar, S.; North, C. Multiple foci drill-down through tuple and attribute aggregation polyarchies in tabular data. In Proceedings of the IEEE Symposium on Information Visualization, Boston, MA, USA, 28–29 October 2002; pp. 131–134. [Google Scholar] [CrossRef]
  71. Palza, E.; Fuhrman, C.; Abran, A. Establishing a generic and multidimensional measurement repository in CMMI context. In Proceedings of the 28th Annual NASA Goddard Software Engineering Workshop, Greenbelt, MD, USA, 3–4 December 2003; pp. 12–20. [Google Scholar] [CrossRef]
  72. Shi, K.; Irani, P.; Li, B. An evaluation of content browsing techniques for hierarchical space-filling visualizations. In Proceedings of the IEEE Symposium on Information Visualization, Minneapolis, MN, USA, 23–25 October 2005; pp. 81–88. [Google Scholar] [CrossRef] [Green Version]
  73. Tang, S.; Yang, J.; Liu, Y.; Wu, Z.; Chen, B. An Energy Efficient Design of Multi-resolution Storage for Ubiquitous Data Management. In Proceedings of the IFIP International Conference on Network and Parallel Computing Workshops, Dalian, China, 18–21 September 2007; pp. 263–268. [Google Scholar] [CrossRef]
  74. Chen, J.; Long, T.; Deng, K. The Consistency of Materialized View Maintenance and Drill-Down in a Warehousing Environment. In Proceedings of the 9th International Conference for Young Computer Scientists, Hunan, China, 18–21 November 2008; pp. 1169–1174. [Google Scholar] [CrossRef]
  75. You, J.; Xi, J.; Zhang, P.; Chen, H. A Parallel Algorithm for Closed Cube Computation. In Proceedings of the Seventh IEEE/ACIS International Conference on Computer and Information Science, Portland, OR, USA, 14–16 May 2008; pp. 95–99. [Google Scholar] [CrossRef]
  76. Ziegler, C.N.; Skubacz, M.; Viermetz, M. Mining and Exploring Unstructured Customer Feedback Data Using Language Models and Treemap Visualizations. In Proceedings of the IEEE/WIC/ACM International Conference on Web Intelligence and Intelligent Agent Technology, Sydney, NSW, Australia, 9–12 December 2008; pp. 932–937. [Google Scholar] [CrossRef] [Green Version]
  77. Sen, S.; Chaki, N.; Cortesi, A. Optimal Space and Time Complexity Analysis on the Lattice of Cuboids Using Galois Connections for Data Warehousing. In Proceedings of the Fourth International Conference on Computer Sciences and Convergence Information Technology, Seoul, Republic of Korea, 24–26 November 2009; pp. 1271–1275. [Google Scholar] [CrossRef]
  78. Pourabbas, E.; Shoshani, A. Improving estimation accuracy of aggregate queries on data cubes. Data Knowl. Eng. 2010, 69, 50–72. [Google Scholar] [CrossRef] [Green Version]
  79. Sen, S.; Chaki, N. Efficient Traversal in Data Warehouse Based on Concept Hierarchy Using Galois Connections. In Proceedings of the Second International Conference on Emerging Applications of Information Technology, Kolkata, India, 19–20 February 2011; pp. 335–339. [Google Scholar] [CrossRef]
  80. Ikeda, R.; Cho, J.; Fang, C.; Salihoglu, S.; Torikai, S.; Widom, J. Provenance-Based Debugging and Drill-Down in Data-Oriented Workflows. In Proceedings of the IEEE 28th International Conference on Data Engineering, Arlington, VA, USA, 1–5 April 2012; pp. 1249–1252. [Google Scholar] [CrossRef] [Green Version]
  81. Zhang, L.; Qin, H.; Liu, K.; Wu, T. System composition and multidimensional analysis tools of the Multidimensional Hyperspectral Database for Rocks and Minerals. In Proceedings of the 4th Workshop on Hyperspectral Image and Signal Processing: Evolution in Remote Sensing, Shanghai, China, 4–7 June 2012; pp. 1–5. [Google Scholar] [CrossRef]
  82. Soulis, K.; Varlamis, I.; Giannakoulopoulos, A.; Charatsev, F. A tool for the visualisation of public opinion. Int. J. Electron. Gov. 2013, 6, 218–231. [Google Scholar] [CrossRef]
  83. Baltzer, O.; Dehne, F.; Rau-Chaplin, A. OLAP for moving object data. Int. J. Intell. Inf. Database Syst. 2013, 7, 79–112. [Google Scholar] [CrossRef]
  84. Baresi, L.; Guinea, S. Event-Based Multi-level Service Monitoring. In Proceedings of the IEEE 20th International Conference on Web Services, Santa Clara, CA, USA, 28 June–3 July 2013; pp. 83–90. [Google Scholar] [CrossRef]
  85. Bianchi, R.G.; Hatano, G.Y.; Siqueira, T.L.L. On the performance and use of spatial OLAP tools. In Proceedings of the XXXIX Latin American Computing Conference, Caracas, Venezuela, 7–11 October 2013; pp. 1–12. [Google Scholar] [CrossRef]
  86. Kotamsetty, R.; Govindarasu, M. Adaptive Latency-Aware Query Processing on Encrypted Data for the Internet of Things. In Proceedings of the 25th International Conference on Computer Communication and Networks (ICCCN), Waikoloa, HI, USA, 1–4 August 2016; pp. 1–7. [Google Scholar] [CrossRef]
  87. Hartono, W.S.; Widyantoro, D.H. Fisheye zoom and semantic zoom on citation network visualization. In Proceedings of the 2016 International Conference on Data and Software Engineering (ICoDSE), Denpasar, Indonesia, 26–27 October 2016; pp. 1–6. [Google Scholar] [CrossRef]
  88. Chavalier, M.; Malki, M.E.; Kopliku, A.; Teste, O.; Tournier, R. Document-oriented data warehouses: Models and extended cuboids, extended cuboids in oriented document. In Proceedings of the IEEE Tenth International Conference on Research Challenges in Information Science, Grenoble, France, 1–3 June 2016; pp. 1–11. [Google Scholar] [CrossRef] [Green Version]
  89. Kritzinger, L.M.; Krismayer, T.; Vierhauser, M.; Rabiser, R.; Grünbacher, P. Visualization support for requirements monitoring in systems of systems. In Proceedings of the 32nd IEEE/ACM International Conference on Automated Software Engineering, Urbana, IL, USA, 30 October–3 November 2017; pp. 889–894. [Google Scholar] [CrossRef]
  90. Augustine, V.; Hudepohl, J.; Marcinczak, P.; Snipes, W. Deploying Software Team Analytics in a Multinational Organization. IEEE Softw. 2018, 35, 72–76. [Google Scholar] [CrossRef]
  91. Basat, R.B.; Shahout, R.; Friedman, R. Frequent elements on query defined ranges. In Proceedings of the IEEE Conference on Computer Communications Workshops, Honolulu, HI, USA, 15–19 April 2018; pp. 1–2. [Google Scholar] [CrossRef]
  92. Vassiliadis, P.; Marcel, P.; Rizzi, S. Beyond roll-up s and drill-down s: An intentional analytics model to reinvent OLAP. Data Knowl. Eng. 2019, 85, 68–91. [Google Scholar] [CrossRef]
  93. Chen, Q.; Li, Z.; Pong, T.C.; Qu, H. Designing Narrative Slideshows for Learning Analytics. In Proceedings of the IEEE Pacific Visualization Symposium, Bangkok, Thailand, 23–26 April 2019; pp. 237–246. [Google Scholar] [CrossRef]
  94. Afzal, S.; Ghani, S.; Jenkins-Smith, H.C.; Ebert, D.S.; Hadwiger, M.; Hoteit, I. A Visual Analytics Based Decision Making Environment for COVID-19 Modeling and Visualization. In Proceedings of the IEEE Visualization Conference, Salt Lake City, UT, USA, 25–30 October 2020; pp. 86–90. [Google Scholar] [CrossRef]
  95. Ragavi, V.; Geetha, N. A drill down analysis of the pandemic COVID-19 cases in India using PDE. Mater. Today Proc. 2021, 37, 592–595. [Google Scholar] [CrossRef]
  96. Mathrani, S. Critical business intelligence practices to create meta-knowledge. Int. J. Bus. Inf. Syst. 2021, 36, 1–164. [Google Scholar] [CrossRef]
  97. Khosravi, H.; Shabaninejad, S.; Bakharia, A.; Sadiq, S.; Indulska, M.; Gasevic, D. Intelligent Learning Analytics Dashboards: Automated Drill-Down Recommendations to Support Teacher Data Exploration. J. Learn. Anal. 2021, 8, 133–154. [Google Scholar] [CrossRef]
  98. Agrawal, K.; Mehta, V.; Renganathan, S.; Acharyya, S.; Padmanabhan, V.; Kotipalli, C.; Zhao, L. Monitoring Cloud Service Unreachability at Scale. In Proceedings of the IEEE Conference on Computer Communications, Vancouver, BC, Canada, 10–13 May 2021; pp. 1–10. [Google Scholar] [CrossRef]
  99. Franklin, P. Solving Problems with Rapid Data Discovery. In Proceedings of the Annual Reliability and Maintainability Symposium, Orlando, FL, USA, 24–27 May 2021; pp. 1–3. [Google Scholar] [CrossRef]
  100. Ilyas, Q.M.; Ahmad, M.; Zaman, N.; Alshamari, M.A.; Ahmed, I. Localized Text-Free User Interfaces. IEEE Access 2022, 10, 2357–2371. [Google Scholar] [CrossRef]
  101. Santra, A.; Komar, K.; Bhowmick, B.; Chakravarthy, S. From base data to knowledge discovery—A life cycle approach—Using multilayer networks. Data Knowl. Eng. 2022, 141, 102058. [Google Scholar] [CrossRef]
  102. Odoni, F.; Kuntschik, P.; Braşoveanu, A.M.; Weichselbraun, A. On the Importance of Drill-Down Analysis for Assessing Gold Standards and Named Entity Linking Performance. Procedia Comput. Sci. 2018, 137, 33–42. [Google Scholar] [CrossRef]
  103. Grabot, B. Rule mining in maintenance: Analysing large knowledge bases. Comput. Ind. Eng. 2020, 139, 105501. [Google Scholar] [CrossRef]
  104. Lechner, C.; Rumpler, M.; Dorley, M.C.; Li, Y.; Ingram, A.; Fryman, H. Developing an Online Dashboard to Visualize Performance Data-Tennessee Newborn Screening Experience. Int. J. Neonatal Screen. 2022, 8, 49. [Google Scholar] [CrossRef]
Figure 1. Overfitting in ML, according to [17], represents data behavior when training and test data surpass the optimum mark established by the application model.
Technologies 11 00112 g001
Figure 2. Relation of works collected by year, showing the inconsistency of the use of DD analysis among scientific research.
Technologies 11 00112 g002
Figure 3. Methodology distribution with respect to DD that displays experimental and descriptive as a standard for methodology.
Technologies 11 00112 g003
Figure 4. Interrelationship between methods and type of methodology that states that any methodology is a mixture of shared techniques.
Technologies 11 00112 g004
Figure 5. Findings on the methodology by (a) solved problems and (b) not solved problems points out that experimental factors can show quantifiable measures capable of detecting issues during the research job.
Technologies 11 00112 g005
Table 1. Dataset recollection criteria.
WorkMethodologyProblem SolvedProblem Unsolved
The research workApplied methodologyThe problem or problems solvedThe problem or problems not solved (when researchers have reported)
Table 2. Added vectors for normalization.
YearCategoryTypeSolvedUnsolved
Publication yearFor method categorizationFor type of categorizationQuantity of problems solved by workQuantity of problems not solved when authors had manifested them
Table 3. Variable definitions and characteristics.
Independent VariableAffect onDependent VariablePerformance Indicator
WorksProductionTechnique knowledge i = 1 n ( w o r k )
ModalFrequencyProblematic impact M o = L i 1 + a D 1 D 1 + D 2
AppliedEffectivityProblems solved M e t h o d O b j e c t i v e
methodologiesEffectivityProblems not solved M e t h o d O b j e c t i v e
Table 4. Works by comparative methodology.
YearWorkType
2004[32]correlation
[33]performance|process
[34]query
2010[15]correlation
[35]performance|process
2011[36]correlation
2012[37]performance|process
2017[38]performance|process
[39]tree|query
2019[40]query
[41]query
2021[13]correlation
[42]query
Table 5. Works by descriptive methodology.
YearWorkType
2004[43]performance|process
2005[44]correlation
[45]performance|process
2007[46]performance|process
2009[16]correlation
[47]correlation
[48]correlation
[49]performance|process
2010[50]correlation
[51]performance|process
[52]performance|process
2011[53]label
[54]performance|process
[55]query
2012[56]correlation
2015[57]correlation
[58]correlation
2016[59]performance|process
[7]performance|process
2017[60]correlation
2018[61]granularity
[62]query|granularity
2019[63]mathematics
[64]performance|process
[65]performance|process
2020[66]query
2021[67]performance|process
2023[68]performance|process
Table 6. Works by experimental methodology.
YearWorkType
1997[31]tree|label
2000[69]performance|process
2002[70]query
2003[71]performance|process
2005[72]tree|label
2007[73]performance|process
2008[74]performance|process
[75]performance|process
[76]tree|label
2009[77]correlation
2010[78]correlation
2011[79]tree|query
2012[80]query
[81]query
2013[82]correlation
[83]granularity
[84]performance|process
[85]performance|process
2016[86]performance|process
[87]query
[88]query
2017[89]performance|process
2018[90]correlation
[14]performance|process
[91]query
2019[92]query
[93]query
2020[94]performance|process
2021[95]correlation
[96]correlation
[12]correlation
[97]performance|process
[98]performance|process
[99]performance|process
2022[100]tree|label
[101]tree|query
Table 7. Works by post facto methodology.
YearWorkType
2018[102]label
2020[103]query
2022[104]query
Table 8. Variable incidence on applied studies.
Variable TypeObservationValueUnit
IndependentApplied studies80Works
IndependentModal2021 (9)Modal
IndependentApplied Methodologiesexperimental (36)Predominant
DependentProblems Solved100Works
DependentProblems Not Solved14Works
Table 9. Sum of research grouped by category.
CategorySum
comparative13
descriptive28
experimental36
post facto3
Table 10. Method results.
CategoryTypeWorks
Comparativecorrelation4
performance|process4
query4
tree|query1
Descriptivecorrelation9
granularity1
label1
mathematics1
performance|process13
query2
query|granularity1
Experimentalcorrelation7
granularity1
performance|process14
query8
tree|label4
tree|query2
Post factolabel1
query2
Disclaimer/Publisher’s Note: The statements, opinions and data contained in all publications are solely those of the individual author(s) and contributor(s) and not of MDPI and/or the editor(s). MDPI and/or the editor(s) disclaim responsibility for any injury to people or property resulting from any ideas, methods, instructions or products referred to in the content.

