

Training Impulse and Its Impact on Load Management in Collegiate and Professional Soccer Players


Abstract
:1. Introduction
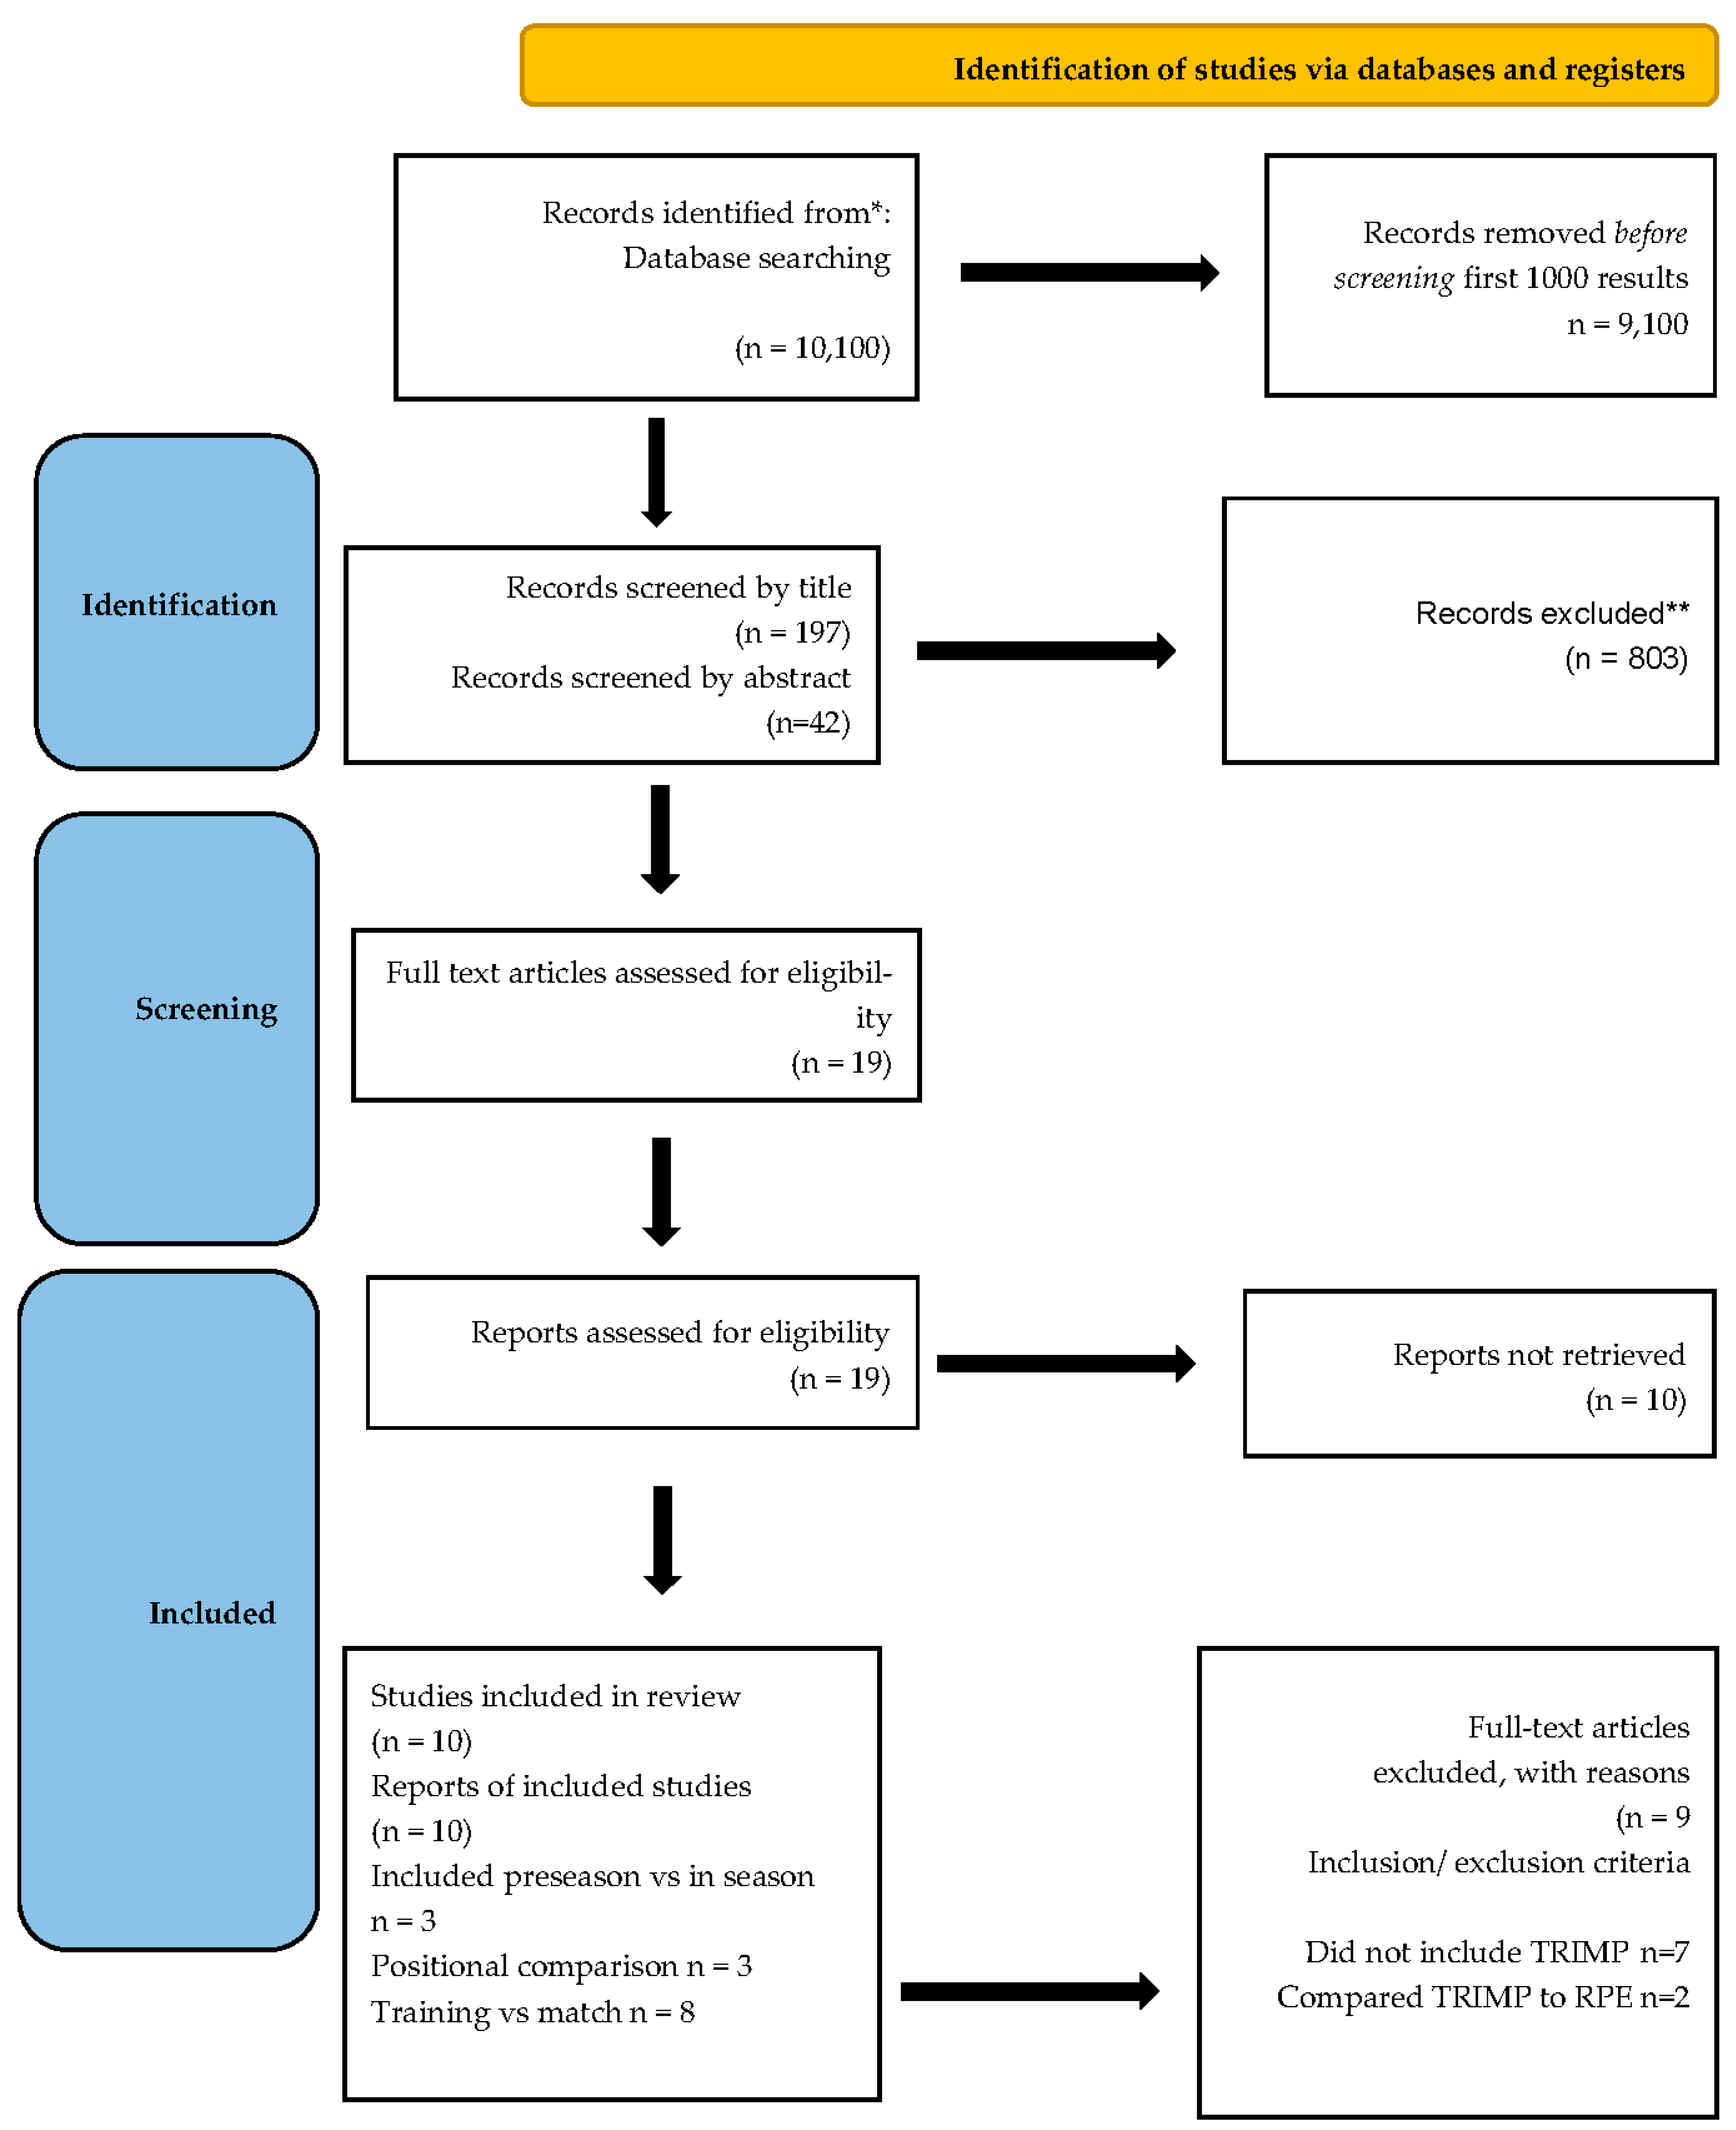
2. Methods
2.1. Revised Search Criteria
2.2. TRIMP methodologies
- Edward’s TRIMP is a heart-rate-proposed zone-based method. The time spent in each predetermined percentage zone is multiplied by the coefficient to determine the training load [3,4,11]. This method originally gained popularity as the standard method; however, since the zones are predefined and lack metabolic and performance thresholds, studies have not proven zone five is five times more demanding than zone one in relation to training intensity and adaptations.
- Bannister’s TRIMP utilizes the intensity of exercise, utilizing the heart rate reserve and the duration of the exercise [1,8,9,11]. This method is utilized primarily in athletes with long training periods and short competition phases [9,11]. Some limitations of the method for soccer players include the use of the heart rate mean may not reflect heart rate throughout the intermittent exercise. Secondly, there is a universal equation for males and females; this implies that gender is the only factor that makes athletes different.
- Individualized TRIMP is measured by linking an individualized heart rate blood lactate to incremental exercise [7]. This method is not limited by gender because it is individualized to the athlete.
- Lucia TRIMP is a method based on ventilatory thresholds. There are three zones, and each zone is given a coefficient that is multiplied by the time spent in each zone to give a TRIMP score [6]. This method shares some of the same limitations as Edwards since they are not directly linked to performance thresholds; it is difficult to prove that zone three is three times more demanding than zone one [6].
- Finally, modified TRIMP, also known as Stagno’s TRIMP, is a modified version of Bannister’s TRIMP [5]. This method links the blood lactate threshold to exercise intensity and is linked to each heart rate zone. This method provides some individualized data due to using the individual blood lactate level instead of an equation that reflects hypothetical blood lactate levels.
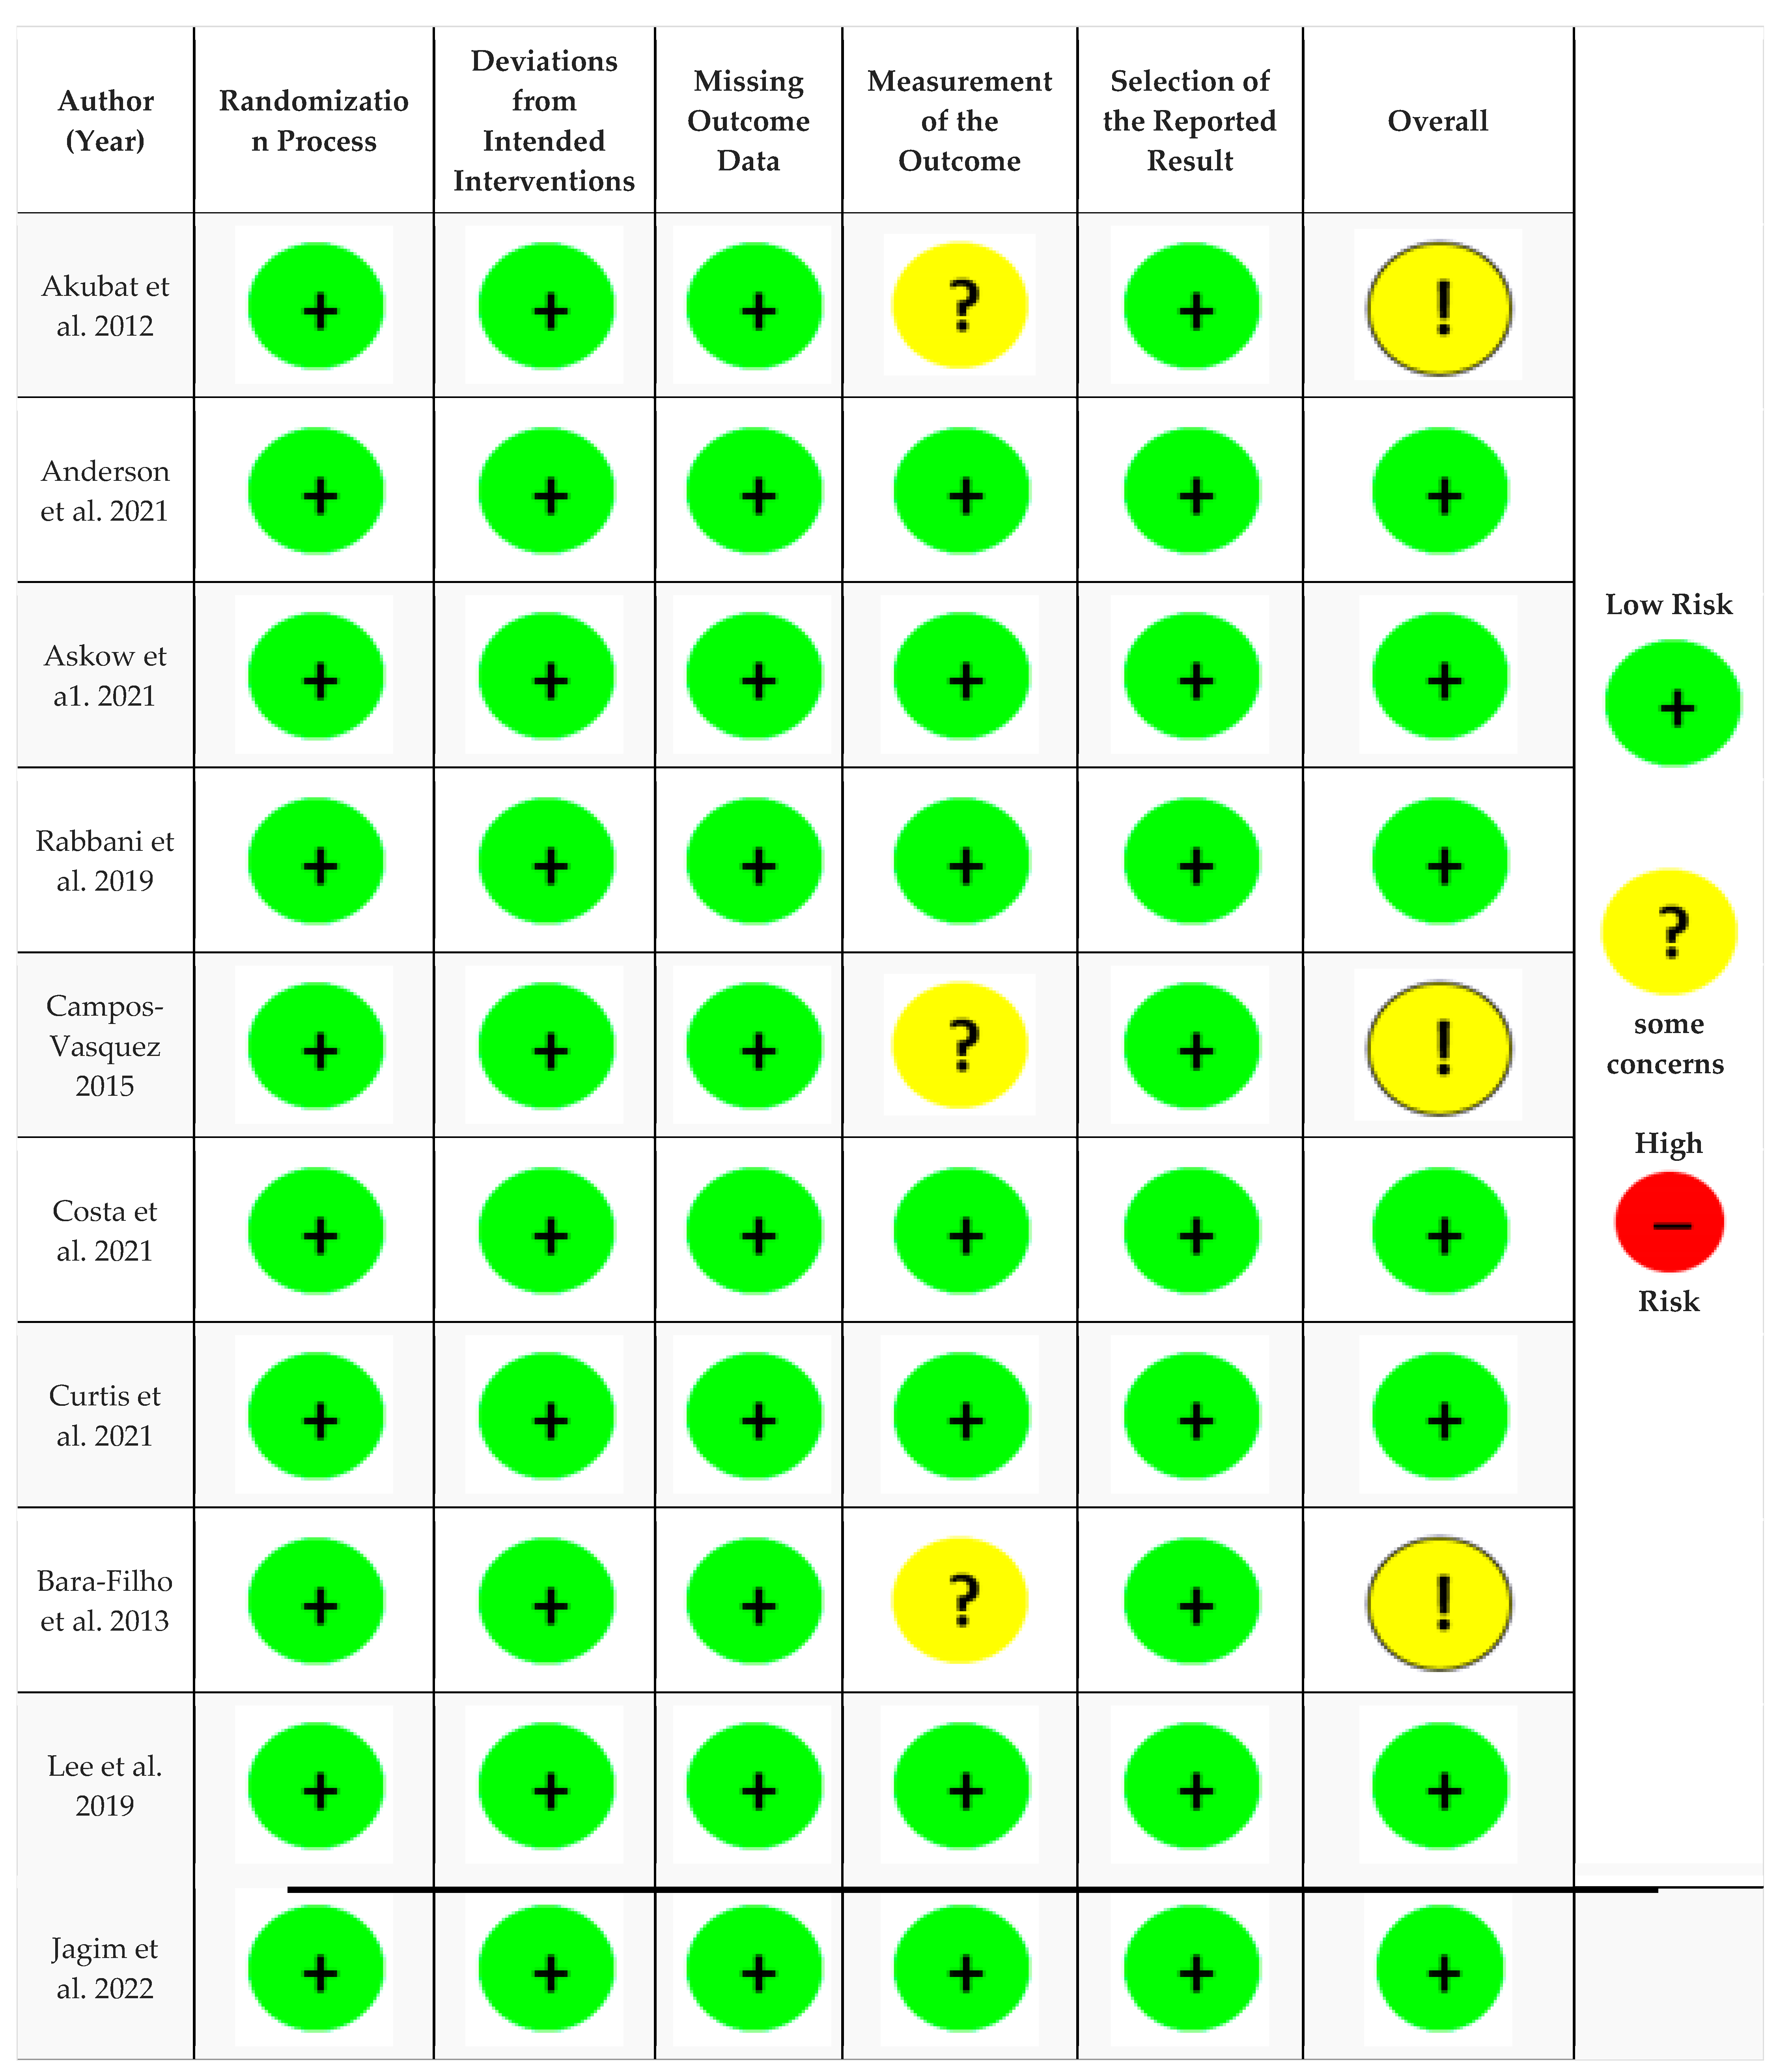
2.3. Risk of Bias
3. Results
3.1. Subjects
3.2. Study Design
3.3. Training vs. Match
3.4. Seasonal Comparison
3.5. Positional
4. Discussion
5. Conclusions
Author Contributions
Funding
Institutional Review Board Statement
Informed Consent Statement
Data Availability Statement
Conflicts of Interest
References
- Askow, A.T.; Lobato, A.L.; Arndts, D.J.; Jennings, W.; Kreutzer, A.; Erickson, J.L.; Esposito, P.E.; Oliver, J.M.; Foster, C.; Jagim, A.R. Session Rating of perceived exertion (sRPE) load and training impulse are strongly correlated to GPS-derived measures of external load in NCAA Division I women’s soccer athletes. J. Funct. Morphol. Kinesiol. 2021, 6, 90. [Google Scholar] [CrossRef]
- Bara-Filho, M.G.; Freitas, D.S.; Moreira, D.; Matta, M.D.O.; De Lima, J.R.P.; Nakamura, F.Y. Heart rate variability and soccer training: A case study. Mot. Rev. Ed. Física 2013, 19, 171–177. [Google Scholar] [CrossRef] [Green Version]
- Curtis, R.M.; Huggins, R.A.; Benjamin, C.L.; Sekiguchi, Y.; Arent, S.M.; Armwald, B.C.; Pullara, J.M.; West, C.A.; Casa, D.J. Seasonal accumulated workloads in collegiate men’s soccer: A comparison of starters and reserves. J. Strength Cond. Res. 2021, 35, 3184–3189. [Google Scholar] [CrossRef]
- Anderson, T.; Adams, W.M.; Martin, K.J.; Wideman, L. examining internal and external physical workloads between training and competitive matches within collegiate Division I men’s soccer. J. Strength Cond. Res. 2021, 35, 3440–3447. [Google Scholar] [CrossRef] [PubMed]
- Campos-Vazquez, M.A.; Mendez-Villanueva, A.; Gonzalez-Jurado, J.A.; Leon-Prados, J.A.; Santalla, A.; Suarez-Arrones, L. Relationships between rating-of-perceived-exertion- and heart-rate-derived internal training load in professional soccer players: A comparison of on-field integrated training sessions. Int. J. Sports Physiol. Perform. 2015, 10, 587–592. [Google Scholar] [CrossRef]
- Lee, M.; Mukherjee, S. Relationship of training load with high-intensity running in professional soccer players. Int. J. Sports Med. 2019, 40, 336–343. [Google Scholar] [CrossRef]
- Akubat, I.; Patel, E.; Barrett, S.; Abt, G. Methods of monitoring the training and match load and their relationship to changes in fitness in professional youth soccer players. J. Sport. Sci. 2012, 30, 1473–1480. [Google Scholar] [CrossRef]
- Costa, J.A.; Figueiredo, P.; Nakamura, F.Y.; Rebelo, A.; Brito, J. Monitoring individual sleep and nocturnal heart rate variability indices: The impact of training and match schedule and load in high-level female soccer players. Front. Physiol. 2021, 12, 678462. [Google Scholar] [CrossRef]
- Jagim, A.R.; Askow, A.T.; Carvalho, V.; Murphy, J.; Luedke, J.A.; Erickson, J.L. Seasonal accumulated workloads in collegiate women’s soccer: A comparison of starters and reserves. J. Funct. Morphol. Kinesiol. 2022, 7, 11. [Google Scholar] [CrossRef] [PubMed]
- Rabbani, A.; Kargarfard, M.; Castagna, C.; Clemente, F.M.; Twist, C. Associations between selected training-stress measures and fitness changes in Male soccer players. Int. J. Sport. Physiol. Perform. 2019, 14, 1050–1057. [Google Scholar] [CrossRef]
- Carrier, B.; Barrios, B.; Jolley, B.D.; Navalta, J.W. Validity and reliability of physiological data in applied settings measured by wearable technology: A rapid systematic review. Technologies 2020, 8, 70. [Google Scholar] [CrossRef]
- Nicolas-Alonso, L.F.; Gomez-Gil, J. Brain computer interfaces, a review. Sensors 2012, 12, 1211–1279. [Google Scholar] [CrossRef]
- Sun, Z.; Huang, Z.; Duan, F.; Liu, Y. A novel multimodal approach for hybrid brain–computer interface. IEEE Access 2020, 8, 89909–89918. [Google Scholar] [CrossRef]
- Wood, G.; Wright, D.J.; Harris, D.; Pal, A.; Franklin, Z.C.; Vine, S.J. Testing the construct validity of a soccer-specific virtual reality simulator using novice, academy, and professional soccer players. Virtual Real. 2021, 25, 43–51. [Google Scholar] [CrossRef] [Green Version]
- Smith, M.R.; Thompson, C.; Marcora, S.M.; Skorski, S.; Meyer, T.; Coutts, A.J. Mental fatigue and soccer: Current knowledge and future directions. Sport. Med. 2018, 48, 1525–1532. [Google Scholar] [CrossRef] [PubMed]
- Pellas, N. The influence of computer self-efficacy, metacognitive self-regulation and self-esteem on student engagement in online learning programs: Evidence from the virtual world of Second Life. Comput. Hum. Behav. 2014, 35, 157–170. [Google Scholar] [CrossRef]
- Pesce, C.; Tessitore, A.; Casella, R.; Pirritano, M.; Capranica, L. Focusing of visual attention at rest and during physical exercise in soccer players. J. Sport. Sci. 2007, 25, 1259–1270. [Google Scholar] [CrossRef]
- Gelman, R.; Berg, M.; Ilan, Y. A subject-tailored variability-based platform for overcoming the plateau effect in sports training: A narrative review. Int. J. Environ. Res. Public Health 2022, 19, 1722. [Google Scholar] [CrossRef]
- Shimi, A.; Tsestou, V.; Hadjiaros, M.; Neokleous, K.; Avraamides, M. Attentional skills in soccer: Evaluating the involvement of attention in executing a goalkeeping task in virtual reality. Appl. Sci. 2021, 11, 9341. [Google Scholar] [CrossRef]
- Wang, L. Simulation of sports movement training based on machine learning and brain-computer interface. J. Intell. Fuzzy Syst. 2021, 40, 6409–6420. [Google Scholar] [CrossRef]
- Ferrer, C.D.R.; Shishido, H.; Kitahara, I.; Kameda, Y. Read-the-game: System for skill-based visual exploratory activity assessment with a full body virtual reality soccer simulation. PLoS ONE 2020, 15, e0230042. [Google Scholar] [CrossRef] [Green Version]
- Al-Ashwal, W.; Asadi, H.; Mohamed, S.; Alsanwy, S.; Kooijman, L.; Nahavandi, D.; Abu Alqumsan, A.; Nahavandi, S. Cybersickness measurement and evaluation during flying a helicopter in different weather conditions in virtual reality. In Proceedings of the 2021 IEEE International Conference on Systems, Man, and Cybernetics (SMC), Melbourne, Australia, 17–20 October 2021; pp. 2152–2157. [Google Scholar]
- Nissim, Y.; Weissblueth, E. Virtual reality (VR) as a source for self-efficacy in teacher training. Int. Educ. Stud. 2017, 10, 52–59. [Google Scholar] [CrossRef] [Green Version]


| Item | Criteria | Example |
|---|---|---|
| P = Population | Collegiate or professional soccer/football players (16+ years) | NCAA Division 1 soccer players |
| I = Intervention | Utilize internal load of HR-derived impulse (otherwise known as TRIMP) | Edward’s TRIMP Bannister TRIMP Lucia TRIMP |
| C = Comparator | Preseason vs. in-season (season comparison), gameplay performance and training vs. match, training program, gameplay time (positional comparison) | TRIMP data for preseason vs. in-season |
| O = Outcome | Impact on recovery, either positive or negative, statistically significant, effect size, etc., based on training, gameplay | ANOVA Descriptive statistics reported |
| S = Study Design | Full-length season, full-length pitch, training vs. match, position comparison, available in English, preseason vs. in-season | Two consecutive fall seasons |
| Author | Year | Cross Sectional or Longitudinal | Sample Demographics | Number of Training Sessions and Matches | TRIMP Method | Analysis Performed | Results Training vs. Match |
|---|---|---|---|---|---|---|---|
| Akubat et al. [7] | 2012 | Longitudinal | Mean age 17 + 1 years; stature 1.81 + 0.05 m; body mass 72.9 + 6.7 kg | N/A | Bannister’s TRIMP, Team TRIMP, iTRIMP (individualized TRIMP) | No match vs practice analysis performed | Values were combined |
| Anderson et al. [4] | 2021 | Longitudinal | Age: 20 (2) y, body mass: 75.8 (5.9) kg, and height: 178 (6.8) cm | 87 training sessions and 34 matches | Edward’s | Mixed-effects model with pairwise contrasts | TRIMP in matches vs. training |
| Askow et al. [1] | 2021 | Longitudinal | Age: 20.3 (1.5) y, body mass: 65.1 (7.2) kg; height: 168.4 (7.9) cm | 47 practices 22 matches | Bannister’s Edward’s | MANOVA | TRIMP in matches vs. training |
| Rabbani et al. [10] | 2019 | Longitudinal | Age: 27.2 (4.5), body mass: 72.7 (6.6) kg, height: 180.4 (9) cm | 21 training sessions, 4 matches | Bannister’s Edward’s | No match vs practice analysis performed | TRIMP only obtained in matches |
| Campos-Vasquez et al. [5] | 2015 | Longitudinal | 26.7 ± 4.5 years, 176.5 ± 6.8 cm, 74.5 ± 5.7 kg, 10.1 ± 0.8% BF, 4.5 ± 4.1 years professional play. Mens soccer. | 288 individual training sessions (does not specify if that is team "sessions" or individual data,) | Edward’s Stagno | correlations, magnitude-based inferences | Absolute TRIMP in matches vs. training Relative TRIMP in training vs matches when TRIMP was scaled to duration of total session |
| Costa et al. [8] | 2021 | Longitudinal | Female soccer players, 20.06 ± 2.3 years, 1.6 ± 0.1 m, 22.1 ± 2.3 kg, 11 attackers, 10 midfielders, 7 fullbacks, 6 central defenders. | 6 practices 2 matches | Bannister’s | Descriptive and correlations for TRIMP | TRIMP in matches vs. training |
| Curtis et al. [3] | 2021 | Longitudinal | 20 ± 2 years, 77.4 ± 5.1 kg, 179.9 ± 6.5 cm, 9.9 ± 2.4% BF, 53.8 ± 4.1 mL/kg/min, male soccer players | 20 ± 2 games and 48 ± 6 practices over 14 ± 1 week season | Edwards | Multilevel mixed models to test differences between starters and reserves. Magnitude based inferences. | Did not report specific training vs. match data However, TRIMP was In reserves vs. starters |
| Jagim et al. [9] | 2022 | Longitudinal | female soccer players, 1.67 ± 0.05 m, 65.42 ± 6.33 kg, 48.99 ± 3.81 FFM (kg), 25.22 ± 4.78% BF | 47 practices, 22 matches (1444 unique player sessions) | Not Specified | RM ANOVA with Bonferroni adjustments for multiple comparisons, Cohen’s d ES | TRIMP in starters in matches vs. reserve players TRIMP in reserves in training vs. starters |
| Author | Year | Cross Sectional or Longitudinal | Sample Demographics | Number of Training Sessions and Matches | TRIMP Method | Analysis Performed | Results Seasonal Comparison |
|---|---|---|---|---|---|---|---|
| Bara-Filho et al. [2] | 2013 | Longitudinal Case study | Age: 19 and 26 y, Body fat: 10.1 and 10.6%, VO2max: 60.8 and 62.3 (mL/kg/min) | 3-week period with 3 matches (friendlies) | Modified TRIMP (Stagno) | Case study—no analysis performed | This data is not easy to summarize due to the outlier we have reached out to the authors for clarification. |
| Lee et al. [6] | 2019 | Longitudinal | Age: 26.2 (3.8), body mass: 68.5 (8.6) kg, height: 173.6 (5.6) cm, body fat: 15.1 (4.5)% | 42 training sessions | Lucia TRIMP | Mixed linear modeling | Pre-season TRIMP vs. early season Early season vs. midseason Midseason vs. late-season Overall pre-season TRIMP was higher and TRIMP decreased over the season since recovery is prioritized |
| Rabbani et al. [10] | 2019 | Longitudinal | Age: 27.2 (4.5), body mass: 72.7 (6.6) kg, height: 180.4 (9) cm | 21 training sessions, 4 matches | Bannister’s TRIMP, Edward’s TRMP | No seasonal analysis performed | TRIMP prior to matches than after the season where TRIMP is lower |
| Author | Year | Cross Sectional or Longitudinal | Sample Demographics | Number of Training Sessions and Matches | TRIMP Method | Analysis Performed | Results Positional Comparison |
|---|---|---|---|---|---|---|---|
| Bara-Filho et al. [2] | 2013 | Longitudinal Case study | Age: 19 and 26 y, Body fat: 10.1 and 10.6%, VO2max: 60.8 and 62.3 (mL/kg/min) | 3-week period with 3 matches (friendlies) | Modified TRIMP (Stagno) | Case study—no analysis performed | It is not easy to summarize this study due to the outlier; we have reached out to the authors for clarification. |
| Curtis et al. [3] | 2021 | Longitudinal | 20 ± 2 years, 77.4 ± 5.1 kg, 179.9 ± 6.5 cm, 9.9 ± 2.4% BF, 53.8 ± 4.1 mL/kg/min, male soccer players | 20 ± 2 games and 48 ± 6 practices over 14 ± 1 week season | Edwards | Multilevel mixed models to test differences between starters and reserves. Magnitude based inferences. | Did not report specific training vs. match data However, TRIMP was in reserves vs. starters |
| Jagim et al. [9] | 2022 | Longitudinal | female soccer players, 1.67 ± 0.05 m, 65.42 ± 6.33 kg, 48.99 ± 3.81 FFM (kg), 25.22 ± 4.78% BF | 47 practices, 22 matches (1444 unique player sessions) | Not Specified | RM ANOVA with Bonferroni adjustments for multiple comparisons, Cohen’s d ES | TRIMP in starters in matches vs. reserve players TRIMP in reserves in training vs. starters |
Disclaimer/Publisher’s Note: The statements, opinions and data contained in all publications are solely those of the individual author(s) and contributor(s) and not of MDPI and/or the editor(s). MDPI and/or the editor(s) disclaim responsibility for any injury to people or property resulting from any ideas, methods, instructions or products referred to in the content. |
© 2023 by the authors. Licensee MDPI, Basel, Switzerland. This article is an open access article distributed under the terms and conditions of the Creative Commons Attribution (CC BY) license (https://creativecommons.org/licenses/by/4.0/).
Share and Cite
Gardner, C.; Navalta, J.W.; Carrier, B.; Aguilar, C.; Perdomo Rodriguez, J. Training Impulse and Its Impact on Load Management in Collegiate and Professional Soccer Players. Technologies 2023, 11, 79. https://doi.org/10.3390/technologies11030079
Gardner C, Navalta JW, Carrier B, Aguilar C, Perdomo Rodriguez J. Training Impulse and Its Impact on Load Management in Collegiate and Professional Soccer Players. Technologies. 2023; 11(3):79. https://doi.org/10.3390/technologies11030079
Chicago/Turabian StyleGardner, Clinton, James W. Navalta, Bryson Carrier, Charli Aguilar, and Jorge Perdomo Rodriguez. 2023. "Training Impulse and Its Impact on Load Management in Collegiate and Professional Soccer Players" Technologies 11, no. 3: 79. https://doi.org/10.3390/technologies11030079