1. Introduction
Smartphones are becoming increasingly intelligent in order to assist in humans’ daily life activities. Smart healthcare systems have a wide range of body sensor applications [
1]. The smart wearable sensor is used to improve the lifestyle of older people by observing them in order to prevent unprecedented incidents such as falls. The more-advanced smartphone features can detect the difference between the walking and running kinematic motions of a human with the help of sensors. The new features of smartphones are famous in the fitness community for keeping a record of a person’s daily footsteps. As the significant need for human daily life activity recognition increases, a more efficient artificial intelligence-based framework must be proposed.
Previous classical studies commonly used computer vision techniques for human activity recognition, which is a big challenge [
2,
3]. Computer vision techniques have primary issues during activity recognition, such as partial occlusion, background clutter, appearance, lighting, viewpoint, and changes in scale [
4,
5]. As human activity recognition applications increase daily, an efficient approach using sensor data must be proposed in order to overcome the environmental constraints that vision-based cameras often suffer due to their fixed position. Sensor data has many advantages compared to vision-based techniques: sensor data provides more privacy than vision-based approaches [
6], and vision-based methods are complex and carry processing costs.
Artificial intelligence-based techniques are primarily used, in every field, for numerous applications involving predictive analysis [
7]. Artificial intelligence models can learn patterns from huge amounts of data and achieve higher predictive performance accuracy than humans. Artificial intelligence is highly engaged in activity classification from vision and sensor-based data [
8]. Artificial intelligence-based machine learning and deep learning methods are employed to detect whether a person is walking or running.
The use of smartphones in our daily lives has increased dramatically in recent years. These devices are equipped with various sensors, such as accelerometers and gyroscopes, that can be used to track human motion. This research proposes a novel methodology for detecting human motion kinematics using sensor data. We utilize artificial intelligence techniques in order to analyze sensor data and accurately detect different types of motion, such as walking and running. This methodology can potentially revolutionize how we track and monitor human movement across various applications from sports performance to healthcare. Our primary research contributions to the detection of human motion kinematics are as follows:
A novel methodology is adopted for human kinematics motion detection based on smartphone accelerometers and gyroscope sensor values. A novel ensemble method based on random forest and decision tree models is used to detect motion as walking or running. Sensor exploratory data analysis (SEDA) is employed in order to determine usage patterns and gain insight from sensor data. The SEDA is based on the analysis of different graphs and charts.
The six machine learning and deep learning methods are applied in comparison to one another. The applied machine learning methods are random forest, logistic regression, decision tree, and support vector machine. Recurrent gated units and long short-term memory are deep learning-based techniques. The proposed random forest approach outperformed applied learning methods and other state-of-the-art approaches.
The applied learning techniques are fully optimized and hyperparameter-tuned to achieve high performance scores. We employed k-fold cross-validation to validate the accuracy of each applied method.
The remaining sections of the study are assembled as follows. The related works on human kinematics motion detection are comparatively analyzed in
Section 2. The proposed study methodology is examined in
Section 3. The results, evaluations, and related discussions are presented in
Section 4. The research study is concluded in
Section 5.
2. Related Work
The related literature on human motion kinematics and activity recognition is comparatively analyzed in this section. The proposed techniques applied in past approaches and their performance results are examined.
EEG signal-based motion artifact recognition using machine learning methods was presented in Reference [
9]. The single-channel EEG signal-based dataset was utilized to build the machine learning model. The machine learning model, a support vector machine (SVM), was used for motion artifact detection. Many algorithms were applied for feature extractions from signal data. The SVM achieved a 98% accuracy score for motion artifact recognition using the optimized Harris Hawks Optimization (HHO) algorithm [
10].
The recognition of human daily life activities using a combination of machine and deep learning was presented in Reference [
11]. The research dataset was based on signals extracted from the accelerometer sensor present in smartphones. A personalization model based on a hybrid of AdaBoost and CNN techniques was proposed. The propped hybrid model was trained and evaluated on the signal dataset. The research experiments showed that the proposed method achieved a 90% accuracy score for recognizing human falls and daily activities.
Daily life activity recognition [
12] and fall detection using machine learning methods were presented in Reference [
13]. Two public databases based on angular velocity and acceleration data were used for building the machine-learning models. The seven types of activities, including daily living and falls, were used as labels in the dataset. The dataset’s frequency and time domain features were extracted in order to train the applied learning models. The ensemble bagged tree and quadratic support vector machine achieved high performance in terms of accuracy score.
The human activity recognition achieved by unobtrusive health monitoring using machine learning methods was presented in Reference [
14]. A newly created SmartWall dataset was used to train and evaluate the applied machine learning models. A novel ambient HAR framework based on multivariate Gaussian was proposed for human activity recognition. The proposed method achieved a 97% accuracy score for unobtrusive human activity recognition.
Interleaved and concurrent human activity recognition using deep learning methods were proposed in this study [
15]. The proposed approach for human activity recognition was a hybrid model based on long-short-term memory bi-directional and the skip-chain conditional field. The two publicly available datasets, Kasteren House-B and Kyoto 3, were used for building the deep learning-based models. The results express that the proposed method achieved a 93% accuracy score for human activity recognition.
Human activity recognition using wearable sensor values based on deep learning techniques was presented in Reference [
16]. The proposed approach was based on the multi-input convolutional and gated recurrent unit neural networks. The dataset obtained from wearable sensors was utilized for training and evaluating the applied deep-learning models. The three datasets, WISDM, UCI-HAR, and PAMAP2, were used for the experiments. The proposed technique achieved an accuracy of 97% on the WISDM dataset for human activity recognition.
A feature-learning technique based on deep learning was presented in Reference [
17] and was used for human activity recognition. Convolutional neural networks were the proposed approach for human activity recognition. IMU and UCI-HAR datasets were used for training and testing the applied deep learning-based model. The inertial measurement unit [
18] and the audio-based feature were used during model learning. The proposed technique archived a 91% accuracy score on the UCI-HAR dataset for human activity recognition.
Human activity recognition on edge devices using deep learning methods was presented in Reference [
19]. A lightweight hybrid RNN-LSTM model was proposed for human activity recognition. The proposed model archived a 95% accuracy score for activity recognition with less computational power. The publicly available online WISDM dataset was used for conducting the research experiments. The analysis of related literature is based on different parameters, as analyzed in
Table 1.
3. Study Methodology
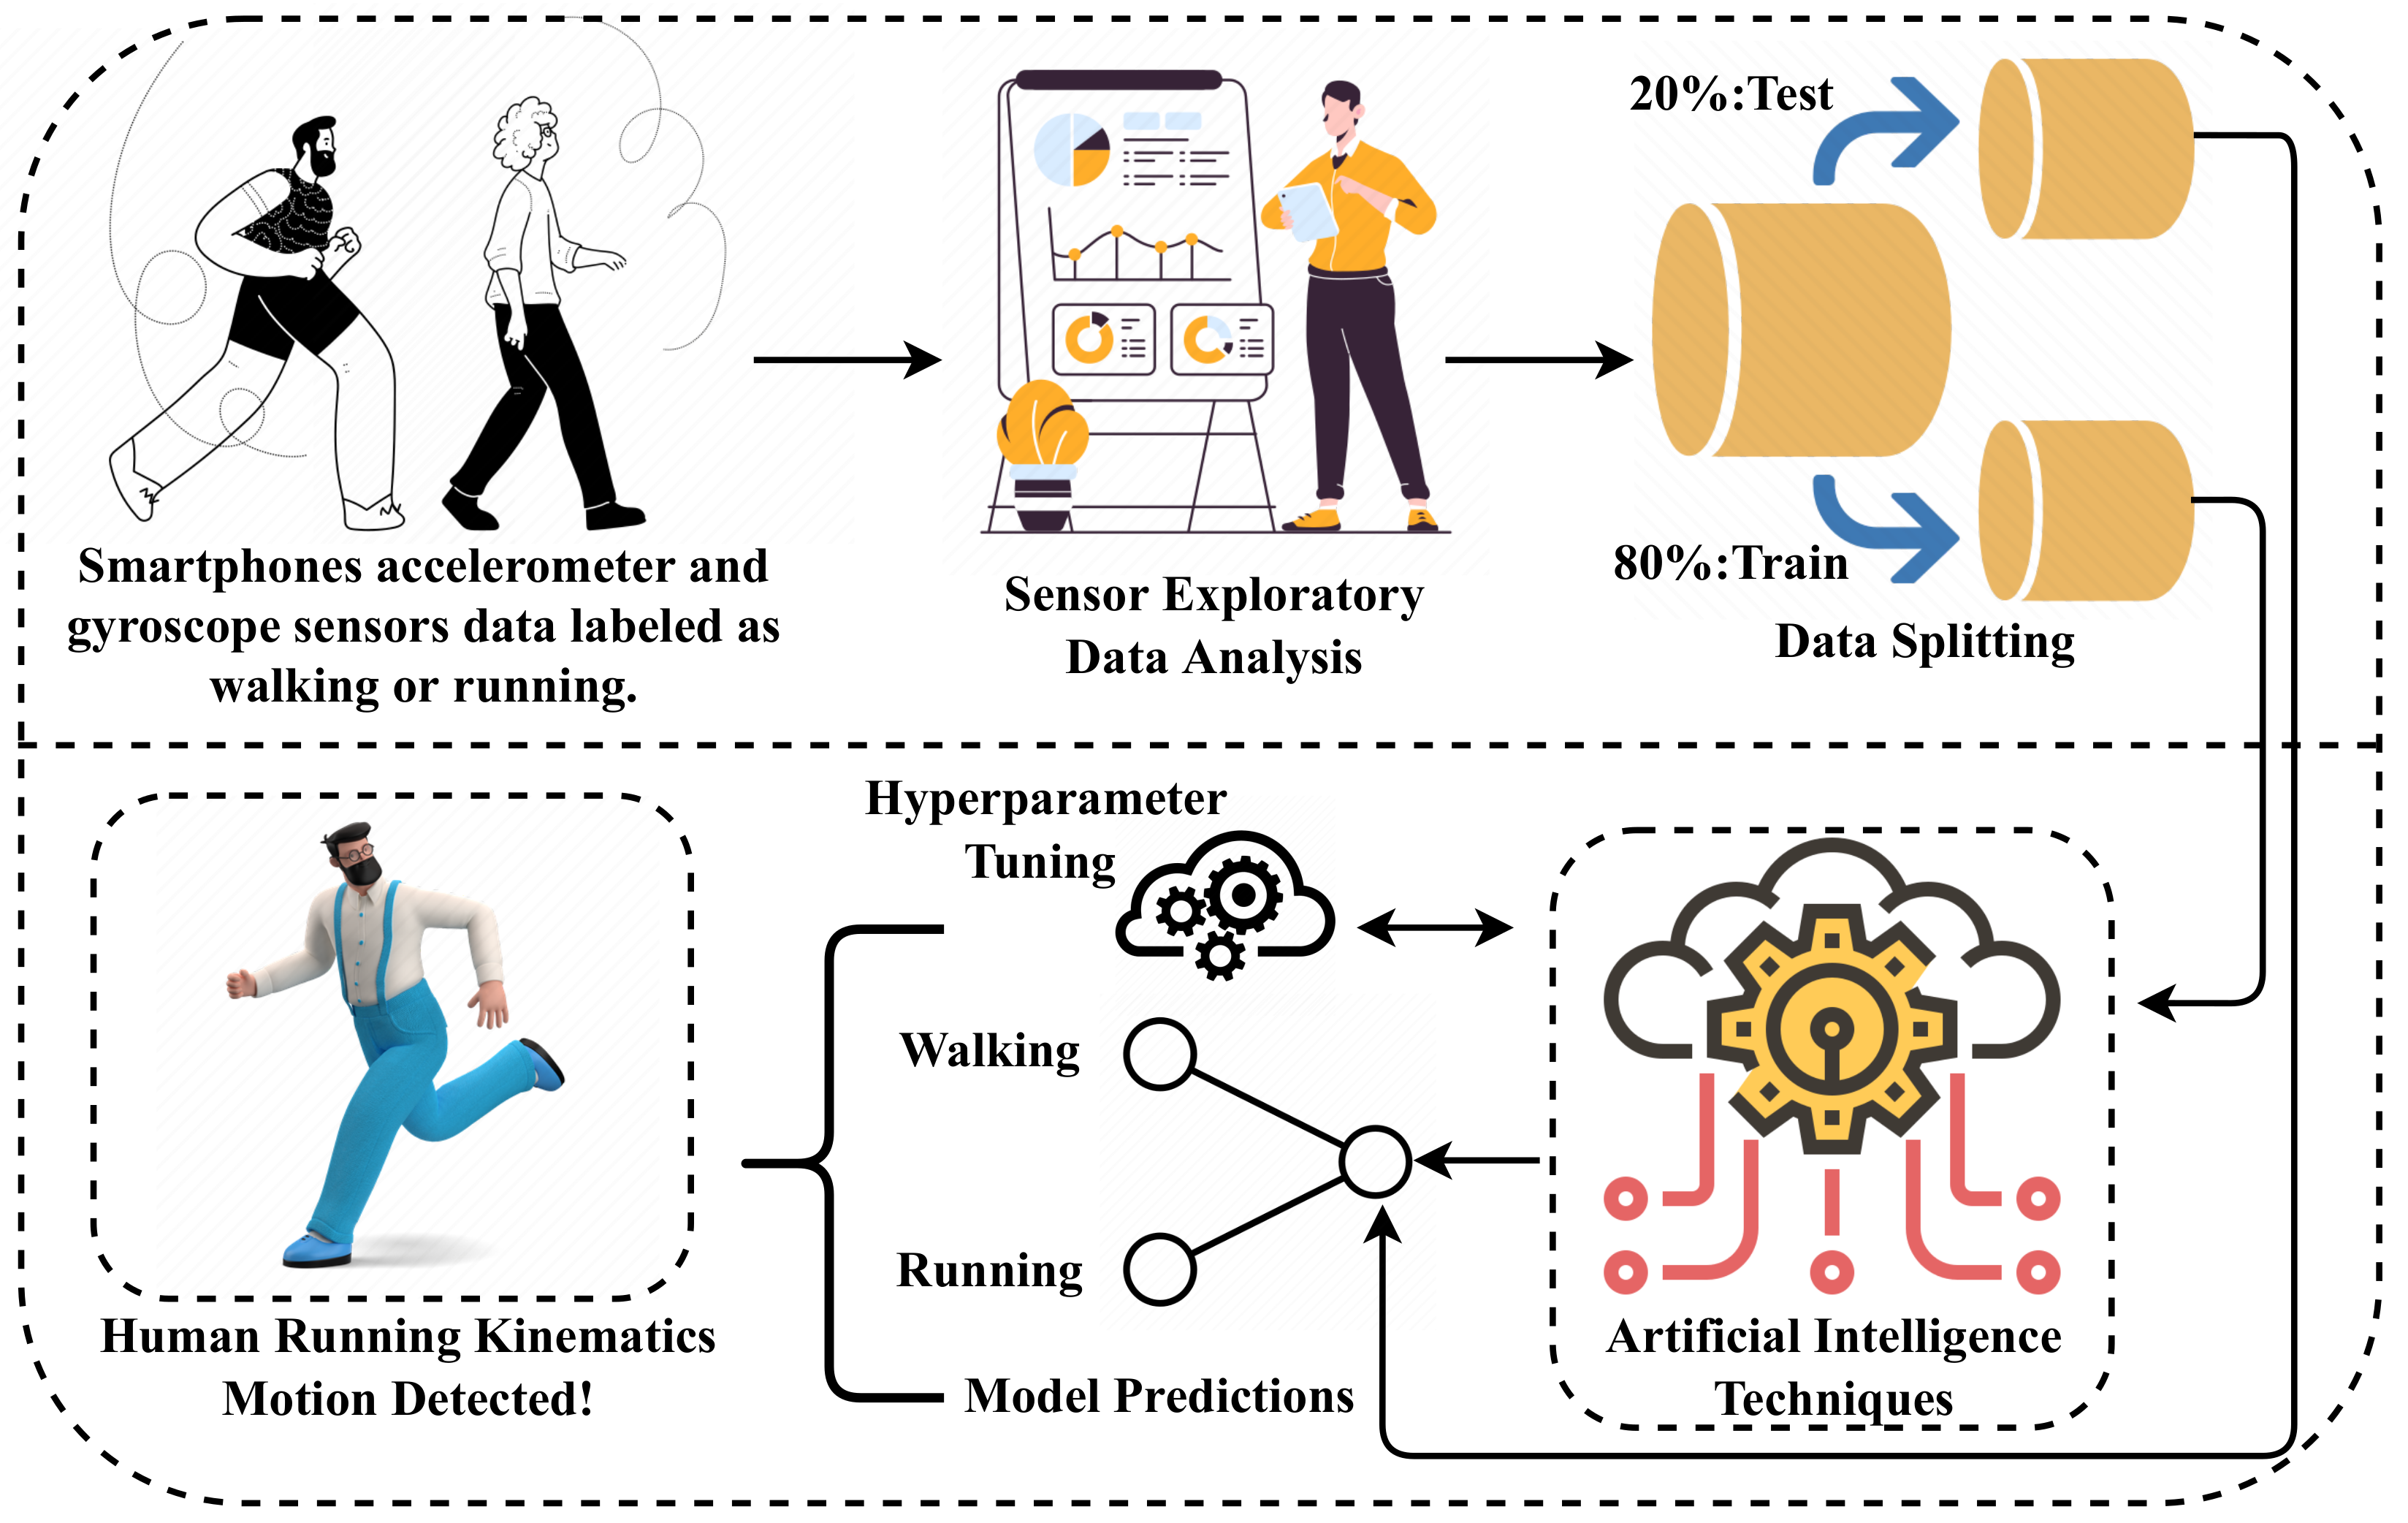
Smartphone sensor data labeled as walking or running were used for our research experiments. The SEDA was applied in order to determine valuable patterns and gain insight from sensor values. The SEDA was based on the analysis of graphical charts. The structured dataset was divided into portions during data splitting. Roughly 80% of the data was used to train the machine and deep learning-based methods, while the remaining 20% of the unseen test data was utilized to evaluate the applied models. Hyperparameter-tuning techniques were employed in order to determine the best-fit detection parameters of the learning techniques, those under which they achieved high accuracy scores. Finally, the top-performing proposed method was utilized to identify human motion as walking or running, as visualized in
Figure 1.
3.1. Smartphones Sensors Dataset
The smartphone sensors dataset publicly available on Kaggle [
20] was used for conducting the research experiments, and it was created by the IOS app named “Data Collection.” The sensory data from smartphone devices were recorded and labeled as walking or running. Smartphones’ accelerometer and gyroscope sensors were utilized to construct the dataset. The dataset file contains the data from 88,588 sensors with an interval of 10 s and a 5.4/s frequency rate. We dropped the additional dataset features, such as the date and time of data collection and the username of the human involved in data collection. The wrist feature represents a value where the smartphone device was placed. The activity feature, which was used as the target feature, contains a label indicating walking and running. The remaining features provide the sensor data for one of the sensor’s axes, as described in
Table 2.
3.2. Sensor Exploratory Data Analysis
Useful patterns and insights are drawn from our research dataset in this section. A bar chart is generated, and correlation and three-dimensional space analysis are performed. Different graphs and charts are visualized in this analysis.
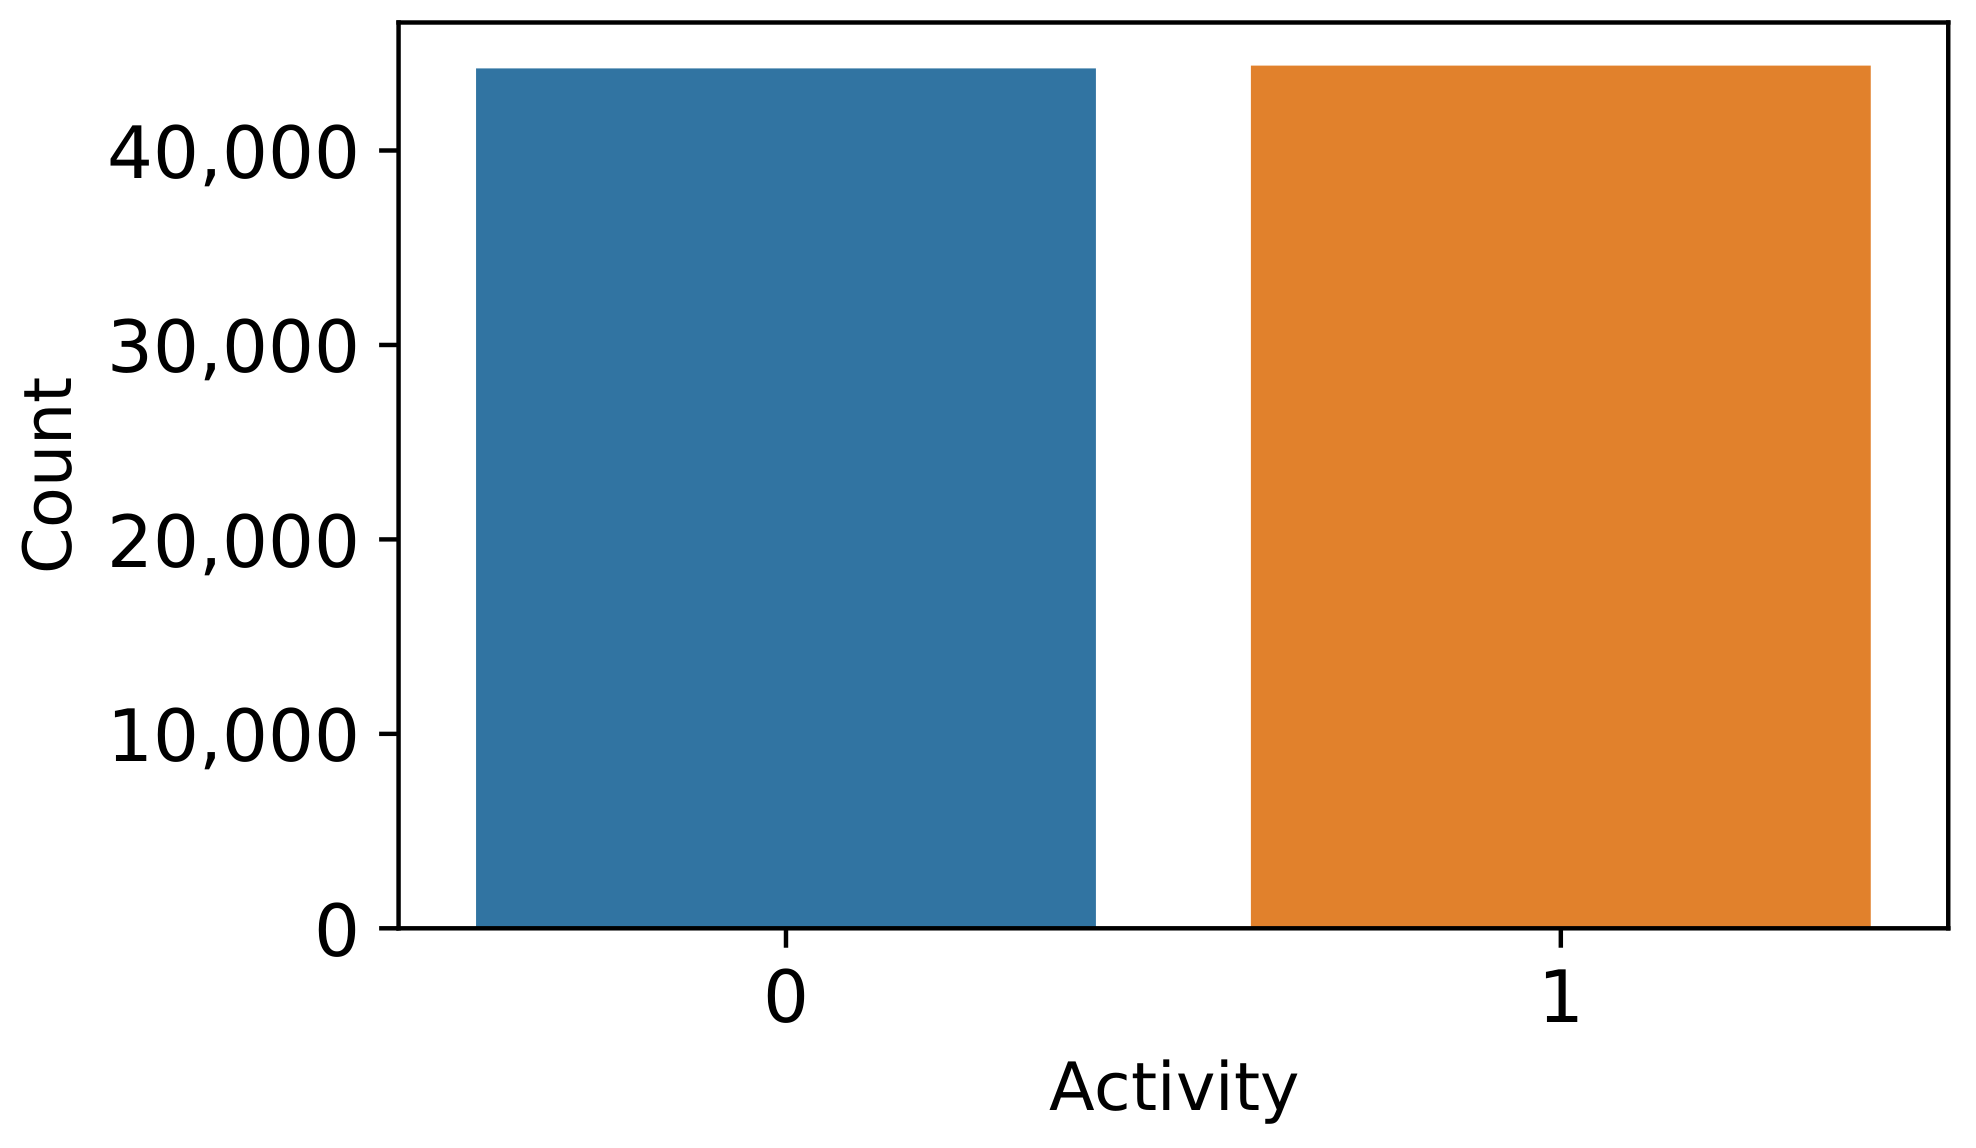
Bar chart-based data balancing analysis using the target label is presented in
Figure 2. The analysis demonstrates that the sensors’ dataset is balanced. The walking label (0) and running label (1) contain equal data distributions. The balanced dataset results in achieving high accuracy performance and prevents model overfitting.
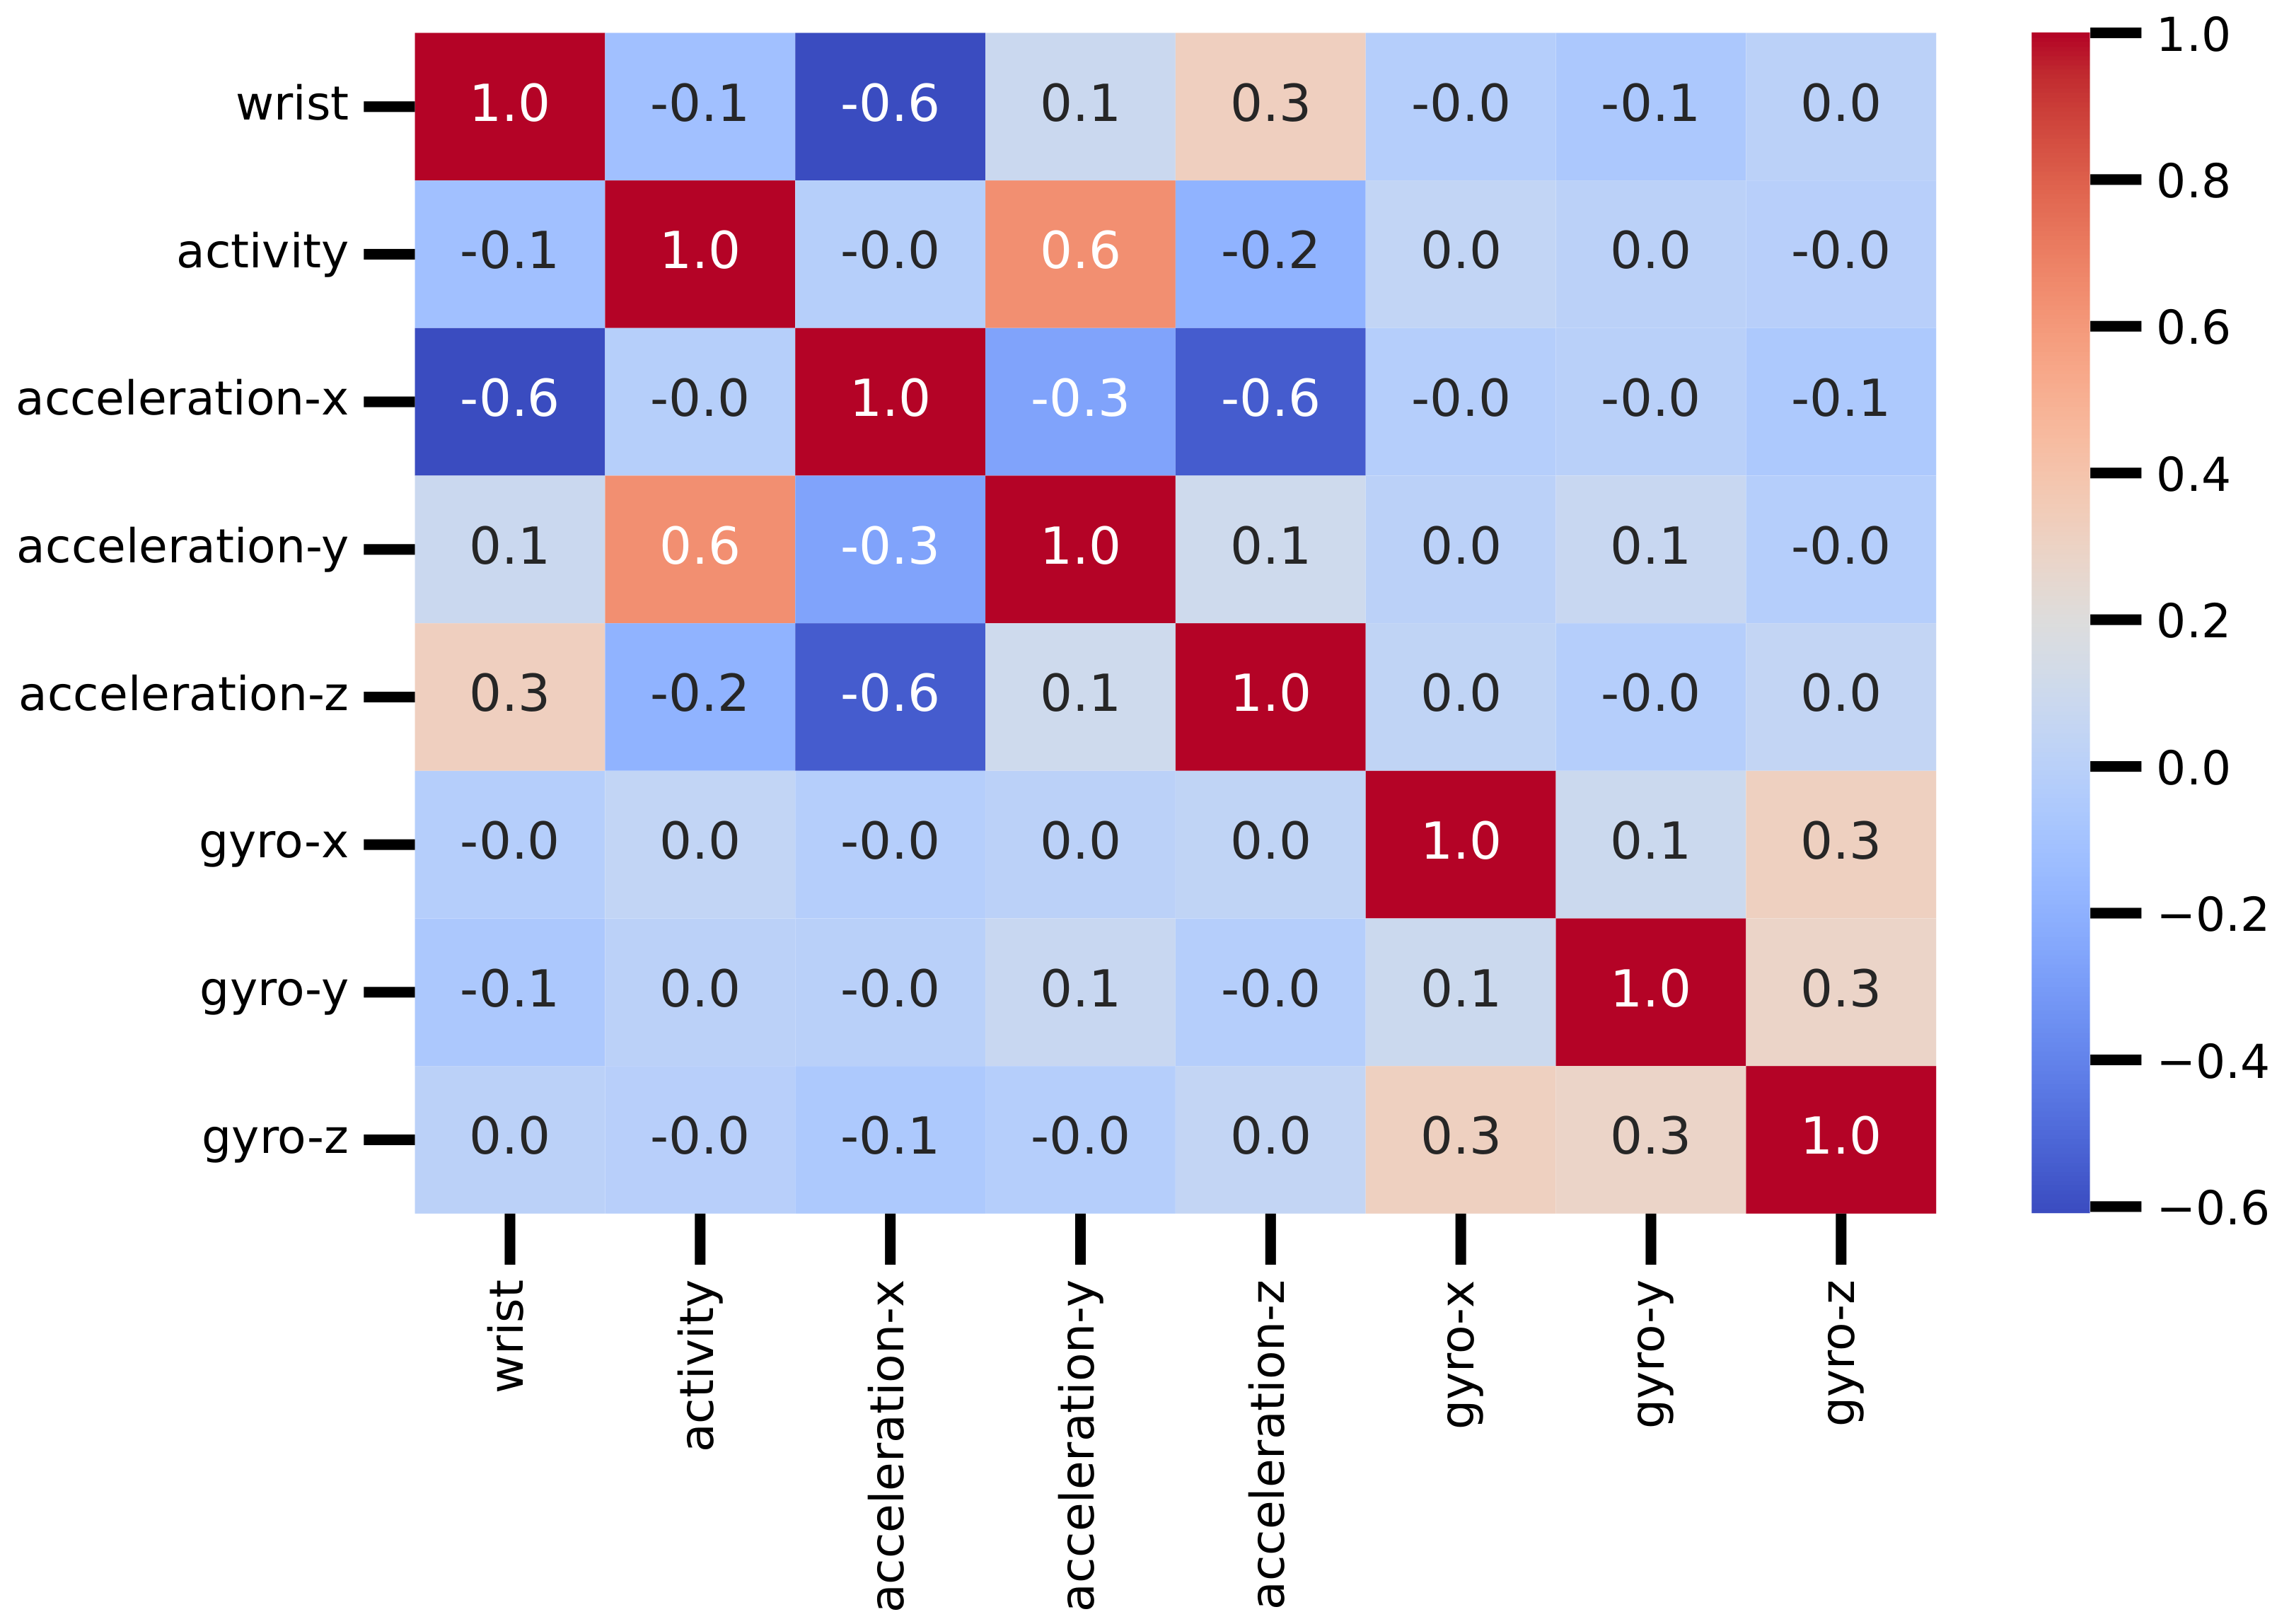
Correlation analysis of the features of our study dataset is visualized in
Figure 3. The analysis shows that a high positive correlation value of 0.6 is achieved by the features acceleration-y and activity, and an acceptable correlation value of 0.3 is achieved by the features acceleration-z, gyro-x, and gyro-y. A high negative correlation value of −0.6 is achieved by the features acceleration-x and wrist. This analysis concludes that the values of accelerometer sensor features have higher correlations than gyroscope sensor features. The dataset features have high relevance values to the target feature activity in this analysis.
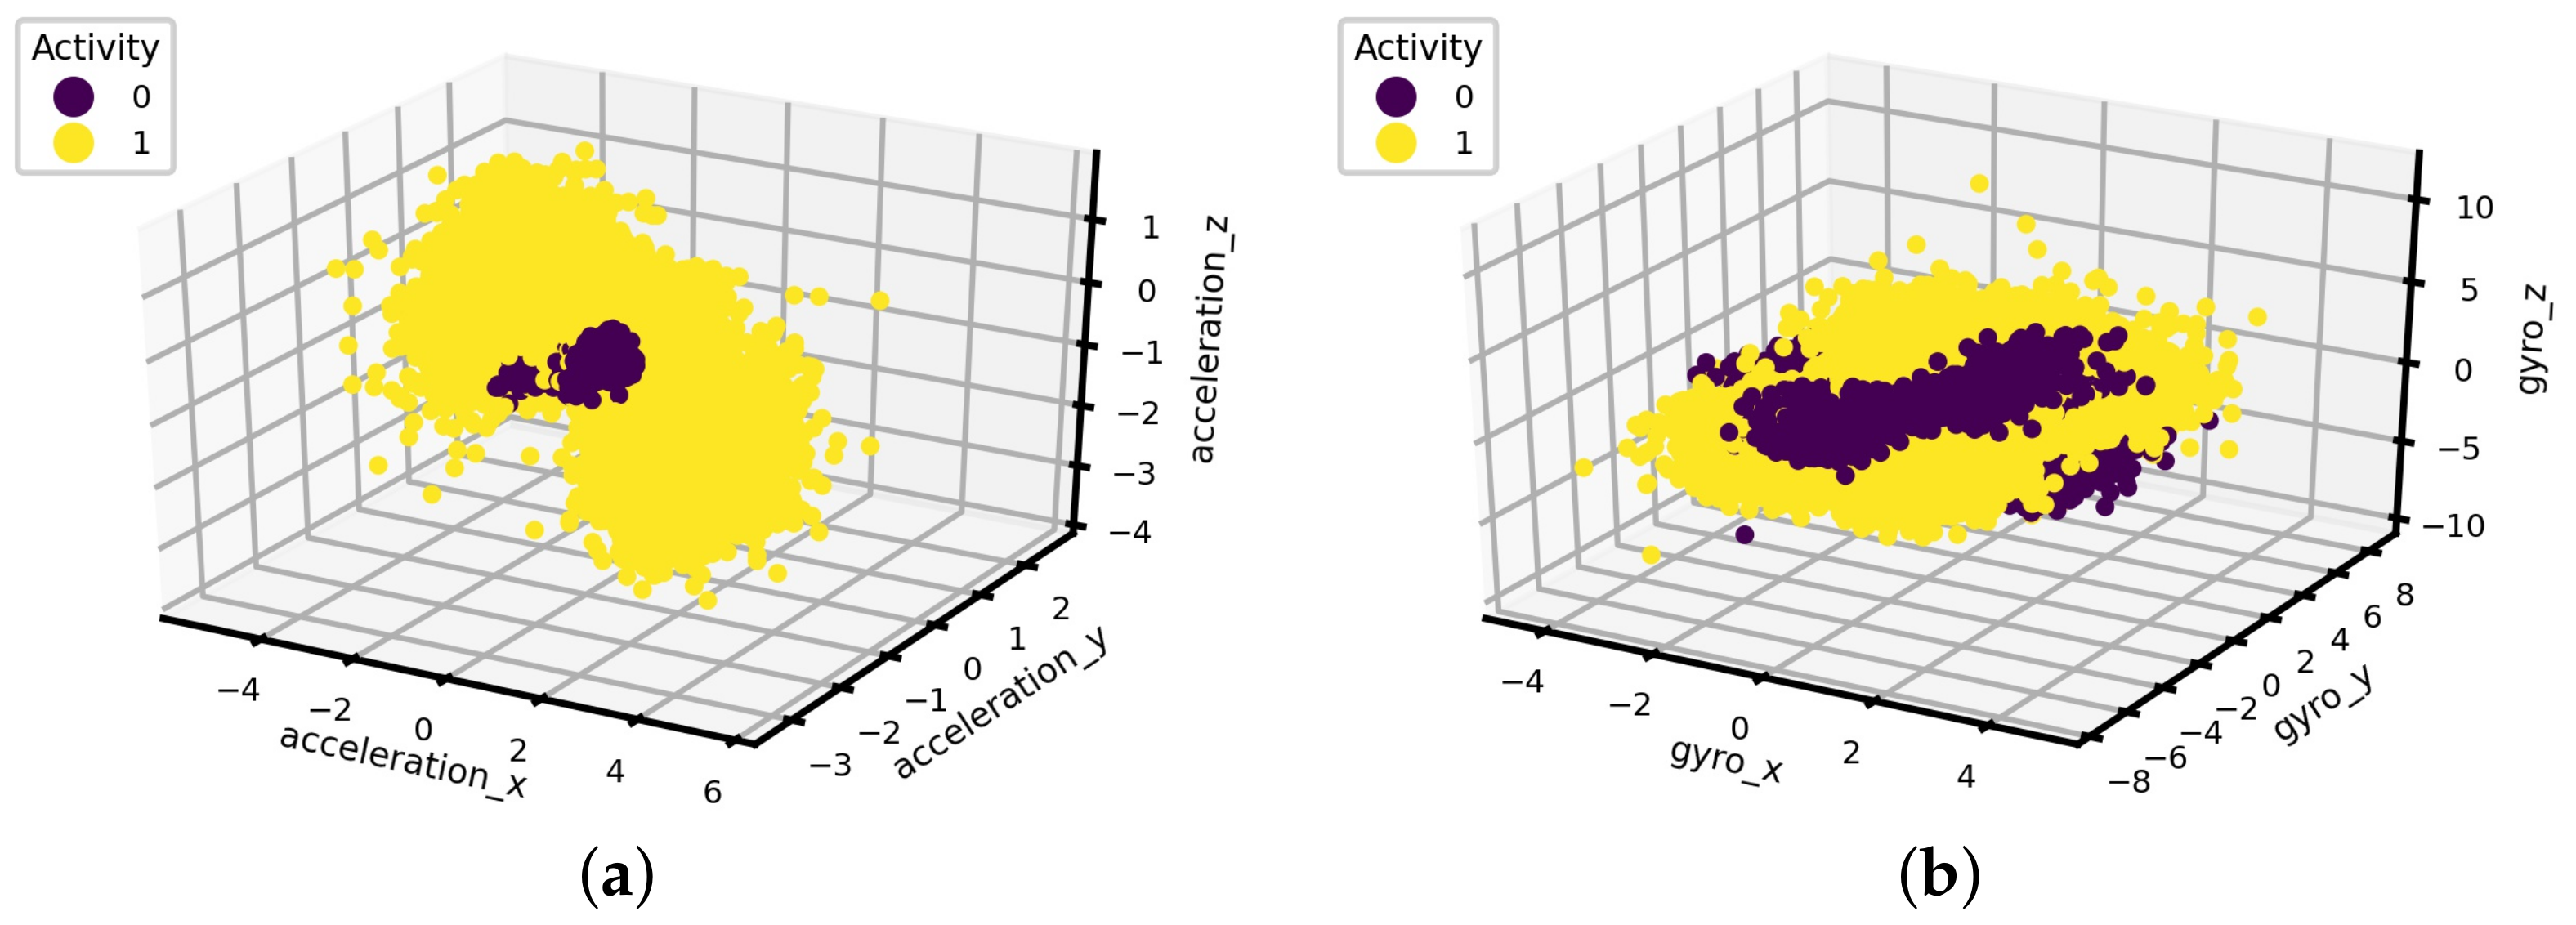
Three-dimensional space analysis determines the features’ separability, as shown in
Figure 4. The axis features of the accelerometer and gyroscope sensor are analyzed. The analysis demonstrates that the values of the accelerometer sensor features are complex and linearly separable for a learning classifier. The gyroscope sensor feature’s values are not easily separable. However, they can be classified by advanced learning classifiers. In conclusion, the linear classifiers may not perform well on this dataset.
3.3. Data Splitting
Dataset splitting is the most crucial aspect of machine learning techniques. Data splitting is utilized in order to avoid overfitting techniques and to test the applied methods. Our research dataset is divided into portions for training and testing the applied machine-learning models. In our study, we split the dataset with a ratio of 80:20. The 80% portion of the dataset was used to train the machine learning techniques. The 20% portion was used to test the machine learning techniques and evaluate performance.
3.4. Machine Learning and Deep Learning Methods
The applied machine learning and deep learning methods are analyzed in this section based on many parameters. The working mechanism adopted for each learning model is descriptively analyzed.
3.4.1. Decision Tree
Decision tree (DT) is a supervised non-parametric machine learning technique commonly used to solve classification-related problems [
21]. The DT method follows the flowchart structure using the divide and conquer technique. The DT [
22] has a hierarchical tree representation consisting of internal nodes, branches, and leaf nodes. During DT model building, the dataset features are symbolized by internal tree nodes, tree branches define decision-making rules, and leaf tree nodes represent class labels. The decision-making ability of the DT method is similar to the ability of human thinking to solve a problem. In our research, we used the Gini index to measure impurity while creating a DT. The mathematical notation to calculate the Gini index is analyzed in Equation (
1). Where p is the probability function in the Equation.
3.4.2. Random Forest
Random forest (RF) is another supervised machine learning technique used to solve classification problems [
23]. The working concept of the RF method is based on the ensemble learning technique. In RF methods [
24], multiple DT classifiers are combined to solve a problem. The dataset features are given to various DT classifiers, and each prediction’s average is taken as the final output. The majority voting technique is used to select the outcome. The RF methods have many advantages, such as improving performance and preventing overfitting.
3.4.3. Logistic Regression
The logistic regression (LR) method is another supervised machine learning model used to tackle classification problems [
25]. The LR method uses the input set of independent variables to predict the categorical dependent variable. The LR method [
26] output must be discrete or categorical. The outcome of the LR technique is the probabilistic values between zero and one. The LR method uses an S-shaped logistic function that predicts two maximum values. Equation (
2) describes the mathematical notations for LR. The b represents the bias, x represents the input features, and y is the target label in the expression.
3.4.4. Support Vector Machine
Support vector machine (SVM) [
27] also belongs to the family of supervised machine learning models used for classification tasks. The essential objective of the SVM method [
28] is to create a best-fit decision system boundary that can classify data in the n-dimensional space of features. The decision boundary is called a hyperplane in the SVM technique. The SVM chooses the extreme data vectors used for building the hyperplane, also called support vectors. The SVM chooses the best-fit hyperplane that correctly separates the classes in order to minimize the error; then, the hyperplane is generated iteratively. The hypothesis function
h in SVM is expressed in Equation (
3). Where w is the weight metric and b is the bias variable in the Equation.
3.4.5. Long Short-Term Memory
Long short-term memory (LSTM) is an artificial neural network-based supervised deep learning model which is frequently used for data regression and classification [
29]. The LSTM method is a special kind of recurrent neural network (RNN) with the advantage of remembering long data sequences for a long time. The LSTM model [
30] overcomes the vanishing gradient problem. Three gates are involved in the working of the LSTM model: the input, forget, and output gates. These gates are the filters that select and remove irrelevant information. The output gate determines the final output, as expressed in Equation (
4).
Table 3 describes the architecture of the applied LSTM model.
3.4.6. Gated Recurrent Units
Gated recurrent unit (GRU) is also an artificial neural network-based supervised deep learning technique [
31]. The GRU model’s working mechanism is the LSTM model’s companion. The only differences are the GRU unit’s data operations and gate formations. The GRU model [
32] utilizes less memory, resulting in it being faster than the LSTM model. Update and reset are the two gates used by the GRU model to solve a problem. The gate decides which data information should be processed and sent to the output.
Table 4 describes the architecture of the applied LSTM model.
3.5. Hyperparameter Tuning
The hyperparameters under which the applied machine learning and deep learning methods achieved high accuracy performances are examined in
Table 5. The applied machine learning and deep learning models are fully hyperparameter tuned. The best-fit hyperparameters for each learning technique were determined using the recursive process of hyperparameter tuning [
33].
3.6. Proposed Ensemble Method
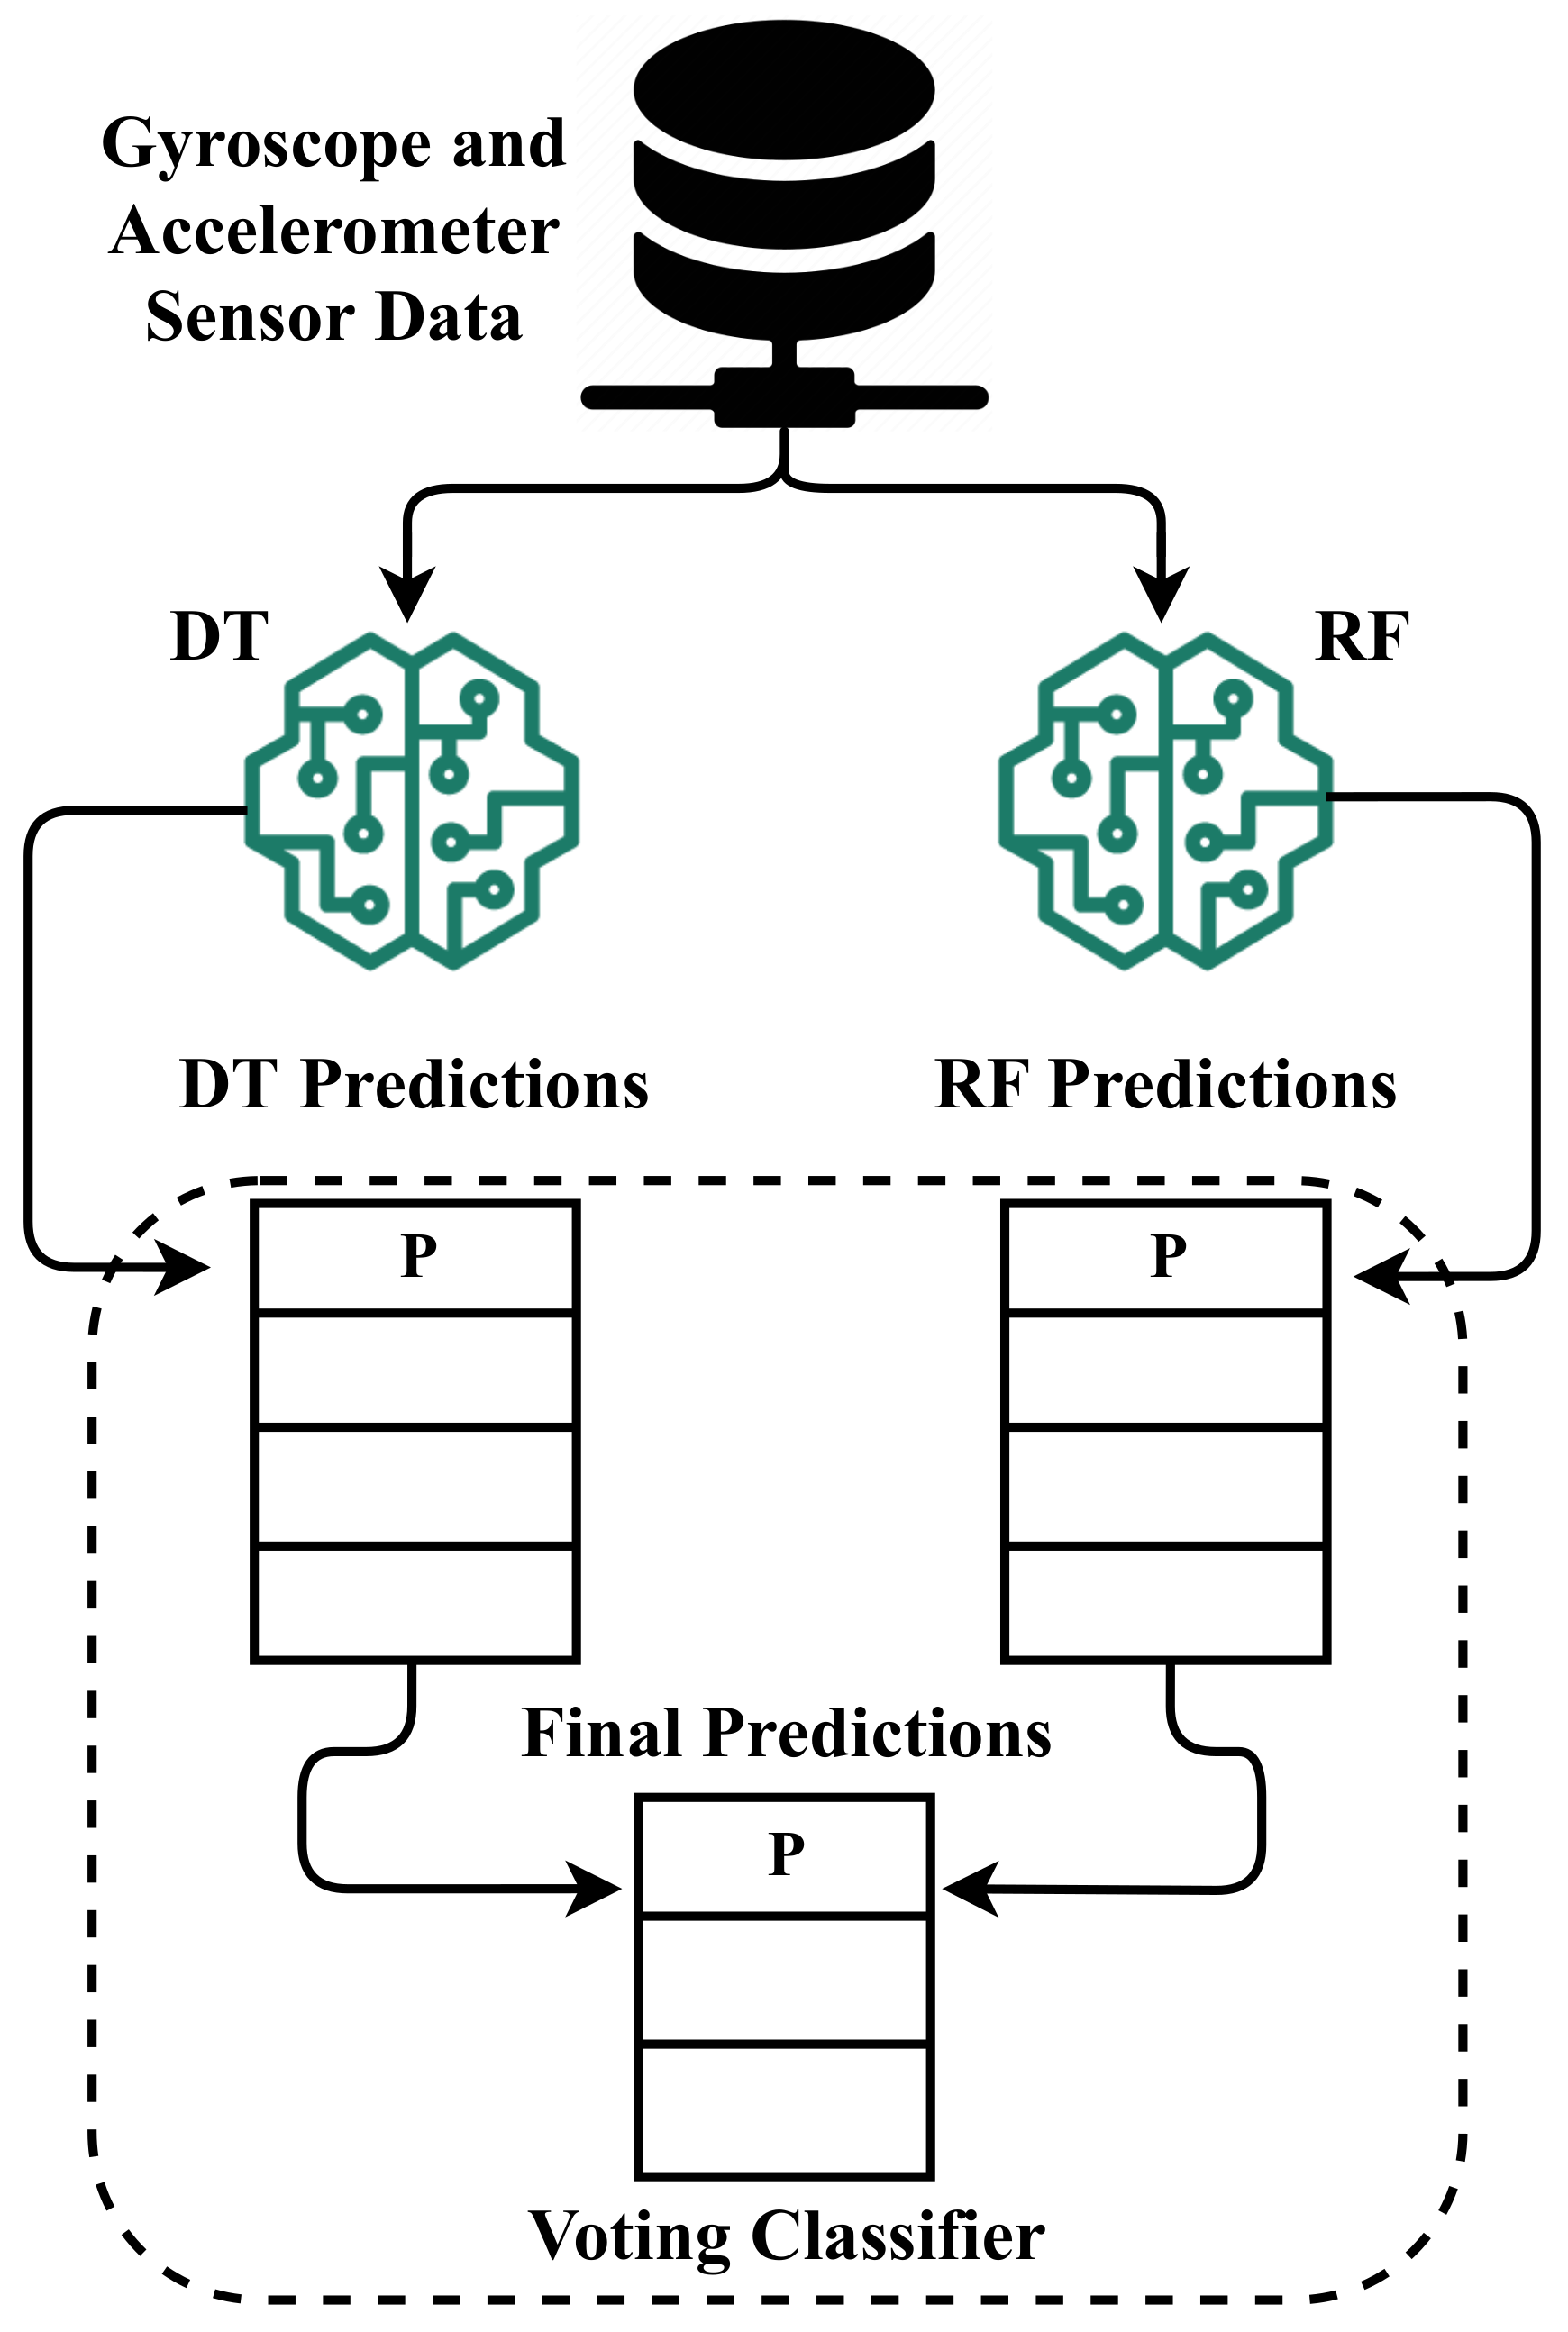
This study proposes the ensemble learning-based novel ERD method to detect human motion kinematics as walking or running. The architectural diagram of our proposed ensemble method is visualized in
Figure 5. The proposed ERD method combines the random forest and decision tree models for the prediction. The complete dataset is input to the random forest and decision tree models, then voting is performed between the two combined models in order to determine the final output. The motion with a majority vote is the final output for each dataset observation. The proposed ensemble method achieved high performance in terms of accuracy for the classification of human motion.
Ensemble learning combines multiple models in order to make more accurate predictions than any single model alone, providing more robust and reliable results. Our study results show that ensemble learning effectively achieves high accuracy in using sensor data to classify human motion. For example, sensor data may be noisy, and different models may be better suited to handle these issues in different ways. Ensemble learning also helps to improve the robustness of the classification model, meaning that it is less likely to overfit the training data and perform poorly on new, unseen data. This is particularly important for the classification of human motion using sensor data, during which there may be significant variation between individuals and movements. Ensemble learning is a powerful technique for achieving high accuracy when classifying human motions with sensor data. It can help improve the robustness of the model and reduce the impact of individual model weaknesses.
4. Result Sand Discussions
The experimental evaluation of the experiments performed in our research study is extensively analyzed in this section. This section contains comparative analysis of results with detailed discussions of the applied machine learning and deep learning techniques.
4.1. Experimental Setup
The experimental setup is analyzed for building and evaluating the applied learning techniques. All of our research experiments were conducted using the Python programming language. Tensorflow framework version 2.9.2, Keras framework version 2.9.0, and Sklearn framework version 1.0.2 were used for the building and evaluating of the applied artificial intelligence-based techniques.
4.2. Performance Metrics
Scientific evaluation and validation of the performance metrics of the applied artificial intelligence-based techniques are analyzed here. The metrics used for performance evaluations were the error rate, accuracy, precision, f1, recall, Cohen’s kappa, geometric mean, and the receiver operating characteristic (ROC) score.
Accuracy is a commonly used metric that measures the percentage of correctly predicted outcomes. Precision is another important metric that measures the percentage of true positive predictions out of all positive predictions. Conversely, recall measures the percentage of true positive predictions out of all actual positives. The f1 score is the harmonic mean of precision and recall and is a useful metric when there is an imbalance between the classes. Cohen’s kappa is a metric that measures the agreement between two raters. The geometric mean is calculated by taking the square root of the product of the true positive and negative rates. Finally, the ROC score is a metric that measures the trade-off between the true positive rate and the false positive rate.
4.3. Performance Comparison of the Applied Machine Learning and Deep Learning Methods
Here, the comparative performance analysis of the applied machine learning and deep learning techniques based on different metrics is analyzed.
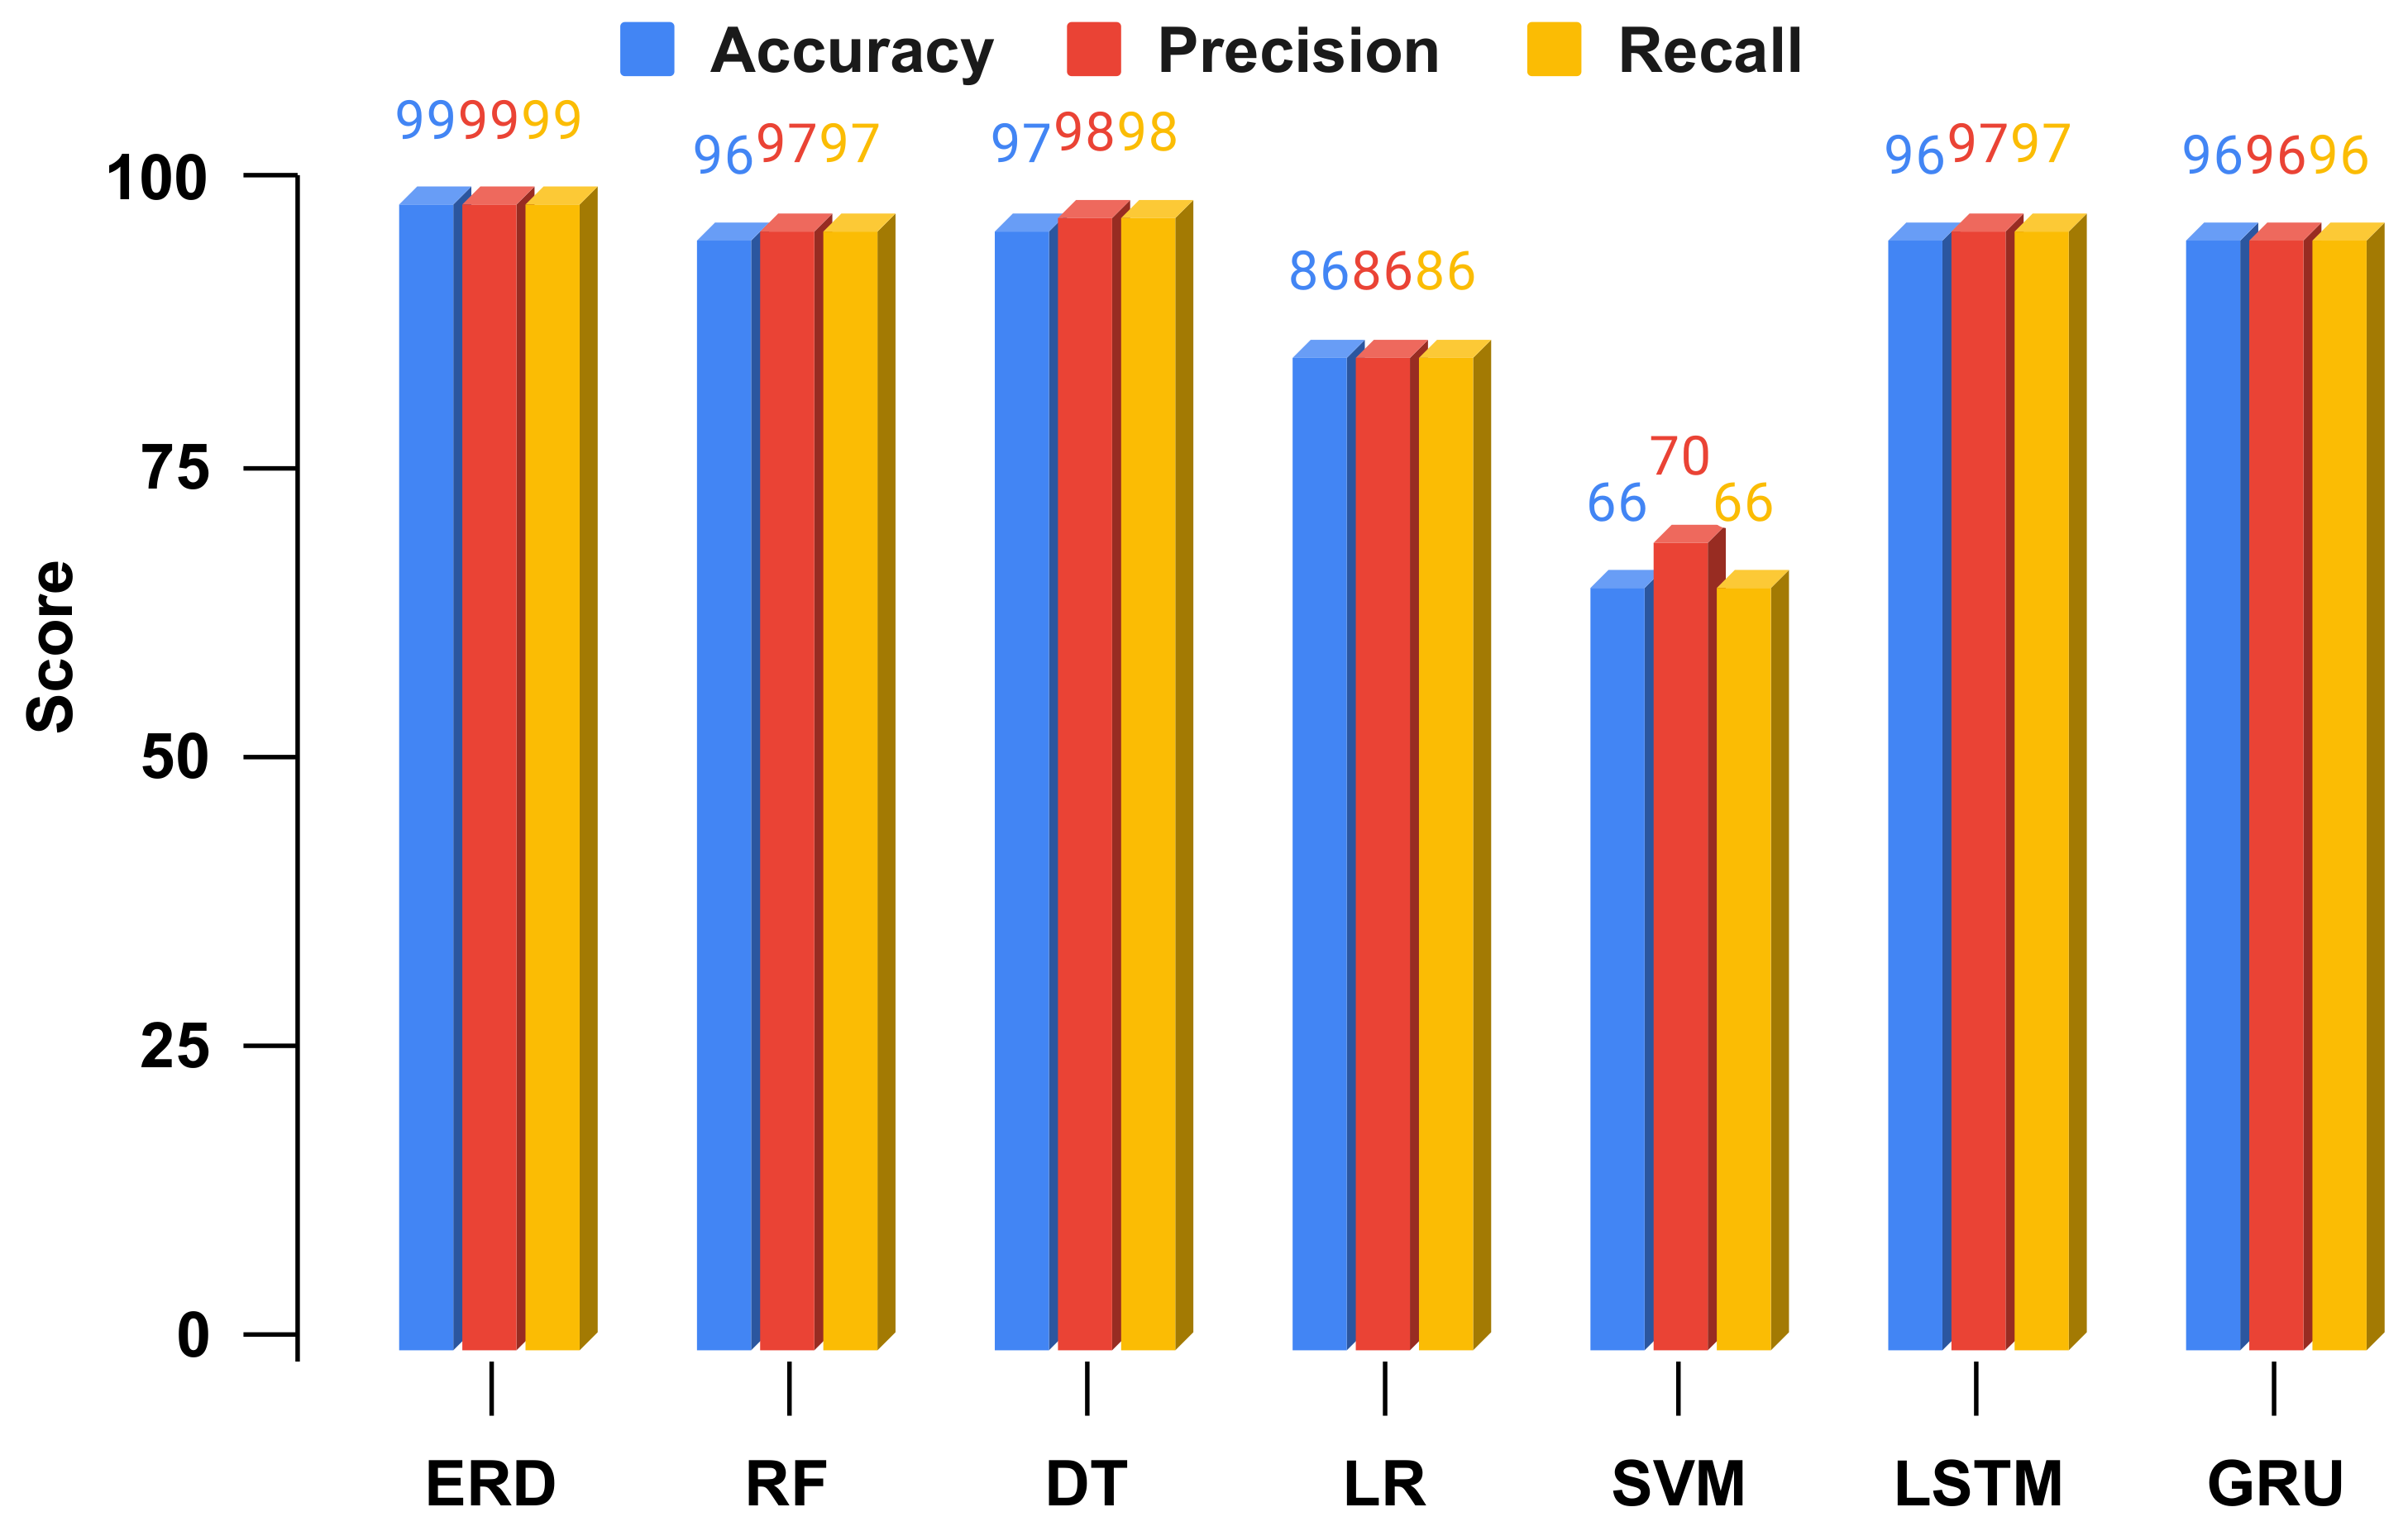
Table 6 contains the comparative performance metrics of the applied techniques on unseen test data. The analysis shows that the machine learning-based LR and SVM methods achieved comparatively poor performance. The LR and SVM techniques achieved 86% and 66% accuracy scores, respectively. The machine learning technique DT performed well. However, the DT method had a low Cohen’s kappa score. The deep learning-based techniques LSTM and GRU also achieved comparatively acceptable performance scores. The analysis demonstrates that the ensemble learning-based ERD technique outperformed the others, with high accuracy scores and low error rates. The proposed ERD achieved 99% accuracy, precision, and f1 scores for human motion detection as walking or running.
The bar chart-based performance analysis of the applied machine and deep learning techniques is visualized in
Figure 6. The analysis shows that the machine learning-based LR and SVM techniques achieved poor performance scores for all performance metrics. The DT, LSTM, and GRU techniques achieved fair results in comparison. Finally, the ensemble learning-based ERD method achieved the highest scores comparatively of all of the used performance metrics.
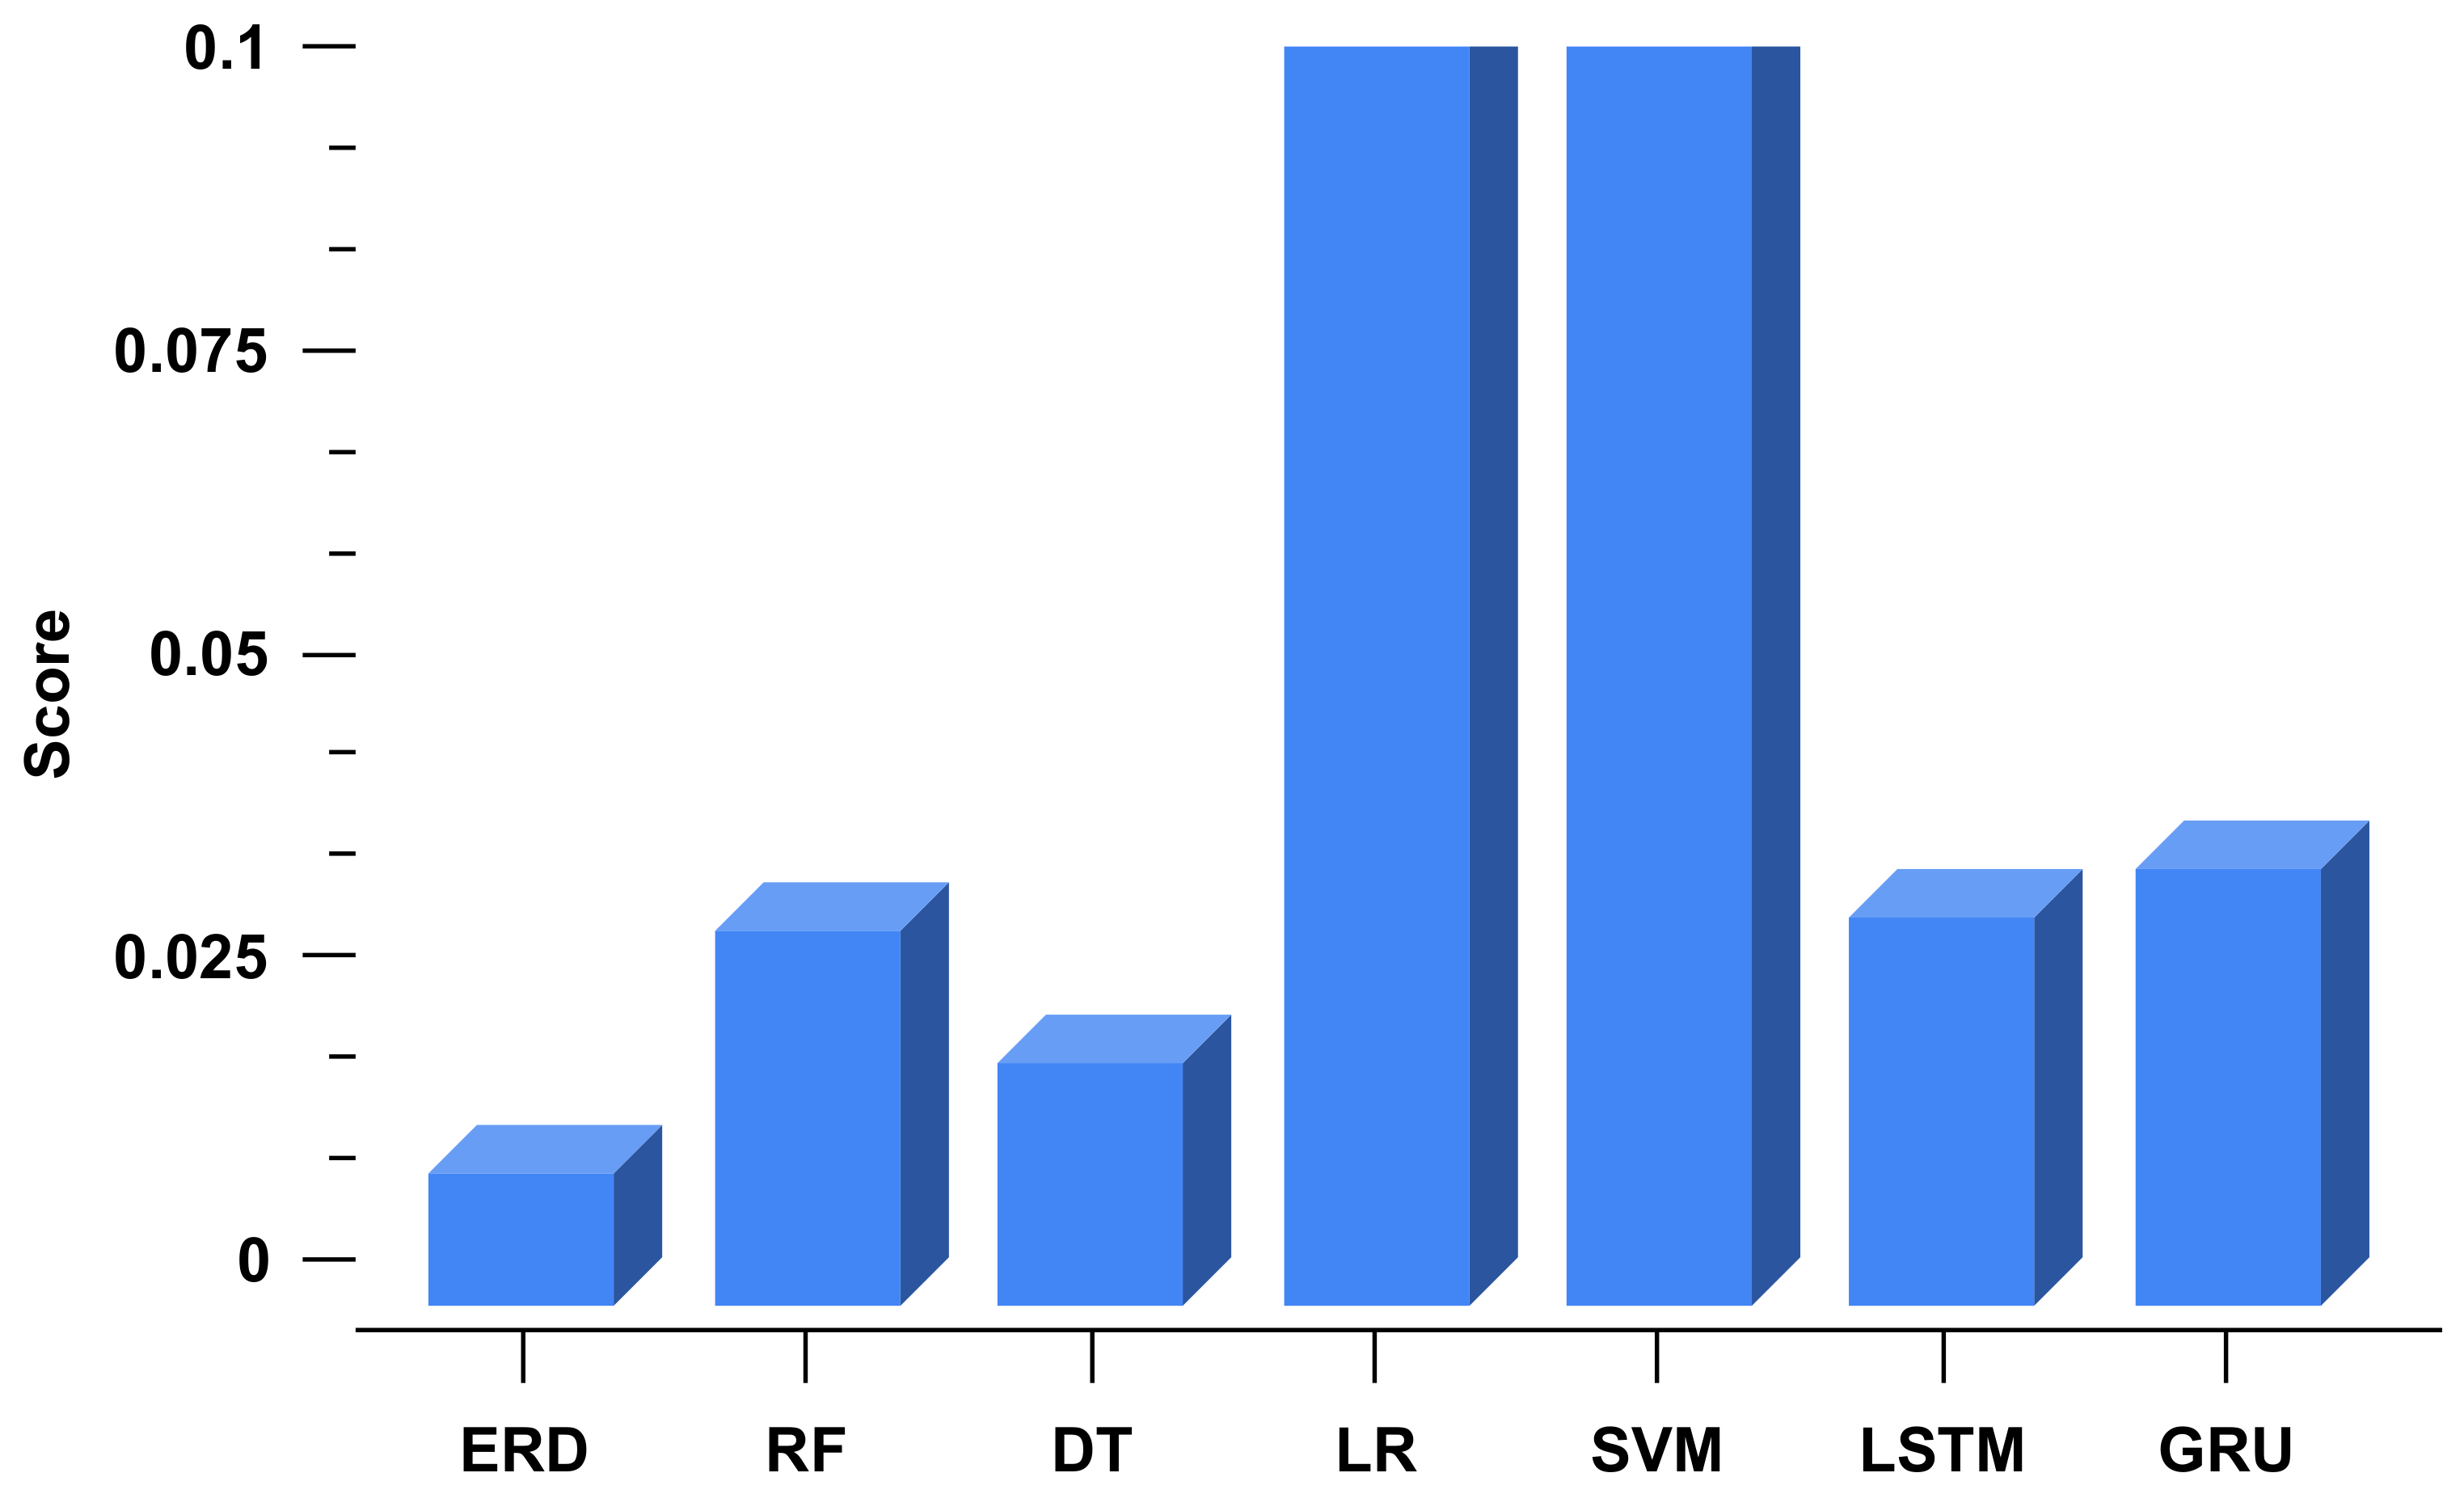
An error loss analysis of the applied machine and deep learning methods is presented in
Figure 7. The analysis demonstrates that the LR and SVM techniques achieved high error rates and low accuracy scores while testing unseen data. The DT technique achieved a moderate error rate, followed by the LSTM and GRU methods. The analysis shows that the proposed ERD model achieved a minimum error loss of 0.011 compared to other applied techniques. The proposed model achieved excellent performance for kinematic human motion detection.
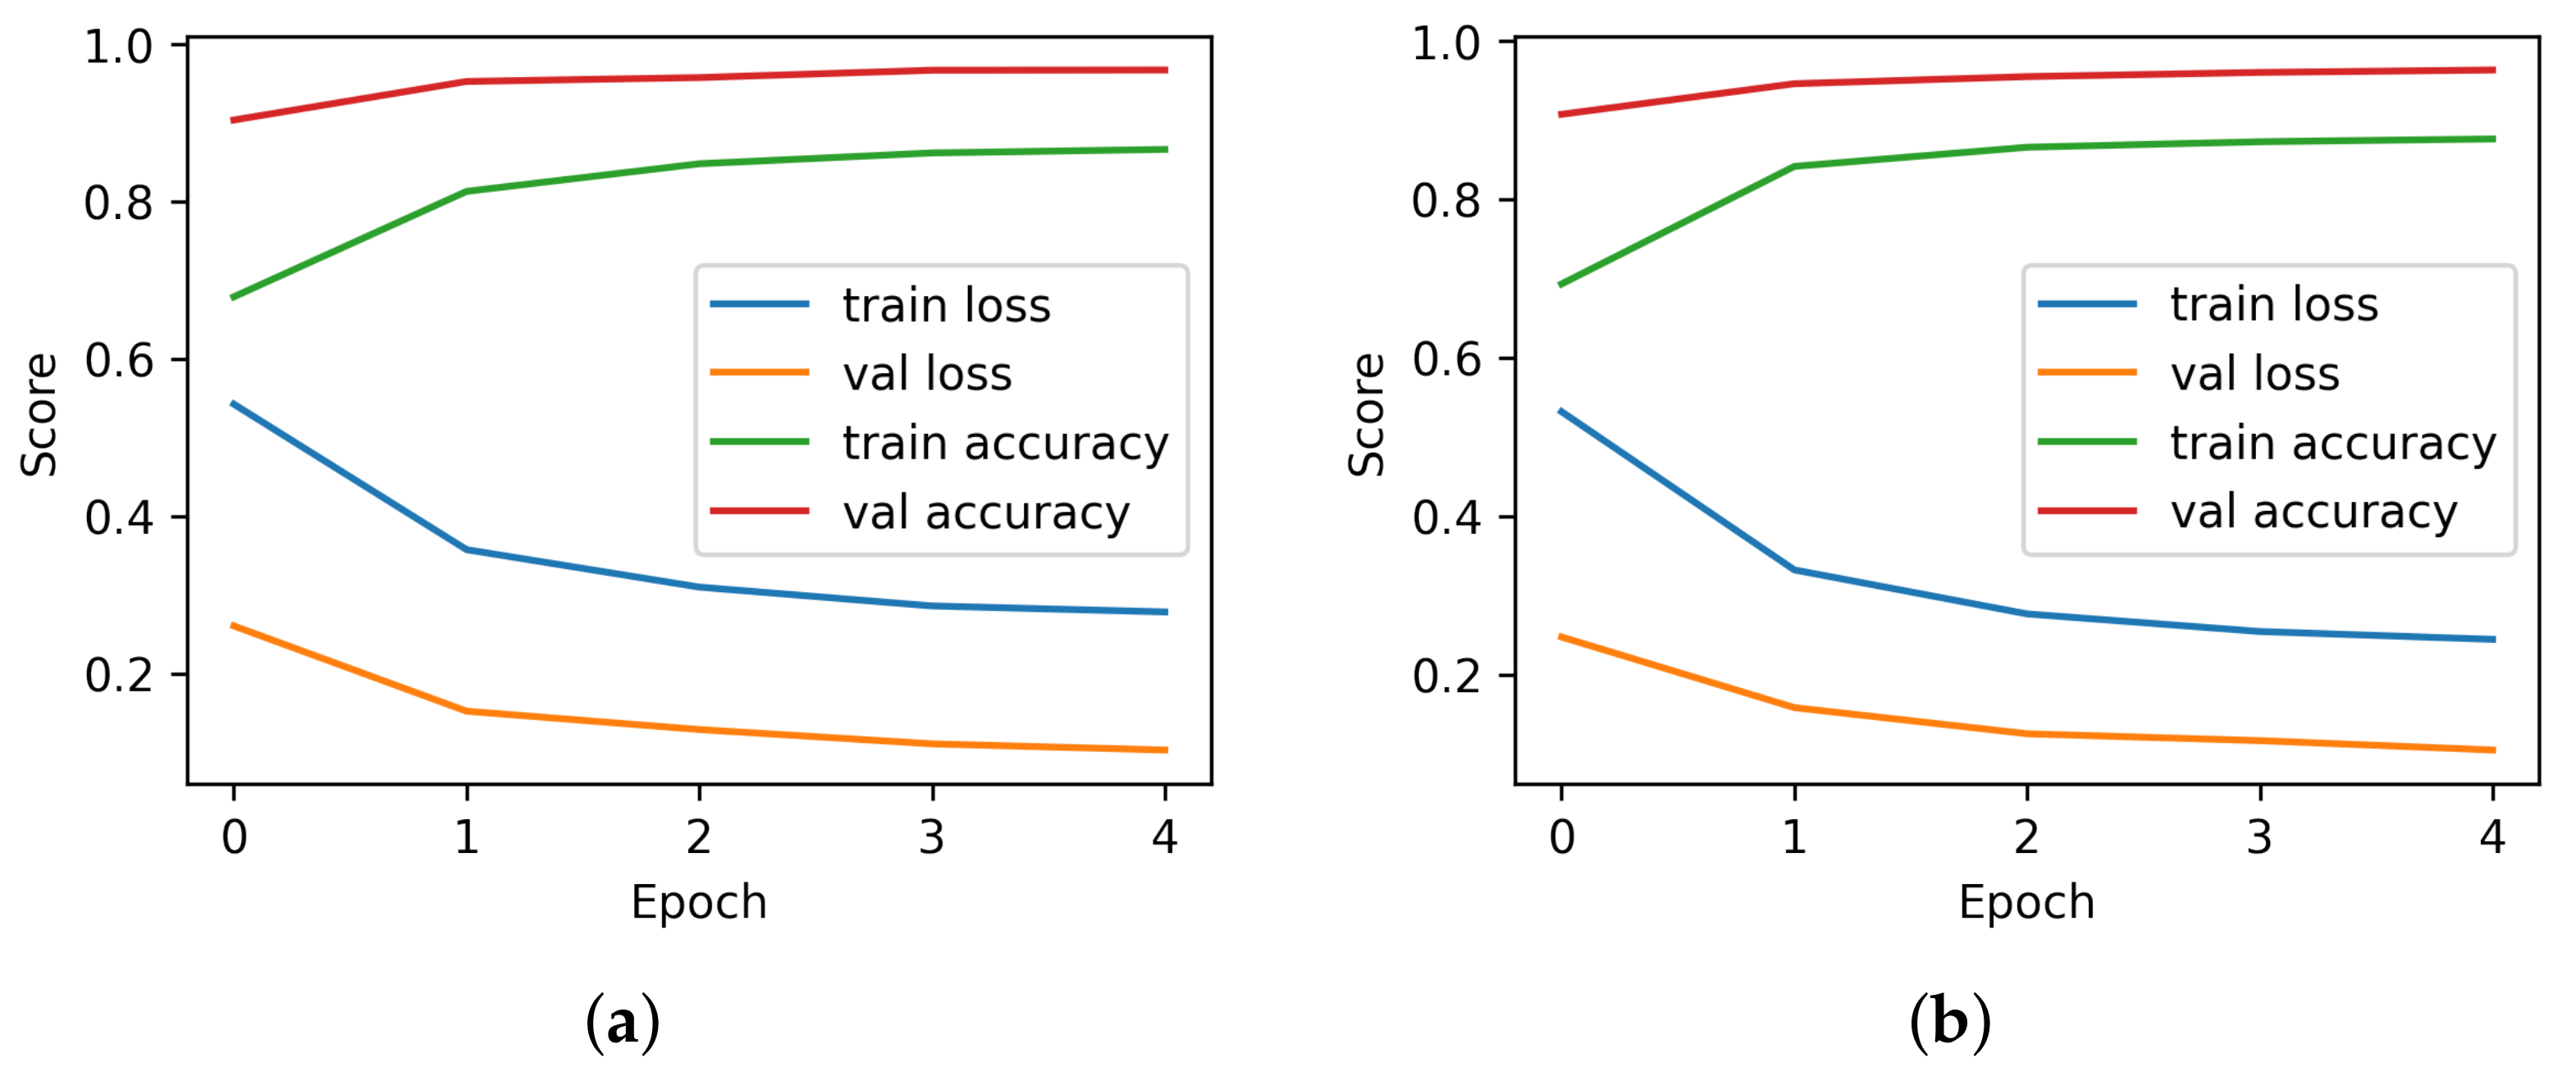
The time series-based performance analysis of the applied deep learning techniques during training is analyzed in
Figure 8. The LSTM model analysis shows that a high loss score was achieved during the first training epoch, resulting in low accuracy scores. After the first epoch, the loss decreased, and the accuracy score increased. During the first epoch of the GRU model, the loss and accuracy scores were low, the same as in the LSTM model. Both deep learning techniques achieved good performance scores after the first training epoch. This analysis demonstrates that as the epochs increased, the performance of both deep learning models increased.
4.4. k-Fold Cross Validation Analysis
We have validated the performance of the used machine and deep learning techniques based on 10-fold data. The k-fold cross-validation technique was applied to each learning model. The k-fold cross-validation results are analyzed in
Table 7. Cross-validation analysis shows that our proposed ERD method achieved a 99% k-fold cross-validation accuracy score. The proposed ERD technique’s standard deviation was minimal compared to other applied techniques. The machine learning-based LR and SVM methods achieved very poor k-fold cross-validation scores. The k-fold cross-validation analysis concludes that our proposed approach is in generalized form.
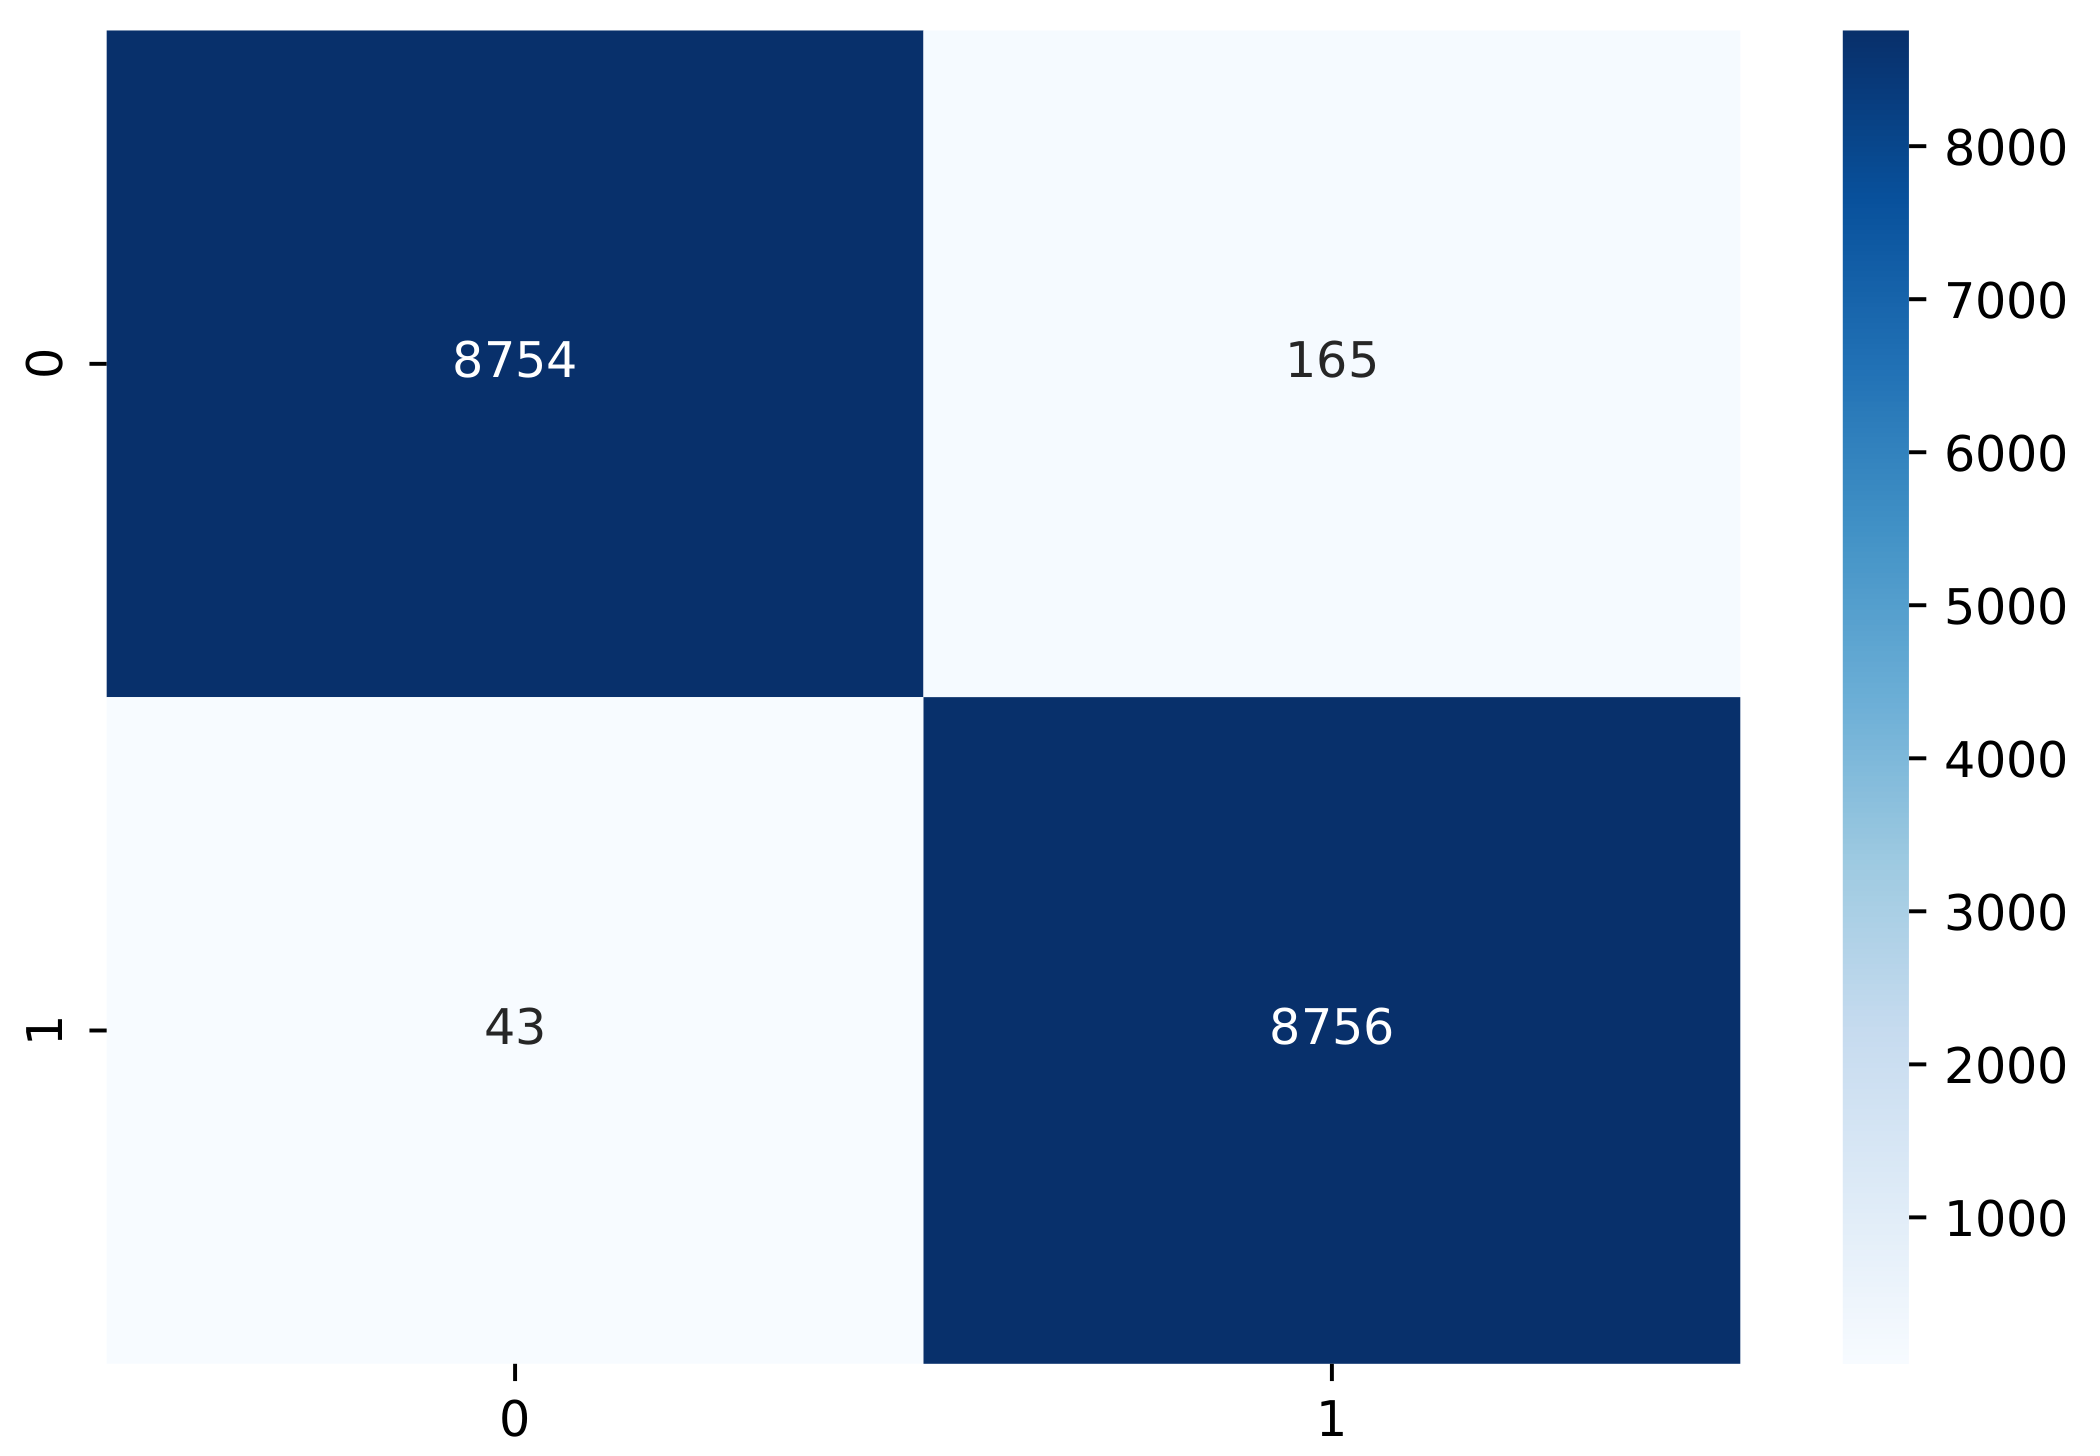
The confusion matrix exploration of the ERD technique proposed in this study for the determination of human motion as walking or running is visualized in
Figure 9. The confusion matrix summarizes the overall classification performance of a learning model. The analysis shows that our presented model achieved a high score for true positive and negative rates. The confusion matrix exploration validates our proposed motion-detection technique’s high performance scores.
4.5. Computational Complexity Analysis
The computational runtime complexity is analyzed in
Table 8. The analysis shows that the applied machine learning techniques have lower computational complexity scores and that the deep learning-based methods have the highest computational complexity scores. The analysis concludes that our proposed machine learning-based technique has less runtime computational complexity and has high accuracy-performance scores.
4.6. Performance Comparison with State-of-the-Art Studies
Our proposed approach is comparatively analyzed based on performance with the other state-of-the-art studies in
Table 9. We compared the state-of-the-art studies from 2020, 2021, and 2022. Deep learning and machine learning-based methods were applied in the comparison studies. We utilized other state-of-the-art techniques on our dataset and evaluated the results. The comparison analysis indicates that our proposed ensemble learning-based ERD technique outperformed the other state-of-the-art studies with a high accuracy score of 99%. The other state-of-the-art models also achieved good performance scores on our study dataset.
5. Conclusions and Future Work
The determination of human motion as walking or running using artificial intelligence-based methods is proposed in this research. Smartphone accelerometer and gyroscope sensor-based data were used for the building and evaluation of the applied methods. Six fully hyperparameter-tuned machine and deep learning methods were applied in comparison to one another. A cross-validation k-fold approach based on ten data folds was used to validate the applied methods. Our proposed ensemble method outperformed the other applied artificial intelligence-based techniques and other state-of-the-art studies. The proposed method performed highly when identifying human motion. We will use the transfer learning-based technique for human motion detection in the future. More advanced smartphone sensors will also be tested.
In conclusion, the proposed human kinematic motion detection methodology using smartphone sensor data and artificial intelligence is a promising approach for accurately detecting and classifying various human motions. The experiments’ results demonstrate the proposed method’s effectiveness compared to traditional methods.
The implementation of machine learning on a smartphone, smartwatch, or even embedded microprocessor has the potential to revolutionize how we interact with these devices. With the increasing availability of powerful processors and sensors on mobile devices, we can use machine learning directly for activity recognition. The machine learning model requires minimal resources and can run smoothly on embedded devices.
The proposed methodology could be further improved in future works by incorporating more advanced machine learning algorithms and data from additional sensors such as depth sensors or cameras. Additionally, the method could be tested on a larger and more diverse dataset in order to evaluate its performance in different scenarios.
Author Contributions
Conceptualization, A.R., M.R.A.N., E.S.H. and R.A.Z.; methodology, software, validation, formal analysis, investigation, resources, data curation, writing—original draft preparation, writing—review and editing, and visualization, A.R., A.Y.N. and L.A.; supervision, project administration, and funding acquisition, L.A. and A.Y.N. All authors have read and agreed to the published version of the manuscript.
Funding
This research received no external funding.
Institutional Review Board Statement
Not applicable.
Informed Consent Statement
Informed consent was obtained from all subjects involved in the study.
Data Availability Statement
The supporting data for the findings of this study are available from the corresponding author on reasonable request.
Acknowledgments
The authors would like to thank all participants for their fruitful cooperation and support.
Conflicts of Interest
The authors declare no conflict of interest.
References
- Li, W.; Chai, Y.; Khan, F.; Jan, S.R.U.; Verma, S.; Menon, V.G.; Li, X. A comprehensive survey on machine learning-based big data analytics for IoT-enabled smart healthcare system. Mob. Netw. Appl. 2021, 26, 234–252. [Google Scholar] [CrossRef]
- Liu, D.; Oczak, M.; Maschat, K.; Baumgartner, J.; Pletzer, B.; He, D.; Norton, T. A computer vision-based method for spatial-temporal action recognition of tail-biting behaviour in group-housed pigs. Biosyst. Eng. 2020, 195, 27–41. [Google Scholar] [CrossRef]
- Abualigah, L. Classification Applications with Deep Learning and Machine Learning Technologies; Springer Nature: Berlin, Germany, 2022; Volume 1071. [Google Scholar]
- Yadav, S.K.; Tiwari, K.; Pandey, H.M.; Akbar, S.A. A review of multimodal human activity recognition with special emphasis on classification, applications, challenges and future directions. Knowl.-Based Syst. 2021, 223, 106970. [Google Scholar] [CrossRef]
- Gandomi, A.H.; Abualigah, L. Evolutionary Process for Engineering Optimization; MDPI: Basel, Switzerland, 2022. [Google Scholar]
- Basak, H.; Kundu, R.; Singh, P.K.; Ijaz, M.F.; Woźniak, M.; Sarkar, R. A union of deep learning and swarm-based optimization for 3D human action recognition. Sci. Rep. 2022, 12, 5494. [Google Scholar] [CrossRef] [PubMed]
- Raza, A.; Munir, K.; Almutairi, M. A Novel Deep Learning Approach for Deepfake Image Detection. Appl. Sci. 2022, 12, 9820. [Google Scholar] [CrossRef]
- Mukhopadhyay, S.C.; Tyagi, S.K.S.; Suryadevara, N.K.; Piuri, V.; Scotti, F.; Zeadally, S. Artificial intelligence-based sensors for next generation IoT applications: A review. IEEE Sens. J. 2021, 21, 24920–24932. [Google Scholar] [CrossRef]
- Stalin, S.; Roy, V.; Shukla, P.K.; Zaguia, A.; Khan, M.M.; Shukla, P.K.; Jain, A. A machine learning-based big EEG data artifact detection and wavelet-based removal: An empirical approach. Math. Probl. Eng. 2021, 2021, 2942808. [Google Scholar] [CrossRef]
- Elgamal, Z.M.; Yasin, N.B.M.; Tubishat, M.; Alswaitti, M.; Mirjalili, S. An improved harris hawks optimization algorithm with simulated annealing for feature selection in the medical field. IEEE Access 2020, 8, 186638–186652. [Google Scholar] [CrossRef]
- Ferrari, A.; Micucci, D.; Mobilio, M.; Napoletano, P. On the personalization of classification models for human activity recognition. IEEE Access 2020, 8, 32066–32079. [Google Scholar] [CrossRef]
- Takano, W. Annotation generation from IMU-based human whole-body motions in daily life behavior. IEEE Trans. Hum.-Mach. Syst. 2020, 50, 13–21. [Google Scholar] [CrossRef]
- Chelli, A.; Pätzold, M. A machine learning approach for fall detection and daily living activity recognition. IEEE Access 2019, 7, 38670–38687. [Google Scholar] [CrossRef]
- Oguntala, G.A.; Abd-Alhameed, R.A.; Ali, N.T.; Hu, Y.F.; Noras, J.M.; Eya, N.N.; Elfergani, I.; Rodriguez, J. SmartWall: Novel RFID-enabled ambient human activity recognition using machine learning for unobtrusive health monitoring. IEEE Access 2019, 7, 68022–68033. [Google Scholar] [CrossRef]
- Thapa, K.; Abdullah Al, Z.M.; Lamichhane, B.; Yang, S.H. A deep machine learning method for concurrent and interleaved human activity recognition. Sensors 2020, 20, 5770. [Google Scholar] [CrossRef]
- Dua, N.; Singh, S.N.; Semwal, V.B. Multi-input CNN-GRU based human activity recognition using wearable sensors. Computing 2021, 103, 1461–1478. [Google Scholar] [CrossRef]
- Cruciani, F.; Vafeiadis, A.; Nugent, C.; Cleland, I.; McCullagh, P.; Votis, K.; Giakoumis, D.; Tzovaras, D.; Chen, L.; Hamzaoui, R. Feature learning for human activity recognition using convolutional neural networks. CCF Trans. Pervasive Comput. Interact. 2020, 2, 18–32. [Google Scholar] [CrossRef] [Green Version]
- Semwal, V.B.; Gaud, N.; Lalwani, P.; Bijalwan, V.; Alok, A.K. Pattern identification of different human joints for different human walking styles using inertial measurement unit (IMU) sensor. Artif. Intell. Rev. 2022, 55, 1149–1169. [Google Scholar] [CrossRef]
- Agarwal, P.; Alam, M. A lightweight deep learning model for human activity recognition on edge devices. Procedia Comput. Sci. 2020, 167, 2364–2373. [Google Scholar] [CrossRef]
- M YASSER, H. Kinematics Motion Data; Kaggle: San Francisco, CA, USA, 2022. [Google Scholar]
- Shamrat, F.J.M.; Tasnim, Z.; Ghosh, P.; Majumder, A.; Hasan, M.Z. Personalization of Job Circular Announcement to Applicants Using Decision Tree Classification Algorithm. In Proceedings of the 2020 IEEE International Conference for Innovation in Technology (INOCON), Bangalore, India, 6–8 November 2020; pp. 1–5. [Google Scholar]
- Zaman, M.; Hassan, A. Fuzzy heuristics and decision tree for classification of statistical feature-based control chart patterns. Symmetry 2021, 13, 110. [Google Scholar] [CrossRef]
- Liu, K.; Hu, X.; Zhou, H.; Tong, L.; Widanage, W.D.; Marco, J. Feature analyses and modeling of lithium-ion battery manufacturing based on random forest classification. IEEE/ASME Trans. Mechatron. 2021, 26, 2944–2955. [Google Scholar] [CrossRef]
- Neto, M.P.; Paulovich, F.V. Explainable matrix-visualization for global and local interpretability of random forest classification ensembles. IEEE Trans. Vis. Comput. Graph. 2020, 27, 1427–1437. [Google Scholar] [CrossRef]
- Guerrero, M.C.; Parada, J.S.; Espitia, H.E. EEG signal analysis using classification techniques: Logistic regression, artificial neural networks, support vector machines, and convolutional neural networks. Heliyon 2021, 7, e07258. [Google Scholar] [CrossRef] [PubMed]
- Dedeturk, B.K.; Akay, B. Spam filtering using a logistic regression model trained by an artificial bee colony algorithm. Appl. Soft Comput. 2020, 91, 106229. [Google Scholar] [CrossRef]
- Smahi, A.; Xia, Q.; Xia, H.; Sulemana, N.; Fateh, A.A.; Gao, J.; Du, X.; Guizani, M. A blockchainized privacy-preserving support vector machine classification on mobile crowd sensed data. Pervasive Mob. Comput. 2020, 66, 101195. [Google Scholar] [CrossRef]
- Raza, A.; Munir, K.; Almutairi, M.; Younas, F.; Fareed, M.M.S. Predicting Employee Attrition Using Machine Learning Approaches. Appl. Sci. 2022, 12, 6424. [Google Scholar] [CrossRef]
- Raza, A.; Siddiqui, H.U.R.; Munir, K.; Almutairi, M.; Rustam, F.; Ashraf, I. Ensemble learning-based feature engineering to analyze maternal health during pregnancy and health risk prediction. PLoS ONE 2022, 17, e0276525. [Google Scholar] [CrossRef] [PubMed]
- Chen, H.; Li, X.; Wu, Y.; Zuo, L.; Lu, M.; Zhou, Y. Compressive strength prediction of high-strength concrete using long short-term memory and machine learning algorithms. Buildings 2022, 12, 302. [Google Scholar] [CrossRef]
- Farah, S.; Humaira, N.; Aneela, Z.; Steffen, E. Short-term multi-hour ahead country-wide wind power prediction for Germany using gated recurrent unit deep learning. Renew. Sustain. Energy Rev. 2022, 167, 112700. [Google Scholar] [CrossRef]
- Dutta, A.; Kumar, S.; Basu, M. A gated recurrent unit approach to bitcoin price prediction. J. Risk Financ. Manag. 2020, 13, 23. [Google Scholar] [CrossRef] [Green Version]
- Passos, D.; Mishra, P. A tutorial on automatic hyperparameter tuning of deep spectral modelling for regression and classification tasks. Chemom. Intell. Lab. Syst. 2022, 223, 104520. [Google Scholar] [CrossRef]
- Jethanandani, M.; Sharma, A.; Perumal, T.; Chang, J.R. Multi-label classification based ensemble learning for human activity recognition in smart home. Internet Things 2020, 12, 100324. [Google Scholar] [CrossRef]
- Christodoulou, E.; Gregoriades, A.; Pampaka, M.; Herodotou, H. Combination of Topic Modelling and Decision Tree Classification for tourist Destination Marketing. In Proceedings of the International Conference on Advanced Information Systems Engineering; Springer: Berlin, Germany, 2020; pp. 95–108. [Google Scholar]
- Hajjej, F.; Alohali, M.A.; Badr, M.; Rahman, M.A. A comparison of decision tree algorithms in the assessment of biomedical data. BioMed Res. Int. 2022, 2022, 9449497. [Google Scholar] [CrossRef] [PubMed]
- Yuvaraj, N.; Chang, V.; Gobinathan, B.; Pinagapani, A.; Kannan, S.; Dhiman, G.; Rajan, A.R. Automatic detection of cyberbullying using multi-feature based artificial intelligence with deep decision tree classification. Comput. Electr. Eng. 2021, 92, 107186. [Google Scholar] [CrossRef]
- Liang, J.; Qin, Z.; Xue, L.; Lin, X.; Shen, X. Efficient and privacy-preserving decision tree classification for health monitoring systems. IEEE Internet Things J. 2021, 8, 12528–12539. [Google Scholar] [CrossRef]
- Csizmadia, G.; Liszkai-Peres, K.; Ferdinandy, B.; Miklósi, Á.; Konok, V. Human activity recognition of children with wearable devices using LightGBM machine learning. Sci. Rep. 2022, 12, 5472. [Google Scholar] [CrossRef]
- Hayat, A.; Morgado-Dias, F.; Bhuyan, B.P.; Tomar, R. Human Activity Recognition for Elderly People Using Machine and Deep Learning Approaches. Information 2022, 13, 275. [Google Scholar] [CrossRef]
- Kim, D.H.; Farhad, A.; Pyun, J.Y. UWB Positioning System Based on LSTM Classification with Mitigated NLOS Effects. IEEE Internet Things J. 2022, 10, 1822–1835. [Google Scholar] [CrossRef]
- El-Melegy, M.T.; Kamal, A.T. Linear Regression Classification in the Quaternion and Reduced Biquaternion Domains. IEEE Signal Process. Lett. 2022, 29, 469–473. [Google Scholar] [CrossRef]
- Chen, Y.; Huang, M.; Tao, Y. Density-based clustering multiple linear regression model of energy consumption for electric vehicles. Sustain. Energy Technol. Assess. 2022, 53, 102614. [Google Scholar] [CrossRef]
Figure 1.
Methodological analysis of the proposed research study in the context of detection in human motion kinematics.
Figure 1.
Methodological analysis of the proposed research study in the context of detection in human motion kinematics.
Figure 2.
Bar chart-based dataset balancing analysis using the target labels.
Figure 2.
Bar chart-based dataset balancing analysis using the target labels.
Figure 3.
The dataset features correlation analysis.
Figure 3.
The dataset features correlation analysis.
Figure 4.
Three-dimensional-space analysis of smartphone sensor data. (a) Analysis of the accelerometer sensor data. (b) Gyroscope sensor data analysis.
Figure 4.
Three-dimensional-space analysis of smartphone sensor data. (a) Analysis of the accelerometer sensor data. (b) Gyroscope sensor data analysis.
Figure 5.
The architectural diagram analysis of our proposed ensemble method.
Figure 5.
The architectural diagram analysis of our proposed ensemble method.
Figure 6.
The comparative performance analysis is based on the bar chart of the machine and deep learning models.
Figure 6.
The comparative performance analysis is based on the bar chart of the machine and deep learning models.
Figure 7.
Error rate analysis of the applied machine learning and deep learning models.
Figure 7.
Error rate analysis of the applied machine learning and deep learning models.
Figure 8.
The time series-based performance analysis during training of deep learning-based models. (a) The performance analysis of the LSTM model. (b) The performance analysis of the GRU model.
Figure 8.
The time series-based performance analysis during training of deep learning-based models. (a) The performance analysis of the LSTM model. (b) The performance analysis of the GRU model.
Figure 9.
Confusion matrix analysis of the proposed model for human motion detection.
Figure 9.
Confusion matrix analysis of the proposed model for human motion detection.
Table 1.
Comparative analysis and related literature summary for human motion detection.
Table 1.
Comparative analysis and related literature summary for human motion detection.
| Ref. | Year | Approach | Dataset | Accuracy Score (%) | Research Aim |
|---|
| [9] | 2021 | SVM Classifier | Single-channel EEG signal data | 98 | The EEG signal-based motion artifact recognition using machine learning techniques was proposed. |
| [11] | 2020 | AdaBoost-CNN | Smartphones Accelerometer signals of Activities of Daily Living and Falls | 90 | The recognition of human daily life activities using machine learning and deep learning was proposed. |
| [14] | 2019 | Novel RFID-Enabled Ambient | SmartWall data | 97 | The human activity recognition for unobtrusive health monitoring using machine learning techniques was presented. |
| [15] | 2020 | Hybrid BiLSTM and SCCRF | Kasteren House- B and Kyoto 3 | 93 | Interleaved and concurrent human activity recognition using deep learning techniques were proposed. |
| [16] | 2021 | CNN-GRU | WISDM, UCI-HAR, and PAMAP2 | 97 | Human activity recognition using wearable sensors based on deep learning techniques was proposed. |
| [17] | 2020 | CNN | IMU and UCI-HAR | 91 | The feature learning technique was presented based on deep learning for human activity recognition. |
| [19] | 2020 | RNN-LSTM | WISDM dataset | 95 | The human activity recognition on edge devices using deep learning techniques was proposed. |
| Proposed | 2023 | ERD | Accelerometer and gyroscope sensors Data | 99 | Our research aims to detect human kinematics motion as walking or running with the high-performance tool. |
Table 2.
Descriptive analysis of the dataset features used for experiments.
Table 2.
Descriptive analysis of the dataset features used for experiments.
| Feature | Non-Null Count | Data Type | Description |
|---|
| wrist | 88,587 | int64 | The wrist feature represents a value where the smartphone device was placed. Zero indicates the left wrist, and one indicates the right wrist. |
| activity | 88,587 | int64 | The activity feature, used as the target feature, contains a label indicating walking or running. Zero represents walking, and one represents running. |
| acceleration_x | 88,587 | float64 | The accelerometer sensor’s x-axis values. |
| acceleration_y | 88,587 | float64 | The accelerometer sensor’s y-axis values. |
| acceleration_z | 88587 | float64 | The accelerometer sensor’s z-axis values. |
| gyro_x | 88,587 | float64 | The gyroscope sensor’s x-axis values. |
| gyro_y | 88,587 | float64 | The gyroscope sensor’s y-axis values. |
| gyro_z | 88,587 | float64 | The gyroscope sensor’s z-axis values. |
Table 3.
Analysis of the architecture of the applied LSTM model.
Table 3.
Analysis of the architecture of the applied LSTM model.
| Model Layers | Output Shape | Parameters |
|---|
| LSTM Layer | (None, 32) | 4352 |
| Dropout Layer | (None, 32) | 0 |
| Dense Layer | (None, 1) | 33 |
Table 4.
Analysis of the architecture of the applied GRU model.
Table 4.
Analysis of the architecture of the applied GRU model.
| Model Layers | Output Shape | Parameters |
|---|
| GRU Layer | (None, 32) | 3360 |
| Dropout Layer | (None, 32) | 0 |
| Dense Layer | (None, 1) | 33 |
Table 5.
Analysis of the hyperparameter tuning of the applied machine learning and deep learning methods.
Table 5.
Analysis of the hyperparameter tuning of the applied machine learning and deep learning methods.
| Technique | Hyperparameters | Description |
|---|
| RF | n_estimators = 300 | The total number of trees. |
| max_depth = 300 | Depth level of tree nodes |
| criterion = ‘gini’ | Features splitting method in the tree. |
| DT | max_depth = 300 | Depth level of tree nodes |
| criterion = ‘gini’ | Features splitting method in a tree. |
| LR | solver = ‘lbfgs’ | The algorithm used in the optimization problem. |
| max_iter = 50 | The number of iterations. |
| multi_class = ‘auto’ | Target label classification. |
| C = 1.0 | The inverse of regularization strength |
| SVM | max_iter = 100 | The number of iterations. |
| kernel = ‘rbf’ | kernel type to be used in the model. |
| degree = 3 | Degree of the polynomial kernel function. |
| LSTM | loss = ‘binary_crossentropy’ | Loss function. |
| optimizer = ‘adam’ | Loss optimizer function. |
| activation = ‘sigmoid’ | Ouput layer actitvation. |
| GRU | loss = ‘binary_crossentropy’ | Loss function. |
| optimizer = ‘adam’ | Loss optimizer function. |
| activation = ‘sigmoid’ | Ouput layer actitvation. |
Table 6.
Comparative performance analysis of the applied machine learning and deep learning techniques on unseen test data.
Table 6.
Comparative performance analysis of the applied machine learning and deep learning techniques on unseen test data.
| Techniques | Accuracy Score (%) | Error Rate | Precision Score (%) | Recall Score (%) | F1 Score (%) | Cohen’s Kappa Score (%) | Geometric Mean Score (%) | ROC Score (%) |
|---|
| ML | ERD | 99 | 0.011 | 99 | 99 | 99 | 97 | 98 | 98 |
| RF | 96 | 0.031 | 97 | 97 | 97 | 93 | 96 | 96 |
| DT | 97 | 0.020 | 98 | 98 | 98 | 95 | 97 | 97 |
| LR | 86 | 0.139 | 86 | 86 | 86 | 72 | 86 | 86 |
| SVM | 66 | 0.343 | 70 | 66 | 64 | 31 | 65 | 65 |
| DL | LSTM | 96 | 0.032 | 97 | 97 | 97 | 93 | 97 | 96 |
| GRU | 96 | 0.036 | 96 | 96 | 96 | 92 | 96 | 96 |
Table 7.
k-fold cross validation analysis of the applied machine and deep learning models.
Table 7.
k-fold cross validation analysis of the applied machine and deep learning models.
| Techniques | k-Fold | Accuracy Score (%) | Standard Deviation (±) |
|---|
| ML | ERD | 10 | 99 | 0.0011 |
| RF | 10 | 98 | 0.0010 |
| DT | 10 | 98 | 0.0015 |
| LR | 10 | 86 | 0.0021 |
| SVM | 10 | 60 | 0.0439 |
| DL | LSTM | 10 | 97 | 0.0081 |
| GRU | 10 | 97 | 0.0081 |
Table 8.
The computational complexity analysis of the applied models.
Table 8.
The computational complexity analysis of the applied models.
| Technique | Runtime Computations (s) |
|---|
| RF | 0.52 |
| LR | 0.24 |
| SVM | 1.41 |
| LSTM | 83.7 |
| GRU | 40.8 |
| Proposed ERD | 37.3 |
Table 9.
Comparative analysis of the proposed ERD approach with the other state-of-art studies.
Table 9.
Comparative analysis of the proposed ERD approach with the other state-of-art studies.
| Ref. | Year | Learning Type | Technique | Accuracy Score (%) |
|---|
| [34,35,36] | 2020 | Machine learning | DT | 97 |
| [37,38] | 2021 | Machine learning | DT | 97 |
| [39] | 2022 | Machine learning | LGBM | 97 |
| [40,41] | 2022 | Deep learning | LSTM | 96 |
| [42,43] | 2022 | Machine learning | LR | 86 |
| Proposed | 2023 | Ensemble Learning | ERD | 99 |
| Disclaimer/Publisher’s Note: The statements, opinions and data contained in all publications are solely those of the individual author(s) and contributor(s) and not of MDPI and/or the editor(s). MDPI and/or the editor(s) disclaim responsibility for any injury to people or property resulting from any ideas, methods, instructions or products referred to in the content. |
© 2023 by the authors. Licensee MDPI, Basel, Switzerland. This article is an open access article distributed under the terms and conditions of the Creative Commons Attribution (CC BY) license (https://creativecommons.org/licenses/by/4.0/).


 ,
, 


