Article

Reliable IoT-Based Monitoring and Control of Hydroponic Systems

by
Konstantinos Tatas
1,
Ahmad Al-Zoubi
2,
Nicholas Christofides
1,
Chrysostomos Zannettis
3,
Michael Chrysostomou
1,
Stavros Panteli
4 and
Anthony Antoniou
4,*
1
Frederick Research Center, Frederick University, Nicosia 1036, Cyprus
2
Institute of Embedded Systems, Hamburg University of Technology (TUHH), Am Schwarzenberg-Campus 3 (E), 21073 Hamburg, Germany
3
Department of Electrical and Computer Engineering and Informatics, Frederick University, Nicosia 1036, Cyprus
4
Adaptive Hydroponics Limited, Larnaca 6010, Cyprus
*
Author to whom correspondence should be addressed.
Technologies 2022, 10(1), 26; https://doi.org/10.3390/technologies10010026
Submission received: 29 December 2021 / Revised: 27 January 2022 / Accepted: 28 January 2022 / Published: 2 February 2022
(This article belongs to the Special Issue MOCAST 2021)

Abstract

:
This paper presents the design and implementation of iPONICS: an intelligent, low-cost IoT-based control and monitoring system for hydroponics greenhouses. The system is based on three types of sensor nodes. The main (master) node is responsible for controlling the pump, monitoring the quality of the water in the greenhouse and aggregating and transmitting the data from the slave nodes. Environment sensing slave nodes monitor the ambient conditions in the greenhouse and transmit the data to the main node. Security nodes monitor activity (movement in the area). The system monitors water quality and greenhouse temperature and humidity, ensuring that crops grow under optimal conditions according to hydroponics guidelines. Remote monitoring for the greenhouse keepers is facilitated by monitoring these parameters via connecting to a website. An innovative fuzzy inference engine determines the plant irrigation duration. The system is optimized for low power consumption in order to facilitate off-grid operation. Preliminary reliability analysis indicates that the system can tolerate various transient faults without requiring intervention.

1. Introduction

Water shortage and pollution are environmental threats affecting large parts of the EU, as well as the rest of the world. Climate change is expected to further increase the water shortage and threaten food production. This problem cannot be solved by a single effort but must be addressed on many levels. Food security is dependent on several environmental conditions, such as water quality and availability, soil condition and energy availability. Due to the extensive and exhausting practice of agriculture during the last decades, several environmental issues have arisen. Climate change is expected to affect water quality and quantity that are already in decline [1,2].
Smart farming is a capital-intensive and hi-tech system based on the application of modern information and communication technologies (ICTs) in agriculture. In IoT-based smart farming, a system is built for monitoring the crop field with the help of sensors and automating the irrigation system. Solutions for measuring environmental conditions and water quality based on electronic sensors and microcontrollers include ATLAS Scientific [3] and Libelium Waspmote [4]. Several research papers demonstrate such solutions, as shown in the surveys of [5,6]. Leveraging other important ICTs that have been successfully employed in other similar environments, such as big data [7], blockchain [8] and neural networks [9] is important for achieving precise and efficient agriculture [10].
Regarding IoT applications in agriculture, approaches range from open field cultivation [11,12] to greenhouses [13,14]. Typical parameters are temperature and humidity [11,12], but other conditions, such as light [13], are often monitored, as well as crop-specific parameters [11]. Greenhouse monitoring and control IoT systems are presented in [14,15]. In [13,16], the authors monitored parameters such as soil moisture, temperature, humidity and light in order to automate the irrigation system.
The above solutions are geared toward general greenhouse architectures or use generic parameters, such as temperature and humidity only. Hydroponic growth has additional monitoring requirements since the hydroponic irrigation system is different than the one used in soil cultivation. The complexity of hydroponic growth requires precise control, as well as monitoring parameters, such as pH and electrical conductivity, through specialized sensors and has only been automated in the case of large greenhouses with high cost, which is prohibitive to small-scale farmers. The iPONICS system attempts to leverage some of the technologies discussed above to provide a scaled-down, low-cost, yet innovative hydroponic solution that can be adopted by even hobby-type hydroponic systems. Specifically, we present the design and implementation of a novel, low-cost hydroponics monitoring and control system based on IoT technologies. In particular, the system is composed of a specialized wireless sensor network for monitoring the essential parameters for hydroponics and control for the irrigation process. It provides the user with a user-friendly web-based tool to monitor their crops, as well as being appraised by appropriate alarms and warnings. This greatly facilitates the observation of multiple hydroponics greenhouses with minimal effort and need for intervention. Unlike the systems discussed above, the proposed system targets hydroponic cultivation specifically.
Furthermore, we describe the design and implementation of a fuzzy inference engine (FIE) system for determining the system irrigation duration. A fuzzy set is defined by a membership function that can be any real number in the interval [0, 1], expressing the grade of membership for which an element belongs to that fuzzy set. The concept of fuzzy sets enables the use of fuzzy inference, which, in turn, uses the knowledge of an expert in a field of application to construct a set of “IF–THEN” rules. Fuzzy logic becomes especially useful in capturing a human expert’s or operator’s qualitative control experience into the control algorithm using linguistic rules. Fuzzy logic control (FLC) has been applied successfully for controlling numerous systems in which analytical models are not easily obtainable or the model itself, if available, is too complex and possibly highly non-linear in several applications ranging from network routing [17] to task mapping and scheduling [18,19].
The rest of the paper is organized as follows: Section 2 describes the background and Section 3 describes the proposed system in detail. The paper concludes with Section 4, which summarizes the results and discusses future work.

2. Background and System Requirements

Hydroponics [20] relies on fertilized and aerated water, which provides both nutrition and oxygen to a plant’s root zone. It often involves sophisticated mechanization processes, which can be daunting to casual hobbyists, as well as small-scale commercial farms. Nutrient solutions must usually be below the temperature at which pathogen growth can begin, yet not so cool that root activity is suppressed. In hydroponics, as in conventional agriculture, nutrients should be adjusted to satisfy Liebig’s law of the minimum for each specific plant variety [21].
As it can be seen from Table 1, certain crops are tolerant to a wide range of conductivity and pH values, such as spinach, asparagus and tomato, while others, such as strawberry, are very sensitive, especially to pH changes. This requires close monitoring of the above variables to adjust the nutrients.
Especially in low-cost hydroponics systems, the monitoring is done manually using specialized pH/EC meters, which is time consuming and requires constant proximity to the greenhouse. The iPONICS system facilitates remote monitoring of the values at low cost. Since it takes time for the plants to absorb the nutrients, a low sampling rate (as low as once per day) is sufficient for the water quality parameters, such as electrical conductivity and pH. In practice, we use a higher sampling rate to compensate for sensor and communication errors, as discussed in Section 4. Ambient temperature and humidity in the greenhouse are also monitored to ensure optimal growth.
Furthermore, since the purpose of the system is to achieve remote monitoring, additional monitoring requirements besides water quality arise. Specifically, the ability to generate alarms in cases of unexpected and possibly catastrophic conditions must be considered. To that purpose, we need frequent monitoring of ambient temperature to generate an alarm in the case of a fire in the greenhouse. For that reason, the ambient temperature is read every 8 seconds, but as long as it is normal, it is only recorded hourly. Finally, since the greenhouse containing the equipment can be situated at a remote location, we have need of some rudimentary security. While security is not essential to crop growth per se, we need to be at least notified of, if not prevent, unauthorized entry. The most important iPONICS system requirements are summarized in Table 2.

3. iPONICS System Design

Given the requirement of monitoring the temperature and humidity inside the greenhouse and the great variation in area between various types of greenhouses, the environment sensing system must be distributed across various nodes, the number of which will depend on the specific greenhouse dimensions. On the other hand, for monitoring the water quality and controlling the pump, one central node is sufficient. The iPONICS system concept is shown in Figure 1.
The iPONICS sensing and control system is a wireless sensor network with a star topology, as shown in Figure 2.
The system is composed of three types of nodes: the sensing and control unit (SCU), the environment sensing unit (ESN) and the greenhouse security unit (GSN). The greenhouse unit (GHU) is a greenhouse containing one SCU, which is the master node and several ESN and GSN “slave nodes”, the number of which depends on the dimensions of the greenhouse.

3.1. Sense and Control Unit (SCU)

The SCU is the main (master) node, as well as the central node in the star topology of the WSN. It is responsible for measuring the circulating water quality through four sensors, namely, temperature, pH, water electrical conductivity (EC) and dissolved oxygen (DO). Furthermore, it is responsible for controlling the pump in an efficient manner by conserving energy while maintaining the required water flow for crops growth and requesting and receiving data from the slave nodes.
The sensors used were from Atlas Scientific [22,23,24,25]. The reasons for selecting these particular sensors were the following: First, they require infrequent recalibration, which is convenient while being deployed in a greenhouse during plant growth, which requires weeks to months. Second, they are easily integrated into an Arduino-based microcontroller system, reducing the development time and time-to-market. Third, they are long lasting at a reasonable cost, which are essential attributes in order to keep the overall cost of the system an attractive investment for farmers.
The SCU processing unit used was an Arduino Mega 2560, providing the required processing power, program memory and number of pins to support the following connections: the Xbee shield, the RTC shield, the Atlas Scientific EZO circuits, the GSM shield, the voltage sensor and, finally, the relay module to control the ON/OFF switching of the water pumps. All the shields and modules were supplied by the power drawn out of the Arduino by the 5v and GND pins. Figure 3 depicts the schematic of the SCU, while Figure 4 illustrates its operation using a flowchart.
As shown in Figure 4, the SCU starts by initializing the serial and I2C communications and verifying that all modules are connected. In order to preserve energy, the microcontroller is put to sleep, along with the GSM shield since it is the highest power-consuming module. The microcontroller awakes in the following cases:
  • An “Alarm_Interrupt” that signals abnormal and possibly hazardous temperature/humidity readings in which the SCU activates the GSM to send an alarm SMS/email and upload these readings to the server. In this case, the system demands operator intervention and does not return to sleep or activate the pump.
  • A “Security_Interrupt” that signals unauthorized access to the site in which the SCU activates the GSM to send a security SMS/email and upload the captured images to the server before returning to sleep.
  • The SCU reaches the sampling time of water quality sensors in which it collects those readings temporally in the EEPROM. Afterwards, it activates the GSM shield and proceeds uploading the water quality readings, and then wakes up one ESN at a time and uploads its readings to the server. It returns to sleep afterward.
  • The SCU wakes up at fixed intervals for the pump control in which the state of the battery, along with the latest water quality readings, dictate the powering decision before returning to sleep.
Since the entire system is meant to be off-grid, it is crucial to minimize the power consumption of the units connected to the solar-charged battery whenever possible to guarantee uptime. The use of the sleep mode and intelligent control of the water pumps ensures moderate usage of the power resources. We measured the current drawn by the SCU under the operating conditions listed in Table 3 using both a multimeter and a current clamp. As it can be seen in Table 3, the SCU consumed around 1.25 W while sleeping, where the GSM was off and the microcontroller was in deep sleep mode. Other connected modules were still powered including the Xbee shield, as interrupts are asynchronous. In the idle state, the Arduino was awake to regularly do the water quality readings or control the water pump, where it consumed about 1.35 W. The power consumption almost doubled when the GSM shield was activated for transmission, where it consumed about 2.75 W. This could rise to 11.5 W given that the transmission is occurring under extreme weather conditions or a weak network connection, which caused the GSM to draw higher currents. On the positive side, without interruption, the GSM stayed off until the upload time, which happened a few times a day. 
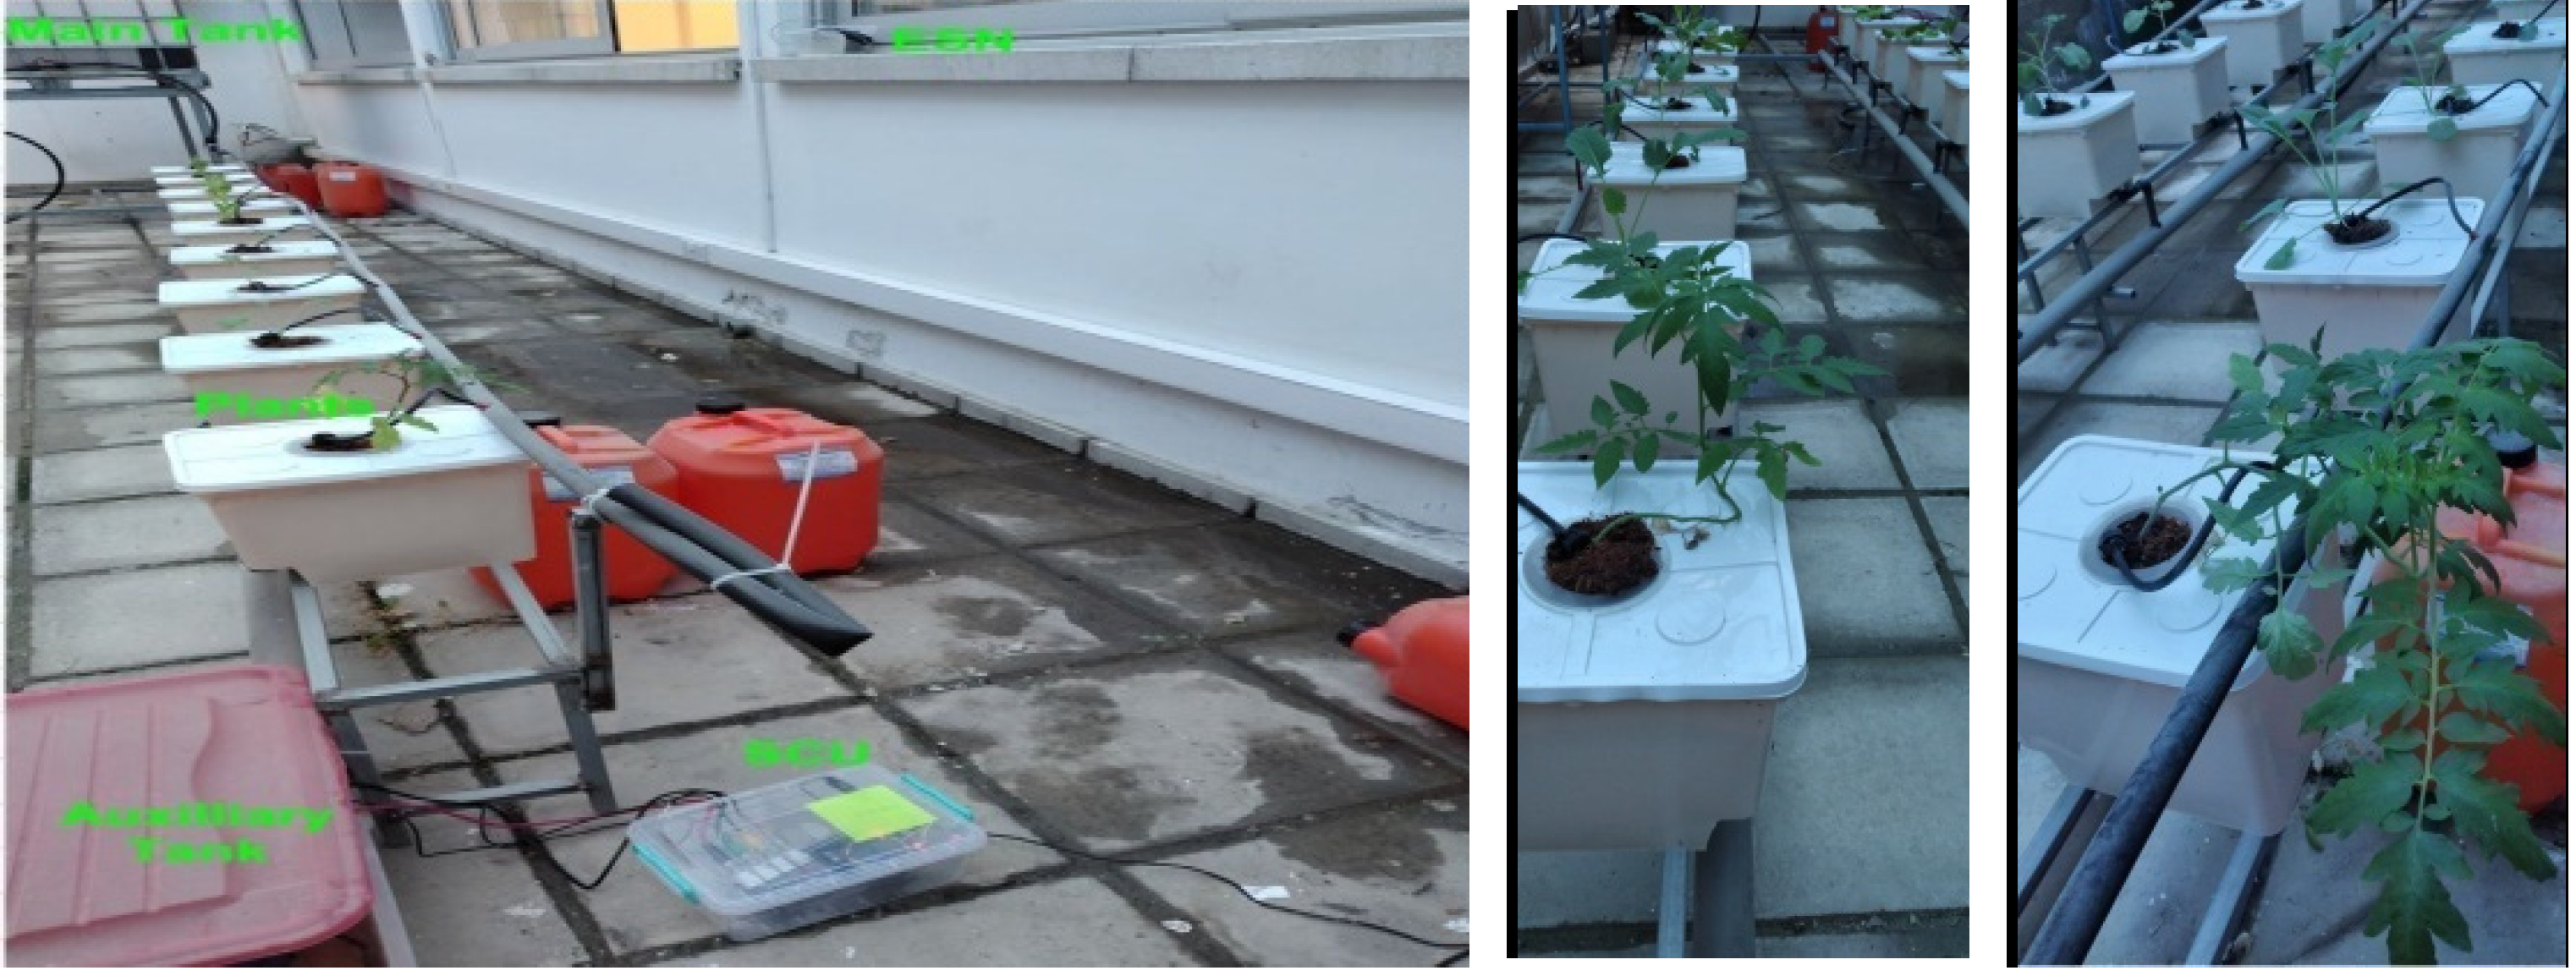
Figure 5 shows an SCU prototype.
The maximum power (last entry in Table 3) was only consumed when the GSM module is first registered to the network. During normal operation, the SCU slept and consumed 1.25 W while consuming 2.75 W when transmitting data. Therefore, the SCU energy consumption per cycle was
E = 1.25 T + 2.75 t e     ( mJ )
where T is the sleep period and t is the execution time of the main loop (Appendix A). Essentially the sleep mode power was multiplied by the duration of the sleep period and the transmission power was multiplied by the time it took to transmit the data.
The execution time was measured in milliseconds by counting the processor cycles. The execution of the main loop with no ESNs present was 19,170 ms. With one ESN, the main loop execution time was 145,090 ms. Since all ESNs transmitted the same amount of data, the execution time was given by the formula:
t = 19,170 + 125,920 × ESN (ms)
Equation (2) also indirectly defines an upper bound in the sampling rate of the system, depending on the number of ESNs available. However, such a high sampling rate is not required since it takes at least hours for the water quality parameters to significantly change (when plants absorb nutrients) and, at most, days when most nutrients have been absorbed.

3.2. Environment Sensing Node (ESN)

Environment sensing nodes are slave nodes that are responsible for monitoring greenhouse environmental conditions, such as the ambient temperature and humidity. The necessity behind the ESNs is that abnormal temperature and humidity could imply a hazard, such as a fire. Therefore, the temperature is monitored every few minutes, but temperature and humidity readings are permanently stored on an hourly basis in an SD card. The ESN is interrupted by the SCU and then transmits the data to the SCU using Zigbee unless there is an alarm (high temperature), in which case, the ESN does not wait for an interrupt. This allows for effective monitoring of the greenhouse environment while minimizing data transmission and, therefore, power consumption. The number of ESNs present in each greenhouse is dependent on the greenhouse dimensions. Each ESN has its own ID number and Zigbee address. Figure 6 depicts the schematic diagram of the ESN circuit.
The ESN initialization procedure includes initializing the serial and SPI communication (Figure 7) and verifying the connection to all modules. After initialization, the ESN awakes on fixed intervals to collect the ambient temperature and humidity readings and record them on the SD card. If no abnormal readings are present, the ESN remains asleep until interrupted by the SCU when it is time for data collection. On the occurrence of the abnormal readings, the ESN interrupts the SCU with a Zigbee packet payload “Alarm_Interrupt_XX”. The “XX” is a code representing either “FIRE” or “Connection” to distinguish whether the alarm is due to high temperature due to a possible fire in the greenhouse or just a connection problem.
The ESN power consumption in sleep mode was approximately 0.4 W compared with approximately 0.55 W during data transmission. However, as mentioned earlier in the SCU subsection (Section 3.1), the transmission only occurs a few times a day, unless there is an alarm. In both modes, the Xbee module stays active as it is an end device to be interrupted by the SCU.

3.3. Greenhouse Security Node (GSN)

As discussed in Section 2, the GSN was developed as a rudimentary security node and is not essential for the operation of the iPONICS system. It comprises a microcontroller with a motion sensor, camera, SD card and Zigbee transmitter/receiver. The reason such a node may be used is that a greenhouse could be in an isolated area, and we wish to prevent unauthorized entry. It is not meant to be a robust security solution, merely a low-cost warning system. The node spends the majority of time sleeping to conserve energy under normal circumstances. It is woken up by an external interrupt from the motion sensor, in which case, it activates the camera to take pictures and sends an alarm to the SCU through Zigbee. In the case of an authorized user accessing the system, the RFID is used to cancel the alarm. GSNs can also be deactivated and reactivated when receiving a command from the SCU. The microcontroller used for the implementation of the GSN was Arduino UNO, similar to the ESN. Figure 8 depicts the schematic diagram of the node’s circuitry.
Figure 9 shows a flowchart of the GSN operation. As shown in Figure 9, the node starts by initializing the I2C and SPI communications and ensures proper wiring of the modules. Then, the node falls into sleep mode and remains in that state until motion is detected. After such an event, the node expects an authorized ID tag swap. If no such verification of the identity of the user occurs in the next few seconds, the GSN interrupts the SCU and signals a “Security_Interrupt” inside the first payload, followed by the images that are data captured by the node. The GSN draws power of about 0.53 W in sleep mode and about 0.68 W during transmission depending on the distance from the SCU.

3.4. SCU Fuzzy Inference Engine

An important novelty of the iPONICS method is the SCU FIE [26]. We describe here the design of the control algorithm separately from the rest of the SCU for clarity. There are several reasons for using FLC in iPONICS. First, we have to manage imprecision from sensor errors. Second, the ideal values for pH and electrical conductivity vary slightly between plants (Table 1), and we can accommodate several crops with the same controller by fuzzifying the inputs.
The architecture of the FIE is shown in Figure 10. It accepts three inputs: pH, EC and power supply voltage level. Since the power supply is from the battery being charged by a solar cell, the voltage level reflects the battery level according to the voltage/charge curve. The DO and water temperature are not used for two reasons: first, they are not documented in the literature to have a significant effect on efficient hydroponic culture, and second, using five or six outputs would require a large number of rules, most of which would be redundant. The FIE determines the irrigation duration based on the critical hydroponic parameters and the available energy. The general premise behind the knowledge base of the proposed scheme is to provide the available nutrients to the plants while being conservative with watering when energy and nutrients are low.
According to hydroponics guidelines, the irrigation duration is given as follows [21]:
t i = Q × 3600 m × q   ( sec onds )
where t i : irrigation duration in seconds, Q: irrigation dose (lt/bucket), m: number of drip lines per bucket and q: drip emission (lt/h) (Appendix A). We applied this formula as our baseline duration to determine our fuzzy set membership functions.
The rationale behind using FLC for controlling the pump stems from the use of an expert system based on linguistic if–then rules for the pump on/off duration, coupled with inherent uncertainty and errors in sensor readings and different parameters for different crops. The above constitute fuzzy modeling as an ideal fit for the proposed system. By abstracting the inputs and outputs using fuzzy sets, more robust control can be achieved.
Figure 11 shows the fuzzy membership functions. In order to maintain computational simplicity, we selected trapezoidal and triangular membership functions in the proposed control scheme to describe the linguistic values of the fuzzy input and output variables. The amount of overlap between the membership functions areas was chosen to have at most two membership functions overlapping; thus, we will never have more than six rules activated at a given time. This offers computational simplicity in the implementation of the proposed scheme, which was a design objective. Furthermore, it does not make intuitive sense to have a parameter such as pH being considered as both high and low according to hydroponics guidelines. The EC and pH membership functions were determined based on hydroponics guidelines, while the voltage was based on extending battery life. The irrigation duration membership functions were based on multiples of the baseline irrigation duration from Equation (3). In the case of clearly erroneous sensor values (Section 4.2), the values are not fed to the FIE; instead, the last valid values are used. If the pH and EC values seem correct they are fed to the FIE and the last valid values are updated for the next sensor reading.
The fuzzy rule base was determined based on hydroponics guidelines. As mentioned, three inputs are used, with three membership functions per input. Therefore, there are a total of 33 = 27 rules. The rules were determined empirically according to the principle that when conditions are ideal, the irrigation period is the one determined by Equation (3). When conditions are suboptimal, especially when the input voltage is low, indicating the battery is discharged, the irrigation duration is shortened in order to conserve energy. When EC and pH indicate that there are few nutrients to be absorbed, then the irrigation period is also shortened. The forms of the rules with some indicative cases are shown in Table 4.
The execution time of the FIE was measured to be 3326 ms, which is included in the SCU main loop execution time reported in Section 3.1.

4. Deployment and Evaluation

4.1. System Deployment

The iPONICS system was operated in a lab environment for over a year (Figure 12) and was installed in a pilot hydroponics greenhouse in order to grow crops. The monitoring website is shown in Figure 13. The ubidots platform was used to upload the data, and our application was built using an API to transfer the data in .csv format and display them. The application was built using javascript, css and html. The user can monitor multiple greenhouses at a glance. It provides a dashboard for monitoring the water quality and a sidebar for alerts and warnings, such as sensor and SD card errors. The user can generate temperature, humidity, pH, EC, DO and water temperature graphs created using the D3.js library, with the default being the past 24 h. The water quality sensor readings are also shown as doughnut graphs that are color-coded the same way as the sensors (Figure 13) for ease of monitoring.

4.2. Preliminary Reliability Analysis

Since the above components are meant to operate continuously in greenhouse conditions for long periods in order to grow crops, we aimed to analyze their reliability at as early a stage as possible. We performed preliminary reliability analysis based on the errors and failures observed since they were operational, both in laboratory and greenhouse conditions. Reliability analysis was important in the iPONICS system because electronic failures could lead to crop failure, as well as a waste of energy and water.
We performed the analysis on the SCU and ESN nodes since the GSN nodes operated infrequently and were aimed at outside threats, which are irrelevant to the plant growth process. The central role of the SCU makes it the most critical unit in the subsystem. The ESN nodes have redundancy that allows fault tolerance, while there is a single SCU in each GHU. We had two SCUs and four ESNs operate continuously for close to 1000 h. Using that continuous operation as a basis, we observed errors and measured the mean time between them (MTBF). The errors are summarized in Table 5. They can be categorized as follows.
  • Sensor errors—Generally, sensor errors can be divided into two main categories: hard failure (complete failure) and soft failure, such as bias, drift and outliers [27]. We observed no hard failures, but we observed both drift and outliers.
  • Transmission errors—We noticed occasional GPRS transmission failures. Some were corrected by retransmission and we added automatic retries that generally solved the problem, but there was one occasion that required manual intervention by communicating with the internet service provider in order to be resolved.
Since the system remains on all the time but sampling and transmission are done with a specific sampling rate, we used two approaches to model the system reliability. Specifically, we use a Poisson distribution assuming λ is equal to the MTBF:
P ( n ) = e λ t ( λ t ) n n !
Regarding sensor errors, we also use a binomial distribution with a failure probability equal to the error rate:
P ( X = n ) = ( N n ) p n ( 1 p ) N n
We noticed that when the sampling rate was constant, the two distributions yielded identical results, which is to be expected as the Poisson distribution is a limiting case of a binomial distribution when the number of trials is large and the probability is small [28], which holds for our case (Table 6, column 2). We estimated the probability that there will be zero errors during a day at the highest sampling rate (no error events in all 24 samples), as well as the probability that there will be an error event in all samples in that day at a low sampling rate (4 samples/day). We were particularly interested in the case when there were errors in all pH and EC measurements since it is then impossible to monitor the system, as well as correctly decide on the irrigation duration.
As shown in the table above, the probability of single or multiple errors, including transmission errors, at the lowest sampling rate (worst case) was less than 7 in 100,000 or about 1 in 39 years, which is longer than the expected lifetime of the system. Furthermore, the probability that there will be only erroneous measurements in either pH or EC was less than the sum of respective probabilities since the events were not disjointed, which was only approximately 1 in 200,000.

5. Conclusions and Future Work

A novel hydroponics monitoring and control system based on IoT technologies was introduced. In particular, the system is composed of a specialized wireless sensor network for monitoring the essential parameters for hydroponics and control for the pump. It provides the greenhouse keeper with a user-friendly web-based tool to monitor their crops, as well as alarms and warnings, allowing for the observation of multiple greenhouses with minimal effort and need for intervention.
Our future work will focus on two directions. First, further reliability analysis by forcing errors and stress testing the system and, second, data analytics. Specifically, we are interested in predicting nutrient values based on the original concentrations and the water quality sensor values. In general, monitoring specific nutrients is a challenging problem for both terrestrial and space applications, even though several technologies exist [29]. Most of these technologies require costs that may be prohibitive to small-scale farmers, who often add nutrients empirically. This could lead to either plants being starved for nutrients or reaching toxic levels of nutrient absorption. For now, we are using specialized nutrient monitoring equipment [30] to obtain data points daily, as shown in Figure 14. Generally, EC is the aggregate of all ions in the plant nutrient solution. The nutrients are added to the water (day 1), increasing EC, and they are gradually absorbed, typically within 24 h. While the general trend is clearly visible in Figure 14, the individual nutrient absorption depends on the pH, the presence of competing nutrients, as well as other factors. The ion-specific electrode used requires frequent (daily) recalibration, limiting the ability to be used remotely. Accurately predicting the nutrient values only from the SCU readings would save the cost of such expensive equipment, as well as the need for recalibration, while protecting from possible empirical errors. It can also be used to lower the SCU sampling rate to conserve energy, even if it increases the probability of erroneous measurements. We are currently exploring our obtained data using machine learning models. At the time of this writing, given the low data rate since the nutrient values do not change rapidly and the fact that EC reflects the aggregate of all nutrients and is expected to be highly linear, we are exploring a simple regression model, but this is still under investigation.

Author Contributions

Conceptualization, K.T. and A.A.; Funding acquisition, K.T. and A.A.; Project administration, A.A.; Software, A.A.-Z. and C.Z.; Supervision, K.T.; Validation, A.A.-Z., N.C., M.C. and S.P.; Writing—review and editing, K.T. All authors have read and agreed to the published version of the manuscript.

Funding

This research was funded by the European Regional Development Fund and the Republic of Cyprus through the Research and Innovation Foundation (Project: START-UPS/ 0618/48 project title: “iPONICS: Smart Off-Grid System for Sustainable Hydroponics”.

Institutional Review Board Statement

Not applicable.

Informed Consent Statement

Not applicable.

Data Availability Statement

Not applicable.

Conflicts of Interest

The authors declare no conflict of interest.

Abbreviations

The following abbreviations are used in this manuscript:
ICTInformation and communication technology
ECElectrical conductivity
FIEFuzzy inference engine
FLCFuzzy logic control
MTBFMean time between failures
GHUGreenhouse unit

Appendix A

Table A1. Mathematical symbols used.
SymbolMeaningUnit(s)
TSleep duration, roughly equal to sleep periodms
t e Main loop execution timems
EEnergy consumptionmJ
t i . Irrigation durations
Q irrigation doselt
mNumber of drip lines per bucket
qDrip emission lt/h
λError rateerrors/h
tSystem operation timeh
nNumber of errors
NNumber of samples
PError/failure probability

References

  1. Peters, N.E.; Meybeck, M. Water Quality Degradation Effects on Freshwater Availability: Impacts of Human Activities. Water Int. 2000, 25, 185–193. [Google Scholar] [CrossRef]
  2. Khatri, N.; Tyagi, S. Influences of natural and anthropogenic factors on surface and groundwater quality in rural and urban areas. All Life 2015, 8, 23–39. [Google Scholar] [CrossRef]
  3. Atlas Scientific: Environmental Robotics. Available online: https://www.atlas-scientific.com/ (accessed on 28 November 2020).
  4. Available online: http://www.libelium.com/products/waspmote/ (accessed on 28 November 2020).
  5. Verdouw, C.; Wolfert, S.; Tekinerdogan, B. Internet of Things in agriculture. CAB Rev. Perspect. Agric. Vet. Sci. 2016, 11, 1–12. [Google Scholar] [CrossRef]
  6. Tzounis, A.; Katsoulas, N.; Bartzanas, T.; Kittas, C. Internet of Things in agriculture, recent advances and future challenges. Biosyst. Eng. 2017, 164, 31–48. [Google Scholar] [CrossRef]
  7. Wang, J.; Yang, Y.; Wang, T.; Sherratt, R.; Zhang, J. Big Data Service Architecture: A Survey. J. Internet Technol. 2020, 21, 393–405. [Google Scholar]
  8. Wang, J.; Chen, W.; Wang, L.; Sherratt, R.; Alfarraj, O.; Tolba, A. Data Secure Storage Mechanism of Sensor Networks Based on Blockchain. Comput. Mater. Contin. 2020, 65, 2365–2384. [Google Scholar] [CrossRef]
  9. Zhang, J.; Yang, K.; Xiang, L.; Luo, Y.; Xiong, B.; Tang, Q. A Self-Adaptive Regression-Based Multivariate Data Compression Scheme with Error Bound in Wireless Sensor Networks. Int. J. Distrib. Sens. Networks 2013, 9. [Google Scholar] [CrossRef]
  10. Wang, Q.; Yang, C.; Wang, Y.; Wu, S. Application of low cost integrated navigation system in precision agriculture. Intell. Autom. Soft Comput. 2020, 26, 1433–1442. [Google Scholar] [CrossRef]
  11. Liao, M.; Chen, S.; Chou, C.; Chen, H.; Yeh, S.; Chang, Y.; Jiang, J. On precisely relating the growth of Phalaenopsis leaves to greenhouse environmental factors by using an IoT-based monitoring system. Comput. Electron. Agric. 2017, 136, 125–139. [Google Scholar] [CrossRef]
  12. Codeluppi, G.; Cilfone, A.; Davoli, L.; Ferrari, G. LoRaFarM: A LoRaWAN-Based Smart Farming Modular IoT Architecture. Sensors 2020, 20, 2028. [Google Scholar] [CrossRef] [PubMed] [Green Version]
  13. Rajalakshmi, P.; Devi Mahalakshmi, S. IOT based crop-field monitoring and irrigation automation. In Proceedings of the 10th International Conference on Intelligent Systems and Control (ISCO), Coimbatore, India, 7–8 January 2016. [Google Scholar]
  14. Danita, M.; Blessy, M.; Nithila, S.; Namrata, S.; Paul, J. IoT Based Automated Greenhouse Monitoring System. In Proceedings of the Second International Conference on Intelligent Computing and Control Systems (ICICCS), Madurai, India, 14–15 June 2018. [Google Scholar]
  15. Sofwan, A.; Sumardi, S.; Ahmada, A.; Ibrahim, I.; Budiraharjo, K.; Karno, K. Smart Greetthings: Smart Greenhouse Based on Internet of Things for Environmental Engineering. In Proceedings of the International Conference on Smart Technology and Applications (ICoSTA), Surabaya, Indonesia, 20 February 2020. [Google Scholar]
  16. Trilles, S.; Torres-Sospedra, J.; Belmonte, Ó.; Zarazaga-Soria, F.; González-Pérez, A.; Huerta, J. Development of an open sensorized platform in a smart agriculture context: A vineyard support system for monitoring mildew disease. SUSCOM 2020, 28, 100309. [Google Scholar] [CrossRef]
  17. Tatas, K.; Chrysostomou, C. Hardware Implementation of Dynamic Fuzzy Logic Based Routing in Network-on-Chip. MICPRO 2017, 52, 80–88. [Google Scholar] [CrossRef]
  18. Al-Zoubi, A.; Tatas, K.; Kyriacou, C. Fuzzy classification of OpenCL programs targeting heterogeneous systems. JIFS 2020, 39, 7189–7202. [Google Scholar] [CrossRef]
  19. Al-Zoubi, A.; Tatas, K.; Kyriacou, C. Towards Dynamic Multi-task Schedulling of OpenCL Programs on Emerging CPU-GPU-FPGA Heterogeneous Platforms: A Fuzzy Logic Approach. In Proceedings of the 10th IEEE International Conference on Cloud Computing Technology and Science (CloudCom), Nicosia, Cyprus, 10–13 December 2018; pp. 247–250. [Google Scholar]
  20. Douglas, J. Advanced Guide to Hydroponics: (Soilless Cultivation), 2nd ed.; Pelham Books: London, UK, 1986. [Google Scholar]
  21. Atlas Scientific, Lab Grade pH Probe. Available online: https://atlas-scientific.com/files/pH_probe.pdf (accessed on 28 November 2020).
  22. Atlas Scientific, PT-1000 Temperature Probe. Available online: https://atlas-scientific.com/files/PT-1000-probe.pdf/ (accessed on 28 November 2020).
  23. Atlas Scientific, Lab Grade D.O. Probe. Available online: https://atlas-scientific.com/files/LG_DO_probe.pdf/ (accessed on 28 November 2020).
  24. Atlas Scientific, Conductivity Probe K 1.0. Available online: https://atlas-scientific.com/files/EC_K_1.0_probe.pdf/ (accessed on 28 November 2020).
  25. Atlas Scientific, Tentacle Shield. Available online: https://atlas-scientific.com/tentacle-t1/ (accessed on 28 November 2020).
  26. Ross, T.J. Fuzzy Logic with Engineering Applications, 4th ed.; John Wiley & Sons: Chichester, UK, 2016. [Google Scholar]
  27. Alippi, C. Fault Diagnosis Systems. In Intelligence of Embedded Systems; Springer: Cham, Switzerland, 2014. [Google Scholar]
  28. Pishro-Nik, H. Introduction to Probability, Statistics, and Random Processes; Kappa Research LLC: Montgomery, PA, USA, 2014; Available online: https://www.probabilitycourse.com (accessed on 28 November 2020).
  29. Bamsey, M.; Graham, T.; Thompson, C.; Berinstain, A.; Scott, A.; Dixon, M. Ion-Specific Nutrient Management in Closed Systems: The Necessity for Ion-Selective Sensors in Terrestrial and Space-Based Agriculture and Water Management Systems. Sensors 2012, 12, 13349–13392. [Google Scholar] [CrossRef] [PubMed]
  30. CleanGrow Nutrients. Available online: https://www.ionselectiveelectrode.com/pages/userguides (accessed on 28 November 2020).
Figure 1. iPONICS system concept.
Technologies 10 00026 g001
Figure 2. iPONICS WSN topology.
Technologies 10 00026 g002
Figure 3. Sense and control unit annotated schematic diagram.
Technologies 10 00026 g003
Figure 4. SCU flowchart.
Technologies 10 00026 g004
Figure 5. SCU early prototype.
Technologies 10 00026 g005
Figure 6. Environment sensing node annotated schematic diagram.
Technologies 10 00026 g006
Figure 7. ESN flowchart.
Technologies 10 00026 g007
Figure 8. Greenhouse security node annotated schematic diagram.
Technologies 10 00026 g008
Figure 9. GSN flowchart.
Technologies 10 00026 g009
Figure 10. Fuzzy inference engine architecture.
Technologies 10 00026 g010
Figure 11. Fuzzy membership functions.
Technologies 10 00026 g011
Figure 12. iPONICS system deployed in lab conditions.
Technologies 10 00026 g012
Figure 13. iPONICS monitoring page.
Technologies 10 00026 g013
Figure 14. pH, EC and concentrations of various nutrients during a typical nutrient cycle: before nutrients are added or replenished (day 0) and after (day 1). Most nutrients are absorbed within one day (by day 2), depending on the pH.
Technologies 10 00026 g014
Table 1. Crops’ ideal pH and electrical conductivity values [21].
CropsEC (mS/cm)pH
Tomato2.0–4.06.0–6.5
Cucumber1.7–2.05.0–5.5
Strawberry1.8–2.26.0
Banana1.8–2.25.5–6.5
Spinach1.8–2.36.0–7.0
Asparagus1.4–1.86.0–6.8
Table 2. iPONICS system requirements.
RequirementSampling PeriodAlarm/WarningAction
Monitor water quality (pH, temperature, EC, DO)Adaptive, at least dailyWarning depending on cropsAutomatically adapt irrigation duration
Monitor ambient temperature8 s, record hourlyAlert (possible fire), SMSSystem halt
Monitor ambient humidityHourlyWarning depending on cropsUser intervention
Detect unauthorized entryEvent driven (interrupt)Alert on server, SMSUser intervention
Put nodes to sleep to conserve energyN/AN/AN/A
Table 3. SCU power ratings.
StateCurrent (A)Power (W)
Sleep_mode0.2501.25
Idle0.2701.35
Transmission_idle0.5502.75
Transmission_extreme2.30011.5
Table 4. Fuzzy rule structure with examples.
pHECV t i
LOWLOWLOWVERY SHORT
LOWLOWMEDIUMSHORT
MEDIUMLOWHIGHSHORT
MEDIUMMEDIUMHIGHLONG
HIGHHIGHHIGHSHORT
Table 5. Error summary.
UnitError TypeMTBFRedundancyRecovery
SCUSensor error3.5 daysYes (on water temperature)Automatic (usually on next measurement)
Transmission failure (transient)40 daysNoAutomatic (retransmission)
Transmission failure
(requires intervention)
180 daysNoManual
Drift (pH sensor)N/ANoManual (recalibration)
ESNSensor error15 daysYesAutomatic (usually on next measurement)
Table 6. SCU error analysis.
Sensor ErrorError ProbabilityProbability of No Errors in One Day (24 Samples) Probability of Only Errors in One Day (4 Samples)
Any single/multiple error0.93%80%6.82211E-5
pH0.40%98.4%2.51071E-6
EC0.41%98.3%2.76579E-6
Transmission0.1%99.6%1.04155E-6
Publisher’s Note: MDPI stays neutral with regard to jurisdictional claims in published maps and institutional affiliations.

